Graph Icon
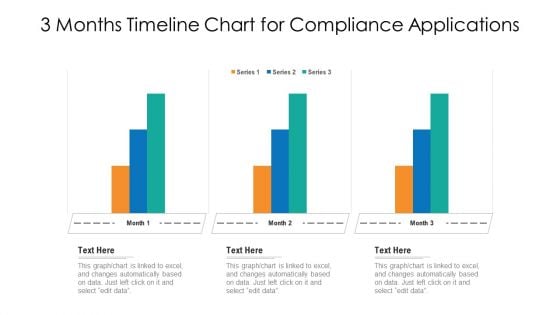
3 Months Timeline Chart For Compliance Applications Ppt PowerPoint Presentation File Professional PDF
Showcasing this set of slides titled 3 months timeline chart for compliance applications ppt powerpoint presentation file professional pdf. The topics addressed in these templates are 3 months timeline chart for compliance applications. All the content presented in this PPT design is completely editable. Download it and make adjustments in color, background, font etc. as per your unique business setting.
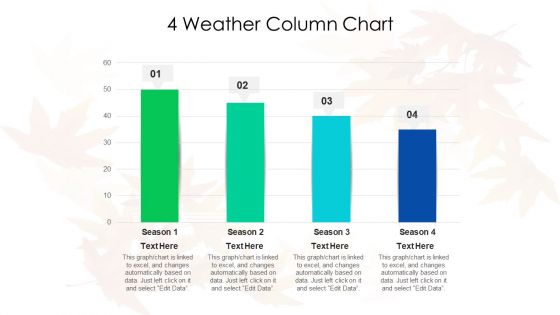
4 Weather Column Chart Ppt PowerPoint Presentation Gallery Design Ideas PDF
Showcasing this set of slides titled 4 weather column chart ppt powerpoint presentation gallery design ideas pdf. The topics addressed in these templates are 4 weather column chart. All the content presented in this PPT design is completely editable. Download it and make adjustments in color, background, font etc. as per your unique business setting.
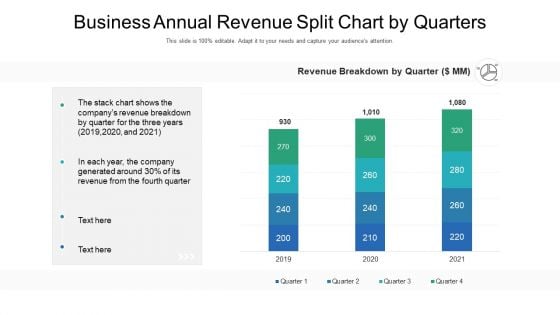
Business Annual Revenue Split Chart By Quarters Ppt PowerPoint Presentation Background Image PDF
Pitch your topic with ease and precision using this business annual revenue split chart by quarters ppt powerpoint presentation background image pdf. This layout presents information on business annual revenue split chart by quarters. It is also available for immediate download and adjustment. So, changes can be made in the color, design, graphics or any other component to create a unique layout.
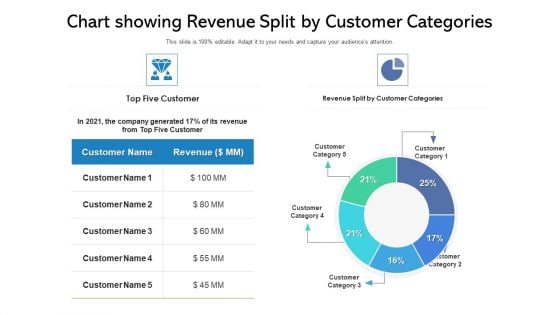
Chart Showing Revenue Split By Customer Categories Ppt PowerPoint Presentation Show Smartart PDF
Pitch your topic with ease and precision using this chart showing revenue split by customer categories ppt powerpoint presentation show smartart pdf. This layout presents information on chart showing revenue split by customer categories. It is also available for immediate download and adjustment. So, changes can be made in the color, design, graphics or any other component to create a unique layout.
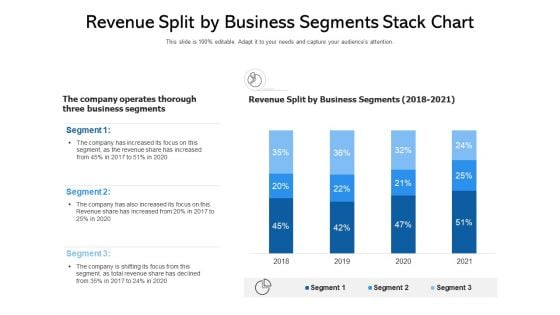
Revenue Split By Business Segments Stack Chart Ppt PowerPoint Presentation Ideas Sample PDF
Pitch your topic with ease and precision using this revenue split by business segments stack chart ppt powerpoint presentation ideas sample pdf. This layout presents information on revenue split by business segments stack chart. It is also available for immediate download and adjustment. So, changes can be made in the color, design, graphics or any other component to create a unique layout.
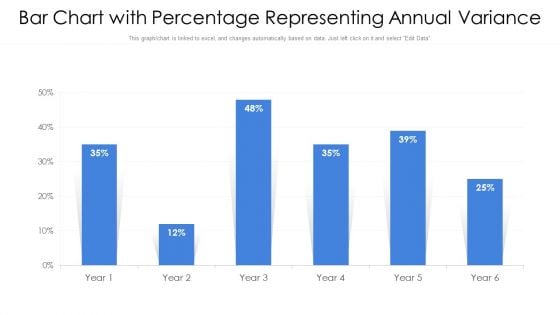
Bar Chart With Percentage Representing Annual Variance Ppt PowerPoint Presentation Gallery Portfolio PDF
Pitch your topic with ease and precision using this bar chart with percentage representing annual variance ppt powerpoint presentation gallery portfolio pdf. This layout presents information on bar chart with percentage representing annual variance. It is also available for immediate download and adjustment. So, changes can be made in the color, design, graphics or any other component to create a unique layout.
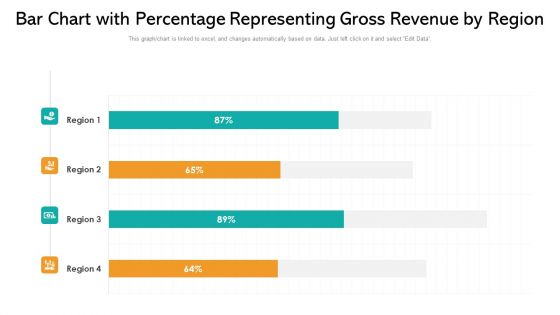
Bar Chart With Percentage Representing Gross Revenue By Region Ppt PowerPoint Presentation File Topics PDF
Showcasing this set of slides titled bar chart with percentage representing gross revenue by region ppt powerpoint presentation file topics pdf. The topics addressed in these templates are bar chart with percentage representing gross revenue by region. All the content presented in this PPT design is completely editable. Download it and make adjustments in color, background, font etc. as per your unique business setting.

Bar Chart With Percentage Representing Inventory Ppt PowerPoint Presentation File Outfit PDF
Pitch your topic with ease and precision using this bar chart with percentage representing inventory ppt powerpoint presentation file outfit pdf. This layout presents information on bar chart with percentage representing inventory. It is also available for immediate download and adjustment. So, changes can be made in the color, design, graphics or any other component to create a unique layout.
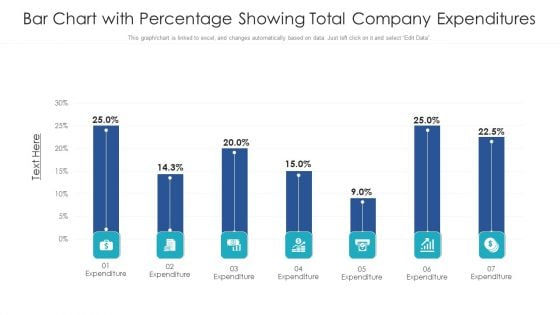
Bar Chart With Percentage Showing Total Company Expenditures Ppt PowerPoint Presentation File Background PDF
Pitch your topic with ease and precision using this bar chart with percentage showing total company expenditures ppt powerpoint presentation file background pdf. This layout presents information on bar chart with percentage showing total company expenditures. It is also available for immediate download and adjustment. So, changes can be made in the color, design, graphics or any other component to create a unique layout.
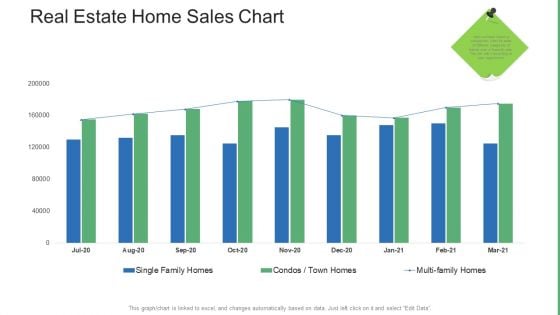
Commercial Property Administration And Advancement Real Estate Home Sales Chart Mockup PDF
Deliver and pitch your topic in the best possible manner with this commercial property administration and advancement real estate home sales chart mockup pdf. Use them to share invaluable insights on real estate home sales chart and impress your audience. This template can be altered and modified as per your expectations. So, grab it now.
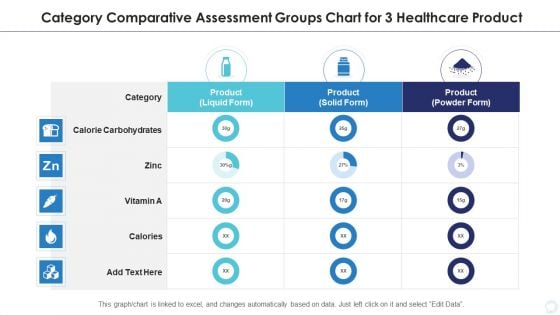
Category Comparative Assessment Groups Chart For 3 Healthcare Product Infographics PDF
Showcasing this set of slides titled category comparative assessment groups chart for 3 healthcare product infographics pdf. The topics addressed in these templates are category comparative assessment groups chart for 3 healthcare product. All the content presented in this PPT design is completely editable. Download it and make adjustments in color, background, font etc. as per your unique business setting.
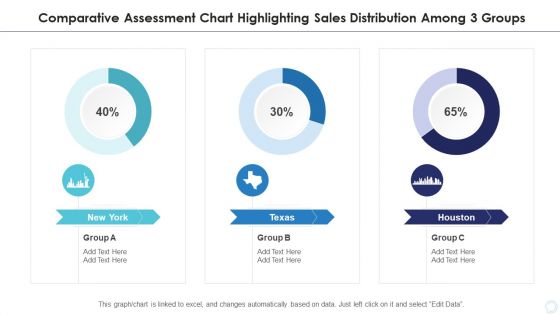
Comparative Assessment Chart Highlighting Sales Distribution Among 3 Groups Designs PDF
Pitch your topic with ease and precision using this comparative assessment chart highlighting sales distribution among 3 groups designs pdf. This layout presents information on comparative assessment chart highlighting sales distribution among 3 groups. It is also available for immediate download and adjustment. So, changes can be made in the color, design, graphics or any other component to create a unique layout.
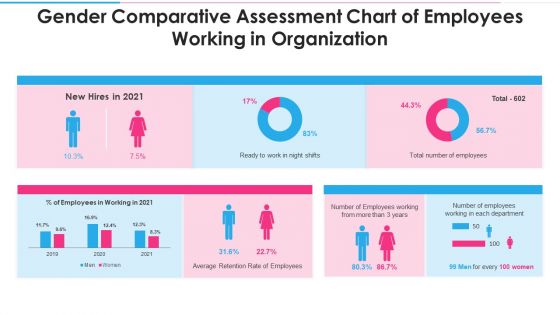
Gender Comparative Assessment Chart Of Employees Working In Organization Structure PDF
Showcasing this set of slides titled gender comparative assessment chart of employees working in organization structure pdf. The topics addressed in these templates are gender comparative assessment chart of employees working in organization. All the content presented in this PPT design is completely editable. Download it and make adjustments in color, background, font etc. as per your unique business setting.
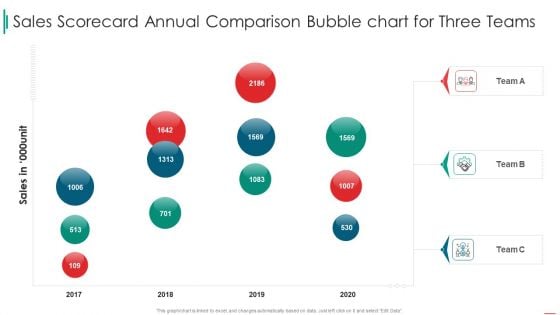
Sales Rep Scorecard Sales Scorecard Annual Comparison Bubble Chart For Three Teams Designs PDF
Deliver and pitch your topic in the best possible manner with this sales rep scorecard sales scorecard annual comparison bubble chart for three teams designs pdf. Use them to share invaluable insights on sales scorecard annual comparison bubble chart for three teams and impress your audience. This template can be altered and modified as per your expectations. So, grab it now.
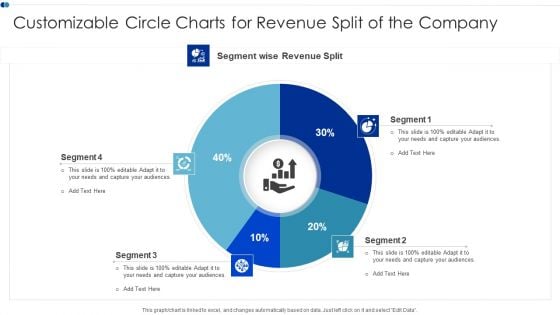
Customizable Circle Charts For Revenue Split Of The Company Graphics PDF
Showcasing this set of slides titled Customizable Circle Charts For Revenue Split Of The Company Graphics PDF The topics addressed in these templates are Customizable Circle, Charts Revenue, Split Company All the content presented in this PPT design is completely editable. Download it and make adjustments in color, background, font etc. as per your unique business setting.
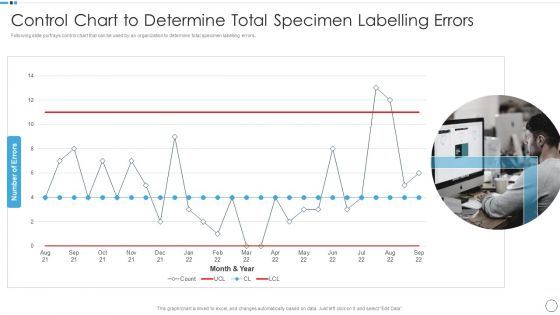
QA Plan Set 1 Control Chart To Determine Total Specimen Labelling Errors Sample PDF
Deliver an awe inspiring pitch with this creative QA Plan Set 1 Control Chart To Determine Total Specimen Labelling Errors Sample PDF bundle. Topics like Control Chart To Determine, Specimen Labelling Errors can be discussed with this completely editable template. It is available for immediate download depending on the needs and requirements of the user.
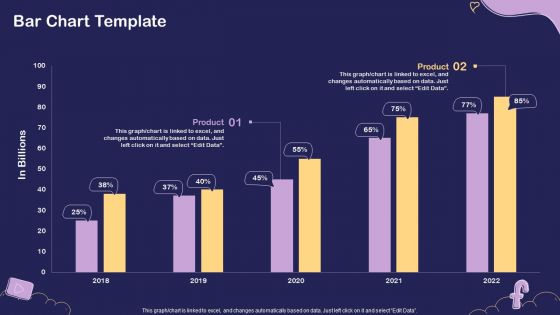
Social Media Hiring For Potential Candidate Bar Chart Template Download PDF
Deliver an awe inspiring pitch with this creative Social Media Hiring For Potential Candidate Bar Chart Template Download PDF bundle. Topics like Bar Chart, 2018 To 2022 can be discussed with this completely editable template. It is available for immediate download depending on the needs and requirements of the user.
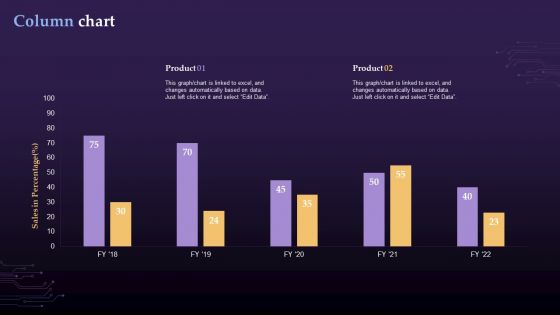
Virtual Currency Investment Guide For Companies Column Chart Ppt Layouts Example File PDF
Deliver and pitch your topic in the best possible manner with this Virtual Currency Investment Guide For Companies Column Chart Ppt Layouts Example File PDF. Use them to share invaluable insights on Column Chart and impress your audience. This template can be altered and modified as per your expectations. So, grab it now.
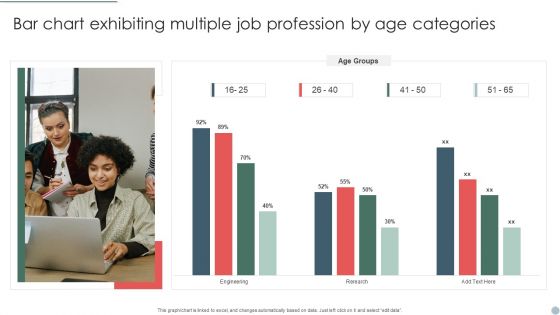
Bar Chart Exhibiting Multiple Job Profession By Age Categories Structure PDF
Showcasing this set of slides titled Bar Chart Exhibiting Multiple Job Profession By Age Categories Structure PDF. The topics addressed in these templates are Bar Chart Exhibiting, Multiple Job Profession, Age Categories. All the content presented in this PPT design is completely editable. Download it and make adjustments in color, background, font etc. as per your unique business setting.
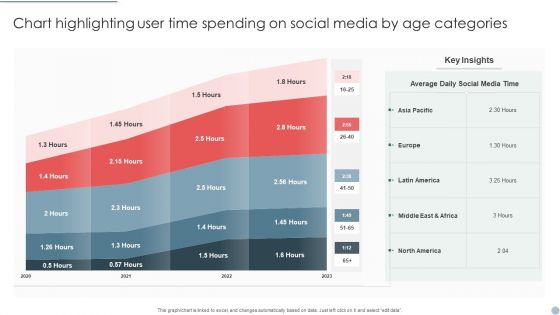
Chart Highlighting User Time Spending On Social Media By Age Categories Elements PDF
Showcasing this set of slides titled Chart Highlighting User Time Spending On Social Media By Age Categories Elements PDF. The topics addressed in these templates are Chart Highlighting User, Time Spending Social Media, Age Categories. All the content presented in this PPT design is completely editable. Download it and make adjustments in color, background, font etc. as per your unique business setting.
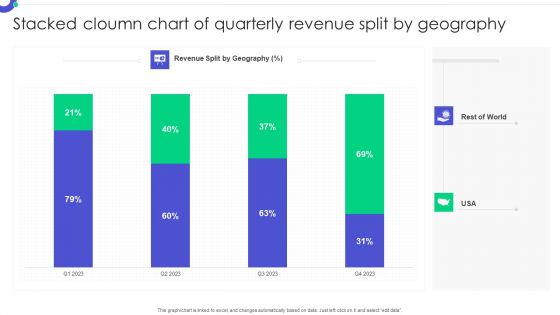
Stacked Cloumn Chart Of Quarterly Revenue Split By Geography Pictures PDF
Pitch your topic with ease and precision using this Stacked Cloumn Chart Of Quarterly Revenue Split By Geography Pictures PDF. This layout presents information on Stacked Column, Chart Quarterly, Revenue Split. It is also available for immediate download and adjustment. So, changes can be made in the color, design, graphics or any other component to create a unique layout.

Stacked Column Chart Of Revenue Split Of Cosmetic Products Mockup PDF
Showcasing this set of slides titled Stacked Column Chart Of Revenue Split Of Cosmetic Products Mockup PDF. The topics addressed in these templates are Stacked Column, Chart Revenue, Split Cosmetic Products. All the content presented in this PPT design is completely editable. Download it and make adjustments in color, background, font etc. as per your unique business setting.
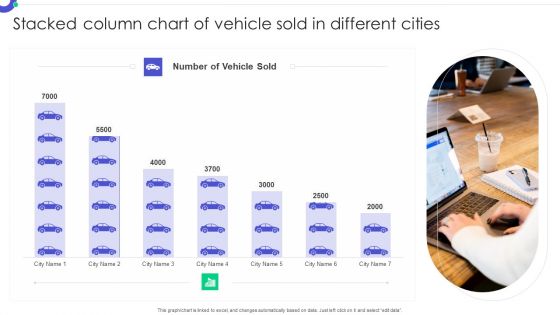
Stacked Column Chart Of Vehicle Sold In Different Cities Formats PDF
Pitch your topic with ease and precision using this Stacked Column Chart Of Vehicle Sold In Different Cities Formats PDF. This layout presents information on Stacked Column, Chart Vehicle, Sold Different Cities. It is also available for immediate download and adjustment. So, changes can be made in the color, design, graphics or any other component to create a unique layout.
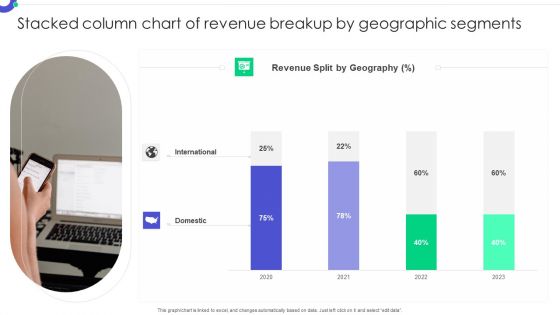
Stacked Column Chart Of Revenue Breakup By Geographic Segments Microsoft PDF
Showcasing this set of slides titled Stacked Column Chart Of Revenue Breakup By Geographic Segments Microsoft PDF. The topics addressed in these templates are Stacked Column, Chart Revenue, Breakup Geographic. All the content presented in this PPT design is completely editable. Download it and make adjustments in color, background, font etc. as per your unique business setting.
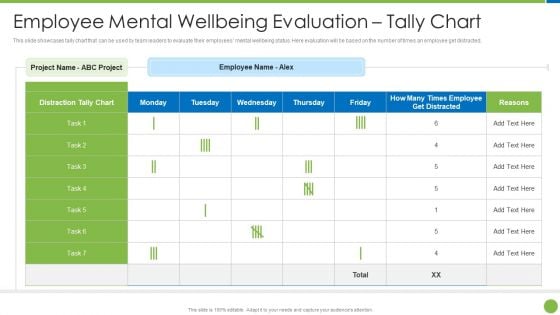
Playbook For Staff Wellbeing Employee Mental Wellbeing Evaluation Tally Chart Pictures PDF
This slide showcases tally chart that can be used by team leaders to evaluate their employees mental wellbeing status. Here evaluation will be based on the number of times an employee get distracted.Deliver an awe inspiring pitch with this creative Playbook For Staff Wellbeing Employee Mental Wellbeing Evaluation Tally Chart Pictures PDF bundle. Topics like Employee Mental Wellbeing Evaluation Tally Chart can be discussed with this completely editable template. It is available for immediate download depending on the needs and requirements of the user.
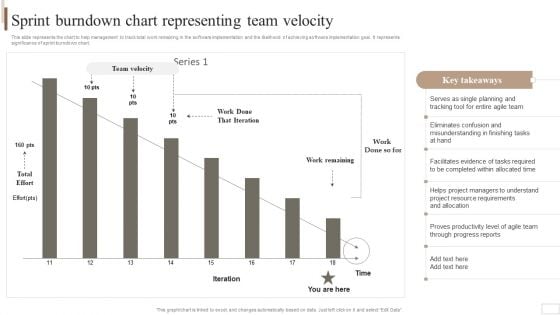
Strategic Plan For Enterprise Sprint Burndown Chart Representing Team Velocity Graphics PDF
This slide represents the chart to help management to track total work remaining in the software implementation and the likelihood of achieving software implementation goal. It represents significance of sprint burndown chart. Want to ace your presentation in front of a live audience Our Strategic Plan For Enterprise Sprint Burndown Chart Representing Team Velocity Graphics PDF can help you do that by engaging all the users towards you.. Slidegeeks experts have put their efforts and expertise into creating these impeccable powerpoint presentations so that you can communicate your ideas clearly. Moreover, all the templates are customizable, and easy-to-edit and downloadable. Use these for both personal and commercial use.
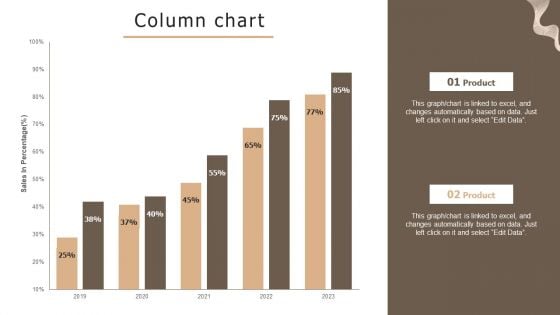
Designing Strategies For Company Growth And Success Column Chart Ideas PDF
If you are looking for a format to display your unique thoughts, then the professionally designed Designing Strategies For Company Growth And Success Column Chart Ideas PDF is the one for you. You can use it as a Google Slides template or a PowerPoint template. Incorporate impressive visuals, symbols, images, and other charts. Modify or reorganize the text boxes as you desire. Experiment with shade schemes and font pairings. Alter, share or cooperate with other people on your work. Download Designing Strategies For Company Growth And Success Column Chart Ideas PDF and find out how to give a successful presentation. Present a perfect display to your team and make your presentation unforgettable.
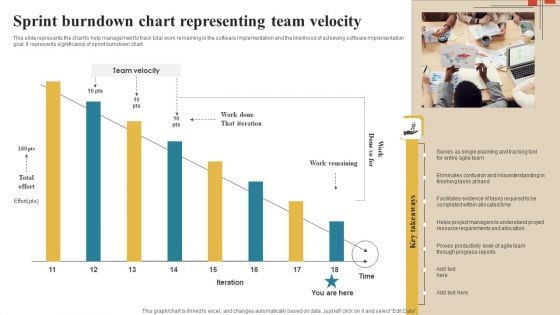
Software Implementation Technique Sprint Burndown Chart Representing Team Velocity Download PDF
This slide represents the chart to help management to track total work remaining in the software implementation and the likelihood of achieving software implementation goal. It represents significance of sprint burndown chart. Here you can discover an assortment of the finest PowerPoint and Google Slides templates. With these templates, you can create presentations for a variety of purposes while simultaneously providing your audience with an eye catching visual experience. Download Software Implementation Technique Sprint Burndown Chart Representing Team Velocity Download PDF to deliver an impeccable presentation. These templates will make your job of preparing presentations much quicker, yet still, maintain a high level of quality. Slidegeeks has experienced researchers who prepare these templates and write high quality content for you. Later on, you can personalize the content by editing the Software Implementation Technique Sprint Burndown Chart Representing Team Velocity Download PDF.
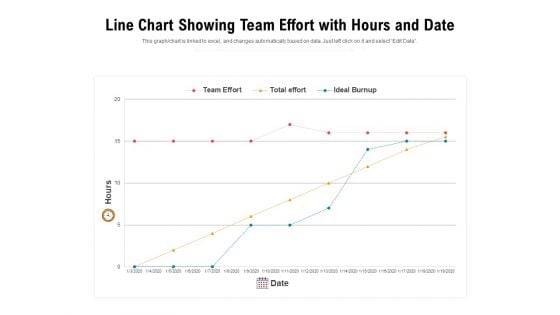
Line Chart Showing Team Effort With Hours And Date Ppt PowerPoint Presentation File Graphic Tips PDF
Pitch your topic with ease and precision using this line chart showing team effort with hours and date ppt powerpoint presentation file graphic tips pdf. This layout presents information on line chart showing team effort with hours and date. It is also available for immediate download and adjustment. So, changes can be made in the color, design, graphics or any other component to create a unique layout.
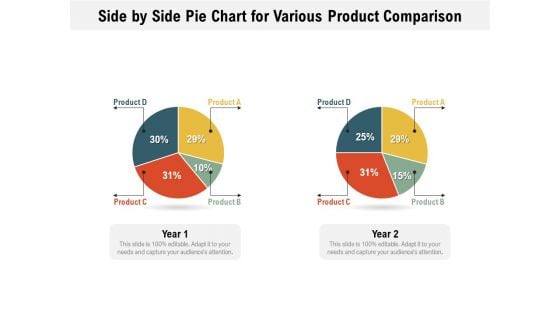
Side By Side Pie Chart For Various Product Comparison Ppt PowerPoint Presentation File Infographics PDF
Pitch your topic with ease and precision using this side by side pie chart for various product comparison ppt powerpoint presentation file infographics pdf. This layout presents information on side by side pie chart for various product comparison. It is also available for immediate download and adjustment. So, changes can be made in the color, design, graphics or any other component to create a unique layout.
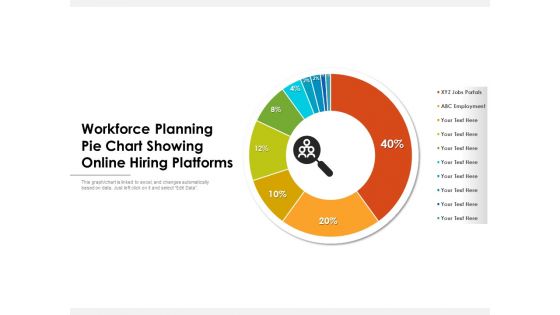
Workforce Planning Pie Chart Showing Online Hiring Platforms Ppt PowerPoint Presentation Inspiration Background Designs PDF
Pitch your topic with ease and precision using this workforce planning pie chart showing online hiring platforms ppt powerpoint presentation inspiration background designs pdf. This layout presents information on workforce planning pie chart showing online hiring platforms. It is also available for immediate download and adjustment. So, changes can be made in the color, design, graphics or any other component to create a unique layout.
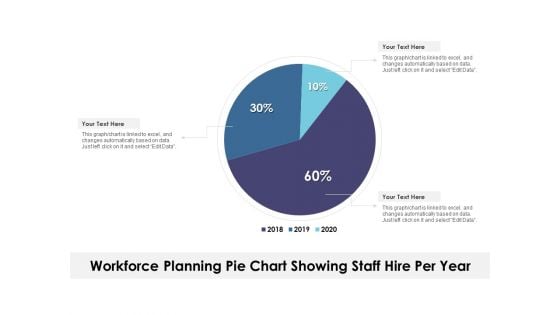
Workforce Planning Pie Chart Showing Staff Hire Per Year Ppt PowerPoint Presentation Show Demonstration PDF
Pitch your topic with ease and precision using this workforce planning pie chart showing staff hire per year ppt powerpoint presentation show demonstration pdf. This layout presents information on workforce planning pie chart showing staff hire per year. It is also available for immediate download and adjustment. So, changes can be made in the color, design, graphics or any other component to create a unique layout.
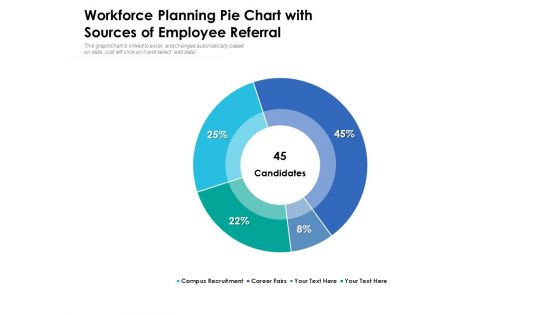
Workforce Planning Pie Chart With Sources Of Employee Referral Ppt PowerPoint Presentation Layouts Picture PDF
Pitch your topic with ease and precision using this workforce planning pie chart with sources of employee referral ppt powerpoint presentation layouts picture pdf. This layout presents information on workforce planning pie chart with sources of employee referral. It is also available for immediate download and adjustment. So, changes can be made in the color, design, graphics or any other component to create a unique layout.

Chart Depicting New Emerging Markets Share With Advanced Economies Ppt PowerPoint Presentation Gallery Design Ideas PDF
Pitch your topic with ease and precision using this chart depicting new emerging markets share with advanced economies ppt powerpoint presentation gallery design ideas pdf. This layout presents information on chart depicting new emerging markets share with advanced economies. It is also available for immediate download and adjustment. So, changes can be made in the color, design, graphics or any other component to create a unique layout.
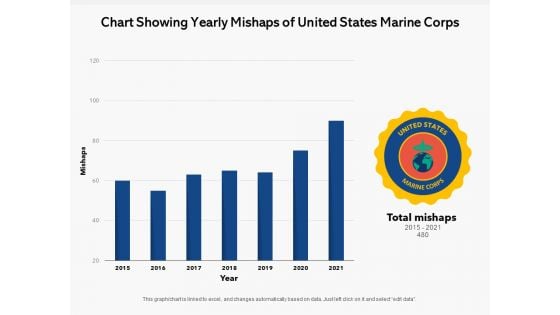
Chart Showing Yearly Mishaps Of United States Marine Corps Ppt PowerPoint Presentation Pictures Master Slide PDF
Showcasing this set of slides titled chart showing yearly mishaps of united states marine corps ppt powerpoint presentation pictures master slide pdf. The topics addressed in these templates are chart showing yearly mishaps of united states marine corps. All the content presented in this PPT design is completely editable. Download it and make adjustments in color, background, font etc. as per your unique business setting.
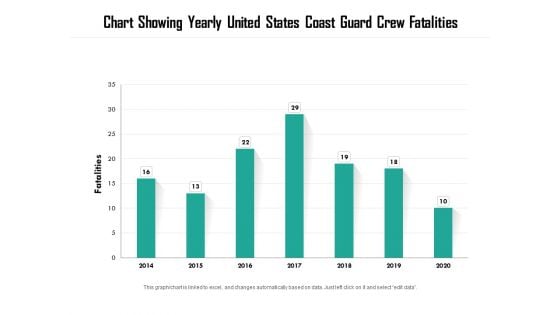
Chart Showing Yearly United States Coast Guard Crew Fatalities Ppt PowerPoint Presentation Inspiration Structure PDF
Pitch your topic with ease and precision using this chart showing yearly united states coast guard crew fatalities ppt powerpoint presentation inspiration structure pdf. This layout presents information on chart showing yearly united states coast guard crew fatalities. It is also available for immediate download and adjustment. So, changes can be made in the color, design, graphics or any other component to create a unique layout.
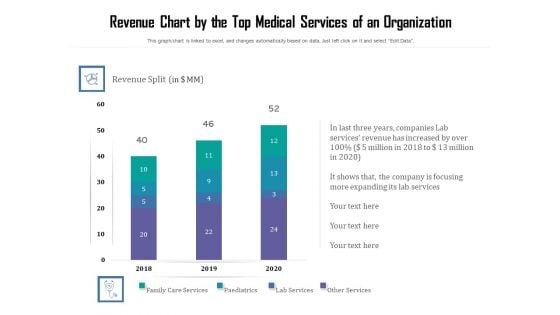
Revenue Chart By The Top Medical Services Of An Organization Ppt PowerPoint Presentation File Slide PDF
Pitch your topic with ease and precision using this revenue chart by the top medical services of an organization ppt powerpoint presentation file slide pdf. This layout presents information on revenue chart by the top medical services of an organization. It is also available for immediate download and adjustment. So, changes can be made in the color, design, graphics or any other component to create a unique layout.
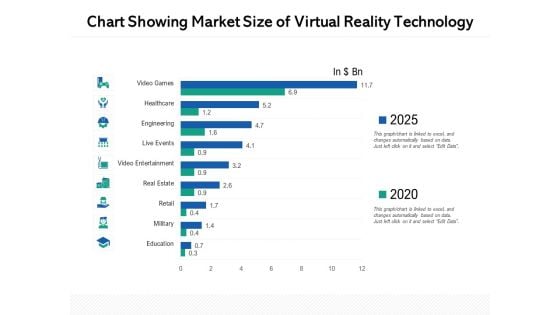
Chart Showing Market Size Of Virtual Reality Technology Ppt PowerPoint Presentation Layouts Graphics Example PDF
Pitch your topic with ease and precision using this chart showing market size of virtual reality technology ppt powerpoint presentation layouts graphics example pdf. This layout presents information on chart showing market size of virtual reality technology. It is also available for immediate download and adjustment. So, changes can be made in the colour, design, graphics or any other component to create a unique layout.
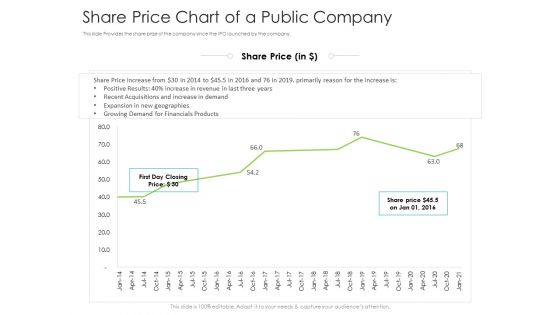
Share Price Chart Of A Public Company Ppt Inspiration Gridlines PDF
This slide Provides the share prize of the company since the IPO launched by the company. Deliver and pitch your topic in the best possible manner with this share price chart of a public company ppt inspiration gridlines pdf. Use them to share invaluable insights on share price chart of a public company and impress your audience. This template can be altered and modified as per your expectations. So, grab it now.
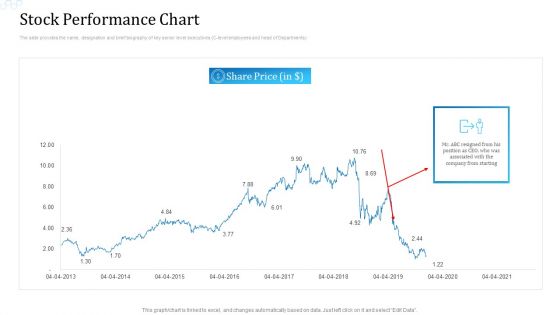
Investor Deck For Procuring Funds From Money Market Stock Performance Chart Designs PDF
The slide provides the name, designation and brief biography of key senior level executives C level employees and head of Departments. Deliver an awe inspiring pitch with this creative investor deck for procuring funds from money market stock performance chart designs pdf bundle. Topics like stock performance chart can be discussed with this completely editable template. It is available for immediate download depending on the needs and requirements of the user.
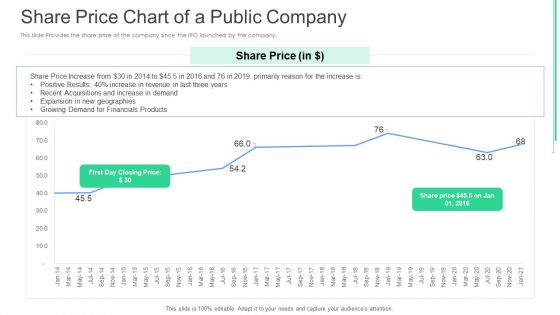
Share Price Chart Of A Public Company Ppt Layouts Graphic Tips PDF
This slide Provides the share prize of the company since the IPO launched by the company. Deliver and pitch your topic in the best possible manner with this share price chart of a public company ppt layouts graphic tips pdf. Use them to share invaluable insights on share price chart of a public company and impress your audience. This template can be altered and modified as per your expectations. So, grab it now.
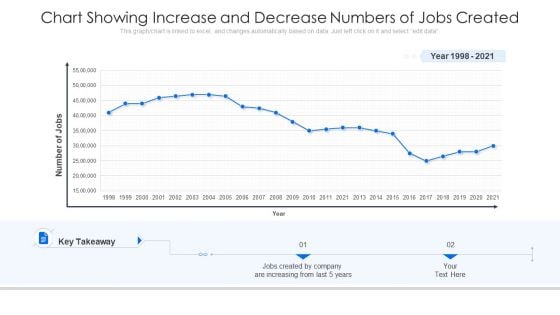
Chart Showing Increase And Decrease Numbers Of Jobs Created Ppt Visual Aids Model PDF
Pitch your topic with ease and precision using this chart showing increase and decrease numbers of jobs created ppt visual aids model pdf. This layout presents information on chart showing increase and decrease numbers of jobs created. It is also available for immediate download and adjustment. So, changes can be made in the color, design, graphics or any other component to create a unique layout.
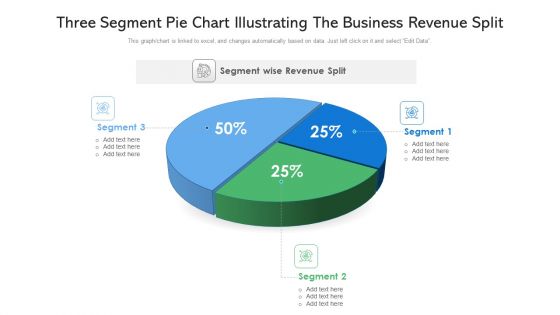
Three Segment Pie Chart Illustrating The Business Revenue Split Ppt PowerPoint Presentation Gallery Summary PDF
Pitch your topic with ease and precision using this three segment pie chart illustrating the business revenue split ppt powerpoint presentation gallery summary pdf. This layout presents information on three segment pie chart illustrating the business revenue split. It is also available for immediate download and adjustment. So, changes can be made in the color, design, graphics or any other component to create a unique layout.
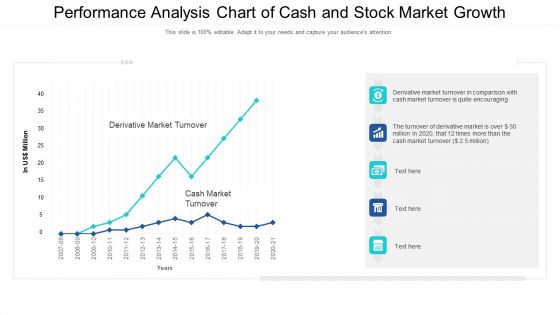
Performance Analysis Chart Of Cash And Stock Market Growth Ppt PowerPoint Presentation Outline Design Inspiration PDF
Showcasing this set of slides titled performance analysis chart of cash and stock market growth ppt powerpoint presentation outline design inspiration pdf. The topics addressed in these templates are performance analysis chart of cash and stock market growth. All the content presented in this PPT design is completely editable. Download it and make adjustments in color, background, font etc. as per your unique business setting.
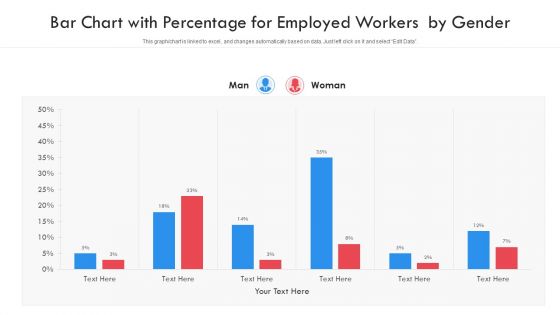
Bar Chart With Percentage For Employed Workers By Gender Ppt PowerPoint Presentation File Graphics Design PDF
Showcasing this set of slides titled bar chart with percentage for employed workers by gender ppt powerpoint presentation file graphics design pdf. The topics addressed in these templates are bar chart with percentage for employed workers by gender. All the content presented in this PPT design is completely editable. Download it and make adjustments in color, background, font etc. as per your unique business setting.
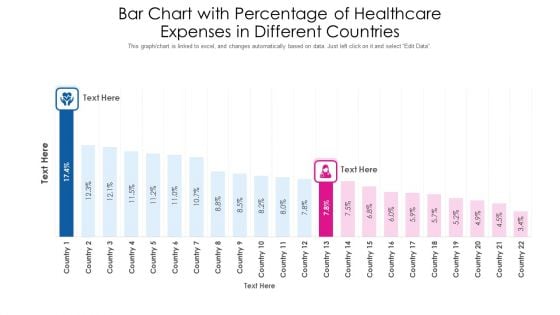
Bar Chart With Percentage Of Healthcare Expenses In Different Countries Ppt PowerPoint Presentation Gallery Tips PDF
Pitch your topic with ease and precision using this bar chart with percentage of healthcare expenses in different countries ppt powerpoint presentation gallery tips pdf. This layout presents information on bar chart with percentage of healthcare expenses in different countries. It is also available for immediate download and adjustment. So, changes can be made in the color, design, graphics or any other component to create a unique layout.
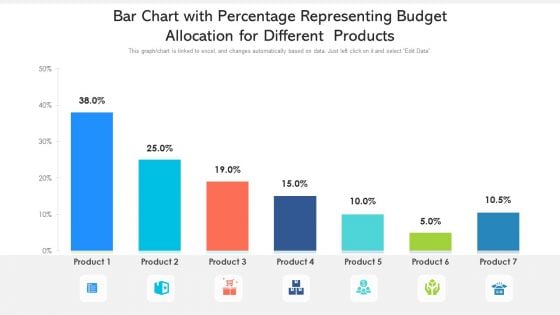
Bar Chart With Percentage Representing Budget Allocation For Different Products Ppt PowerPoint Presentation File Samples PDF
Showcasing this set of slides titled bar chart with percentage representing budget allocation for different products ppt powerpoint presentation file samples pdf. The topics addressed in these templates arebar chart with percentage representing budget allocation for different products. All the content presented in this PPT design is completely editable. Download it and make adjustments in color, background, font etc. as per your unique business setting.
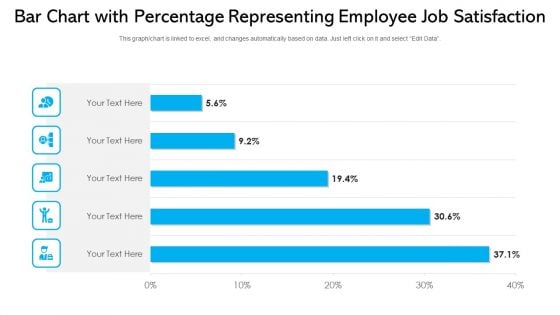
Bar Chart With Percentage Representing Employee Job Satisfaction Ppt PowerPoint Presentation File Slide Download PDF
Pitch your topic with ease and precision using this bar chart with percentage representing employee job satisfaction ppt powerpoint presentation file slide download pdf. This layout presents information on bar chart with percentage representing employee job satisfaction. It is also available for immediate download and adjustment. So, changes can be made in the color, design, graphics or any other component to create a unique layout.
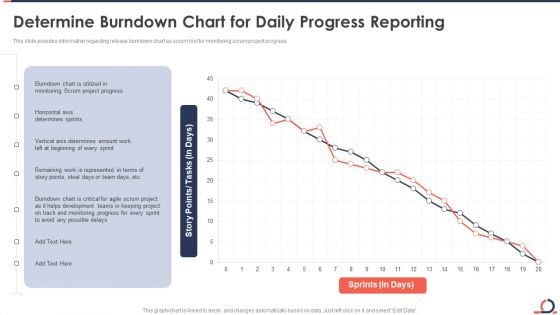
Determine Burndown Chart For Daily Progress Reporting Developing Fixed Bid Projects Using Agile IT Background PDF
This slide provides information regarding release burndown chart as scrum tool for monitoring scrum project progress. Deliver and pitch your topic in the best possible manner with this determine burndown chart for daily progress reporting developing fixed bid projects using agile it background pdf. Use them to share invaluable insights on monitoring, development and impress your audience. This template can be altered and modified as per your expectations. So, grab it now.
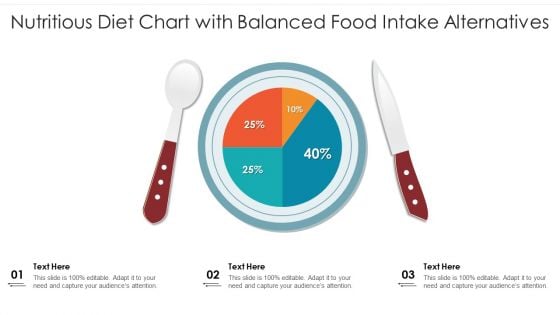
Nutritious Diet Chart With Balanced Food Intake Alternatives Ppt PowerPoint Presentation Portfolio Layout Ideas PDF
Pitch your topic with ease and precision using this nutritious diet chart with balanced food intake alternatives ppt powerpoint presentation portfolio layout ideas pdf. This layout presents information on nutritious diet chart with balanced food intake alternatives. It is also available for immediate download and adjustment. So, changes can be made in the color, design, graphics or any other component to create a unique layout.
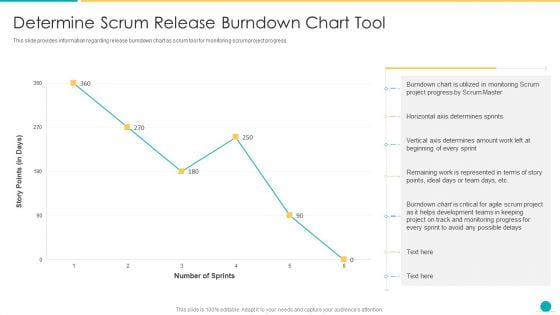
Fundamental Scrum Tools For Agile Project Administration IT Determine Scrum Release Burndown Chart Tool Information PDF
This slide provides information regarding release burndown chart as scrum tool for monitoring scrum project progress. Deliver an awe inspiring pitch with this creative fundamental scrum tools for agile project administration it determine scrum release burndown chart tool information pdf bundle. Topics like monitoring, development, scrum master can be discussed with this completely editable template. It is available for immediate download depending on the needs and requirements of the user.
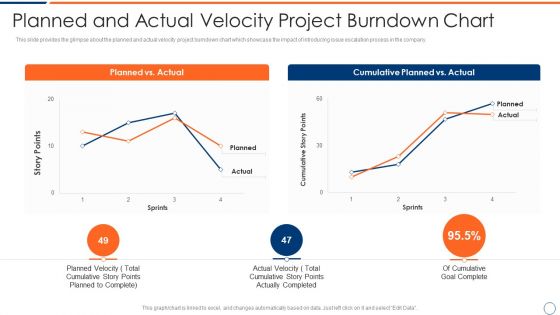
How To Intensify Project Threats Planned And Actual Velocity Project Burndown Chart Summary PDF
This slide provides the glimpse about the planned and actual velocity project burndown chart which showcase the impact of introducing issue escalation process in the company. Deliver an awe inspiring pitch with this creative how to intensify project threats planned and actual velocity project burndown chart summary pdf bundle. Topics like planned vs actual, cumulative planned vs actual can be discussed with this completely editable template. It is available for immediate download depending on the needs and requirements of the user.
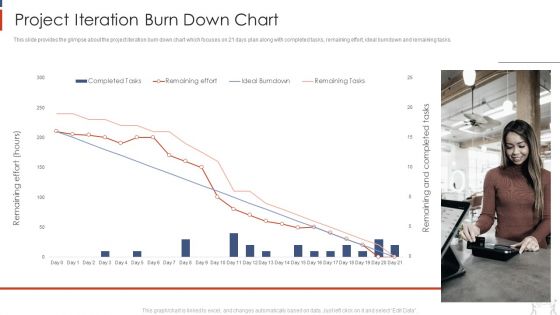
Project Management Modelling Techniques IT Project Iteration Burn Down Chart Portrait PDF
This slide provides the glimpse about the project iteration burn down chart which focuses on 21 days plan along with completed tasks, remaining effort, ideal burndown and remaining tasks. Deliver an awe inspiring pitch with this creative project management modelling techniques it project iteration burn down chart portrait pdf bundle. Topics like completed tasks, remaining effort, ideal burndown, remaining tasks can be discussed with this completely editable template. It is available for immediate download depending on the needs and requirements of the user.
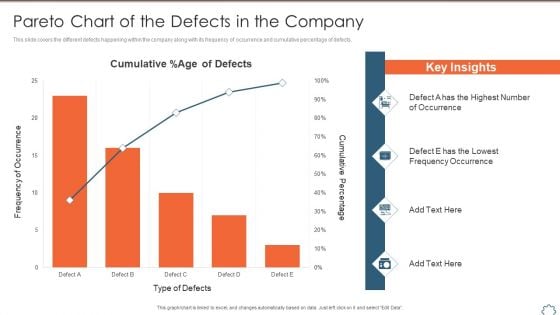
Total Productive Management At Workplace Pareto Chart Of The Defects In The Company Structure PDF
This slide covers the different defects happening within the company along with its frequency of occurrence and cumulative percentage of defects. Deliver an awe inspiring pitch with this creative total productive management at workplace pareto chart of the defects in the company structure pdf bundle. Topics like pareto chart of the defects in the company can be discussed with this completely editable template. It is available for immediate download depending on the needs and requirements of the user.
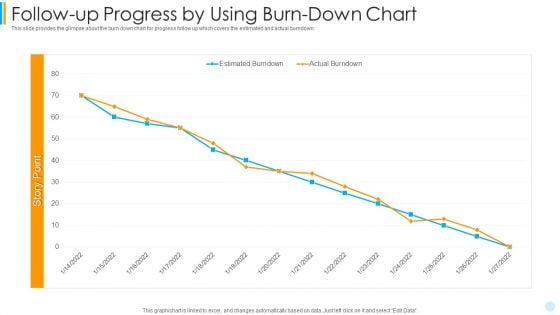
Scrum Development Model Follow Up Progress By Using Burn Down Chart Portrait PDF
this slide provides the glimpse about the burn down chart for progress follow up which covers the estimated and actual burndown. Deliver an awe inspiring pitch with this creative scrum development model follow up progress by using burn down chart portrait pdf bundle. Topics like estimated burndown, actual burndown can be discussed with this completely editable template. It is available for immediate download depending on the needs and requirements of the user.
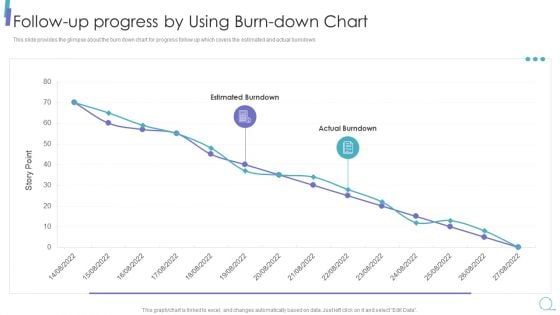
Scrum Process Framework Follow Up Progress By Using Burn Down Chart Download Pdf
This slide provides the glimpse about the burn down chart for progress follow up which covers the estimated and actual burndown. Deliver an awe inspiring pitch with this creative scrum process framework follow up progress by using burn down chart download pdf bundle. Topics like actual burndown, estimated burndown, story point can be discussed with this completely editable template. It is available for immediate download depending on the needs and requirements of the user.
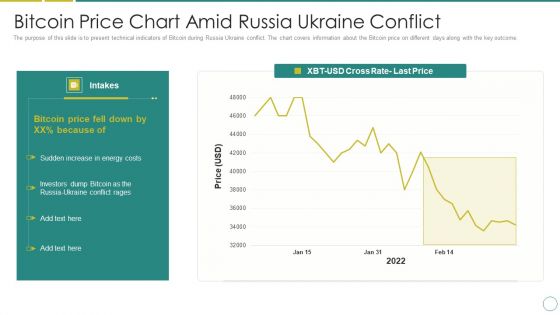
Russia Ukraine Bitcoin Price Chart Amid Russia Ukraine Conflict Demonstration PDF
The purpose of this slide is to present technical indicators of Bitcoin during Russia Ukraine conflict. The chart covers information about the Bitcoin price on different days along with the key outcome. Deliver an awe inspiring pitch with this creative russia ukraine bitcoin price chart amid russia ukraine conflict demonstration pdf bundle. Topics like bitcoin price, energy costs, 2022 can be discussed with this completely editable template. It is available for immediate download depending on the needs and requirements of the user.

Russia Ukraine Bitcoin Price Chart Before The Russia Invasion Of Ukraine Ideas PDF
The purpose of this slide is to graphically highlight the bitcoin price chart before the Russia-Ukraine crisis. It covers information about the price movement of bitcoin along with the key takeaways. Deliver an awe inspiring pitch with this creative russia ukraine bitcoin price chart before the russia invasion of ukraine ideas pdf bundle. Topics like bitcoin price can be discussed with this completely editable template. It is available for immediate download depending on the needs and requirements of the user.
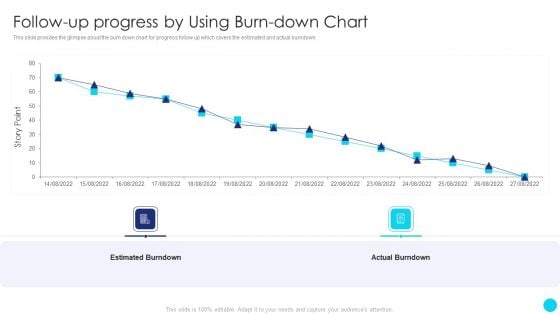
Scrum Software Development Life Cycle Follow Up Progress By Using Burn Down Chart Pictures PDF
This slide provides the glimpse about the burn down chart for progress follow up which covers the estimated and actual burndown. Deliver an awe inspiring pitch with this creative Scrum Software Development Life Cycle Follow Up Progress By Using Burn Down Chart Pictures PDF bundle. Topics like Estimated Burndown, Actual Burndown can be discussed with this completely editable template. It is available for immediate download depending on the needs and requirements of the user.
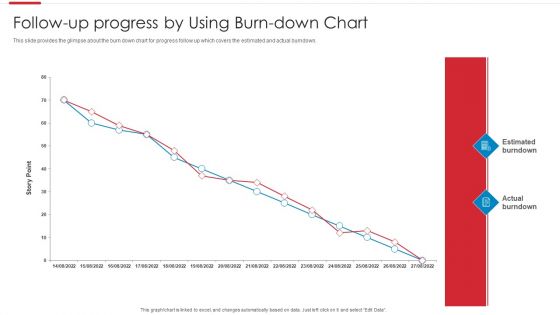
Agile Software Development Process Follow Up Progress By Using Burn Down Chart Slides PDF
This slide provides the glimpse about the burn down chart for progress follow up which covers the estimated and actual burndown. Deliver an awe inspiring pitch with this creative Agile Software Development Process Follow Up Progress By Using Burn Down Chart Slides PDF bundle. Topics like Estimated Burndown, Actual Burndown can be discussed with this completely editable template. It is available for immediate download depending on the needs and requirements of the user.

 Home
Home