Graph Icon
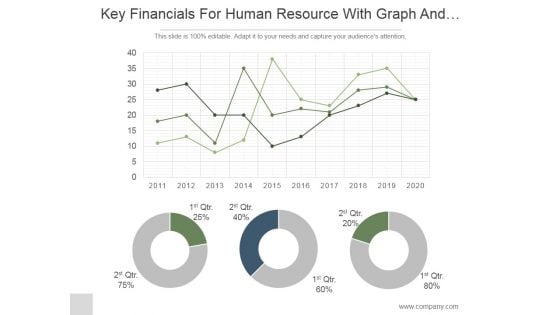
Key Financials For Human Resource With Graph And Pie Chart Ppt PowerPoint Presentation Ideas
This is a key financials for human resource with graph and pie chart ppt powerpoint presentation ideas. This is a three stage process. The stages in this process are business, strategy, marketing, analysis, donut, growth.
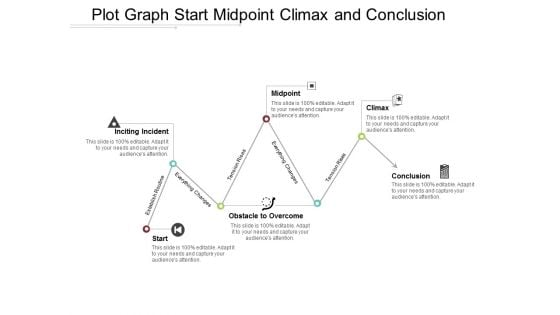
Plot Graph Start Midpoint Climax And Conclusion Ppt Powerpoint Presentation Portfolio Microsoft
This is a plot graph start midpoint climax and conclusion ppt powerpoint presentation portfolio microsoft. This is a six stage process. The stages in this process are scatter plot, probability plots, plot diagram.
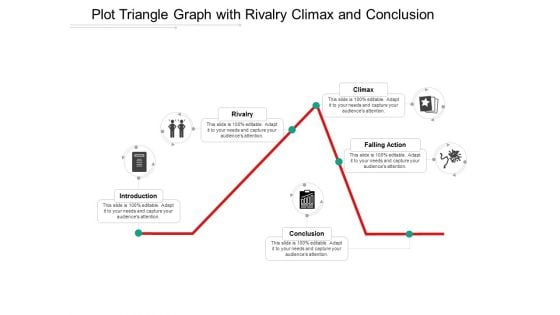
Plot Triangle Graph With Rivalry Climax And Conclusion Ppt Powerpoint Presentation Ideas Design Inspiration
This is a plot triangle graph with rivalry climax and conclusion ppt powerpoint presentation ideas design inspiration. This is a five stage process. The stages in this process are scatter plot, probability plots, plot diagram.
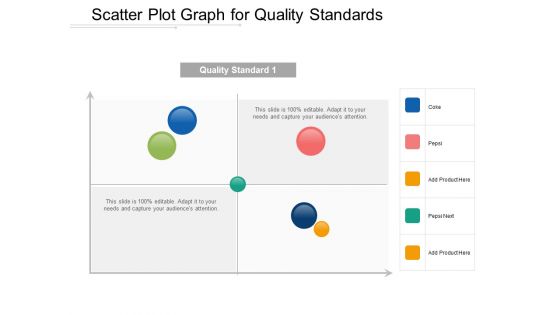
Scatter Plot Graph For Quality Standards Ppt Powerpoint Presentation Show Infographics
This is a scatter plot graph for quality standards ppt powerpoint presentation show infographics. This is a four stage process. The stages in this process are scatter plot, probability plots, plot diagram.
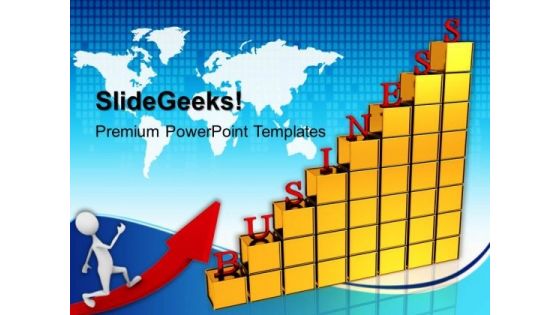
A Corporate Business Growth Graph PowerPoint Templates And PowerPoint Themes 1012
A Corporate Business Growth Graph PowerPoint Templates And PowerPoint Themes 1012-This PowerPoint Template shows the Bar Graph with increasing percentage which signifies the Financial or Business Growth. The Template signifies business concept. It signifies teamwork and team leader. Use this template for Global Business. The structure of our templates allows you to effectively highlight the key issues concerning the growth of your business.-A Corporate Business Growth Graph PowerPoint Templates And PowerPoint Themes 1012-This PowerPoint template can be used for presentations relating to-Business bar graph chart, technology, finance, arrows, business, success Our A Corporate Business Growth Graph PowerPoint Templates And PowerPoint Themes 1012 encourage an ethical approach. Exhort your team to stay above board.
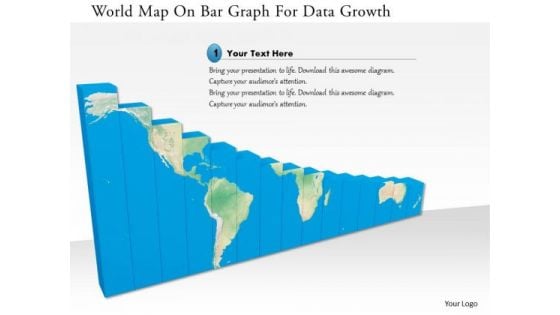
Stock Photo World Map On Bar Graph For Data Growth Image Graphics For PowerPoint Slide
This image is designed with blue graph with world map printed on it. This conceptual image portrays the concepts of global business and global economy. This image slide will help you express your views to target audience.
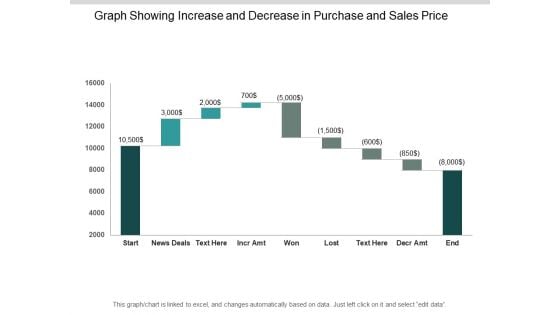
Graph Showing Increase And Decrease In Purchase And Sales Price Ppt PowerPoint Presentation Outline Gallery
This is a graph showing increase and decrease in purchase and sales price ppt powerpoint presentation outline gallery. This is a nine stage process. The stages in this process are sales waterfall, waterfall chart, business.
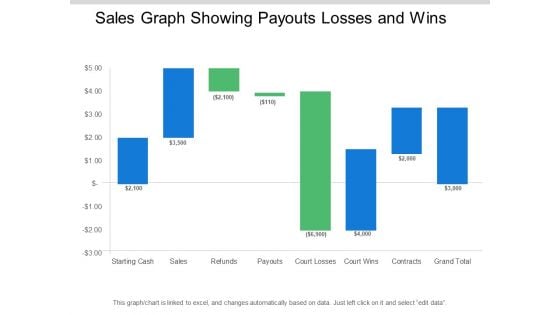
Sales Graph Showing Payouts Losses And Wins Ppt PowerPoint Presentation Pictures Designs Download
This is a sales graph showing payouts losses and wins ppt powerpoint presentation pictures designs download. This is a eight stage process. The stages in this process are sales waterfall, waterfall chart, business.
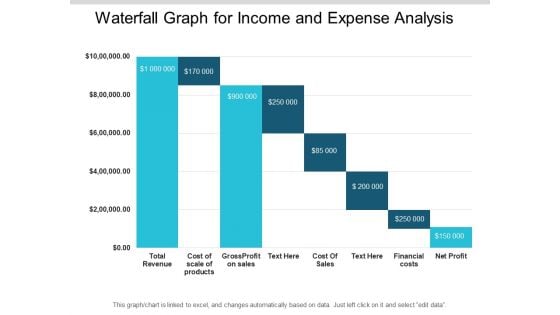
Waterfall Graph For Income And Expense Analysis Ppt PowerPoint Presentation File Deck
This is a waterfall graph for income and expense analysis ppt powerpoint presentation file deck. This is a eight stage process. The stages in this process are sales waterfall, waterfall chart, business.
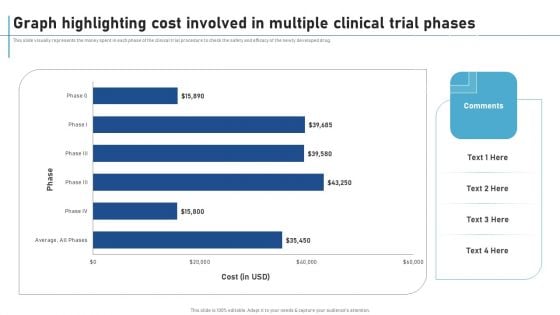
Graph Highlighting Cost Involved In Multiple Clinical Trial Phases New Clinical Drug Trial Process Mockup PDF
This slide visually represents the money spent in each phase of the clinical trial procedure to check the safety and efficacy of the newly developed drug. Find highly impressive Graph Highlighting Cost Involved In Multiple Clinical Trial Phases New Clinical Drug Trial Process Mockup PDF on Slidegeeks to deliver a meaningful presentation. You can save an ample amount of time using these presentation templates. No need to worry to prepare everything from scratch because Slidegeeks experts have already done a huge research and work for you. You need to download Graph Highlighting Cost Involved In Multiple Clinical Trial Phases New Clinical Drug Trial Process Mockup PDF for your upcoming presentation. All the presentation templates are 100 percent editable and you can change the color and personalize the content accordingly. Download now.
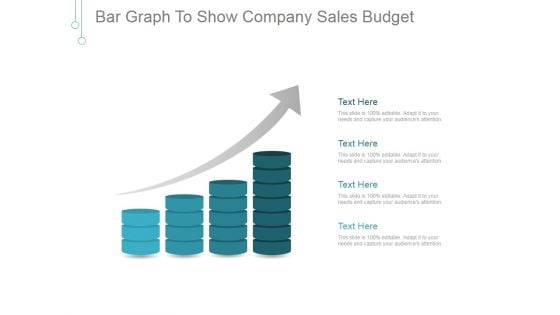
Bar Graph To Show Company Sales Budget Ppt PowerPoint Presentation Sample
This is a bar graph to show company sales budget ppt powerpoint presentation sample. This is a four stage process. The stages in this process are business, finance, growth, success, marketing, arrow.
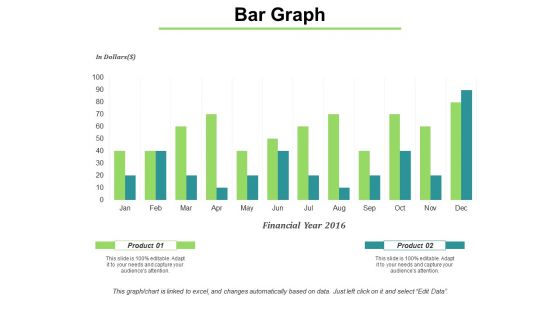
Bar Graph Shows Financial Values Ppt PowerPoint Presentation Infographic Template Gridlines
This is a bar graph shows financial values ppt powerpoint presentation infographic template gridlines. This is a two stage process. The stages in this process are bar, marketing, strategy, finance, planning.
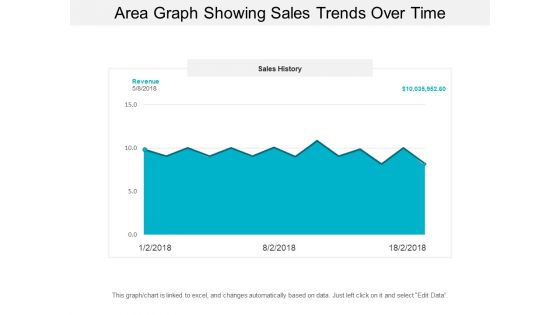
Area Graph Showing Sales Trends Over Time Ppt PowerPoint Presentation Model Background Designs
This is a area graph showing sales trends over time ppt powerpoint presentation model background designs. This is a three stage process. The stages in this process are financial analysis, quantitative, statistical modelling.
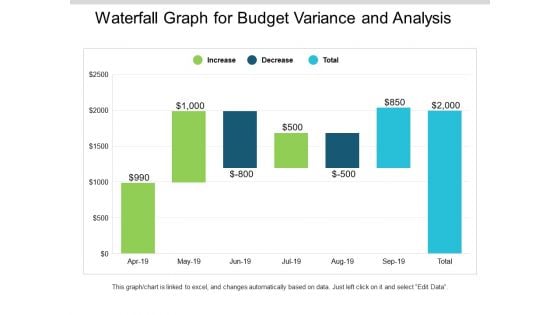
Waterfall Graph For Budget Variance And Analysis Ppt PowerPoint Presentation Slides Mockup
This is a waterfall graph for budget variance and analysis ppt powerpoint presentation slides mockup. This is a three stage process. The stages in this process are profit and loss, balance sheet, income statement, benefit and loss.
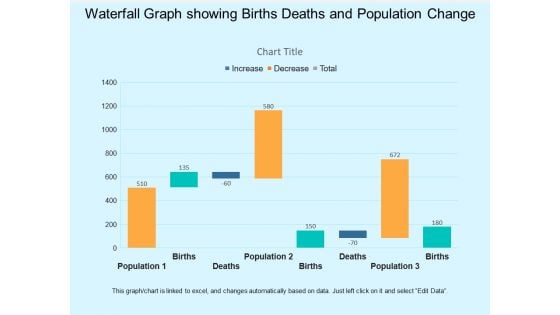
Waterfall Graph Showing Births Deaths And Population Change Ppt PowerPoint Presentation Infographic Template Visual Aids
This is a waterfall graph showing births deaths and population change ppt powerpoint presentation infographic template visual aids. This is a three stage process. The stages in this process are profit and loss, balance sheet, income statement, benefit and loss.
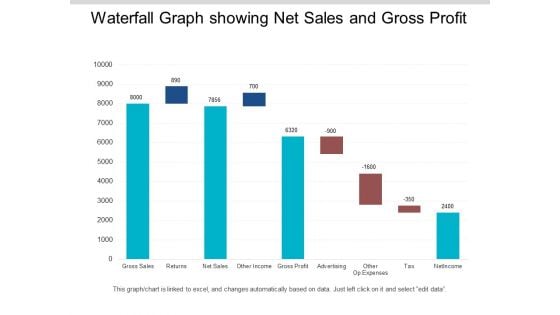
Waterfall Graph Showing Net Sales And Gross Profit Ppt PowerPoint Presentation Infographics Format
This is a waterfall graph showing net sales and gross profit ppt powerpoint presentation infographics format. This is a three stage process. The stages in this process are profit and loss, balance sheet, income statement, benefit and loss.
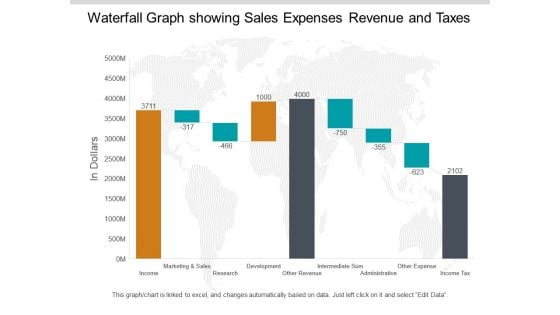
Waterfall Graph Showing Sales Expenses Revenue And Taxes Ppt PowerPoint Presentation Pictures Summary
This is a waterfall graph showing sales expenses revenue and taxes ppt powerpoint presentation pictures summary. This is a three stage process. The stages in this process are profit and loss, balance sheet, income statement, benefit and loss.
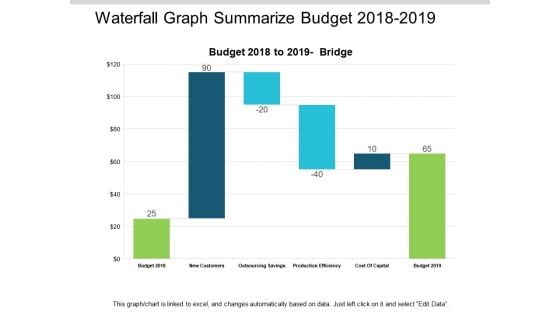
Waterfall Graph Summarize Budget 2018 To 2019 Ppt PowerPoint Presentation Summary Slides
This is a waterfall graph summarize budget 2018 to 2019 ppt powerpoint presentation summary slides. This is a three stage process. The stages in this process are profit and loss, balance sheet, income statement, benefit and loss.
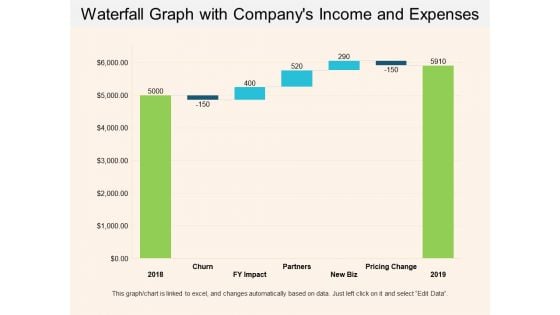
Waterfall Graph With Companys Income And Expenses Ppt PowerPoint Presentation Show Example Introduction
This is a waterfall graph with companys income and expenses ppt powerpoint presentation show example introduction. This is a three stage process. The stages in this process are profit and loss, balance sheet, income statement, benefit and loss.
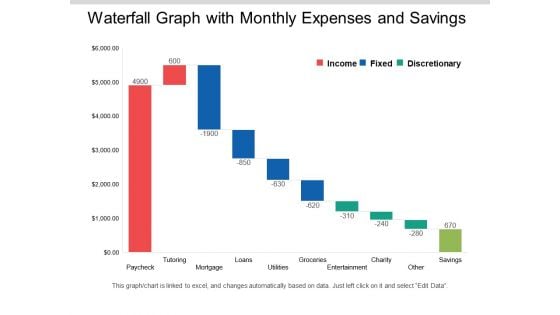
Waterfall Graph With Monthly Expenses And Savings Ppt PowerPoint Presentation Layouts Clipart Images
This is a waterfall graph with monthly expenses and savings ppt powerpoint presentation layouts clipart images. This is a three stage process. The stages in this process are profit and loss, balance sheet, income statement, benefit and loss.
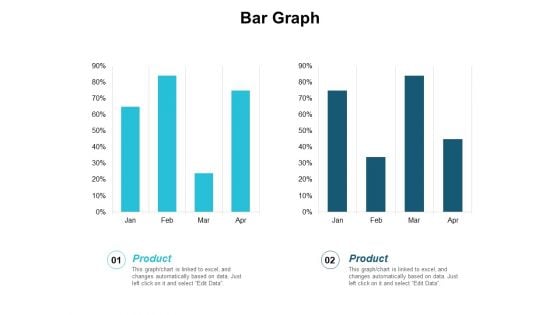
Bar Graph Finance Planning Ppt PowerPoint Presentation Infographic Template Master Slide
This is a bar graph finance planning ppt powerpoint presentation infographic template master slide. This is a two stage process. The stages in this process are finance, analysis, business, investment, marketing.
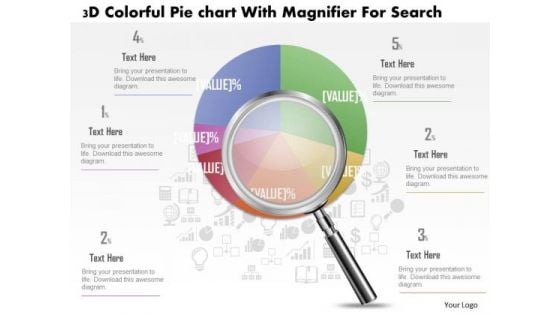
Business Diagram 3d Colorful Pie Graph With Magnifier Data Search PowerPoint Slide
This business slide displays 3d colorful pie graph with magnifier. This diagram is a data visualization tool that gives you a simple way to present statistical information. This slide helps your audience examine and interpret the data you present.
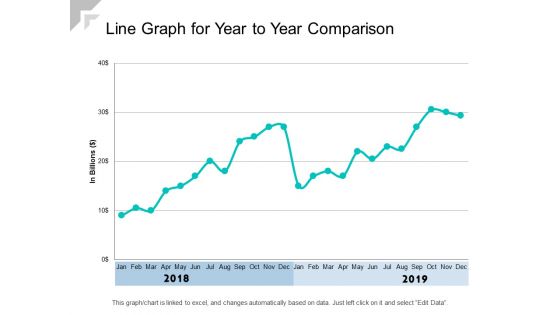
Line Graph For Year To Year Comparison Ppt PowerPoint Presentation Show Graphics Example
Presenting this set of slides with name line graph for year to year comparison ppt powerpoint presentation show graphics example. The topics discussed in these slides are revenue trend, bar chart, financial. This is a completely editable PowerPoint presentation and is available for immediate download. Download now and impress your audience.
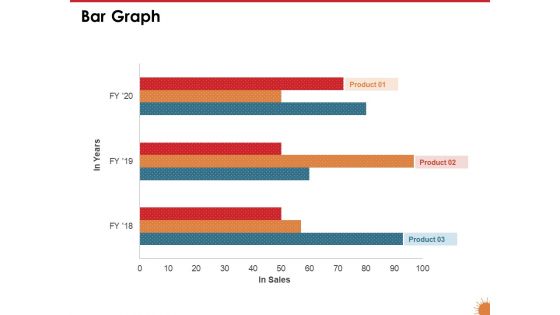
Impact Of COVID 19 On The Hospitality Industry Bar Graph Portrait PDF
Presenting this set of slides with name impact of covid 19 on the hospitality industry bar graph portrait pdf. The topics discussed in these slide is bar chart. This is a completely editable PowerPoint presentation and is available for immediate download. Download now and impress your audience.

White And Yellow Bar Graph Business Shapes PowerPoint Templates And PowerPoint Themes 1012
White And Yellow Bar Graph Business Shapes PowerPoint Templates And PowerPoint Themes 1012-Use this Above PowerPoint Template Displaying the Bar Graph in Circular Manner. It indicates beefing up, boost, buildup, crop, cultivation, enlargement, evolution, gain, heightening, hike, improvement, increase. Original thinking is the need of the hour. We provide the means to project your views.-White And Yellow Bar Graph Business Shapes PowerPoint Templates And PowerPoint Themes 1012-This PowerPoint template can be used for presentations relating to-Bar graph showing the growth, business, finance, success, marketing, shapes The environment deserves constant attention. Keep an eye through our White And Yellow Bar Graph Business Shapes PowerPoint Templates And PowerPoint Themes 1012.
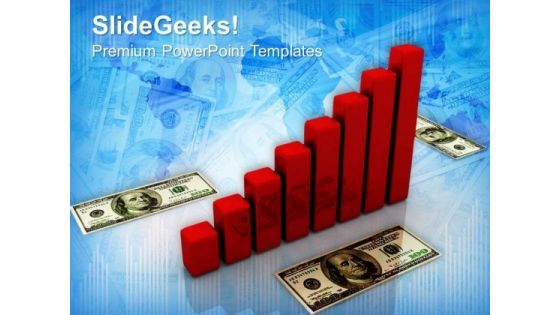
Bar Graph With Dollar Marketing PowerPoint Templates And PowerPoint Themes 1012
Bar Graph with Dollar Marketing PowerPoint Templates And PowerPoint Themes 1012-Emphatically define your message with our above template which contains a graphic of bar graph with dollar notes. This image clearly defines the concept of business statistics and financial reviews. Our stunning image makes your presentations professional showing that you care about even the smallest details. Create captivating presentations to deliver comparative and weighted arguments.-Bar Graph with Dollar Marketing PowerPoint Templates And PowerPoint Themes 1012-This PowerPoint template can be used for presentations relating to-Business graph and dollar, money, finance, success, business, marketing Your career will soar away. Our Bar Graph With Dollar Marketing PowerPoint Templates And PowerPoint Themes 1012 will give it wings.
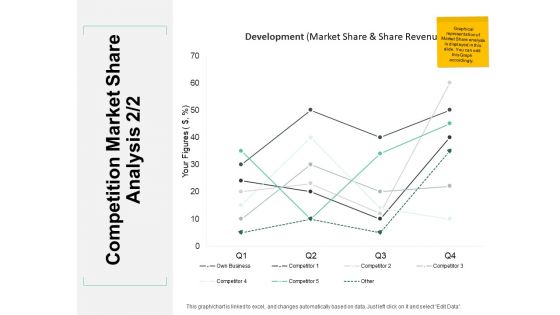
Competition Market Share Analysis Line Graph Ppt PowerPoint Presentation Portfolio Layouts
Presenting this set of slides with name competition market share analysis line graph ppt powerpoint presentation portfolio layouts. The topics discussed in these slides are marketing, business, management, planning, strategy. This is a completely editable PowerPoint presentation and is available for immediate download. Download now and impress your audience.
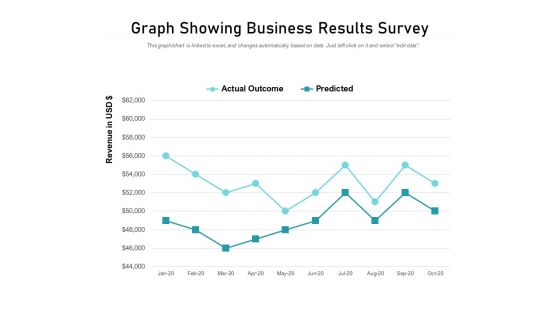
Graph Showing Business Results Survey Ppt PowerPoint Presentation Summary Slide Portrait
Presenting this set of slides with name graph showing business results survey ppt powerpoint presentation summary slide portrait. The topics discussed in these slides are actual outcomes, predicted. This is a completely editable PowerPoint presentation and is available for immediate download. Download now and impress your audience.
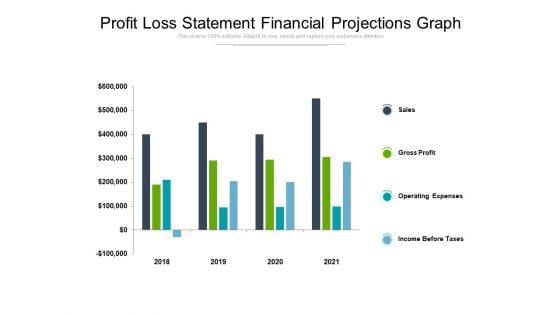
Profit Loss Statement Financial Projections Graph Ppt PowerPoint Presentation Summary Slides
Presenting this set of slides with name profit loss statement financial projections graph ppt powerpoint presentation summary slides. The topics discussed in these slides are sales, gross profit, operating expenses, income before taxes. This is a completely editable PowerPoint presentation and is available for immediate download. Download now and impress your audience.
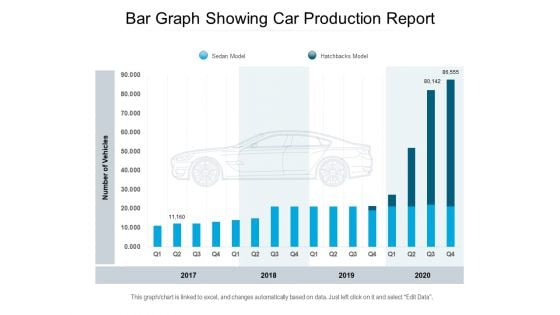
Bar Graph Showing Car Production Report Ppt PowerPoint Presentation Outline Master Slide PDF
Presenting this set of slides with name bar graph showing car production report ppt powerpoint presentation outline master slide pdf. The topics discussed in these slides are sedan model, hatchbacks model, 2017 to 2020. This is a completely editable PowerPoint presentation and is available for immediate download. Download now and impress your audience.
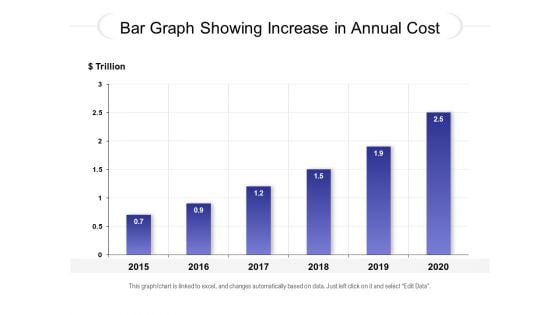
Bar Graph Showing Increase In Annual Cost Ppt PowerPoint Presentation Infographic Template Inspiration PDF
Presenting this set of slides with name bar graph showing increase in annual cost ppt powerpoint presentation infographic template inspiration pdf. The topics discussed in these slides are 2015 to 2020. This is a completely editable PowerPoint presentation and is available for immediate download. Download now and impress your audience.
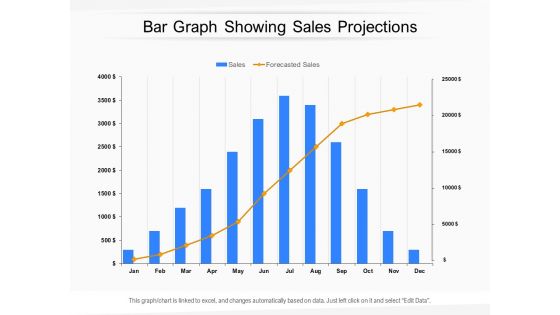
Bar Graph Showing Sales Projections Ppt PowerPoint Presentation Styles Graphics Download PDF
Presenting this set of slides with name bar graph showing sales projections ppt powerpoint presentation styles graphics download pdf. The topics discussed in these slides are Sales, Forecasted Sales. This is a completely editable PowerPoint presentation and is available for immediate download. Download now and impress your audience.
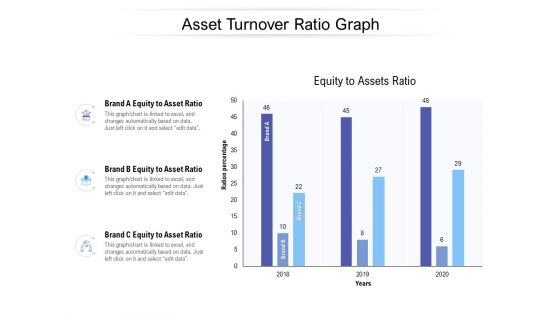
Asset Turnover Ratio Graph Ppt PowerPoint Presentation Outline Graphics Template PDF
Presenting this set of slides with name asset turnover ratio graph ppt powerpoint presentation outline graphics template pdf. The topics discussed in these slides are brand a equity to asset ratio, brand b equity to asset ratio, brand c equity to asset ratio. This is a completely editable PowerPoint presentation and is available for immediate download. Download now and impress your audience.
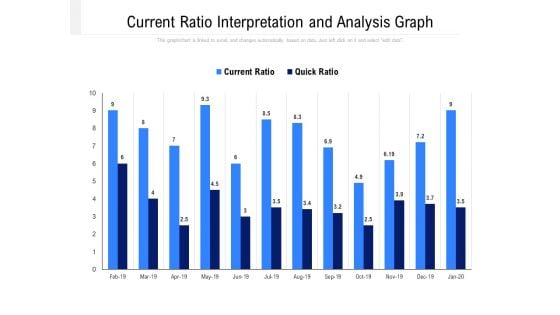
Current Ratio Interpretation And Analysis Graph Ppt PowerPoint Presentation Outline Inspiration PDF
Presenting this set of slides with name current ratio interpretation and analysis graph ppt powerpoint presentation outline inspiration pdf. The topics discussed in these slides are current ration, quick ration. This is a completely editable PowerPoint presentation and is available for immediate download. Download now and impress your audience.
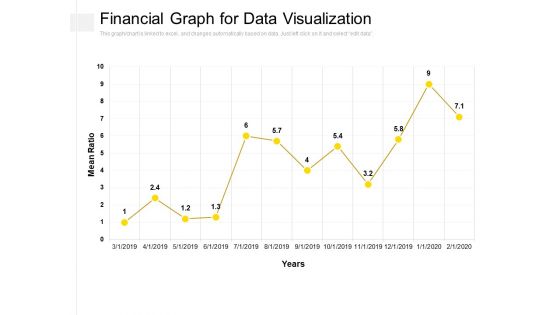
Financial Graph For Data Visualization Ppt PowerPoint Presentation Slides Picture PDF
Presenting this set of slides with name financial graph for data visualization ppt powerpoint presentation slides picture pdf. The topics discussed in these slides are mean ration, year. This is a completely editable PowerPoint presentation and is available for immediate download. Download now and impress your audience.
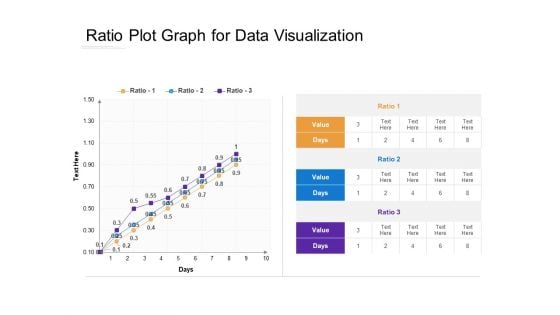
Ratio Plot Graph For Data Visualization Ppt PowerPoint Presentation Ideas Outfit PDF
Presenting this set of slides with name ratio plot graph for data visualization ppt powerpoint presentation ideas outfit pdf. The topics discussed in these slides are ratio, value, days. This is a completely editable PowerPoint presentation and is available for immediate download. Download now and impress your audience.
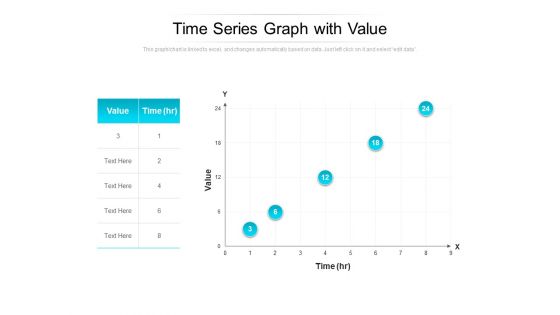
Time Series Graph With Value Ppt PowerPoint Presentation Pictures Graphics Example PDF
Presenting this set of slides with name time series graph with value ppt powerpoint presentation pictures graphics example pdf. The topics discussed in these slides are value, time. This is a completely editable PowerPoint presentation and is available for immediate download. Download now and impress your audience.
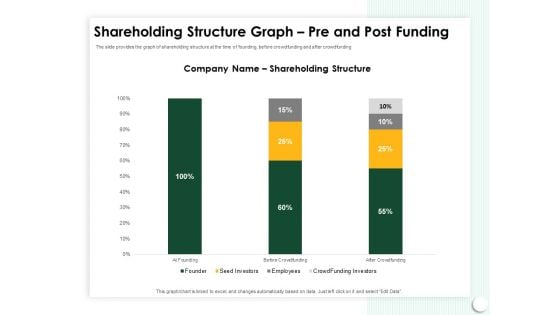
Startup Presentation For Collaborative Capital Funding Shareholding Structure Graph Pre And Post Funding Background PDF
Presenting this set of slides with name startup presentation for collaborative capital funding shareholding structure graph pre and post funding background pdf. The topics discussed in these slides are employee, shareholding structure, seed investors, crowd funding investors. This is a completely editable PowerPoint presentation and is available for immediate download. Download now and impress your audience.
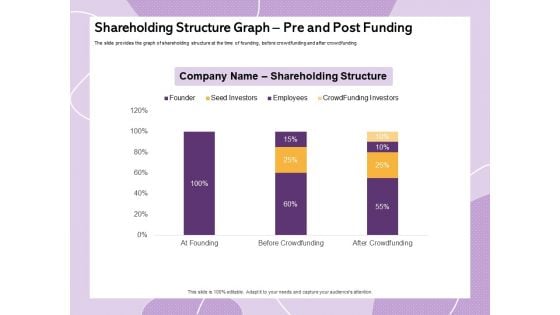
Investor Presentation For Society Funding Shareholding Structure Graph Pre And Post Funding Elements PDF
Presenting this set of slides with name investor presentation for society funding shareholding structure graph pre and post funding elements pdf. The topics discussed in these slides are before funding, after funding, value shares, investor. This is a completely editable PowerPoint presentation and is available for immediate download. Download now and impress your audience.
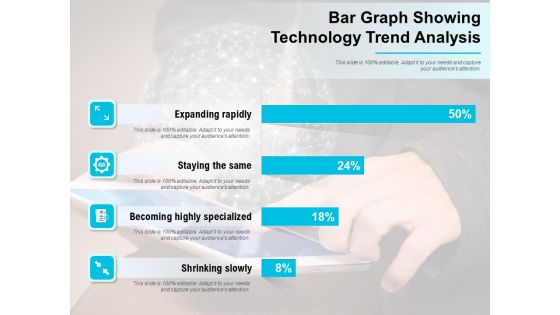
Bar Graph Showing Technology Trend Analysis Ppt PowerPoint Presentation File Mockup PDF
Presenting this set of slides with name bar graph showing technology trend analysis ppt powerpoint presentation file mockup pdf. The topics discussed in these slides are expanding rapidly, shrinking slowly. This is a completely editable PowerPoint presentation and is available for immediate download. Download now and impress your audience.
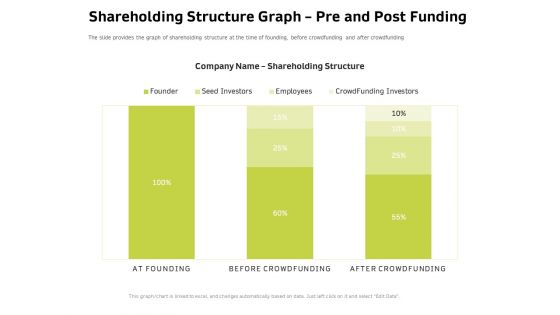
Customer Relationship Management In Freehold Property Shareholding Structure Graph Pre And Post Funding Elements PDF
Presenting this set of slides with name customer relationship management in freehold property shareholding structure graph pre and post funding elements pdf. The topics discussed in these slides are employee, shareholding structure, seed investors, crowd funding investors. This is a completely editable PowerPoint presentation and is available for immediate download. Download now and impress your audience.
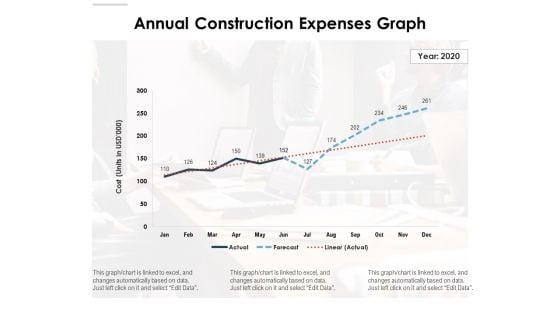
Annual Construction Expenses Graph Ppt PowerPoint Presentation Portfolio Slide Download PDF
Presenting this set of slides with name annual construction expenses graph ppt powerpoint presentation portfolio slide download pdf. The topics discussed in these slides are cost, actual, forecost, 2020. This is a completely editable PowerPoint presentation and is available for immediate download. Download now and impress your audience.
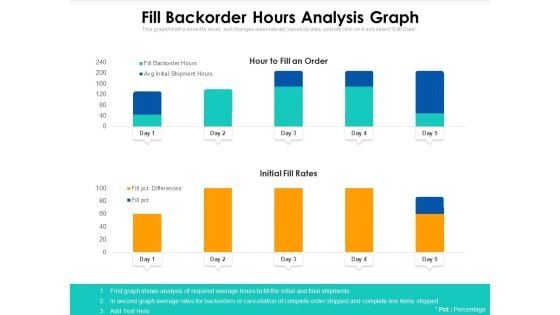
Fill Backorder Hours Analysis Graph Ppt PowerPoint Presentation Summary Example File PDF
Presenting this set of slides with name fill backorder hours analysis graph ppt powerpoint presentation summary example file pdf. The topics discussed in these slides are initial fill rates, hour to fill an order, analysis. This is a completely editable PowerPoint presentation and is available for immediate download. Download now and impress your audience.
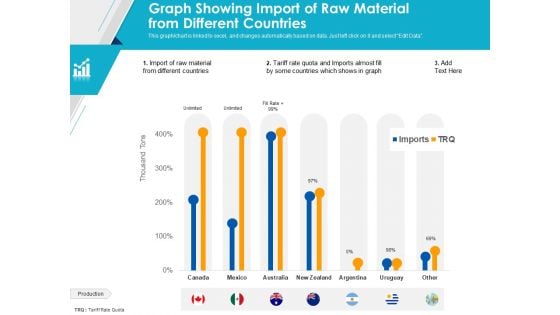
Graph Showing Import Of Raw Material From Different Countries Ppt PowerPoint Presentation Styles Slides PDF
Presenting this set of slides with name graph showing import of raw material from different countries ppt powerpoint presentation styles slides pdf. The topics discussed in these slides are raw material, production, tqr. This is a completely editable PowerPoint presentation and is available for immediate download. Download now and impress your audience.
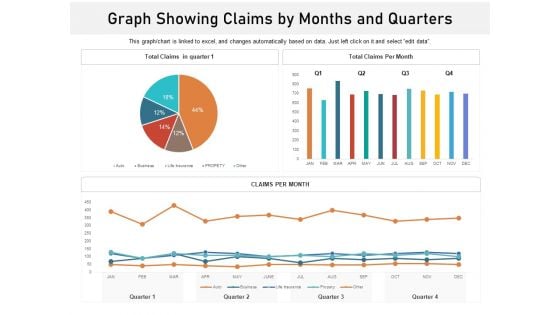
Graph Showing Claims By Months And Quarters Ppt PowerPoint Presentation Ideas Outline PDF
Presenting this set of slides with name graph showing claims by months and quarters ppt powerpoint presentation ideas outline pdf. The topics discussed in these slides are total claims in quarter, total claims per month, business, life insurance, property, auto. This is a completely editable PowerPoint presentation and is available for immediate download. Download now and impress your audience.

Business Power Consumption Statistics Bar Graph Ppt PowerPoint Presentation Gallery Slides PDF
Presenting this set of slides with name business power consumption statistics bar graph ppt powerpoint presentation gallery slides pdf. The topics discussed in these slides are electricity, consumption, plant. This is a completely editable PowerPoint presentation and is available for immediate download. Download now and impress your audience.
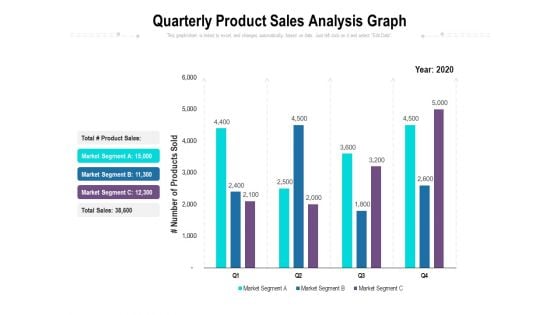
Quarterly Product Sales Analysis Graph Ppt PowerPoint Presentation Portfolio Slide Download PDF
Presenting this set of slides with name quarterly product sales analysis graph ppt powerpoint presentation portfolio slide download pdf. The topics discussed in these slides are product sales, market segment, total sales, number of products sold, year 2020. This is a completely editable PowerPoint presentation and is available for immediate download. Download now and impress your audience.
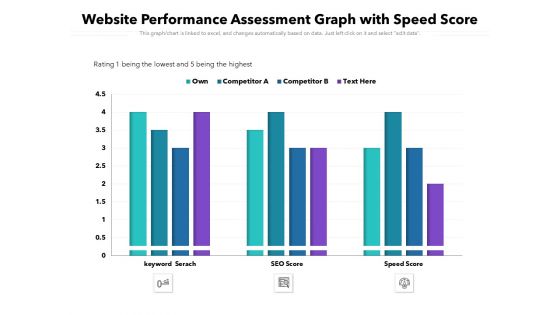
Website Performance Assessment Graph With Speed Score Ppt PowerPoint Presentation Layouts Display
Presenting this set of slides with name website performance assessment graph with speed score ppt powerpoint presentation layouts display. The topics discussed in these slides are keyword search, seo score, speed score, own, competitor. This is a completely editable PowerPoint presentation and is available for immediate download. Download now and impress your audience.
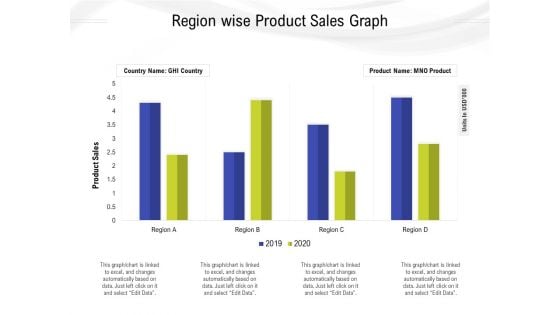
Region Wise Product Sales Graph Ppt PowerPoint Presentation Styles Layout Ideas PDF
Presenting this set of slides with name region wise product sales graph ppt powerpoint presentation styles layout ideas pdf. The topics discussed in these slides are country name ghi country, product name mno product, product sales, 2019, 2020. This is a completely editable PowerPoint presentation and is available for immediate download. Download now and impress your audience.
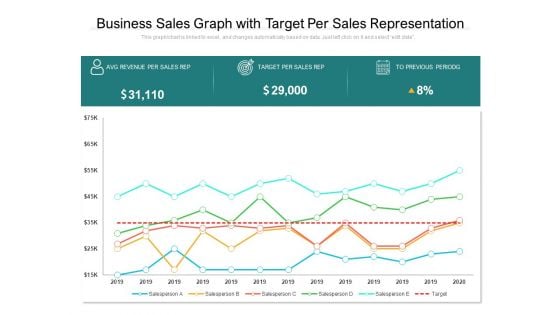
Business Sales Graph With Target Per Sales Representation Ppt PowerPoint Presentation Gallery Templates PDF
Presenting this set of slides with name business sales graph with target per sales representation ppt powerpoint presentation gallery templates pdf. The topics discussed in these slides are revenue, sales, target. This is a completely editable PowerPoint presentation and is available for immediate download. Download now and impress your audience.
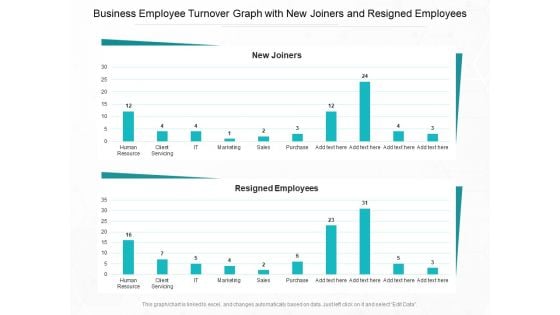
Business Employee Turnover Graph With New Joiners And Resigned Employees Ppt PowerPoint Presentation Summary Backgrounds PDF
Presenting this set of slides with name business employee turnover graph with new joiners and resigned employees ppt powerpoint presentation summary backgrounds pdf. The topics discussed in these slides are human resource, client servicing, it, marketing, sales, purchase. This is a completely editable PowerPoint presentation and is available for immediate download. Download now and impress your audience.
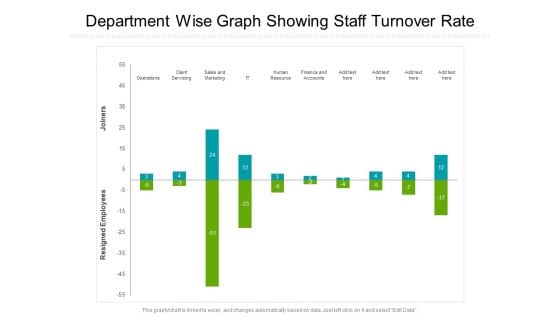
Department Wise Graph Showing Staff Turnover Rate Ppt PowerPoint Presentation Gallery Outfit PDF
Presenting this set of slides with name department wise graph showing staff turnover rate ppt powerpoint presentation gallery outfit pdf. The topics discussed in these slides are operations, client servicing, sales and marketing, it, human resource, finance and accounts. This is a completely editable PowerPoint presentation and is available for immediate download. Download now and impress your audience.
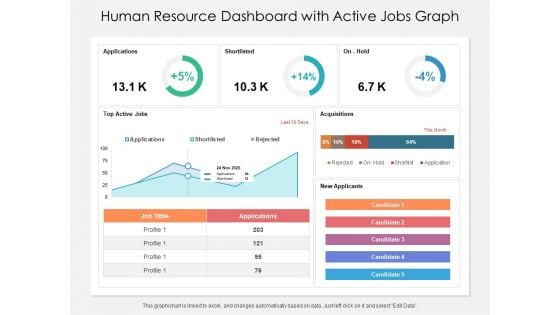
Human Resource Dashboard With Active Jobs Graph Ppt PowerPoint Presentation File Influencers PDF
Presenting this set of slides with name human resource dashboard with active jobs graph ppt powerpoint presentation file influencers pdf. The topics discussed in these slides are acquisitions, applications, shortlisted. This is a completely editable PowerPoint presentation and is available for immediate download. Download now and impress your audience.
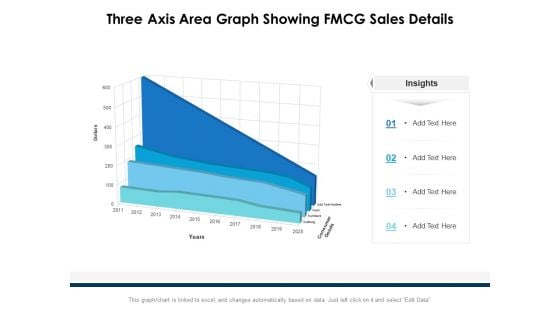
Three Axis Area Graph Showing FMCG Sales Details Ppt PowerPoint Presentation Ideas Layouts PDF
Presenting this set of slides with name three axis area graph showing fmcg sales details ppt powerpoint presentation ideas layouts pdf. The topics discussed in these slides are consumer goods, dollars, 2011 to 2020. This is a completely editable PowerPoint presentation and is available for immediate download. Download now and impress your audience.
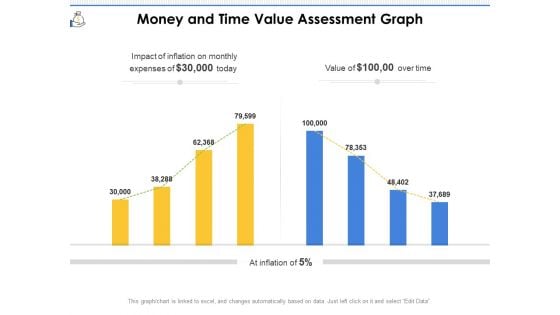
Money And Time Value Assessment Graph Ppt PowerPoint Presentation File Outline PDF
Presenting this set of slides with name money and time value assessment graph ppt powerpoint presentation file outline pdf. The topics discussed in these slides are inflation, expenses, value. This is a completely editable PowerPoint presentation and is available for immediate download. Download now and impress your audience.
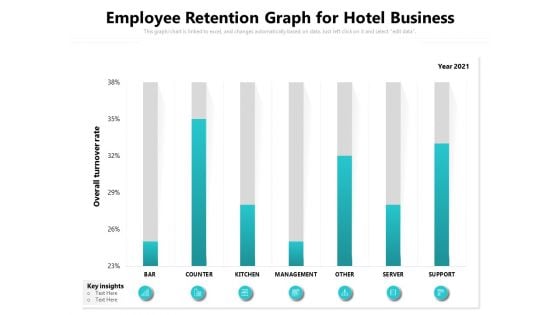
Employee Retention Graph For Hotel Business Ppt PowerPoint Presentation Show Skills PDF
Presenting this set of slides with name employee retention graph for hotel business ppt powerpoint presentation show skills pdf. The topics discussed in these slides are bar, counter, kitchen, management, other, server, support. This is a completely editable PowerPoint presentation and is available for immediate download. Download now and impress your audience.
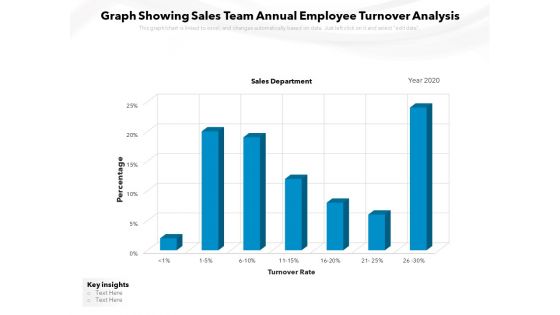
Graph Showing Sales Team Annual Employee Turnover Analysis Ppt PowerPoint Presentation Ideas PDF
Presenting this set of slides with name graph showing sales team annual employee turnover analysis ppt powerpoint presentation ideas pdf. The topics discussed in these slides are sales department, turnover rate, percentage, key insights, 2020. This is a completely editable PowerPoint presentation and is available for immediate download. Download now and impress your audience.
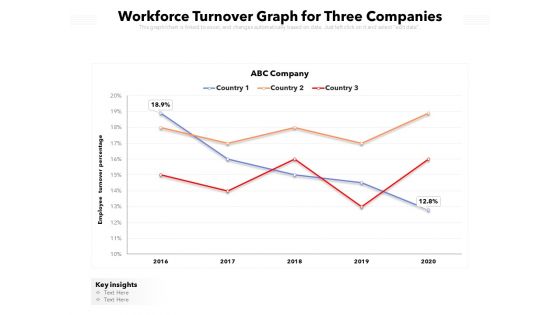
Workforce Turnover Graph For Three Companies Ppt PowerPoint Presentation Infographic Template Visuals PDF
Presenting this set of slides with name workforce turnover graph for three companies ppt powerpoint presentation infographic template visuals pdf. The topics discussed in these slides are key insights, 2016 to 2020, employee turnover percentage. This is a completely editable PowerPoint presentation and is available for immediate download. Download now and impress your audience.
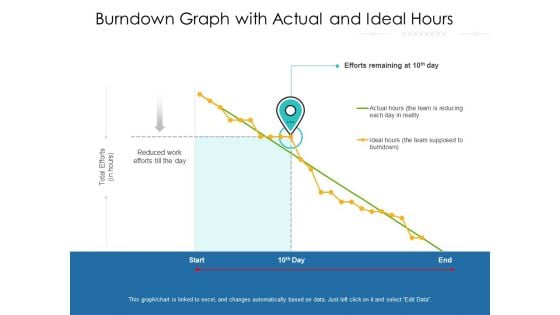
Burndown Graph With Actual And Ideal Hours Ppt PowerPoint Presentation Ideas Example Topics PDF
Presenting this set of slides with name burndown graph with actual and ideal hours ppt powerpoint presentation ideas example topics pdf. The topics discussed in these slides are efforts remaining, reduced work efforts till the day, team. This is a completely editable PowerPoint presentation and is available for immediate download. Download now and impress your audience.
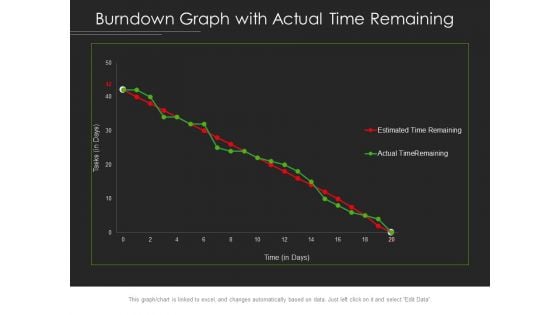
Burndown Graph With Actual Time Remaining Ppt PowerPoint Presentation Styles Professional PDF
Presenting this set of slides with name burndown graph with actual time remaining ppt powerpoint presentation styles professional pdf. The topics discussed in these slides are estimated time remaining, actual time remaining, series. This is a completely editable PowerPoint presentation and is available for immediate download. Download now and impress your audience.

 Home
Home