Graph Icon
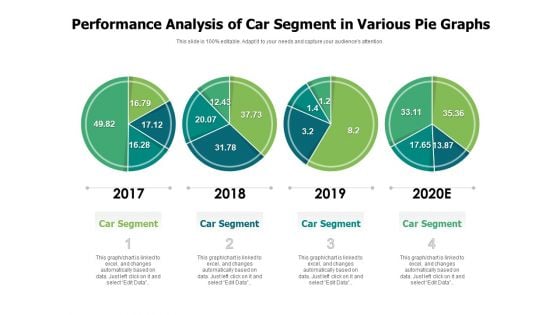
Performance Analysis Of Car Segment In Various Pie Graphs Ppt PowerPoint Presentation Professional Example PDF
Pitch your topic with ease and precision using this performance analysis of car segment in various pie graphs ppt powerpoint presentation professional example pdf. This layout presents information on 2017 to 2020, car segment. It is also available for immediate download and adjustment. So, changes can be made in the color, design, graphics or any other component to create a unique layout.
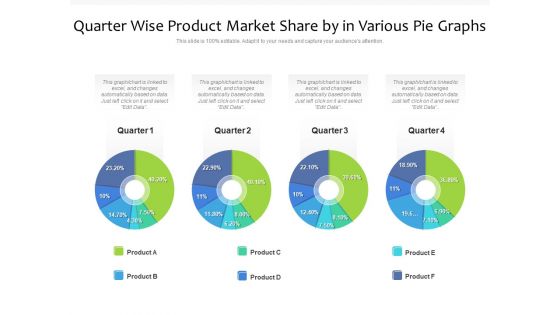
Quarter Wise Product Market Share By In Various Pie Graphs Ppt PowerPoint Presentation Gallery Guidelines PDF
Showcasing this set of slides titled quarter wise product market share by in various pie graphs ppt powerpoint presentation gallery guidelines pdf. The topics addressed in these templates are quarter, product. All the content presented in this PPT design is completely editable. Download it and make adjustments in color, background, font etc. as per your unique business setting.
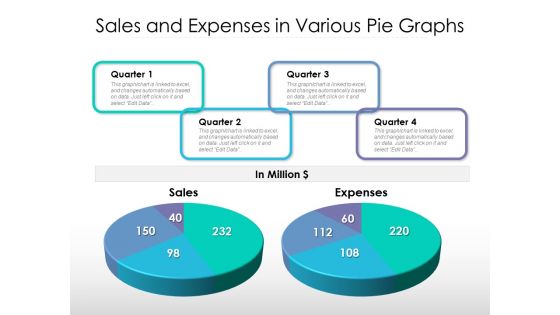
Sales And Expenses In Various Pie Graphs Ppt PowerPoint Presentation Ideas Backgrounds PDF
Pitch your topic with ease and precision using this sales and expenses in various pie graphs ppt powerpoint presentation ideas backgrounds pdf. This layout presents information on sales, expenses, quarter. It is also available for immediate download and adjustment. So, changes can be made in the color, design, graphics or any other component to create a unique layout.
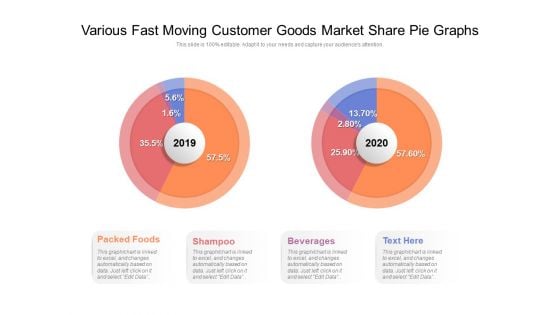
Various Fast Moving Customer Goods Market Share Pie Graphs Ppt PowerPoint Presentation Infographics Display PDF
Showcasing this set of slides titled various fast moving customer goods market share pie graphs ppt powerpoint presentation infographics display pdf. The topics addressed in these templates are packed foods, shampoo, beverages, 2019 to 2020. All the content presented in this PPT design is completely editable. Download it and make adjustments in color, background, font etc. as per your unique business setting.
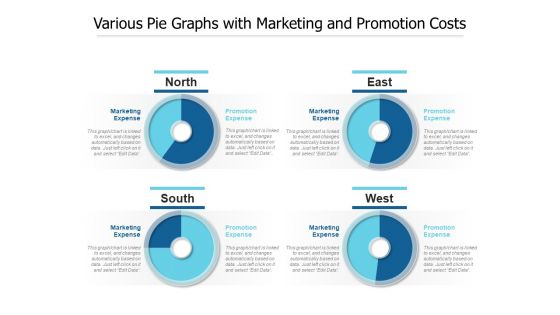
Various Pie Graphs With Marketing And Promotion Costs Ppt PowerPoint Presentation Summary Graphics Design PDF
Pitch your topic with ease and precision using this various pie graphs with marketing and promotion costs ppt powerpoint presentation summary graphics design pdf. This layout presents information on marketing expense, promotion expense. It is also available for immediate download and adjustment. So, changes can be made in the color, design, graphics or any other component to create a unique layout.
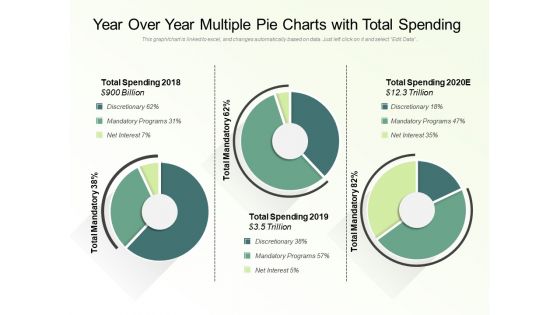
YOY Various Pie Graphs With Total Spending Ppt PowerPoint Presentation Ideas Gridlines PDF
Showcasing this set of slides titled yoy various pie graphs with total spending ppt powerpoint presentation ideas gridlines pdf. The topics addressed in these templates are total spending 2018, total mandatory, total spending 2019, total spending 2020. All the content presented in this PPT design is completely editable. Download it and make adjustments in color, background, font etc. as per your unique business setting.

Department Wise Employee Morale Scorecard With Bar Graphs Ppt Show Templates PDF
Deliver an awe inspiring pitch with this creative department wise employee morale scorecard with bar graphs ppt show templates pdf bundle. Topics like finance department, sales department, target can be discussed with this completely editable template. It is available for immediate download depending on the needs and requirements of the user.
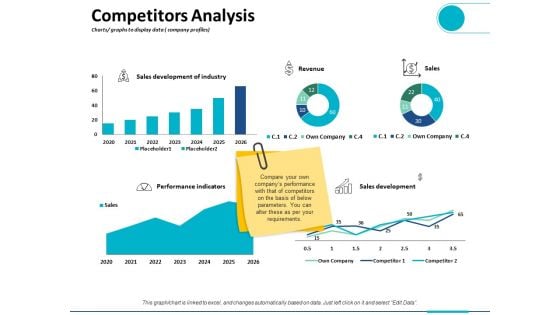
Competitors Analysis Charts Graphs To Display Data Company Profiles Ppt PowerPoint Presentation Outline Visual Aids
This is a competitors analysis charts graphs to display data company profiles ppt powerpoint presentation outline visual aids. This is a five stage process. The stages in this process are finance, analysis, business, investment, marketing.
Business Financial Disaster PowerPoint Icon Cc
Headlines of the bad business economy and economic disaster cutouts in various fonts and colors. There are also some charts and graphs. Coach your organization with our Business Financial Disaster PowerPoint Icon Cc. You will come out on top.
Business Financial Disaster PowerPoint Icon S
Headlines of the bad business economy and economic disaster cutouts in various fonts and colors. There are also some charts and graphs. Achieve performance reengineering with our Business Financial Disaster PowerPoint Icon S. They will make you look good.
Digital Marketing And Digital Analysis Graphs With Magnifying Glass Ppt PowerPoint Presentation Portfolio Show
This is a digital marketing and digital analysis graphs with magnifying glass ppt powerpoint presentation portfolio show. This is a seven stage process. The stages in this process are digital analytics, digital dashboard, marketing.
Business Sales Analysis Charts And Graphs Ppt PowerPoint Presentation File Deck PDF
Presenting business sales analysis charts and graphs ppt powerpoint presentation file deck pdf to dispense important information. This template comprises three stages. It also presents valuable insights into the topics including business sales analysis charts and graphs. This is a completely customizable PowerPoint theme that can be put to use immediately. So, download it and address the topic impactfully.
Operational Review Shown With Graphs And Charts Ppt PowerPoint Presentation Summary Examples PDF
Presenting this set of slides with name operational review shown with graphs and charts ppt powerpoint presentation summary examples pdf. This is a three stage process. The stages in this process are operational review shown with graphs and charts. This is a completely editable PowerPoint presentation and is available for immediate download. Download now and impress your audience.
Charts And Graphs For Business Analytics Ppt PowerPoint Presentation File Background Designs PDF
Presenting this set of slides with name charts and graphs for business analytics ppt powerpoint presentation file background designs pdf. The topics discussed in these slide is charts and graphs for business analytics. This is a completely editable PowerPoint presentation and is available for immediate download. Download now and impress your audience.
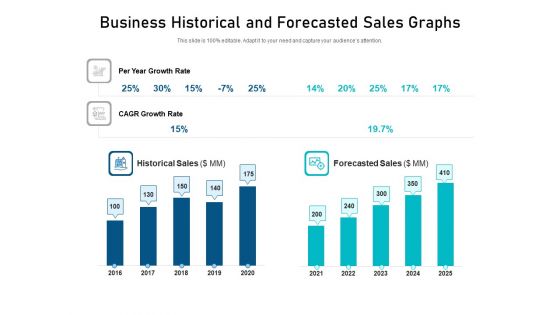
Business Historical And Forecasted Sales Graphs Ppt PowerPoint Presentation Ideas Themes PDF
Showcasing this set of slides titled business historical and forecasted sales graphs ppt powerpoint presentation ideas themes pdf. The topics addressed in these templates are business historical and forecasted sales graphs. All the content presented in this PPT design is completely editable. Download it and make adjustments in color, background, font etc. as per your unique business setting.
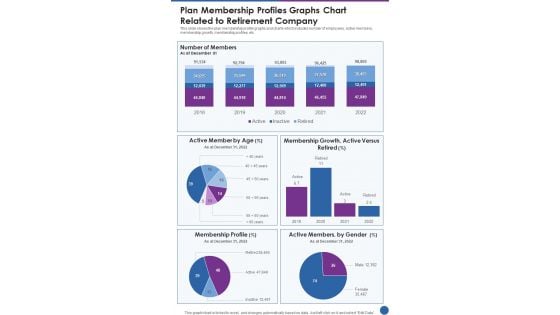
Plan Membership Profiles Graphs Chart Related To Retirement Company One Pager Documents
This slide shows the plan membership profile graphs and charts which includes number of employees, active members, membership growth, membership profiles, etc. Presenting you a fantastic Plan Membership Profiles Graphs Chart Related To Retirement Company One Pager Documents. This piece is crafted on hours of research and professional design efforts to ensure you have the best resource. It is completely editable and its design allow you to rehash its elements to suit your needs. Get this Plan Membership Profiles Graphs Chart Related To Retirement Company One Pager Documents A4 One-pager now.
Stock Photo Innovative Marketing Concepts Presentation Charts And Graphs Business Clipart
Put In A Dollop Of Our stock photo innovative marketing concepts presentation charts and graphs business clipart Powerpoint Templates. Give Your Thoughts A Distinctive Flavor. Create Your Domain With Our Success Powerpoint Templates. Rule Minds With Your Thoughts.
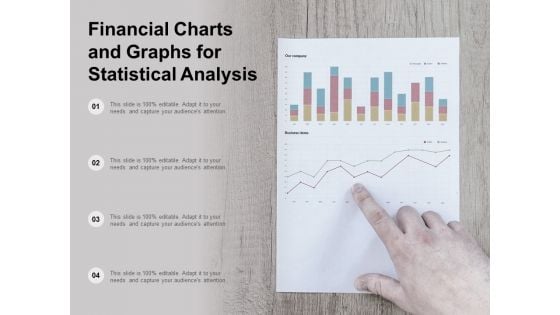
Financial Charts And Graphs For Statistical Analysis Ppt Powerpoint Presentation Show Layout
This is a financial charts and graphs for statistical analysis ppt powerpoint presentation show layout. This is a four stage process. The stages in this process are business metrics, business kpi, business dashboard.
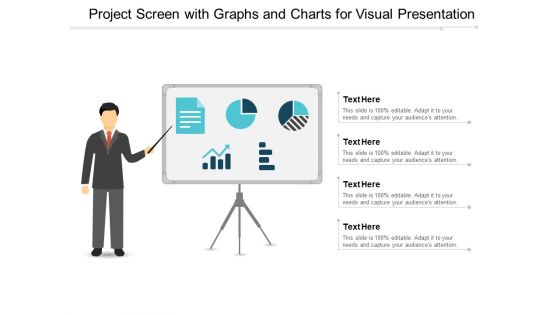
Project Screen With Graphs And Charts For Visual Presentation Ppt PowerPoint Presentation Gallery Design Inspiration
This is a project screen with graphs and charts for visual presentation ppt powerpoint presentation gallery design inspiration. This is a four stage process. The stages in this process are visual aids, communication, business.
Security KPI Dashboard With Various Charts And Graphs Ppt Summary Background Image PDF
Persuade your audience using this Security KPI Dashboard With Various Charts And Graphs Ppt Summary Background Image PDF. This PPT design covers three stages, thus making it a great tool to use. It also caters to a variety of topics including Various Charts, Security KPI Dashboard, Graphs. Download this PPT design now to present a convincing pitch that not only emphasizes the topic but also showcases your presentation skills.

Semantic Web Business Framework Advantages IT Knowledge Graphs The Next Reincarnation Themes PDF
This slide depicts the overview of knowledge graphs which are the next level of the semantic web, and they bring semantic web prototype to the workplace. It also includes that ontologies are used in business knowledge graphs for creating diverse conceptual models. Explore a selection of the finest Semantic Web Business Framework Advantages IT Knowledge Graphs The Next Reincarnation Themes PDF here. With a plethora of professionally designed and pre-made slide templates, you can quickly and easily find the right one for your upcoming presentation. You can use our Semantic Web Business Framework Advantages IT Knowledge Graphs The Next Reincarnation Themes PDF to effectively convey your message to a wider audience. Slidegeeks has done a lot of research before preparing these presentation templates. The content can be personalized and the slides are highly editable. Grab templates today from Slidegeeks.
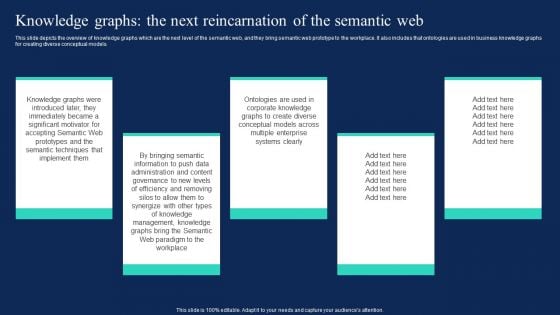
Knowledge Graphs The Next Reincarnation Of The Semantic Web Introduction PDF
This slide depicts the overview of knowledge graphs which are the next level of the semantic web, and they bring semantic web prototype to the workplace. It also includes that ontologies are used in business knowledge graphs for creating diverse conceptual models. Are you searching for a Knowledge Graphs The Next Reincarnation Of The Semantic Web Introduction PDF that is uncluttered, straightforward, and original Its easy to edit, and you can change the colors to suit your personal or business branding. For a presentation that expresses how much effort you have put in, this template is ideal With all of its features, including tables, diagrams, statistics, and lists, its perfect for a business plan presentation. Make your ideas more appealing with these professional slides. Download Knowledge Graphs The Next Reincarnation Of The Semantic Web Introduction PDF from Slidegeeks today.
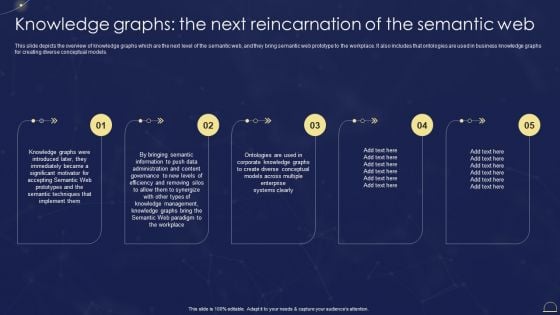
Semantic Web Technologies Knowledge Graphs The Next Reincarnation Of The Rules PDF
This slide depicts the overview of knowledge graphs which are the next level of the semantic web, and they bring semantic web prototype to the workplace. It also includes that ontologies are used in business knowledge graphs for creating diverse conceptual models. Whether you have daily or monthly meetings, a brilliant presentation is necessary. Semantic Web Technologies Knowledge Graphs The Next Reincarnation Of The Rules PDF can be your best option for delivering a presentation. Represent everything in detail using Semantic Web Technologies Knowledge Graphs The Next Reincarnation Of The Rules PDF and make yourself stand out in meetings. The template is versatile and follows a structure that will cater to your requirements. All the templates prepared by Slidegeeks are easy to download and edit. Our research experts have taken care of the corporate themes as well. So, give it a try and see the results.
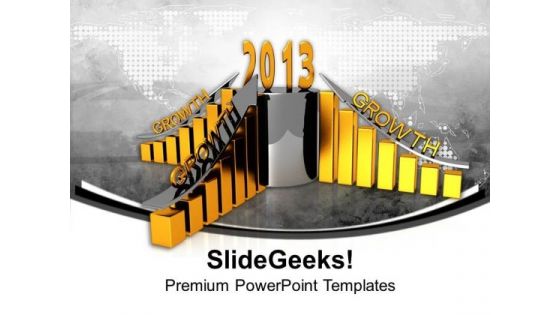
Bar Graphs 2013 Growth Flow Chart PowerPoint Templates Ppt Backgrounds For Slides 1212
We present our Bar Graphs 2013 Growth Flow Chart PowerPoint Templates PPT Backgrounds For Slides 1212.Download and present our Arrows PowerPoint Templates because it helps to inject your values into your group and see them bond to achieve success. Present our Process and flows PowerPoint Templates because this slide depicts the occasion for gifting and giving. Download and present our Marketing PowerPoint Templates because infrastructure growth is an obvious requirement of today.inform your group on how exactly this potential is tailor made for you. Present our Success PowerPoint Templates because iT outlines the entire thought process for the benefit of others. Tell it to the world with your characteristic aplomb. Download and present our Business PowerPoint Templates because this template helps you to grab the attention of your listeners.Use these PowerPoint slides for presentations relating to Year 2013 growth bar graphs chart, process and flows, arrows, marketing, business, success. The prominent colors used in the PowerPoint template are Yellow, Gray, Black. Professionals tell us our Bar Graphs 2013 Growth Flow Chart PowerPoint Templates PPT Backgrounds For Slides 1212 are specially created by a professional team with vast experience. They diligently strive to come up with the right vehicle for your brilliant Ideas. We assure you our bar PowerPoint templates and PPT Slides provide you with a vast range of viable options. Select the appropriate ones and just fill in your text. PowerPoint presentation experts tell us our Bar Graphs 2013 Growth Flow Chart PowerPoint Templates PPT Backgrounds For Slides 1212 are Elevated. Presenters tell us our process PowerPoint templates and PPT Slides are Pleasant. The feedback we get is that our Bar Graphs 2013 Growth Flow Chart PowerPoint Templates PPT Backgrounds For Slides 1212 are Endearing. You can be sure our bar PowerPoint templates and PPT Slides are Royal. Be a change agent with our Bar Graphs 2013 Growth Flow Chart PowerPoint Templates Ppt Backgrounds For Slides 1212. They will make you look good.
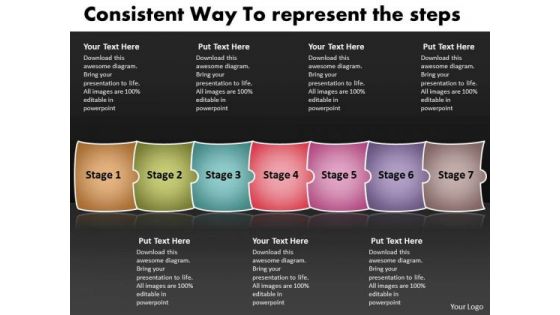
Consistent Way To Represent The Steps Graphs And Charts PowerPoint Slides
We present our consistent way to represent the steps graphs and charts PowerPoint Slides.Use our Business PowerPoint Templates because, You can Lead your flock steadily to greater heights. Look around at the vast potential of achievement around you Use our Puzzles or Jigsaws PowerPoint Templates because,our template will illustrate what you want to say. Use our Shapes PowerPoint Templates because,You are the Champion of your team shall anoint. Use our Boxes PowerPoint Templates because,The ideas and plans are on your finger tips. Use our Success PowerPoint Templates because,IT outlines the entire thought process for the benefit of others. Tell it to the world with your characteristic aplombUse these PowerPoint slides for presentations relating to account, arrow, arrows, away, box, business, chart, choice, choose, concept, concepts, consultation, corporate, design, diagram, direction, elements, flow, follow, follows, future, group, grow, increase, lines, many, month, report, rise, row, step, success, text, time, timeline, today, up, ways, work, year. The prominent colors used in the PowerPoint template are Brown, Green, Blue. People tell us our consistent way to represent the steps graphs and charts PowerPoint Slides will help you be quick off the draw. Just enter your specific text and see your points hit home. The feedback we get is that our arrows PowerPoint templates and PPT Slides are second to none. People tell us our consistent way to represent the steps graphs and charts PowerPoint Slides are Cheerful. Presenters tell us our chart PowerPoint templates and PPT Slides are Charming. The feedback we get is that our consistent way to represent the steps graphs and charts PowerPoint Slides are Pretty. Professionals tell us our away PowerPoint templates and PPT Slides are Exuberant. Prepare for the future with our Consistent Way To Represent The Steps Graphs And Charts PowerPoint Slides. Just download, type and present.
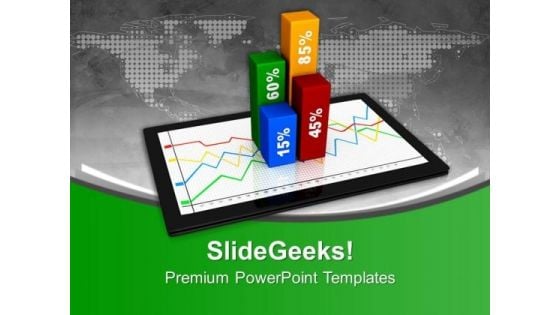
Business Chart And Graphs On Computer Tablet PowerPoint Templates Ppt Backgrounds For Slides 0113
We present our Business Chart And Graphs On Computer Tablet PowerPoint Templates PPT Backgrounds For Slides 0113.Download our Computer PowerPoint Templates because Our PowerPoint Templates and Slides are truly out of this world. Even the MIB duo has been keeping tabs on our team. Download our Pie charts PowerPoint Templates because It will get your audience in sync. Download and present our Marketing PowerPoint Templates because Our PowerPoint Templates and Slides will definately Enhance the stature of your presentation. Adorn the beauty of your thoughts with their colourful backgrounds. Download and present our Success PowerPoint Templates because It will Raise the bar of your Thoughts. They are programmed to take you to the next level. Download and present our Business PowerPoint Templates because Our PowerPoint Templates and Slides come in all colours, shades and hues. They help highlight every nuance of your views.Use these PowerPoint slides for presentations relating to computer tablet showing a spreadsheet with charts, computer, business, success, pie charts, marketing. The prominent colors used in the PowerPoint template are Green, Red, Gray. The feedback we get is that our Business Chart And Graphs On Computer Tablet PowerPoint Templates PPT Backgrounds For Slides 0113 are incredible easy to use. PowerPoint presentation experts tell us our charts PowerPoint templates and PPT Slides are readymade to fit into any presentation structure. Presenters tell us our Business Chart And Graphs On Computer Tablet PowerPoint Templates PPT Backgrounds For Slides 0113 effectively help you save your valuable time. PowerPoint presentation experts tell us our a PowerPoint templates and PPT Slides have awesome images to get your point across. The feedback we get is that our Business Chart And Graphs On Computer Tablet PowerPoint Templates PPT Backgrounds For Slides 0113 will make you look like a winner. Use our a PowerPoint templates and PPT Slides provide great value for your money. Be assured of finding the best projection to highlight your words. Enumerate your ideas with our Business Chart And Graphs On Computer Tablet PowerPoint Templates Ppt Backgrounds For Slides 0113. Prioritize them as per your wish.
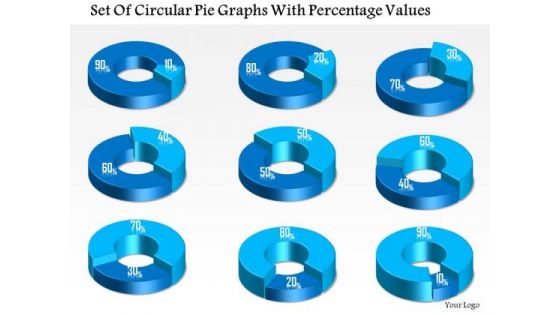
Business Diagram Set Of Circular Pie Graphs With Percentage Values Presentation Template
This business diagram displays set of pie charts. This Power Point template has been designed to compare and present business data. Download this diagram to represent stages of business growth.
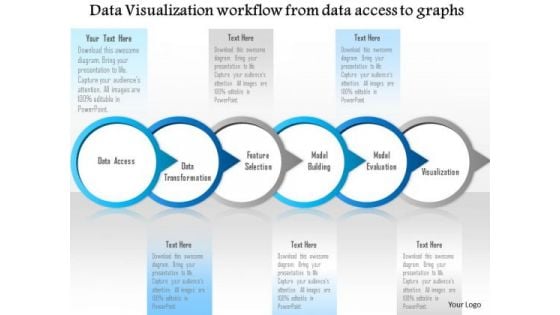
Business Diagram Data Visualization Workflow From Data Access To Graphs Ppt Slide
Graphic of workflow has been used to design this diagram. This diagram slide depicts the concept of data visualization from data access. This diagrams suitable for technology and internet related presentations.
Business Growth Success PowerPoint Icon S
Microsoft PowerPoint Template and Background with business graph with arrow showing profits and gains Look back with Business Growth Success PowerPoint Icon S. Analyse events and move ahead.
Increasing Costs Of Education PowerPoint Icon S
Cost of Education Increasing in 3d With Bar Graph Your thoughts will be engraved in the minds of your audience. Our Increasing Costs Of Education PowerPoint Icon S will etch them in.
Business Growth Success PowerPoint Icon C
Microsoft PowerPoint Template and Background with business graph with arrow showing profits and gains Unite your team with our Business Growth Success PowerPoint Icon C. Download without worries with our money back guaranteee.
Business Growth Success PowerPoint Icon Cc
Microsoft PowerPoint Template and Background with business graph with arrow showing profits and gains Your assessment will be the deciding factor. Help the audience figure it out with our Business Growth Success PowerPoint Icon Cc.
Business Growth Success PowerPoint Icon F
Microsoft PowerPoint Template and Background with business graph with arrow showing profits and gains Address eco-clubs with our Business Growth Success PowerPoint Icon F. Advocate curbing of carbon emissions.
Business Growth Success PowerPoint Icon R
Microsoft PowerPoint Template and Background with business graph with arrow showing profits and gains Create a better future with your thoughts. Move comfidently onwards with our Business Growth Success PowerPoint Icon R.
Benchmarking Ppt PowerPoint Presentation Icon Slide Download
This is a benchmarking ppt powerpoint presentation icon slide download. The topics discussed in this diagram are finance, marketing, management, investment, analysis. This is a completely editable PowerPoint presentation, and is available for immediate download.
Stacked Bar Ppt PowerPoint Presentation Icon Diagrams
Presenting this set of slides with name stacked bar ppt powerpoint presentation icon diagrams. The topics discussed in these slides are stacked bar. This is a completely editable PowerPoint presentation and is available for immediate download. Download now and impress your audience.
Bar Chart Ppt PowerPoint Presentation Icon Maker
Presenting this set of slides with name bar chart ppt powerpoint presentation icon maker. The topics discussed in these slide is bar chart . This is a completely editable PowerPoint presentation and is available for immediate download. Download now and impress your audience.
Financial Highlights Ppt PowerPoint Presentation Icon Templates
Presenting this set of slides with name financial highlights ppt powerpoint presentation icon templates. The topics discussed in these slides are profit, loss. This is a completely editable PowerPoint presentation and is available for immediate download. Download now and impress your audience.
Stacked Column Ppt PowerPoint Presentation Icon Styles
Presenting this set of slides with name stacked column ppt powerpoint presentation icon styles. The topics discussed in these slide is stacked column. This is a completely editable PowerPoint presentation and is available for immediate download. Download now and impress your audience.
Stacked Bar Ppt PowerPoint Presentation Icon Show
Presenting this set of slides with name stacked bar ppt powerpoint presentation icon show. The topics discussed in these slide is stacked bar. This is a completely editable PowerPoint presentation and is available for immediate download. Download now and impress your audience.
Clustered Bar Ppt PowerPoint Presentation Icon Smartart
Presenting this set of slides with name clustered bar ppt powerpoint presentation icon smartart. The topics discussed in these slide is clustered bar. This is a completely editable PowerPoint presentation and is available for immediate download. Download now and impress your audience.
Clustered Bar Ppt PowerPoint Presentation Icon Infographics
Presenting this set of slides with name clustered bar ppt powerpoint presentation icon infographics. The topics discussed in these slide is clustered bar. This is a completely editable PowerPoint presentation and is available for immediate download. Download now and impress your audience.
CRM Dashboard Ppt Icon Master Slide PDF
Deliver an awe inspiring pitch with this creative crm dashboard ppt icon master slide pdf bundle. Topics like dashboard can be discussed with this completely editable template. It is available for immediate download depending on the needs and requirements of the user.
Client Management Dashboard Ppt Show Icon PDF
Deliver and pitch your topic in the best possible manner with this client management dashboard ppt show icon pdf. Use them to share invaluable insights on devices by ownership, devices by os version, devices by model, account details, devices enrolled, devices and impress your audience. This template can be altered and modified as per your expectations. So, grab it now.
Introduce Yourself Dashboard Ppt Styles Icon PDF
Deliver and pitch your topic in the best possible manner with this introduce yourself dashboard ppt styles icon pdf. Use them to share invaluable insights on dashboard and impress your audience. This template can be altered and modified as per your expectations. So, grab it now.
Market Research Steps Dashboard Icon Brochure PDF
Pitch your topic with ease and precision using this Market Research Steps Dashboard Icon Brochure PDF. This layout presents information on Market Research, Steps, Dashboard. It is also available for immediate download and adjustment. So, changes can be made in the color, design, graphics or any other component to create a unique layout.
Marketing Successful Competitor Analysis Icon Formats PDF
Pitch your topic with ease and precision using this Marketing Successful Competitor Analysis Icon Formats PDF. This layout presents information on Marketing Successful, Competitor, Analysis. It is also available for immediate download and adjustment. So, changes can be made in the color, design, graphics or any other component to create a unique layout.
Strategic Performance Evaluation Reporting Icon Sample PDF
Showcasing this set of slides titled Strategic Performance Evaluation Reporting Icon Sample PDF. The topics addressed in these templates are Strategic Performance, Evaluation, Reporting. All the content presented in this PPT design is completely editable. Download it and make adjustments in color, background, font etc. as per your unique business setting.
Online Marketing Campaign Analysis Icon Portrait PDF
Showcasing this set of slides titled Online Marketing Campaign Analysis Icon Portrait PDF. The topics addressed in these templates are Online Marketing, Campaign, Analysis. All the content presented in this PPT design is completely editable. Download it and make adjustments in color, background, font etc. as per your unique business setting.
Comprehensive Value Proposition Analysis Icon Slides PDF
Showcasing this set of slides titled Comprehensive Value Proposition Analysis Icon Slides PDF. The topics addressed in these templates are Comprehensive Value, Proposition, Analysis. All the content presented in this PPT design is completely editable. Download it and make adjustments in color, background, font etc. as per your unique business setting.
Cart Recovery Dashboard Ppt Outline Icon PDF
Measure which email campaigns brought the most recovery, which age group responded the best, and other KPIs via a dashboard. Deliver an awe-inspiring pitch with this creative cart recovery dashboard ppt outline icon pdf bundle. Topics like recovery by the numbers, recovery breakdown, revenue per email rpe can be discussed with this completely editable template. It is available for immediate download depending on the needs and requirements of the user.
Customer Retention Rate Ppt Icon Elements PDF
Customer Retention Rate measures how many customers continue to be customers in the subsequent year. You get to know if your retention strategies are working or not. Deliver an awe-inspiring pitch with this creative customer retention rate ppt icon elements pdf bundle. Topics like customer retention rate can be discussed with this completely editable template. It is available for immediate download depending on the needs and requirements of the user.
Dashboard Employee Attrition Rate Icon Slides PDF
This slide shows the dashboard related to the growth in attrition rate of the employees in the company. Deliver and pitch your topic in the best possible manner with this dashboard employee attrition rate icon slides pdf. Use them to share invaluable insights on dashboard employee attrition rate and impress your audience. This template can be altered and modified as per your expectations. So, grab it now.
Product Manufacturing Dashboards Ppt Icon Inspiration PDF
Following slide shows product manufacturing dashboard. This includes production rate, overall productivity, unit loss and operators availability status.Deliver and pitch your topic in the best possible manner with this product manufacturing dashboards ppt icon inspiration pdf. Use them to share invaluable insights on overall plant productivity, overall productivity, productivity and impress your audience. This template can be altered and modified as per your expectations. So, grab it now.
Icon For Investment Risk Analysis Infographics PDF
Application Performance Dashboard Ppt Icon Template PDF
This slide covers application performance in market KPIs and metrics such as impressions, clicks, searches for app, conversion rate etc. This Application Performance Dashboard Ppt Icon Template PDF from Slidegeeks makes it easy to present information on your topic with precision. It provides customization options, so you can make changes to the colors, design, graphics, or any other component to create a unique layout. It is also available for immediate download, so you can begin using it right away. Slidegeeks has done good research to ensure that you have everything you need to make your presentation stand out. Make a name out there for a brilliant performance.
Clustered Chart Ppt PowerPoint Presentation Gallery Icon
Presenting this set of slides with name area Clustered Chart Ppt PowerPoint Presentation Gallery Icon. The topics discussed in these slide is Clustered Chart. This is a completely editable PowerPoint presentation and is available for immediate download. Download now and impress your audience.
Stacked Chart Ppt PowerPoint Presentation Summary Icon
Presenting this set of slides with name stacked chart ppt powerpoint presentation summary icon. The topics discussed in these slide is stacked chart. This is a completely editable PowerPoint presentation and is available for immediate download. Download now and impress your audience.
Task Distribution Ppt PowerPoint Presentation Pictures Icon
Presenting this set of slides with name task distribution ppt powerpoint presentation pictures icon. The topics discussed in these slide is task distribution. This is a completely editable PowerPoint presentation and is available for immediate download. Download now and impress your audience.
Business Data Insights Report Icon Download PDF
Showcasing this set of slides titled Business Data Insights Report Icon Download PDF. The topics addressed in these templates are Business, Data Insights, Report. All the content presented in this PPT design is completely editable. Download it and make adjustments in color, background, font etc. as per your unique business setting.
Line Chart Ppt PowerPoint Presentation Icon Elements
This is a line chart ppt powerpoint presentation icon elements. This is a two stage process. The stages in this process are line graph, marketing, presentation, business, management.
Area Chart Ppt PowerPoint Presentation Icon Gallery
This is a area chart ppt powerpoint presentation icon gallery. This is a two stage process. The stages in this process are sales in percentage, product, bar graph.
Stacked Column Ppt PowerPoint Presentation Icon Samples
This is a stacked column ppt powerpoint presentation icon samples. This is a nine stage process. The stages in this process are bar graph, business, marketing, success, growth.
Stacked Column Ppt PowerPoint Presentation Icon Slides
This is a stacked column ppt powerpoint presentation icon slides. This is a two stage process. The stages in this process are profit, business, marketing, graph, growth.
Clustered Bar Ppt PowerPoint Presentation Icon Images
This is a clustered bar ppt powerpoint presentation icon images. This is a three stage process. The stages in this process are unit count, finance, marketing, graph, business.
Clustered Bar Ppt PowerPoint Presentation Icon Background
This is a clustered bar ppt powerpoint presentation icon background. This is a three stage process. The stages in this process are business, unit count, marketing, graph, finance.
Stacked Bar Ppt PowerPoint Presentation Icon Deck
This is a stacked bar ppt powerpoint presentation icon deck. This is a three stage process. The stages in this process are business, unit count, marketing, strategy, graph.
Bar Chart Ppt PowerPoint Presentation Icon Information
This is a bar chart ppt powerpoint presentation icon information. This is a one stage process. The stages in this process are product, sales in percentage, financial years, bar graph, growth.
Bar Chart Ppt PowerPoint Presentation Icon Introduction
This is a bar chart ppt powerpoint presentation icon introduction. This is a seven stage process. The stages in this process are in years, in percentage, business, marketing, graph.
Column Chart Ppt PowerPoint Presentation Icon Guide
This is a column chart ppt powerpoint presentation icon guide. This is a two stage process. The stages in this process are business, year, sales in percentage, marketing, graph.
Area Chart Ppt PowerPoint Presentation Icon Aids
This is a area chart ppt powerpoint presentation icon aids. This is a three stage process. The stages in this process are financial years, sales in percentage, business, marketing, graph.
Stacked Line Ppt PowerPoint Presentation Icon Professional
This is a stacked line ppt powerpoint presentation icon professional. This is a three stage process. The stages in this process are Business, Financial, Marketing, Graph, Strategy Revenue In Percentage.
Pie Chart Ppt PowerPoint Presentation Icon Templates
This is a pie chart ppt powerpoint presentation icon templates. This is a four stage process. The stages in this process are chart, percentage, business, marketing, process.
Radar Chart Ppt PowerPoint Presentation Icon Picture
This is a radar chart ppt powerpoint presentation icon picture. This is a two stage process. The stages in this process are chart, finance, marketing, business, strategy.
Radar Chart Ppt PowerPoint Presentation Icon Files
This is a radar chart ppt powerpoint presentation icon files. This is a three stage process. The stages in this process are chart, business, marketing, finance, strategy.
Area Chart Ppt PowerPoint Presentation Icon Elements
This is a area chart ppt powerpoint presentation icon elements. This is a two stage process. The stages in this process are area chart, finance, marketing, analysis, business.
Stock Chart Ppt PowerPoint Presentation Icon Rules
This is a stock chart ppt powerpoint presentation icon rules. This is a two stage process. The stages in this process are stock chart, finance, analysis, business, marketing.
Area Chart Ppt PowerPoint Presentation Icon Mockup
This is a area chart ppt powerpoint presentation icon mockup. This is a two stage process. The stages in this process are area chart, finance, marketing, strategy, business.
Radar Chart Ppt PowerPoint Presentation Icon Show
This is a radar chart ppt powerpoint presentation icon show. This is a two stage process. The stages in this process are business, financials, marketing, chart, strategy.
Radar Chart Ppt PowerPoint Presentation Icon Format
This is a radar chart ppt powerpoint presentation icon format. This is a two stage process. The stages in this process are business, radar chart, finance, strategy, years.
Bubble Chart Ppt PowerPoint Presentation Icon Gridlines
This is a bubble chart ppt powerpoint presentation icon gridlines. This is a two stage process. The stages in this process are bubble chart, finance, marketing, strategy, analysis.
Area Chart Ppt PowerPoint Presentation Icon Deck
This is a area chart ppt powerpoint presentation icon deck. This is a two stage process. The stages in this process are area chart, finance, marketing, strategy, business.
Area Chart Ppt PowerPoint Presentation Icon Designs
This is a area chart ppt powerpoint presentation icon designs. This is a two stage process. The stages in this process are business, marketing, strategy, finance, growth.
Radar Chart Ppt PowerPoint Presentation Icon Skills
This is a radar chart ppt powerpoint presentation icon skills. This is a three stage process. The stages in this process are radar, business, marketing, strategy, planning.
Pie Chart Ppt PowerPoint Presentation Icon Outline
This is a pie chart ppt powerpoint presentation icon outline. This is a four stage process. The stages in this process are pie, process, percentage, product, business.
Line Chart Ppt PowerPoint Presentation Icon Inspiration
This is a line chart ppt powerpoint presentation icon inspiration. This is a two stage process. The stages in this process are product, financial years, sales in percentage.
Pie Chart Ppt PowerPoint Presentation Icon Clipart
This is a pie chart ppt powerpoint presentation icon clipart. This is a four stage process. The stages in this process are finance, marketing, management, investment, analysis.
Area Chart Ppt PowerPoint Presentation Icon Smartart
This is a area chart ppt powerpoint presentation icon smartart. This is a two stage process. The stages in this process are percentage, product, business, marketing.
Hierarchy Ppt PowerPoint Presentation Icon Pictures
This is a hierarchy ppt powerpoint presentation icon pictures. This is a four stage process. The stages in this process are business, marketing, management, hierarchy, chart.
Hierarchy Ppt PowerPoint Presentation Icon Deck
This is a hierarchy ppt powerpoint presentation icon deck. This is a three stage process. The stages in this process are business, Hierarchy, marketing, step, Management.
Hierarchy Ppt PowerPoint Presentation Icon Graphics Download
This is a hierarchy ppt powerpoint presentation icon graphics download. This is a three stage process. The stages in this process are hierarchy, business, marketing, strategy, management.
Clustered Bar Ppt PowerPoint Presentation Icon Slides
This is a clustered bar ppt powerpoint presentation icon slides. This is a two stage process. The stages in this process are profit, business, marketing, finance, chart.
Liquidity Ratios Ppt PowerPoint Presentation Icon Slides
This is a liquidity ratios ppt powerpoint presentation icon slides. This is a two stage process. The stages in this process are business, finance, marketing, analysis, investment.
Scatter Line Ppt PowerPoint Presentation Icon Ideas
This is a scatter line ppt powerpoint presentation icon ideas. This is a nine stage process. The stages in this process are business, marketing, strategy, planning, finance.
Clustered Column Ppt PowerPoint Presentation Icon Demonstration
This is a clustered column ppt powerpoint presentation icon demonstration. This is a two stage process. The stages in this process are clustered column, finance, marketing, strategy, business.
Stacked Bar Ppt PowerPoint Presentation Icon Objects
This is a stacked bar ppt powerpoint presentation icon objects. This is a two stage process. The stages in this process are stacked bar, finance, analysis, marketing, strategy.
Clustered Bar Ppt PowerPoint Presentation Icon Elements
This is a clustered bar ppt powerpoint presentation icon elements. This is a three stage process. The stages in this process are business, marketing, strategy, planning, finance.
Pie Ppt PowerPoint Presentation Icon Designs Download
This is a pie ppt powerpoint presentation icon designs download. This is a four stage process. The stages in this process are pie, growth, finance, business, percentage.
Clustered Bar Ppt PowerPoint Presentation Icon Example
This is a clustered bar ppt powerpoint presentation icon example. This is a two stage process. The stages in this process are finance, investment, analysis, business, marketing.
Histogram Ppt PowerPoint Presentation Icon Images
This is a histogram ppt powerpoint presentation icon images. This is a one stage process. The stages in this process are product, percentage, marketing, business.
Executive Summary Ppt PowerPoint Presentation Icon Visuals
This is a executive summary ppt powerpoint presentation icon visuals. This is a four stage process. The stages in this process are finance, marketing, management, investment, analysis.
Market Potential Ppt PowerPoint Presentation Icon Influencers
This is a market potential ppt powerpoint presentation icon influencers. This is a six stage process. The stages in this process are percentage, product, management, marketing, business.
Financial Percentage Ppt PowerPoint Presentation Icon Templates
This is a financial percentage ppt powerpoint presentation icon templates. This is a three stage process. The stages in this process are business, marketing, management, financial.
Dashboard Finance Ppt PowerPoint Presentation Icon Aids
This is a dashboard finance ppt powerpoint presentation icon aids. This is a three stage process. The stages in this process are dashboard, finance, analysis, business, investment.
Project Swot Prioritization Structure Icon Themes PDF
Presenting Project Swot Prioritization Structure Icon Themes PDF to dispense important information. This template comprises four stages. It also presents valuable insights into the topics including Project Swot, Prioritization Structure Icon. This is a completely customizable PowerPoint theme that can be put to use immediately. So, download it and address the topic impactfully.
Organizational Administration Structure Icon Rules PDF
Presenting organizational administration structure icon rules pdf to dispense important information. This template comprises three stages. It also presents valuable insights into the topics including organizational administration structure icon. This is a completely customizable PowerPoint theme that can be put to use immediately. So, download it and address the topic impactfully.
Organizational Leadership Style Matrix Icon Portrait PDF
Presenting Organizational Leadership Style Matrix Icon Portrait PDF to dispense important information. This template comprises four stages. It also presents valuable insights into the topics including Organizational Leadership Style, Matrix Icon. This is a completely customizable PowerPoint theme that can be put to use immediately. So, download it and address the topic impactfully.
Business Development Procedural Flow Icon Topics PDF
Persuade your audience using this Business Development Procedural Flow Icon Topics PDF. This PPT design covers three stages, thus making it a great tool to use. It also caters to a variety of topics including Business Development, Procedural Flow Icon. Download this PPT design now to present a convincing pitch that not only emphasizes the topic but also showcases your presentation skills.
Hierarchy Ppt PowerPoint Presentation Icon Skills
This is a hierarchy ppt powerpoint presentation icon skills. This is a three stage process. The stages in this process are jane star, alex hall, tomas cross, janna doe, jack stouts.
Activity Ratios Ppt PowerPoint Presentation Icon Themes
This is a activity ratios ppt powerpoint presentation icon themes. This is a two stage process. The stages in this process are inventory turnover, cogs, average inventory, receivable turnover, net credit sales, average accounts receivable .
Bar Chart Ppt PowerPoint Presentation Icon Layout
This is a bar chart ppt powerpoint presentation icon layout. This is a one stage process. The stages in this process are sales in percentage, financial years, bar chart, finance, marketing.
Bar Chart Ppt PowerPoint Presentation Icon Inspiration
This is a bar chart ppt powerpoint presentation icon inspiration. This is a three stage process. The stages in this process are bar chart, finance, marketing, strategy, analysis, business.
Area Chart Ppt PowerPoint Presentation Icon Summary
This is a area chart ppt powerpoint presentation icon summary. This is a two stage process. The stages in this process are financial year, area chart, in percentage, product.
Scatter Chart Ppt PowerPoint Presentation Icon Smartart
This is a scatter chart ppt powerpoint presentation icon smartart. This is a one stage process. The stages in this process are scatter chart, finance, business, planning, marketing, management.
Hierarchy Ppt PowerPoint Presentation Icon Backgrounds
This is a hierarchy ppt powerpoint presentation icon backgrounds. This is a four stage process. The stages in this process are manager, sales managers, sales members, team leader, team members.
Clustered Bar Ppt PowerPoint Presentation Icon Professional
This is a clustered bar ppt powerpoint presentation icon professional. This is a two stage process. The stages in this process are business, marketing, profit, clustered bar, finance, strategy.
Retail Competition Ppt PowerPoint Presentation Icon Microsoft
This is a retail competition ppt powerpoint presentation icon microsoft. This is a six stage process. The stages in this process are customer service, shipping speed, product quality, price, product fidelity.
Copyright Symbol PowerPoint Slides Icon Graphics
Copyright Symbol PowerPoint Slides Icon Graphics-These high quality, editable pre-designed powerpoint slides have been carefully created by our professional team to help you impress your audience. Each graphic in every slide is vector based and is 100% editable in powerpoint. Each and every property of any slide - color, size, shading etc can be modified to build an effective powerpoint presentation. Use these slides to convey complex business concepts in a simplified manner. Any text can be entered at any point in the powerpoint slide. Simply DOWNLOAD, TYPE and PRESENT! Your efforts will never fall short. Our Copyright Symbol PowerPoint Slides Icon Graphics keep you above the bar.
Corporate Governance Team Structure Icon Themes PDF
Presenting corporate governance team structure icon themes pdf to provide visual cues and insights. Share and navigate important information on two stages that need your due attention. This template can be used to pitch topics like team structure. In addtion, this PPT design contains high resolution images, graphics, etc, that are easily editable and available for immediate download.
Line Chart Ppt PowerPoint Presentation Gallery Icon
This is a line chart ppt powerpoint presentation gallery icon. This is a two stage process. The stages in this process are business, marketing, line, graph, success.
Bar Chart Ppt PowerPoint Presentation Infographics Icon
This is a bar chart ppt powerpoint presentation infographics icon. This is a three stage process. The stages in this process are product, bar graph, success, business, growth.
Clustered Column Ppt PowerPoint Presentation Icon Professional
This is a clustered column ppt powerpoint presentation icon professional. This is a two stage process. The stages in this process are product, business, marketing, finance, planning, graph.
Finance Manager Vector Icon Ppt PowerPoint Presentation Professional Structure PDF
Presenting this set of slides with name finance manager vector icon ppt powerpoint presentation professional structure pdf. This is a one stage process. The stage in this process is finance manager vector icon with bar graph and gear. This is a completely editable PowerPoint presentation and is available for immediate download. Download now and impress your audience.
Brand Quality Ppt PowerPoint Presentation Professional Icon
This is a brand quality ppt powerpoint presentation professional icon. This is a three stage process. The stages in this process are reason to buy, differentiation positioning, premium price, business, icons.
Area Chart Ppt PowerPoint Presentation Icon Microsoft
This is a area chart ppt powerpoint presentation icon microsoft. This is a two stage process. The stages in this process are business, strategy, analysis, planning, area chart.
Combo Chart Ppt PowerPoint Presentation Icon Portrait
This is a combo chart ppt powerpoint presentation icon portrait. This is a three stage process. The stages in this process are combo chart, finance, marketing, strategy, analysis.
Radar Chart Ppt PowerPoint Presentation Show Icon
This is a radar chart ppt powerpoint presentation show icon. This is a two stage process. The stages in this process are radar chart, finance, marketing, strategy, business.
Bubble Chart Ppt PowerPoint Presentation Outline Icon
This is a bubble chart ppt powerpoint presentation outline icon. This is a two stage process. The stages in this process are bubble chart, finance, marketing, strategy, business.
Pie Chart Ppt PowerPoint Presentation Outline Icon
This is a pie chart ppt powerpoint presentation outline icon. This is a four stage process. The stages in this process are pie, process, percentage, finance, business.
Radar Chart Ppt PowerPoint Presentation Slides Icon
This is a radar chart ppt powerpoint presentation slides icon. This is a two stage process. The stages in this process are business, marketing, growth, success, radar.
Organizational Structure Ppt PowerPoint Presentation File Icon
This is a organizational structure ppt powerpoint presentation file icon. This is a two stage process. The stages in this process are manager, director marketing, director sales, employee.
Comparison Ppt PowerPoint Presentation Icon Guide
This is a comparison ppt powerpoint presentation icon guide. This is a four stage process. The stages in this process are business, marketing, planning, strategy, finance.
Cost Per Employee Ppt PowerPoint Presentation Icon
This is a cost per employee ppt powerpoint presentation icon. This is a six stage process. The stages in this process are business, marketing, growth, success, costing.
Liquidity Ratios Ppt PowerPoint Presentation Model Icon
This is a liquidity ratios ppt powerpoint presentation model icon. This is a two stage process. The stages in this process are finance, analysis, compere, business, marketing.
Dashboard Ppt PowerPoint Presentation Infographics Icon
This is a dashboard ppt powerpoint presentation infographics icon. This is a two stage process. The stages in this process are low, medium, dashboard, planning, business.
Area Chart Ppt PowerPoint Presentation Ideas Icon
This is a area chart ppt powerpoint presentation ideas icon. This is a two stage process. The stages in this process are product, area chart, sales in percentage, growth, success.
Motivating And Managing Employees Layout Ppt Icon
This is a motivating and managing employees layout ppt icon. This is a seven stage process. The stages in this process are setting goals, measuring performance, quality, excellent, leadership, motivation, performance, motivating and managing employees.
Growth Strategy Ppt PowerPoint Presentation Layouts Icon
This is a growth strategy ppt powerpoint presentation layouts icon. This is a three stage process. The stages in this process are marketing and sales, customer service, product development.
Activity Based Costing Ppt Diagram Ppt Icon
This is a activity based costing ppt diagram ppt icon. This is a eight stage process. The stages in this process are expenses by department, costs of activities by department, identify activities and activity pools, prepare reports, resource drivers, activity drivers, assign costs to cost objects, costs object costs.
Department Information Ppt PowerPoint Presentation Icon Skills
This is a department information ppt powerpoint presentation icon skills. This is a four stage process. The stages in this process are ceo, director marketing, director sales, manager, employee.
Column Chart Ppt PowerPoint Presentation Summary Icon
This is a column chart ppt powerpoint presentation summary icon. This is a two stage process. The stages in this process are column chart, dollars, product.
Annual Run Rate Ppt PowerPoint Presentation Icon
This is a annual run rate ppt powerpoint presentation icon. This is a four stage process. The stages in this process are annual run rate, product.
Key Financials Template Ppt PowerPoint Presentation Icon
This is a key financials template ppt powerpoint presentation icon. This is a three stage process. The stages in this process are business, finance, marketing, strategy, success, analysis.
Combo Chart Ppt PowerPoint Presentation Icon Rules
This is a combo chart ppt powerpoint presentation icon rules. This is a ten stage process. The stages in this process are cumulative, value, sales, graph, business.
Internal Analysis Ppt PowerPoint Presentation Icon Outline
This is a internal analysis ppt powerpoint presentation icon outline. This is a four stage process. The stages in this process are finance, graph, business, marketing.
Growth Team Ppt PowerPoint Presentation Icon Topics
This is a growth team ppt powerpoint presentation icon topics. This is a five stage process. The stages in this process are bar graph, growth, success, business, marketing.
Factors Affecting Market Demand With Icons Ppt PowerPoint Presentation Gallery Icon PDF
Presenting this set of slides with name financial report with rule of supply graph ppt powerpoint presentation file background designs pdf. This is a six stage process. The stages in this process are business, monopoly, agricultural. This is a completely editable PowerPoint presentation and is available for immediate download. Download now and impress your audience.
Column Chart Ppt PowerPoint Presentation Icon Show
This is a column chart ppt powerpoint presentation icon show. This is a two stage process. The stages in this process are column chart, product, years, bar graph, growth.
Bar Chart Ppt PowerPoint Presentation Icon Demonstration
This is a bar chart ppt powerpoint presentation icon demonstration. This is a seven stage process. The stages in this process are product, sales in percentage, financial year, graph.
Combo Chart Ppt PowerPoint Presentation Icon Slide
This is a combo chart ppt powerpoint presentation icon slide. This is a three stage process. The stages in this process are growth rate, market size, graph, business, marketing.
Clustered Column Ppt PowerPoint Presentation Icon Objects
This is a clustered column ppt powerpoint presentation icon objects. This is a two stage process. The stages in this process are clustered column, product, growth, finance, bar graph.
Coordinated Criminal Botnet Attack Icon Structure PDF
Showcasing this set of slides titled Coordinated Criminal Botnet Attack Icon Structure PDF. The topics addressed in these templates are Coordinated Criminal, Botnet Attack Icon. All the content presented in this PPT design is completely editable. Download it and make adjustments in color, background, font etc. as per your unique business setting.
Employee Performance Progress Scorecard Icon Diagrams PDF
Showcasing this set of slides titled Employee Performance Progress Scorecard Icon Diagrams PDF. The topics addressed in these templates are Manager Training, Incomplete, Project Coordinator. All the content presented in this PPT design is completely editable. Download it and make adjustments in color, background, font etc. as per your unique business setting.
Communication And Coordination Framework Ppt Icon
This is a communication and coordination framework ppt icon. This is a four stage process. The stages in this process are workflow tools, quality, reporting, communication, technology.
Dashboard Related To The Company Products And Operations Icon Ppt Icon Model PDF
Deliver an awe inspiring pitch with this creative dashboard related to the company products and operations icon ppt icon model pdf bundle. Topics like pricing variance, overview of product, product logo can be discussed with this completely editable template. It is available for immediate download depending on the needs and requirements of the user.
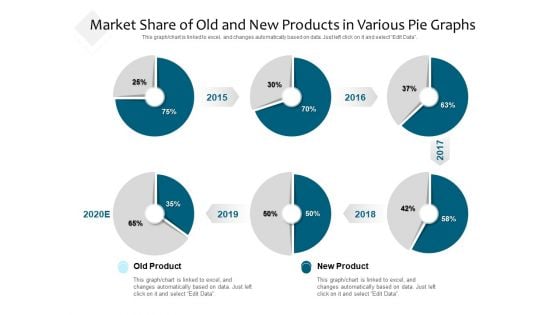
Market Share Of Old And New Products In Various Pie Graphs Ppt PowerPoint Presentation Styles Example PDF
Showcasing this set of slides titled market share of old and new products in various pie graphs ppt powerpoint presentation styles example pdf. The topics addressed in these templates are old product, new product, 2015 to 2020. All the content presented in this PPT design is completely editable. Download it and make adjustments in color, background, font etc. as per your unique business setting.
Business Team Structure Icon With Manager And Employees Ppt PowerPoint Presentation Icon Outline PDF
Presenting business team structure icon with manager and employees ppt powerpoint presentation icon outline pdf to dispense important information. This template comprises three stages. It also presents valuable insights into the topics including business team structure icon with manager and employees. This is a completely customizable PowerPoint theme that can be put to use immediately. So, download it and address the topic impactfully.
Business Diagram Battery Icon With Power Icons Energy Technology PowerPoint Slide
This business diagram displays battery icon with power charging. Use this diagram, in your presentations to display energy saving, battery and technology. Create professional presentations using this diagram slide.
Eight Techniques Of Coordination With Icons Ppt Powerpoint Presentation Icon Inspiration
Presenting this set of slides with name eight techniques of coordination with icons ppt powerpoint presentation icon inspiration. This is a eight stage process. The stages in this process are coordination, management, business. This is a completely editable PowerPoint presentation and is available for immediate download. Download now and impress your audience.
Emoji Icon Anxiety Reflecting Emotion Icon Ppt PowerPoint Presentation Complete Deck
Share a great deal of information on the topic by deploying this emoji icon anxiety reflecting emotion icon ppt powerpoint presentation complete deck. Support your ideas and thought process with this prefabricated set. It includes a set of eleven slides, all fully modifiable and editable. Each slide can be restructured and induced with the information and content of your choice. You can add or remove large content boxes as well, to make this PPT slideshow more personalized. Its high-quality graphics and visuals help in presenting a well-coordinated pitch. This PPT template is also a resourceful tool to take visual cues from and implement the best ideas to help your business grow and expand. The main attraction of this well-formulated deck is that everything is editable, giving you the freedom to adjust it to your liking and choice. Changes can be made in the background and theme as well to deliver an outstanding pitch. Therefore, click on the download button now to gain full access to this multifunctional set.
School Kids Icon Silhouette Volleyball Icon Ppt PowerPoint Presentation Complete Deck
Share a great deal of information on the topic by deploying this school kids icon silhouette volleyball icon ppt powerpoint presentation complete deck. Support your ideas and thought process with this prefabricated set. It includes a set of twelve slides, all fully modifiable and editable. Each slide can be restructured and induced with the information and content of your choice. You can add or remove large content boxes as well, to make this PPT slideshow more personalized. Its high-quality graphics and visuals help in presenting a well-coordinated pitch. This PPT template is also a resourceful tool to take visual cues from and implement the best ideas to help your business grow and expand. The main attraction of this well-formulated deck is that everything is editable, giving you the freedom to adjust it to your liking and choice. Changes can be made in the background and theme as well to deliver an outstanding pitch. Therefore, click on the download button now to gain full access to this multifunctional set.
Data And Analytics Planning Ppt PowerPoint Presentation Model Icon
This is a data and analytics planning ppt powerpoint presentation model icon. This is a ten stage process. The stages in this process are graph analytics, journey sciences, augmented reality, hyper personalisation, behavioural analytics.
Cash Performance Highlights With Turnover Rate Ppt Ideas Icon PDF
This graph or chart is linked to excel, and changes automatically based on data. Just left click on it and select Edit Data. Pitch your topic with ease and precision using this Cash Performance Highlights With Turnover Rate Ppt Ideas Icon PDF. This layout presents information on Working Capital, Cash Balance, Current Ratio. It is also available for immediate download and adjustment. So, changes can be made in the color, design, graphics or any other component to create a unique layout.
Decline In Rural Insurance Penetration Ppt Icon Layout Ideas PDF
This slide shows the graph that represents the decline in rural insurance penetration rate in percent and the key intakes and forecasted decline mark. Deliver and pitch your topic in the best possible manner with this decline in rural insurance penetration ppt icon layout ideas pdf. Use them to share invaluable insights on decline in rural insurance penetration, 2016 to 2021 and impress your audience. This template can be altered and modified as per your expectations. So, grab it now.
Problem Rise In Construction Defect Claims Ppt Icon Examples PDF
The slides shows the increase in the defect claims of ABC construction company from the years 2016 to 2020. It also provides the key notes for the explanation of the graph with main reasons behind the growth of defect claims. Deliver an awe inspiring pitch with this creative problem rise in construction defect claims ppt icon examples pdf bundle. Topics like material, design can be discussed with this completely editable template. It is available for immediate download depending on the needs and requirements of the user.
3D Pie Chart Icon Ppt PowerPoint Presentation Outline Inspiration
Presenting this set of slides with name 3d pie chart icon ppt powerpoint presentation outline inspiration. The topics discussed in these slides are pie chart, finance, donut chart. This is a completely editable PowerPoint presentation and is available for immediate download. Download now and impress your audience.
3D Pie Chart Vector Icon Ppt PowerPoint Presentation Gallery Portfolio
Presenting this set of slides with name 3d pie chart vector icon ppt powerpoint presentation gallery portfolio. The topics discussed in these slides are pie chart, finance, donut chart. This is a completely editable PowerPoint presentation and is available for immediate download. Download now and impress your audience.
Quarterly Sales Revenue Generation Performance Chart Icon Slides PDF
This graph or chart is linked to excel, and changes automatically based on data. Just left click on it and select edit data. Persuade your audience using this Quarterly Sales Revenue Generation Performance Chart Icon Slides PDF. This PPT design covers four stages, thus making it a great tool to use. It also caters to a variety of topics including Quarterly Sales Revenue, Generation Performance, Chart Icon. Download this PPT design now to present a convincing pitch that not only emphasizes the topic but also showcases your presentation skills.
EVM Project Management Chart Vector Icon Introduction PDF
Showcasing this set of slides titled evm project management chart vector icon introduction pdf. The topics addressed in these templates are evm project management chart vector icon. All the content presented in this PPT design is completely editable. Download it and make adjustments in color, background, font etc. as per your unique business setting.
Unsatisfactory Performance Chart Icon With Downward Arrow Infographics PDF
Pitch your topic with ease and precision using this Unsatisfactory Performance Chart Icon With Downward Arrow Infographics PDF. This layout presents information on Unsatisfactory Performance, Chart Icon, Downward Arrow. It is also available for immediate download and adjustment. So, changes can be made in the color, design, graphics or any other component to create a unique layout.
Budgeting Planned Actual Comparison Ppt PowerPoint Presentation Icon Design Inspiration
This is a budgeting planned actual comparison ppt powerpoint presentation icon design inspiration. The topics discussed in this diagram are finance, marketing, management, investment, analysis. This is a completely editable PowerPoint presentation, and is available for immediate download.
Stacked Bar Finance Ppt PowerPoint Presentation Icon Deck
This is a stacked bar finance ppt powerpoint presentation icon deck. The topics discussed in this diagram are management, marketing, business, strategy, finance. This is a completely editable PowerPoint presentation, and is available for immediate download.
Stacked Area Clustered Column Ppt PowerPoint Presentation Icon Gallery
This is a stacked area clustered column ppt powerpoint presentation icon gallery. The topics discussed in this diagram are finance, marketing, management, investment, analysis. This is a completely editable PowerPoint presentation, and is available for immediate download.
Sales By Lead Source Performance Indicator Ppt Icon Images PDF
Explore a selection of the finest Sales By Lead Source Performance Indicator Ppt Icon Images PDF here. With a plethora of professionally designed and pre made slide templates, you can quickly and easily find the right one for your upcoming presentation. You can use our Sales By Lead Source Performance Indicator Ppt Icon Images PDF to effectively convey your message to a wider audience. Slidegeeks has done a lot of research before preparing these presentation templates. The content can be personalized and the slides are highly editable. Grab templates today from Slidegeeks.
Software Development Icon With Industrial Engineering Metrics Themes PDF
Pitch your topic with ease and precision using this Software Development Icon With Industrial Engineering Metrics Themes PDF. This layout presents information on Software Development, Industrial Engineering, Metrics. It is also available for immediate download and adjustment. So, changes can be made in the color, design, graphics or any other component to create a unique layout.
Key Metrics To Increase Consumer Traffic Icon Themes PDF
Showcasing this set of slides titled Key Metrics To Increase Consumer Traffic Icon Themes PDF. The topics addressed in these templates are Key Metrics, Increase Consumer, Traffic . All the content presented in this PPT design is completely editable. Download it and make adjustments in color, background, font etc. as per your unique business setting.
Artificial Intelligence Predictive Advertising Analytics Icon Themes PDF
Showcasing this set of slides titled Artificial Intelligence Predictive Advertising Analytics Icon Themes PDF. The topics addressed in these templates are Artificial Intelligence, Predictive, Advertising Analytics. All the content presented in this PPT design is completely editable. Download it and make adjustments in color, background, font etc. as per your unique business setting.
Micro Macro Environment Research Stacked Column Ppt Icon Diagrams PDF
Presenting this set of slides with name micro macro environment research stacked column ppt icon diagrams pdf. The topics discussed in these slides are product 1, product 2. This is a completely editable PowerPoint presentation and is available for immediate download. Download now and impress your audience.
Data Analysis In Market Research Steps Icon Diagrams PDF
Showcasing this set of slides titled Data Analysis In Market Research Steps Icon Diagrams PDF. The topics addressed in these templates are Data Analysis, Market, Research Steps. All the content presented in this PPT design is completely editable. Download it and make adjustments in color, background, font etc. as per your unique business setting.
Data Project Management And Process Icon Diagrams PDF
Showcasing this set of slides titled Data Project Management And Process Icon Diagrams PDF. The topics addressed in these templates are Data Project, Management, Process. All the content presented in this PPT design is completely editable. Download it and make adjustments in color, background, font etc. as per your unique business setting.

 Home
Home