Graph Icon
Digital Money Cash Inflow And Outflow Icon Ppt PowerPoint Presentation Diagram Graph Charts PDF
Presenting Digital Money Cash Inflow And Outflow Icon Ppt PowerPoint Presentation Diagram Graph Charts PDF to dispense important information. This template comprises three stages. It also presents valuable insights into the topics including Digital Money, Cash Inflow, Outflow Icon. This is a completely customizable PowerPoint theme that can be put to use immediately. So, download it and address the topic impactfully.
Mail With Cross Symbol Vector Icon Ppt PowerPoint Presentation Diagram Graph Charts PDF
Presenting this set of slides with name mail with cross symbol vector icon ppt powerpoint presentation diagram graph charts pdf. This is a three stage process. The stages in this process are mail with cross symbol vector icon. This is a completely editable PowerPoint presentation and is available for immediate download. Download now and impress your audience.
Health Insurance Plan For Protection Vector Icon Ppt PowerPoint Presentation Diagram Graph Charts PDF
Showcasing this set of slides titled health insurance plan for protection vector icon ppt powerpoint presentation diagram graph charts pdf. The topics addressed in these templates are health insurance plan for protection vector icon. All the content presented in this PPT design is completely editable. Download it and make adjustments in color, background, font etc. as per your unique business setting.
Social Media Influencer Marketing Strategy Creation Icon Ppt PowerPoint Presentation Diagram Graph Charts PDF
Pitch your topic with ease and precision using this Social Media Influencer Marketing Strategy Creation Icon Ppt PowerPoint Presentation Diagram Graph Charts PDF. This layout presents information on Social Media, Influencer Marketing, Strategy Creation Icon. It is also available for immediate download and adjustment. So, changes can be made in the color, design, graphics or any other component to create a unique layout.
Statistical Data Icon Of Data Analytics Using Bar Graph Background PDF
Presenting statistical data icon of data analytics using bar graph background pdf to dispense important information. This template comprises four stages. It also presents valuable insights into the topics including statistical data icon of data analytics using bar graph. This is a completely customizable PowerPoint theme that can be put to use immediately. So, download it and address the topic impactfully.
Bar Graph With Dollar Sign For Profit Trends Vector Icon Ppt PowerPoint Presentation Show Designs
Presenting this set of slides with name bar graph with dollar sign for profit trends vector icon ppt powerpoint presentation show designs. This is a one stage process. The stage in this process is bar graph with dollar sign for profit trends vector icon. This is a completely editable PowerPoint presentation and is available for immediate download. Download now and impress your audience.
Profit Margin Growth Graph With Percentage Ratio Ppt PowerPoint Presentation Professional Icon PDF
Showcasing this set of slides titled profit margin growth graph with percentage ratio ppt powerpoint presentation professional icon pdf. The topics addressed in these templates are profit margin per sale, target per sales rep, 2017 to 2027. All the content presented in this PPT design is completely editable. Download it and make adjustments in color, background, font etc. as per your unique business setting.
HR Recruitment Dashboard Kpis Icon With Graphs Ppt Slides Slideshow PDF
Presenting HR Recruitment Dashboard Kpis Icon With Graphs Ppt Slides Slideshow PDF to dispense important information. This template comprises three stages. It also presents valuable insights into the topics including HR Recruitment, Dashboard Kpis Icon, Graphs. This is a completely customizable PowerPoint theme that can be put to use immediately. So, download it and address the topic impactfully.
Database Marketing Icon Showcasing Graphs On Laptop Ppt Inspiration Smartart Pdf
Showcasing this set of slides titled Database Marketing Icon Showcasing Graphs On Laptop Ppt Inspiration Smartart Pdf. The topics addressed in these templates are Database Marketing, Icon, Showcasing Graphs, Laptop. All the content presented in this PPT design is completely editable. Download it and make adjustments in color, background, font etc. as per your unique business setting. Our Database Marketing Icon Showcasing Graphs On Laptop Ppt Inspiration Smartart Pdf are topically designed to provide an attractive backdrop to any subject. Use them to look like a presentation pro.
Project Efficiency Status Dashboard Icon With Graphs And Charts Demonstration PDF
Persuade your audience using this Project Efficiency Status Dashboard Icon With Graphs And Charts Demonstration PDF. This PPT design covers three stages, thus making it a great tool to use. It also caters to a variety of topics including Project Efficiency Status Dashboard Icon WITH Graphs AND Charts. Download this PPT design now to present a convincing pitch that not only emphasizes the topic but also showcases your presentation skills.
Sales Performance Report With Charts And Graphs Ppt PowerPoint Presentation Icon Master Slide PDF
Presenting sales performance report with charts and graphs ppt powerpoint presentation icon master slide pdf to dispense important information. This template comprises three stages. It also presents valuable insights into the topics including sales performance report with charts and graphs. This is a completely customizable PowerPoint theme that can be put to use immediately. So, download it and address the topic impactfully.
Consulting Services With Bar Graph And Chat Bo Vector Icon Ppt PowerPoint Presentation File Background Designs PDF
Persuade your audience using this consulting services with bar graph and chat bo vector icon ppt powerpoint presentation file background designs pdf. This PPT design covers three stages, thus making it a great tool to use. It also caters to a variety of topics including consulting services with bar graph and chat bo vector icon. Download this PPT design now to present a convincing pitch that not only emphasizes the topic but also showcases your presentation skills.
COVID 19 Pandemic Disease Graph Showing Coronavirus Impact On Stock Market Icons PDF
Presenting this set of slides with name covid 19 pandemic disease graph showing coronavirus impact on stock market icons pdf. The topics discussed in these slides are graph showing coronavirus impact on stock market. This is a completely editable PowerPoint presentation and is available for immediate download. Download now and impress your audience.
Bar Graph Showing Income Of Business Segments Ppt PowerPoint Presentation Icon Example PDF
Pitch your topic with ease and precision using this bar graph showing income of business segments ppt powerpoint presentation icon example pdf. This layout presents information on bar graph showing income of business segments. It is also available for immediate download and adjustment. So, changes can be made in the color, design, graphics or any other component to create a unique layout.
Business Outcomes Vector Icons Showing Pie And Bar Graph Ppt Powerpoint Presentation File Graphic Images
This is a business outcomes vector icons showing pie and bar graph ppt powerpoint presentation file graphic images. This is a three stage process. The stages in this process are business outcomes, business results, business output.
Burndown Graph With Remaining And Completed Tasks Ppt PowerPoint Presentation Icon Show PDF
Presenting this set of slides with name burndown graph with remaining and completed tasks ppt powerpoint presentation icon show pdf. The topics discussed in these slides are task completed, efforts remained, ideal burndown, task remained. This is a completely editable PowerPoint presentation and is available for immediate download. Download now and impress your audience.
Bar Graph With Upward Arrow For Profit Ppt PowerPoint Presentation Icon Example PDF
Presenting this set of slides with name bar graph with upward arrow for profit ppt powerpoint presentation icon example pdf. This is a three stage process. The stages in this process are bar graph with upward arrow for profit. This is a completely editable PowerPoint presentation and is available for immediate download. Download now and impress your audience.
Business Outcomes Vector Icons Showing Pie And Bar Graph Ppt PowerPoint Presentation File Vector
Presenting this set of slides with name business outcomes vector icons showing pie and bar graph ppt powerpoint presentation file vector. This is a three stage process. The stages in this process are business outcomes, business results, business output. This is a completely editable PowerPoint presentation and is available for immediate download. Download now and impress your audience.
Bar Graph With Eye For Future Planning Ppt PowerPoint Presentation Icon Outline PDF
Persuade your audience using this bar graph with eye for future planning ppt powerpoint presentation icon outline pdf. This PPT design covers three stages, thus making it a great tool to use. It also caters to a variety of topics including bar graph with eye for future planning. Download this PPT design now to present a convincing pitch that not only emphasizes the topic but also showcases your presentation skills.
Bar Graph With Star For Business Achievements Ppt Powerpoint Presentation Icon Graphics Template
This is a bar graph with star for business achievements ppt powerpoint presentation icon graphics template. The topics discussed in this diagram are annual goal, yearly goal, annual target. This is a completely editable PowerPoint presentation, and is available for immediate download.
Bar Graph For Data Representation With Detailed Legends Ppt PowerPoint Presentation Icon Example PDF
Pitch your topic with ease and precision using this bar graph for data representation with detailed legends ppt powerpoint presentation icon example pdf. This layout presents information on bar graph for data representation with detailed legends. It is also available for immediate download and adjustment. So, changes can be made in the color, design, graphics or any other component to create a unique layout.
Pareto Graph Of Consumer Assessment For Business Performance Ppt PowerPoint Presentation Icon Inspiration PDF
Presenting this set of slides with name pareto graph of consumer assessment for business performance ppt powerpoint presentation icon inspiration pdf. The topics discussed in these slides are customer, product, market, pareto chart, sales, value. This is a completely editable PowerPoint presentation and is available for immediate download. Download now and impress your audience.
Bar Graph Showing Imported And Domestic Film Profit Ppt PowerPoint Presentation Icon Model PDF
Presenting this set of slides with name bar graph showing imported and domestic film profit ppt powerpoint presentation icon model pdf. The topics discussed in these slides are imported films, domestic films. This is a completely editable PowerPoint presentation and is available for immediate download. Download now and impress your audience.
Bar Graph Showing Of Business Income And Expenditure Ppt PowerPoint Presentation Icon Show PDF
Presenting this set of slides with name bar graph showing of business income and expenditure ppt powerpoint presentation icon show pdf. The topics discussed in these slides are expenses, revenue. This is a completely editable PowerPoint presentation and is available for immediate download. Download now and impress your audience.
Release Burndown Graph With Target Work To Be Done Ppt PowerPoint Presentation Icon Slideshow PDF
Presenting this set of slides with name release burndown graph with target work to be done ppt powerpoint presentation icon slideshow pdf. The topics discussed in these slides are behind schedule, ahead of schedule, target work, completed work. This is a completely editable PowerPoint presentation and is available for immediate download. Download now and impress your audience.
Profit Growth Bar Graph With Rising Arrow And Dollar Sign Ppt PowerPoint Presentation Icon Designs
This is a profit growth bar graph with rising arrow and dollar sign ppt powerpoint presentation icon designs. This is a five stage process. The stages in this process are growth, increase sales, increase revenue.
Bar Graph Showing Key Indicator Of Market Competitiveness Ppt PowerPoint Presentation Icon Example PDF
Showcasing this set of slides titled bar graph showing key indicator of market competitiveness ppt powerpoint presentation icon example pdf. The topics addressed in these templates are bar graph showing key indicator of market competitiveness. All the content presented in this PPT design is completely editable. Download it and make adjustments in color, background, font etc. as per your unique business setting.
Marketing Funnel Icon With Dollar Symbol Ppt PowerPoint Presentation Diagram Graph Charts PDF
Presenting this set of slides with name marketing funnel icon with dollar symbol ppt powerpoint presentation diagram graph charts pdf. This is a three stage process. The stages in this process are marketing funnel icon with dollar symbol. This is a completely editable PowerPoint presentation and is available for immediate download. Download now and impress your audience.
Bar Graph For Four Years Business Result Analysis Ppt PowerPoint Presentation Icon Show
Presenting this set of slides with name bar graph for four years business result analysis ppt powerpoint presentation icon show. The topics discussed in these slides are financial targets, financial goals, growth profitability. This is a completely editable PowerPoint presentation and is available for immediate download. Download now and impress your audience.
Pie Graph Showing Monthly Spend On Employee Ppt PowerPoint Presentation Summary Icon PDF
Showcasing this set of slides titled pie graph showing monthly spend on employee ppt powerpoint presentation summary icon pdf. The topics addressed in these templates are allowances, travel expenses, training and development. All the content presented in this PPT design is completely editable. Download it and make adjustments in color, background, font etc. as per your unique business setting.
Financial Graph For Urban Population Growth With Prediction Figures Icons PDF
Showcasing this set of slides titled financial graph for urban population growth with prediction figures icons pdf. The topics addressed in these templates are financial graph for urban population growth with prediction figures. All the content presented in this PPT design is completely editable. Download it and make adjustments in color, background, font etc. as per your unique business setting.
Bar Graph Representing Accomplishment Metrics For Customer Service Team Icons PDF
This slide shows the graphical representation of success metrics that helps to measure the customer service team which includes customer lifetime value, customer churn, net promoter score, revenues churn, customer experience score, customer renewals, etc. Showcasing this set of slides titled bar graph representing accomplishment metrics for customer service team icons pdf. The topics addressed in these templates are importance level, least important. All the content presented in this PPT design is completely editable. Download it and make adjustments in color, background, font etc. as per your unique business setting.
Downturn Graph Showing Decrease In Income Over The Years Ppt PowerPoint Presentation Icon File Formats PDF
Showcasing this set of slides titled downturn graph showing decrease in income over the years ppt powerpoint presentation icon file formats pdf. The topics addressed in these templates are middle class share of total income, middle class share of income, union membership rate, 2013 to 2020. All the content presented in this PPT design is completely editable. Download it and make adjustments in color, background, font etc. as per your unique business setting.
Bar Graph With Four Methods Of Risk Management Ppt PowerPoint Presentation Ideas Icon PDF
Presenting this set of slides with name bar graph with four methods of risk management ppt powerpoint presentation ideas icon pdf. This is a four stage process. The stages in this process are avoidance, reduction, sharing, retention, option. This is a completely editable PowerPoint presentation and is available for immediate download. Download now and impress your audience.
Achievement And Failure Icon With Employee And Flag Ppt PowerPoint Presentation Diagram Graph Charts
Persuade your audience using this achievement and failure icon with employee and flag ppt powerpoint presentation diagram graph charts. This PPT design covers four stages, thus making it a great tool to use. It also caters to a variety of topics including achievement and failure icon with employee and flag. Download this PPT design now to present a convincing pitch that not only emphasizes the topic but also showcases your presentation skills.
Stock Market Analysis Magnifying Glass Over Bar Graph And Dollar Sign Ppt PowerPoint Presentation Icon Visual Aids
This is a stock market analysis magnifying glass over bar graph and dollar sign ppt powerpoint presentation icon visual aids. This is a four stage process. The stages in this process are stock market, financial markets, bull market.
ROI On Capital Icon With Dollar Symbol And Graph Ppt PowerPoint Presentation Infographic Template Example Introduction PDF
Presenting roi on capital icon with dollar symbol and graph ppt powerpoint presentation infographic template example introduction pdf to dispense important information. This template comprises three stages. It also presents valuable insights into the topics including roi on capital icon with dollar symbol and graph. This is a completely customizable PowerPoint theme that can be put to use immediately. So, download it and address the topic impactfully.
Bar Graph And Pie Charts For Business Reports Vector Icon Ppt PowerPoint Presentation Show Graphics Tutorials PDF
Pitch your topic with ease and precision using this bar graph and pie charts for business reports vector icon ppt powerpoint presentation show graphics tutorials pdf. This layout presents information on bar graph and pie charts for business reports vector icon. It is also available for immediate download and adjustment. So, changes can be made in the color, design, graphics or any other component to create a unique layout.
Investment Information Pitchbook Icon With Businessmen Explaining Company Graphs Infographics PDF
Persuade your audience using this Investment Information Pitchbook Icon With Businessmen Explaining Company Graphs Infographics PDF. This PPT design covers Three stages, thus making it a great tool to use. It also caters to a variety of topics including Businessmen, Explaining Company Graphs. Download this PPT design now to present a convincing pitch that not only emphasizes the topic but also showcases your presentation skills.
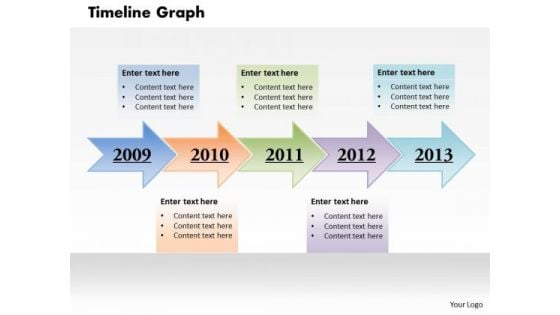
Timeline Graph PowerPoint Presentation Template
Our Timeline Graph PowerPoint Presentation Template Powerpoint Templates Enjoy Drama. They Provide Entertaining Backdrops. Our Business Plan Powerpoint Templates Help To Make A Draft. They Give You A Good Place To Start.
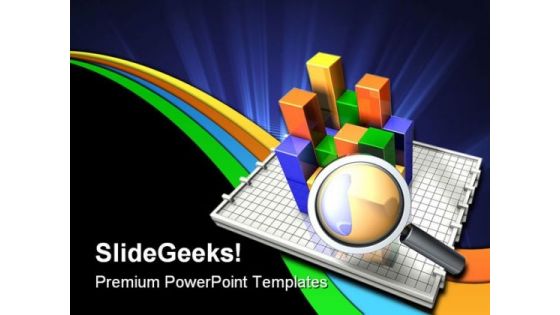
Graph Business PowerPoint Template 0510
3d illustration of a magnifying glass hovering over a three-dimensional multi-colored bar chart Get all factions to act together. Our Graph Business PowerPoint Template 0510 can help achieve a common cause.
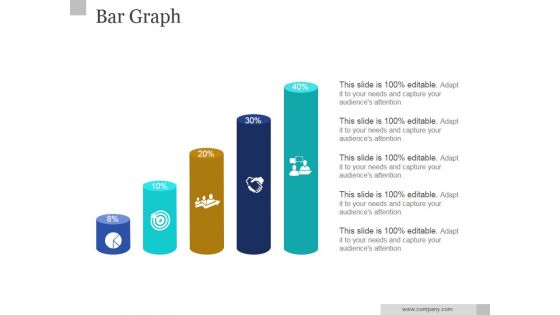
Bar Graph Ppt PowerPoint Presentation Example
This is a bar graph ppt powerpoint presentation example. This is a five stage process. The stages in this process are graph, growth, icons, strategy, success.
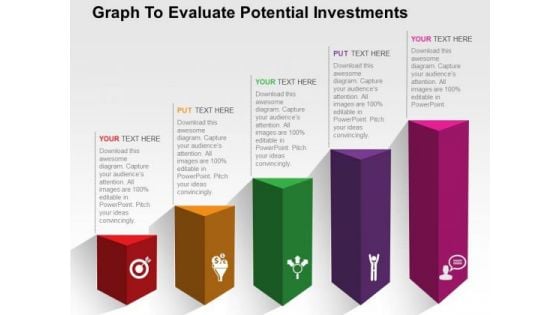
Graph To Evaluate Potential Investments PowerPoint Templates
Use this diagram to evaluate potential investments. This PPT slide contains bar graph with icons. This slide is designed to attract the attention of your audience towards business plan evaluation.
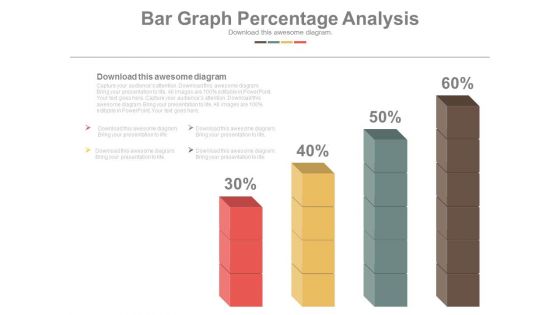
Bar Graph Displaying Profit Growth Powerpoint Slides
This PowerPoint template has been designed with six point?s bar graph with icons. This PPT slide can be used to prepare presentations for marketing reports and also for financial data analysis. You can download finance PowerPoint template to prepare awesome presentations.
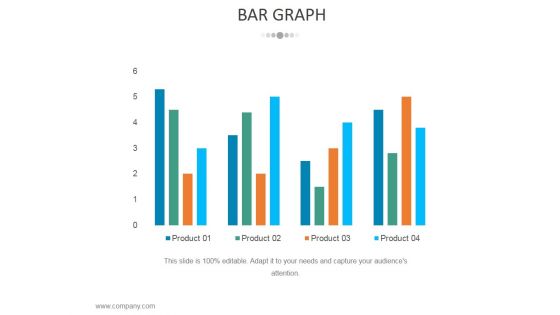
Bar Graph Ppt PowerPoint Presentation Ideas Sample
This is a bar graph ppt powerpoint presentation ideas sample. This is a four stage process. The stages in this process are business, strategy, marketing, analysis, chart and graph, bar graph.
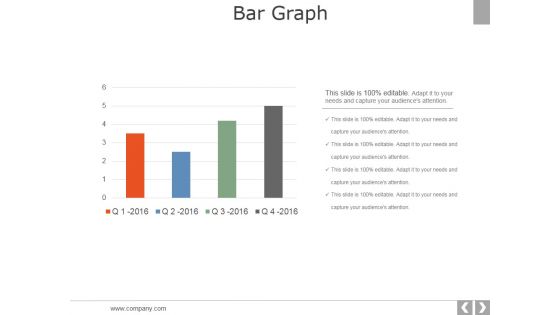
Bar Graph Ppt PowerPoint Presentation Styles Picture
This is a bar graph ppt powerpoint presentation styles picture. This is a four stage process. The stages in this process are business, strategy, marketing, analysis, chart and graph, bar graph.
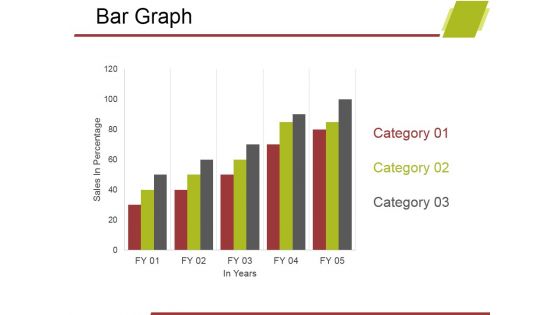
Bar Graph Ppt PowerPoint Presentation Gallery Portfolio
This is a bar graph ppt powerpoint presentation gallery portfolio. This is a five stage process. The stages in this process are business, marketing, graph, line chart, growth.
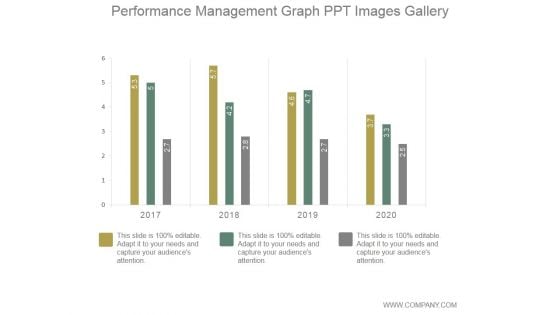
Performance Management Graph Ppt PowerPoint Presentation Template
This is a performance management graph ppt powerpoint presentation template. This is a four stage process. The stages in this process are graph, growth, performance, years, finance.
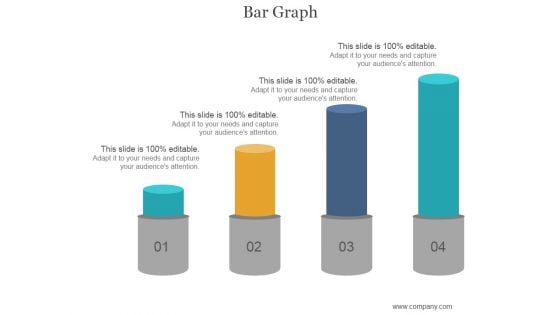
Bar Graph Ppt PowerPoint Presentation Slides
This is a bar graph ppt powerpoint presentation slides. This is a four stage process. The stages in this process are bar graph, business, management, marketing, success.
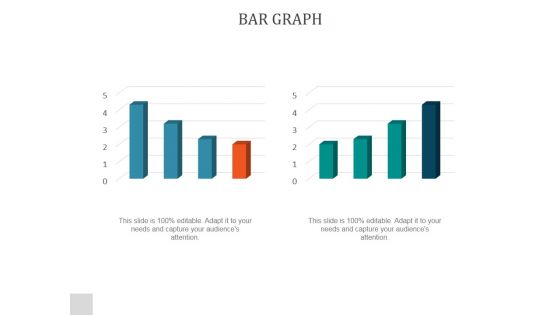
Bar Graph Ppt PowerPoint Presentation Example 2015
This is a bar graph ppt powerpoint presentation example 2015. This is a two stage process. The stages in this process are bar graph, finance, marketing, analysis, business.
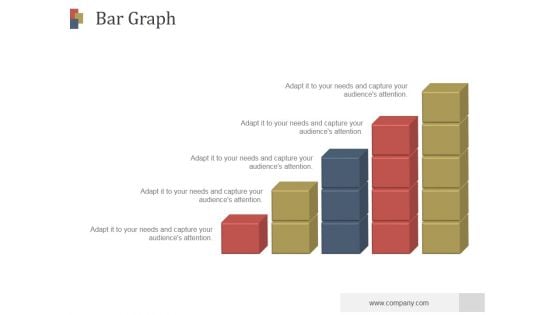
Bar Graph Ppt PowerPoint Presentation Professional
This is a bar graph ppt powerpoint presentation professional. This is a five stage process. The stages in this process are business, bar graph, strategy, growth, success.
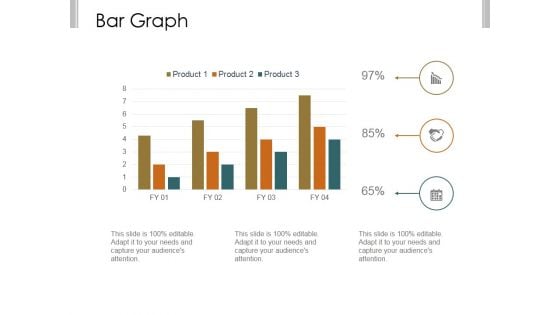
Bar Graph Ppt PowerPoint Presentation Examples
This is a bar graph ppt powerpoint presentation examples. This is a three stage process. The stages in this process are business, strategy, marketing, analysis, finance, bar graph.
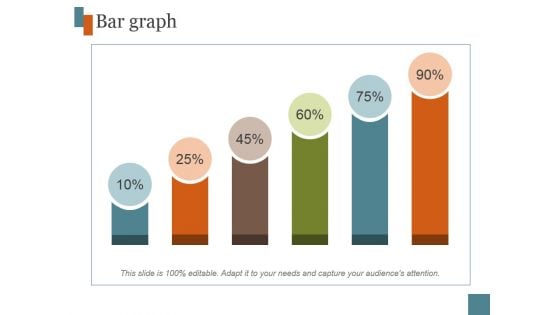
Bar Graph Ppt PowerPoint Presentation Template
This is a bar graph ppt powerpoint presentation template. This is a six stage process. The stages in this process are graph, business, marketing, finance.
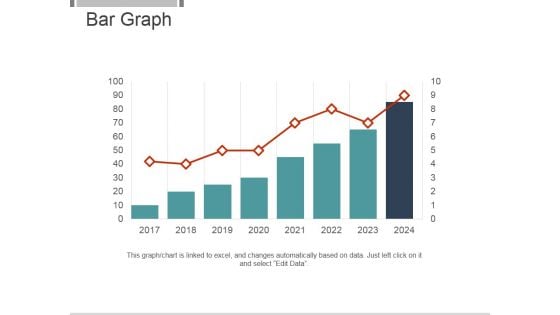
Bar Graph Ppt PowerPoint Presentation Designs Download
This is a bar graph ppt powerpoint presentation designs download. This is a eight stage process. The stages in this process are bar graph, business, strategy, management, marketing.
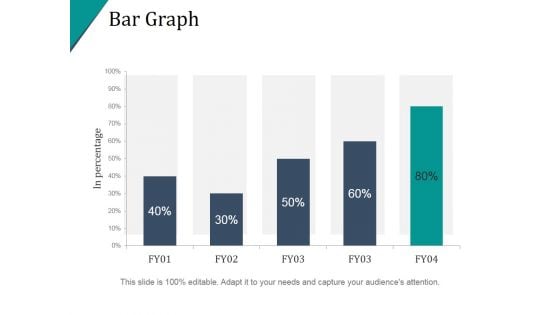
Bar Graph Ppt PowerPoint Presentation Information
This is a bar graph ppt powerpoint presentation information. This is a five stage process. The stages in this process are finance, percentage, success, growth, bar graph.
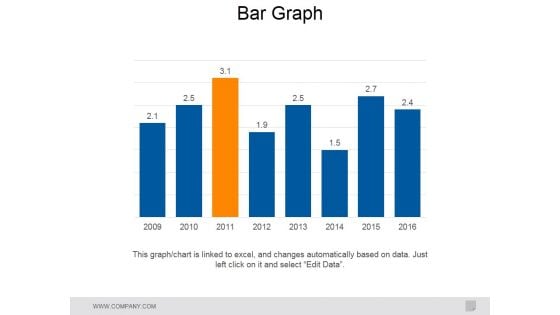
Bar Graph Ppt PowerPoint Presentation Slides Model
This is a bar graph ppt powerpoint presentation slides model. This is a eight stage process. The stages in this process are business, marketing, bar graph, management, timeline.
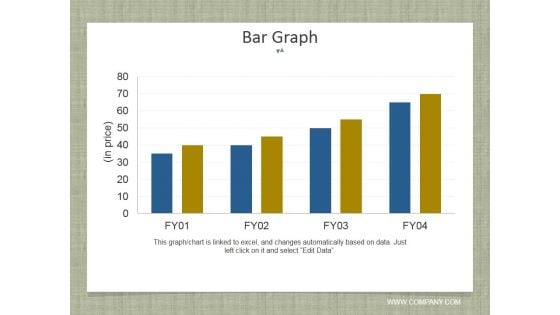
Bar Graph Ppt PowerPoint Presentation Pictures Graphics
This is a bar graph ppt powerpoint presentation pictures graphics. This is a four stage process. The stages in this process are business, marketing, bar graph, success, growth.
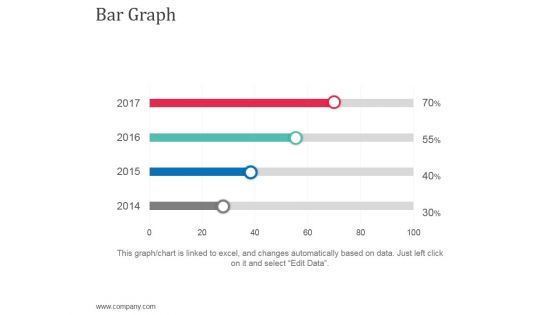
Bar Graph Ppt Powerpoint Presentation Show Backgrounds
This is a bar graph ppt powerpoint presentation show backgrounds. This is a four stage process. The stages in this process are graph, finance, marketing, management, business.
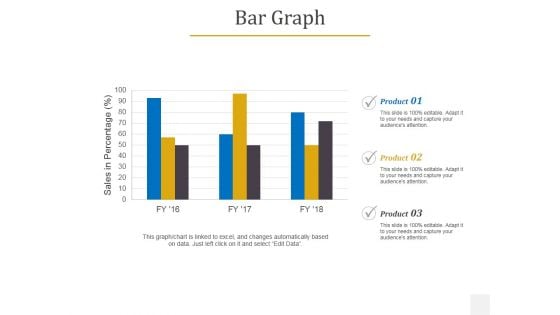
Bar Graph Ppt PowerPoint Presentation Slides Portfolio
This is a bar graph ppt powerpoint presentation slides portfolio. This is a three stage process. The stages in this process are business, marketing, management, bar graph, product.
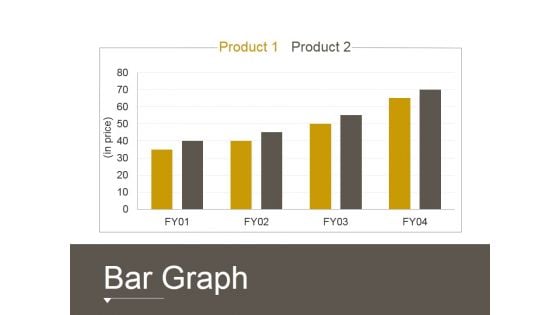
Bar Graph Ppt PowerPoint Presentation File Show
This is a bar graph ppt powerpoint presentation file show. This is a four stage process. The stages in this process are business, marketing, graph, growth, finance.


 Continue with Email

 Home
Home


