Graph Icon
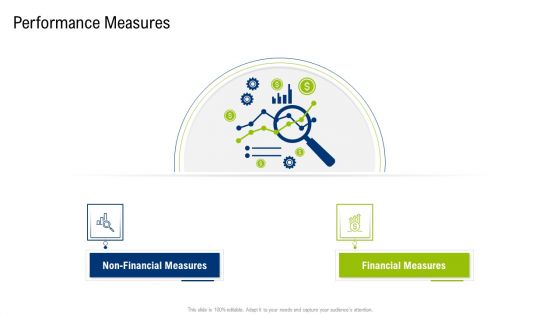
Multiple Phases For Supply Chain Management Performance Measures Themes PDF
This is a multiple phases for supply chain management performance measures themes pdf template with various stages. Focus and dispense information on two stages using this creative set, that comes with editable features. It contains large content boxes to add your information on topics like non financial measures, financial measures. You can also showcase facts, figures, and other relevant content using this PPT layout. Grab it now.
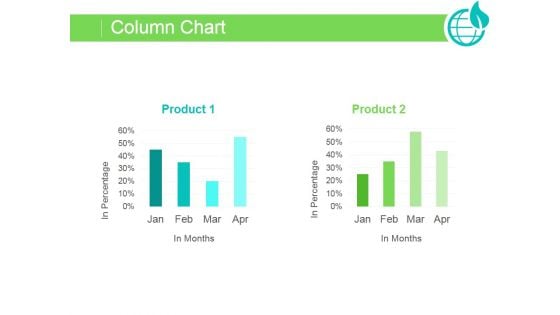
Column Chart Ppt PowerPoint Presentation Slide Download
This is a column chart ppt powerpoint presentation slide download. This is a two stage process. The stages in this process are business, marketing, graph, success, growth.
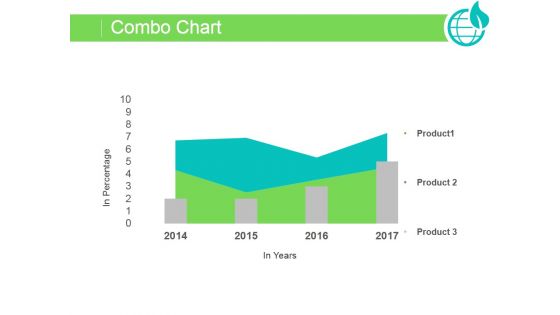
Combo Chart Ppt PowerPoint Presentation Pictures
This is a combo chart ppt powerpoint presentation pictures. This is a three stage process. The stages in this process are graph, success, growth, business, marketing.
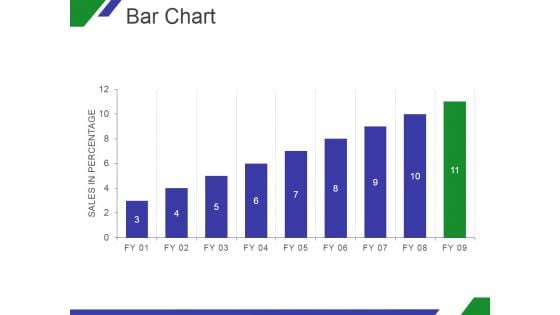
Bar Chart Ppt PowerPoint Presentation Ideas
This is a bar chart ppt powerpoint presentation ideas. This is a nine stage process. The stages in this process are graph, in percentage, growth, business, marketing.

Column Chart Ppt PowerPoint Presentation Deck
This is a column chart ppt powerpoint presentation deck. This is a nine stage process. The stages in this process are business, marketing, product, graph, growth.
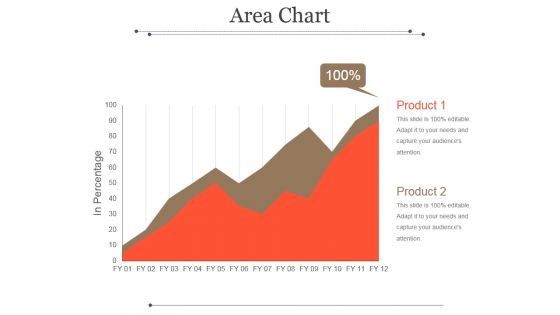
Area Chart Ppt PowerPoint Presentation Picture
This is a area chart ppt powerpoint presentation picture. This is a two stage process. The stages in this process are product, in percentage, graph, management, business.
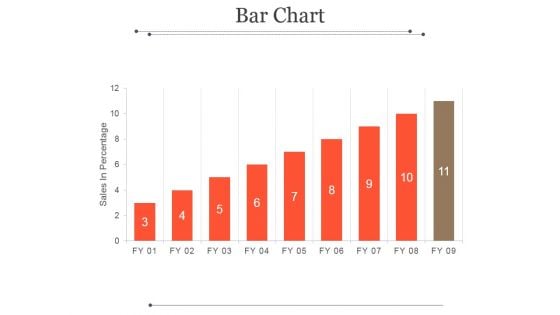
Bar Chart Ppt PowerPoint Presentation Microsoft
This is a bar chart ppt powerpoint presentation microsoft. This is a eleven stage process. The stages in this process are sales in percentage, fy, graph, success, business.
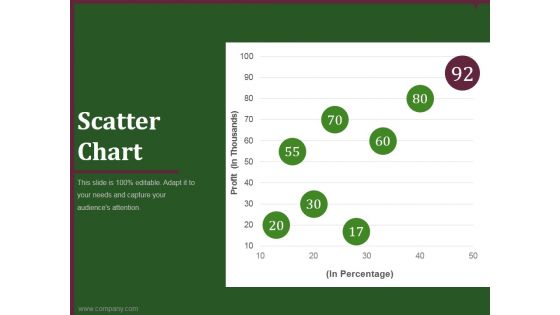
Scatter Chart Ppt PowerPoint Presentation Outline
This is a scatter chart ppt powerpoint presentation outline. This is a five stage process. The stages in this process are business, marketing, graph, percentage, finance.
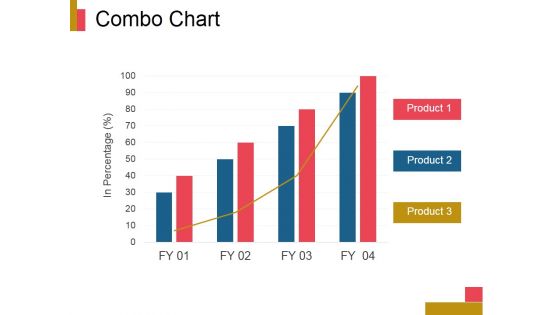
Combo Chart Ppt PowerPoint Presentation Template
This is a combo chart ppt powerpoint presentation template. This is a four stage process. The stages in this process are product, growth, graph, management, business.
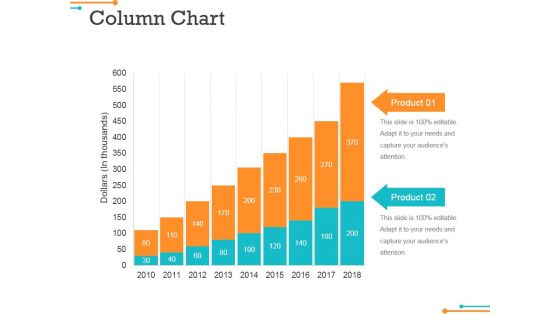
Column Chart Ppt Powerpoint Presentation Professional Model
This is a column chart ppt powerpoint presentation professional model. This is a two stage process. The stages in this process are product, dollars in thousands, graph, growth.
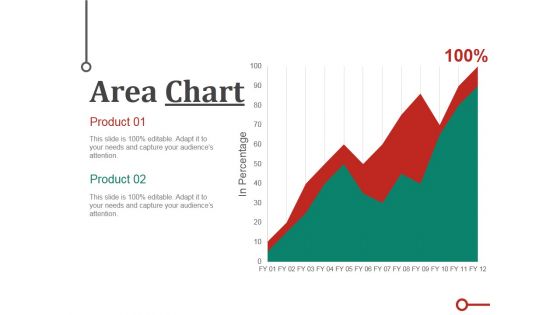
Area Chart Ppt PowerPoint Presentation Ideas Files
This is a area chart ppt powerpoint presentation ideas files. This is a two stage process. The stages in this process are graph, growth, success, business, marketing.
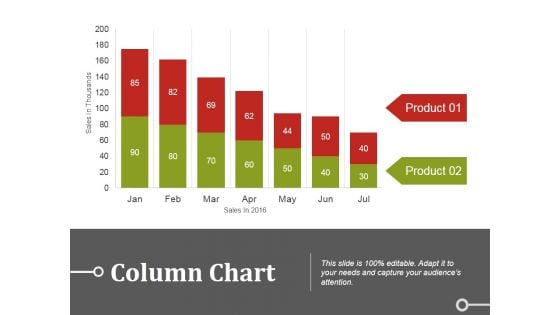
Column Chart Ppt PowerPoint Presentation Summary Introduction
This is a column chart ppt powerpoint presentation summary introduction. This is a two stage process. The stages in this process are business, marketing, bar, graph, finance.
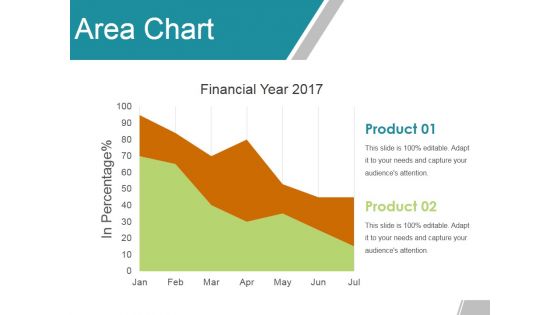
Area Chart Ppt Powerpoint Presentation Ideas Templates
This is a area chart ppt powerpoint presentation ideas templates. This is a two stage process. The stages in this process are product, financial year, in percentage, graph.
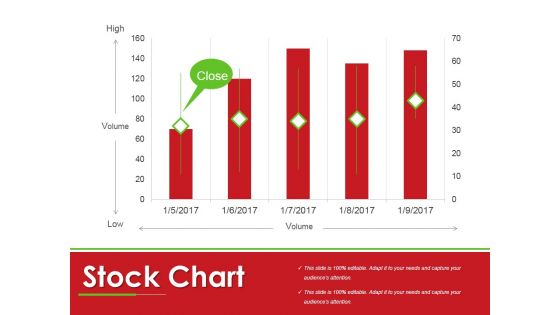
Stock Chart Ppt PowerPoint Presentation Professional Backgrounds
This is a stock chart ppt powerpoint presentation professional backgrounds. This is a five stage process. The stages in this process are business, marketing, graph, management, planning.
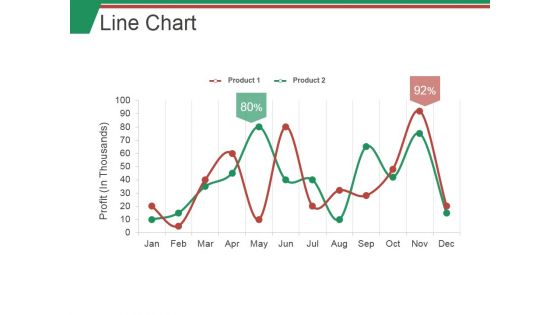
Line Chart Ppt PowerPoint Presentation Inspiration Microsoft
This is a line chart ppt powerpoint presentation inspiration microsoft. This is a two stage process. The stages in this process are business, marketing, graph, line, success.
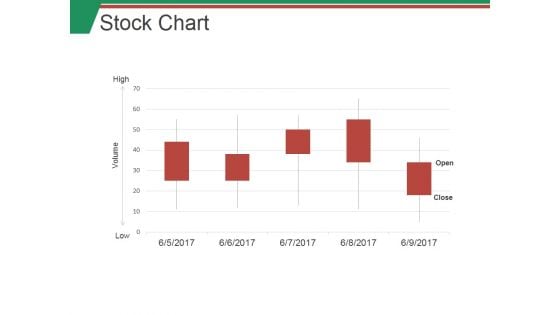
Stock Chart Ppt PowerPoint Presentation Professional Slide
This is a stock chart ppt powerpoint presentation professional slide. This is a five stage process. The stages in this process are graph, finance, analysis, planning, marketing.
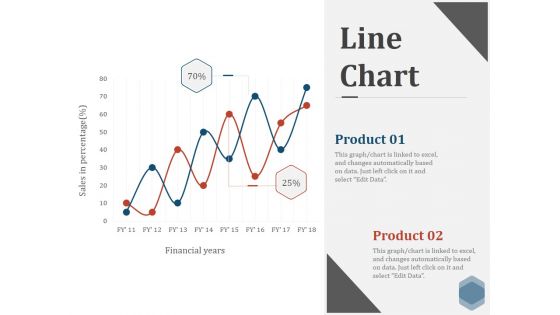
Line Chart Ppt PowerPoint Presentation Show Visuals
This is a line chart ppt powerpoint presentation show visuals. This is a two stage process. The stages in this process are financial, graph, line, marketing, success.
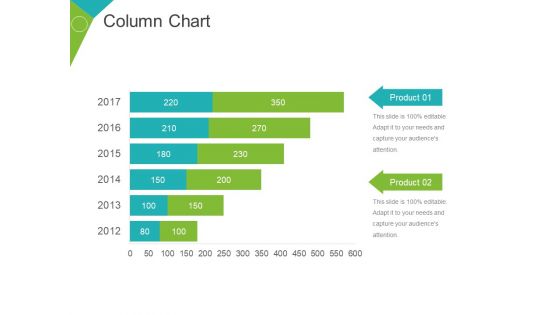
Column Chart Ppt PowerPoint Presentation Gallery
This is a column chart ppt powerpoint presentation gallery. This is a six stage process. The stages in this process are business, finance, years, product, graph.
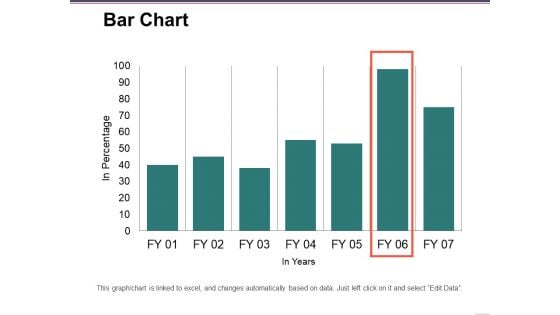
Bar Chart Ppt PowerPoint Presentation Pictures Inspiration
This is a bar chart ppt powerpoint presentation pictures inspiration. This is a seven stage process. The stages in this process are in percentage, business, marketing, finance, graph.
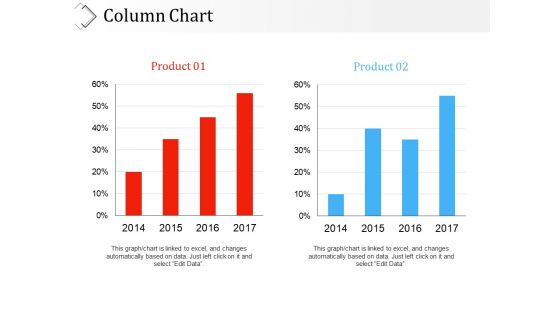
Column Chart Ppt PowerPoint Presentation Inspiration Deck
This is a column chart ppt powerpoint presentation inspiration deck. This is a two stage process. The stages in this process are years, business, marketing, graph, finance, product.
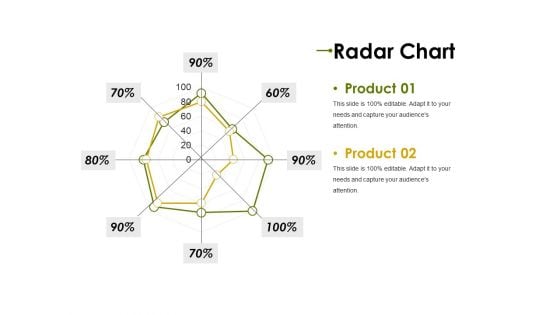
Radar Chart Ppt PowerPoint Presentation Styles Guide
This is a radar chart ppt powerpoint presentation styles guide. This is a two stage process. The stages in this process are product, graph, business, marketing, finance.
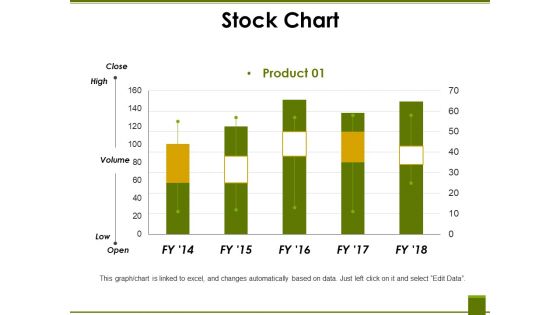
Stock Chart Ppt PowerPoint Presentation Summary Pictures
This is a stock chart ppt powerpoint presentation summary pictures. This is a five stage process. The stages in this process are high, volume, low, product, graph.
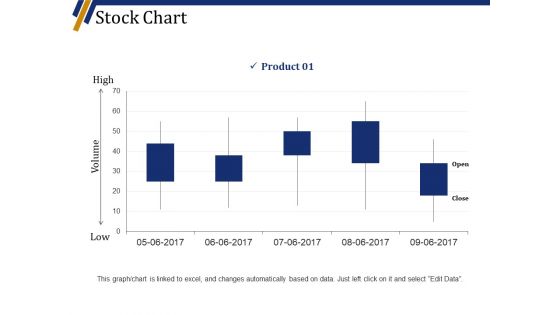
Stock Chart Ppt PowerPoint Presentation Slides Maker
This is a stock chart ppt powerpoint presentation slides maker. This is a five stage process. The stages in this process are high, volume, low, product, business, graph.
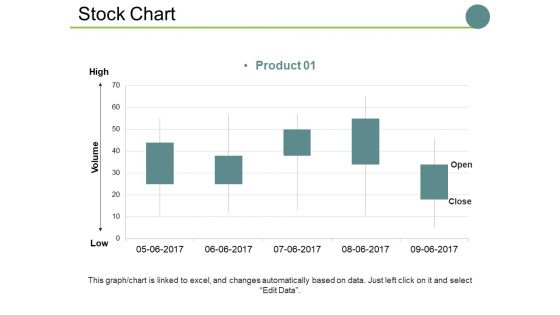
Stock Chart Ppt PowerPoint Presentation Show Sample
This is a stock chart ppt powerpoint presentation show sample. This is a one stage process. The stages in this process are high, volume, low, business, graph, marketing.
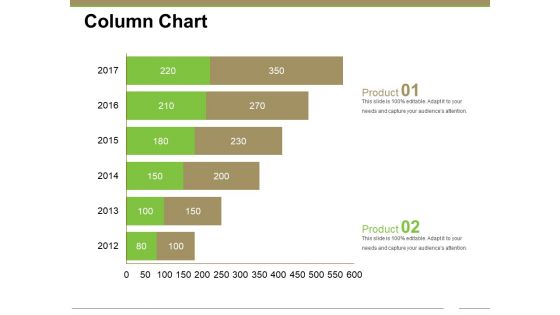
Column Chart Ppt PowerPoint Presentation Gallery Styles
This is a column chart ppt powerpoint presentation gallery styles. This is a two stage process. The stages in this process are years, graph, business, marketing, finance.
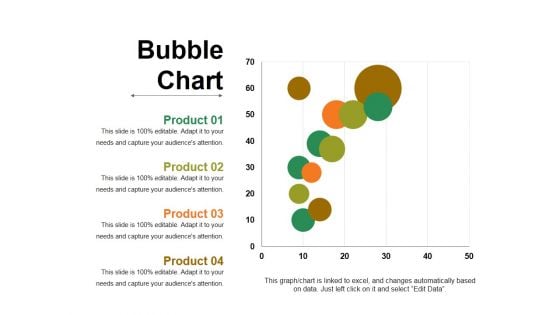
Bubble Chart Ppt PowerPoint Presentation Show Graphics
This is a bubble chart ppt powerpoint presentation show graphics. This is a four stage process. The stages in this process are business, marketing, graph, finance, strategy.
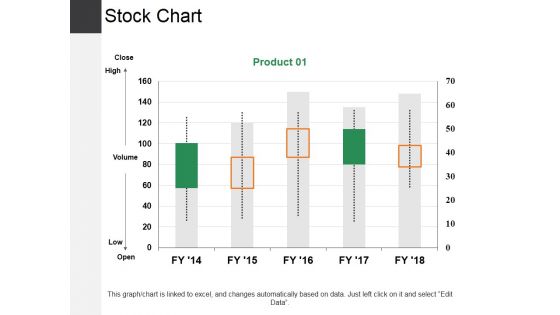
Stock Chart Ppt PowerPoint Presentation Slides Outline
This is a stock chart ppt powerpoint presentation slides outline. This is a one stage process. The stages in this process are high, low, business, marketing, graph.

Column Chart Ppt PowerPoint Presentation Model Visuals
This is a column chart ppt powerpoint presentation model visuals. This is a two stage process. The stages in this process are product, year, graph, business, finance.
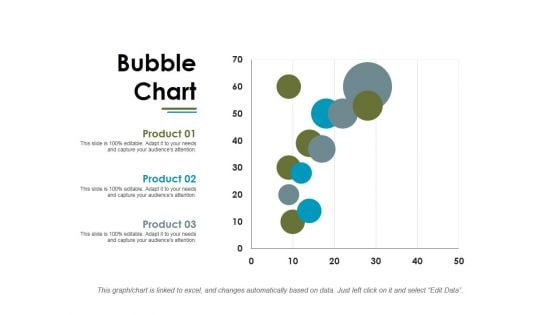
Bubble Chart Ppt PowerPoint Presentation Summary Microsoft
This is a bubble chart ppt powerpoint presentation summary microsoft. This is a three stage process. The stages in this process are business, marketing, graph, finance, planning.
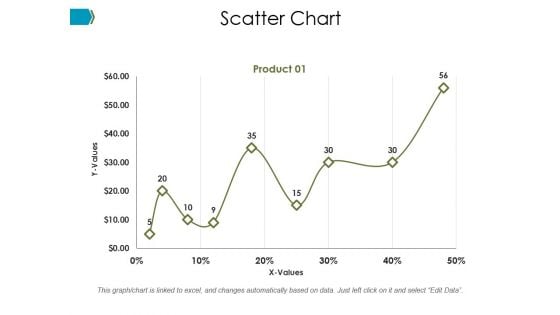
Scatter Chart Ppt PowerPoint Presentation Styles Background
This is a scatter chart ppt powerpoint presentation styles background. This is a one stage process. The stages in this process are business, marketing, strategy, finance, graph.
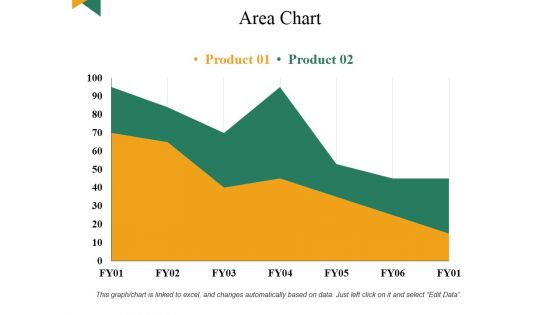
Area Chart Ppt PowerPoint Presentation Gallery Aids
This is a area chart ppt powerpoint presentation gallery aids. This is a two stage process. The stages in this process are business, graph, finance, marketing, planning.
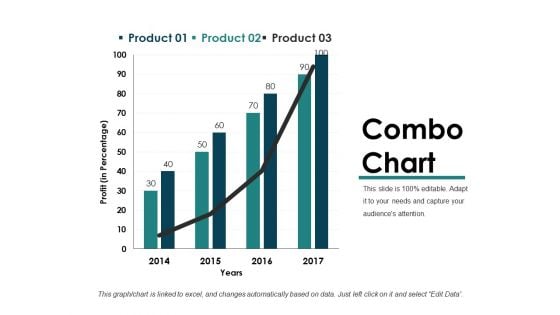
Combo Chart Ppt PowerPoint Presentation Slides Introduction
This is a combo chart ppt powerpoint presentation slides introduction. This is a four stage process. The stages in this process are profit, years, business, marketing, graph.
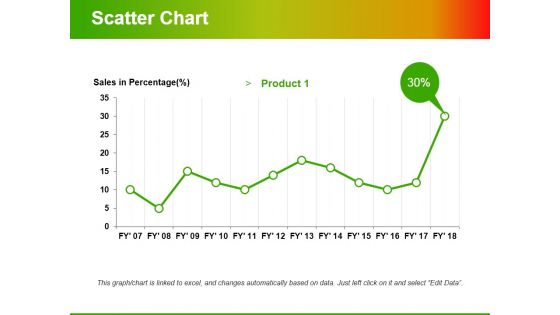
Scatter Chart Ppt PowerPoint Presentation Ideas Professional
This is a scatter chart ppt powerpoint presentation ideas professional. This is a one stage process. The stages in this process are product, percentage, growth, success, line graph.
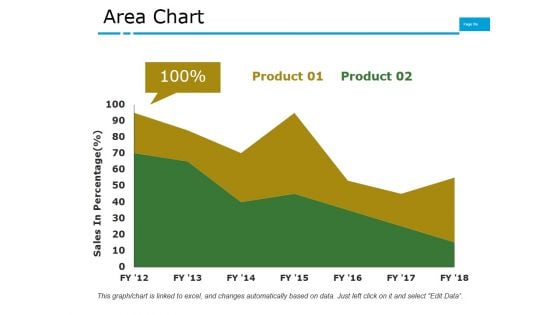
Area Chart Ppt PowerPoint Presentation Model Format
This is a area chart ppt powerpoint presentation model format. This is a two stage process. The stages in this process are business, marketing, finance, graph, growth.
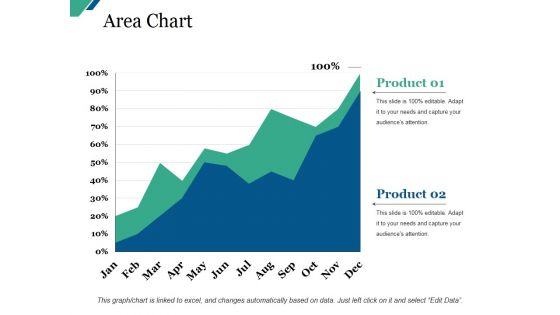
Area Chart Ppt PowerPoint Presentation Pictures Example
This is a area chart ppt powerpoint presentation pictures example. This is a two stage process. The stages in this process are business, marketing, graph, success, growth.
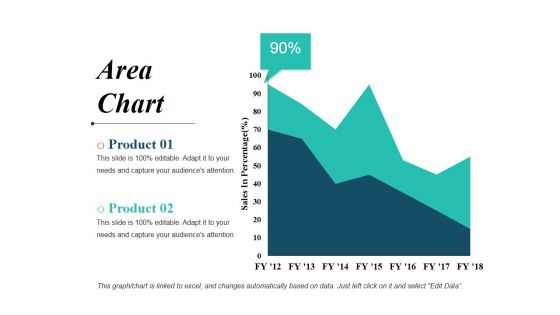
Area Chart Ppt PowerPoint Presentation Portfolio Skills
This is a area chart ppt powerpoint presentation portfolio skills. This is a two stage process. The stages in this process are business, marketing, strategy, planning, graph.
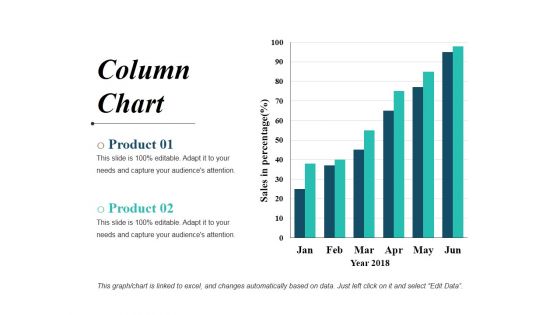
Column Chart Ppt PowerPoint Presentation Professional Layouts
This is a column chart ppt powerpoint presentation professional layouts. This is a six stage process. The stages in this process are bar graph, business, marketing, finance, planning.
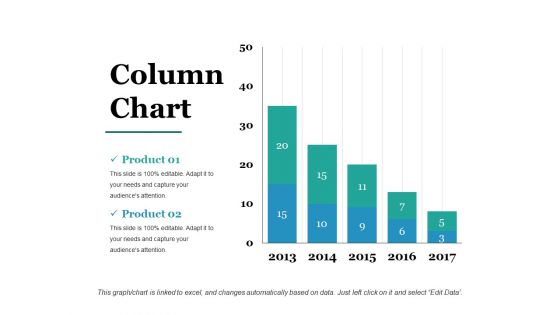
Column Chart Ppt PowerPoint Presentation Styles Picture
This is a column chart ppt powerpoint presentation styles picture. This is a five stage process. The stages in this process are years, business, marketing, graph, finance.
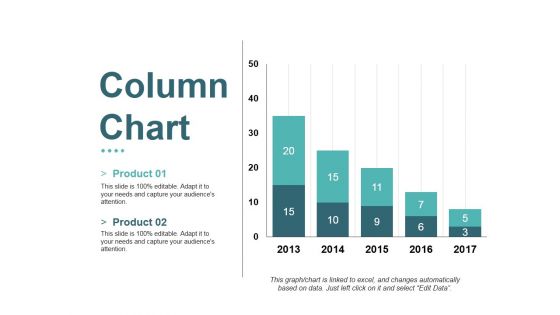
Column Chart Ppt PowerPoint Presentation Summary Maker
This is a column chart ppt powerpoint presentation summary maker. This is a two stage process. The stages in this process are business, marketing, product, bar graph, years.
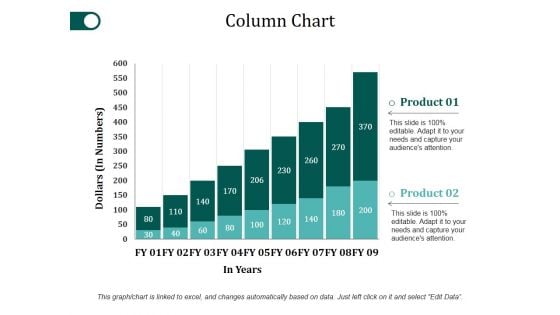
Column Chart Ppt PowerPoint Presentation Portfolio Clipart
This is a column chart ppt powerpoint presentation portfolio clipart. This is a two stage process. The stages in this process are bar graph, growth, success, product, dollars.
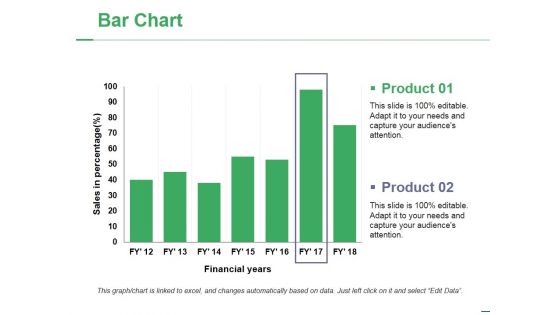
Bar Chart Ppt PowerPoint Presentation Model Topics
This is a bar chart ppt powerpoint presentation model topics. This is a two stage process. The stages in this process are bar graph, growth, success, business, marketing.
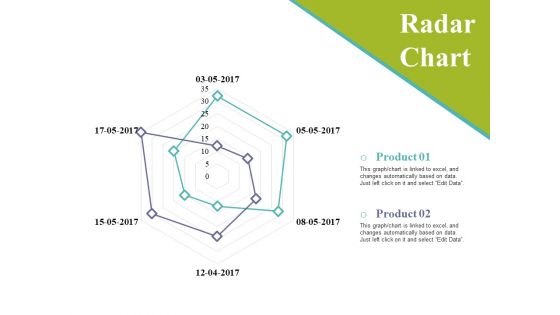
Radar Chart Ppt PowerPoint Presentation Outline Ideas
This is a radar chart ppt powerpoint presentation outline ideas. This is a two stage process. The stages in this process are business, marketing, finance, strategy, graph.
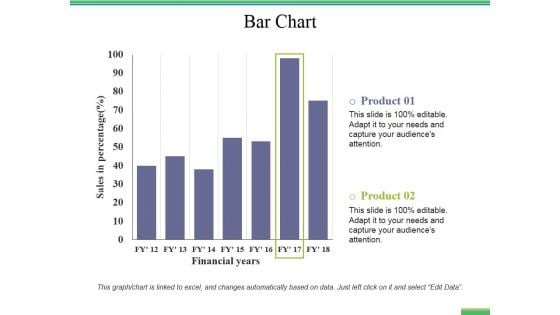
Bar Chart Ppt PowerPoint Presentation File Rules
This is a bar chart ppt powerpoint presentation file rules. This is a two stage process. The stages in this process are bar graph, finance, marketing, strategy, analysis.
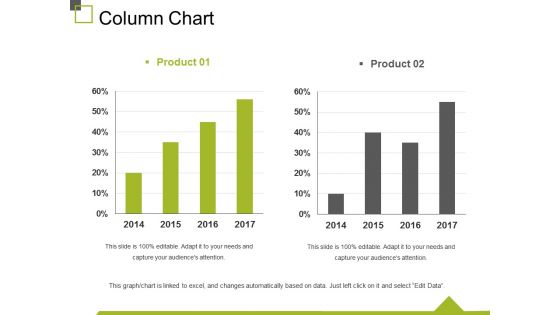
Column Chart Ppt PowerPoint Presentation Summary Slides
This is a column chart ppt powerpoint presentation summary slides. This is a two stage process. The stages in this process are finance, marketing, business, graph, years.
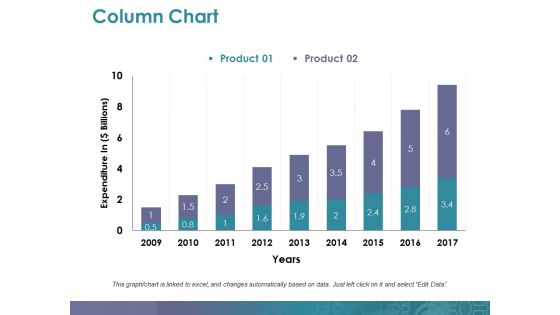
Column Chart Ppt PowerPoint Presentation Summary Deck
This is a column chart ppt powerpoint presentation summary deck. This is a two stage process. The stages in this process are expenditure in, years, business, marketing, graph.
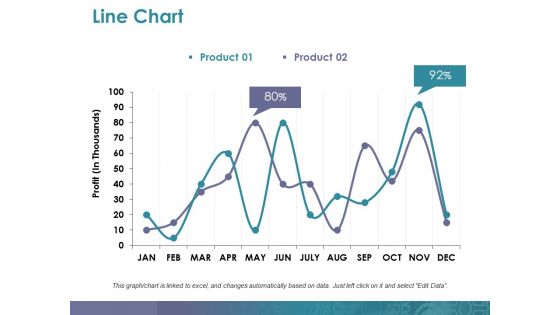
Line Chart Ppt PowerPoint Presentation Summary Rules
This is a line chart ppt powerpoint presentation summary rules. This is a two stage process. The stages in this process are profit, business, marketing, graph, finance.
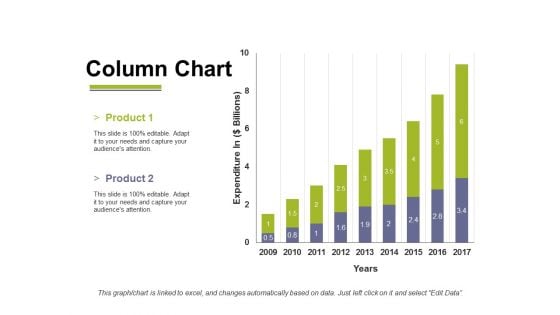
Column Chart Ppt PowerPoint Presentation File Inspiration
This is a column chart ppt powerpoint presentation file inspiration. This is a two stage process. The stages in this process are business, marketing, years, expenditure in, graph.

Column Chart Ppt PowerPoint Presentation Show Images
This is a column chart ppt powerpoint presentation show images. This is a two stage process. The stages in this process are product, expenditure, years, bar graph, growth.
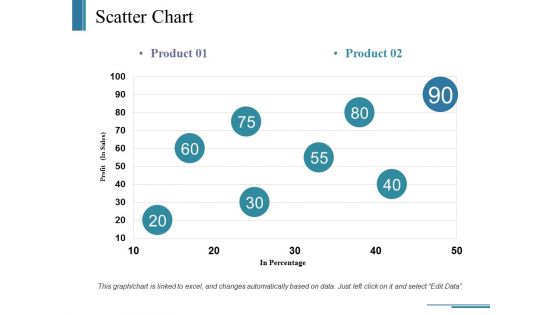
Scatter Chart Ppt PowerPoint Presentation Ideas Example
This is a scatter chart ppt powerpoint presentation ideas example. This is a two stage process. The stages in this process are business, in percentage, profit, marketing, graph.
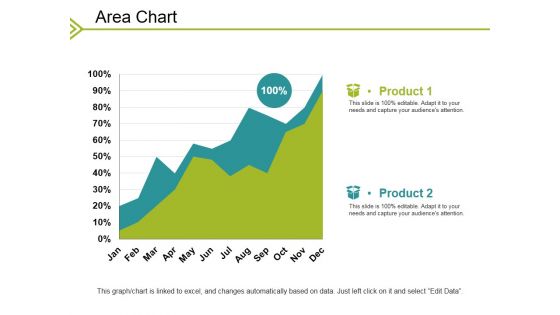
Area Chart Ppt PowerPoint Presentation Outline Examples
This is a area chart ppt powerpoint presentation outline examples. This is a two stage process. The stages in this process are business, marketing, graph, finance, strategy.
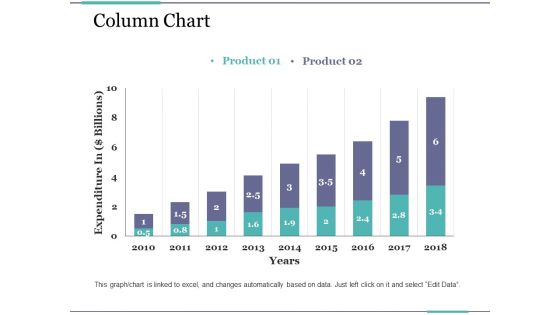
Column Chart Ppt PowerPoint Presentation Outline Deck
This is a column chart ppt powerpoint presentation outline deck. This is a two stage process. The stages in this process are business, marketing, expenditure in, years, graph.

Column Chart Ppt PowerPoint Presentation Ideas Deck
This is a column chart ppt powerpoint presentation ideas deck. This is a two stage process. The stages in this process are business, marketing, dollars, in years, graph.
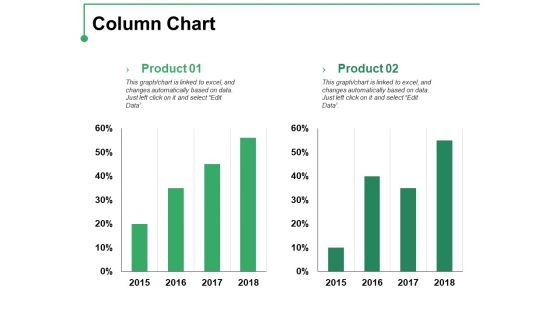
Column Chart Ppt PowerPoint Presentation Professional Template
This is a column chart ppt powerpoint presentation professional template. This is a two stage process. The stages in this process are product, percentage, finance, bar graph, growth.

Combo Chart Ppt PowerPoint Presentation Infographics Ideas
This is a combo chart ppt powerpoint presentation infographics ideas. This is a four stage process. The stages in this process are bar graph, marketing, strategy, finance, analysis.
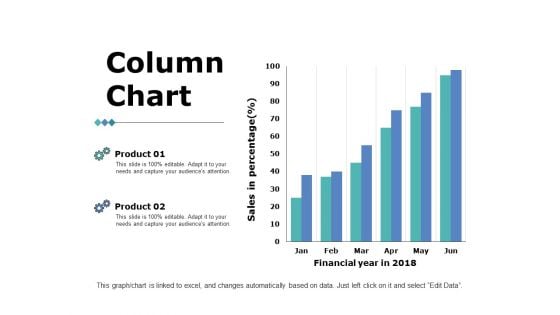
Column Chart Ppt PowerPoint Presentation Summary
This is a column chart ppt powerpoint presentation summary. This is a two stage process. The stages in this process are bar graph, marketing, strategy, finance, planning.
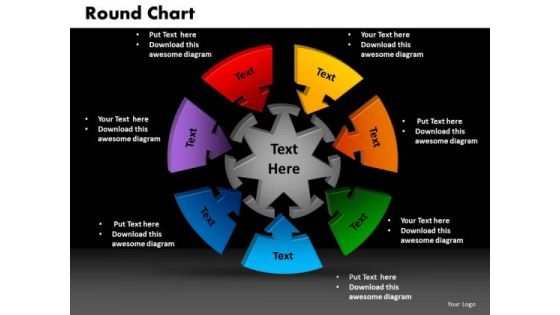
PowerPoint Design Slides Round Chart Image Ppt Themes
PowerPoint Design Slides Round Chart Image PPT Themes-Determine your targets and sequence them as per your priorities. Unravel each one for your audience while setting key timelines as you go along. Educate your listeners on the relevance and importance of each one as per your plan and how they all contribute as you strive to hit the Bullseye-PowerPoint Design Slides Round Chart Image PPT Themes-This ppt can be used for presentations relating to-3d, Angle, Arrow, Business, Chart, Circle, Complex, Concept, Data, Depth, Diagram, Dimensional, Financial, Graph, Graphic, Process Our PowerPoint Design Slides Round Chart Image Ppt Themes will fulfill your every need. Use them and effectively to gain success.
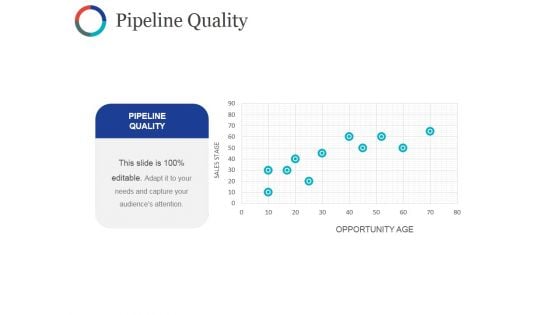
Pipeline Quality Ppt PowerPoint Presentation Portfolio Diagrams
This is a pipeline quality ppt powerpoint presentation portfolio diagrams. This is a five stage process. The stages in this process are business, marketing, finance, graph, plan.

Bar Diagram Ppt PowerPoint Presentation Show Maker
This is a bar diagram ppt powerpoint presentation show maker. This is a seven stage process. The stages in this process are bar graph, finance, marketing, strategy, business.
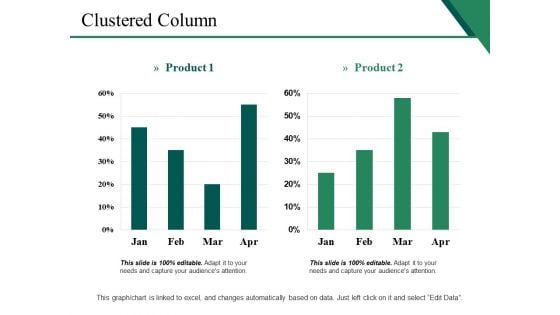
Clustered Column Ppt PowerPoint Presentation Styles Diagrams
This is a clustered column ppt powerpoint presentation styles diagrams. This is a two stage process. The stages in this process are business, marketing, graph, finance, clustered column.
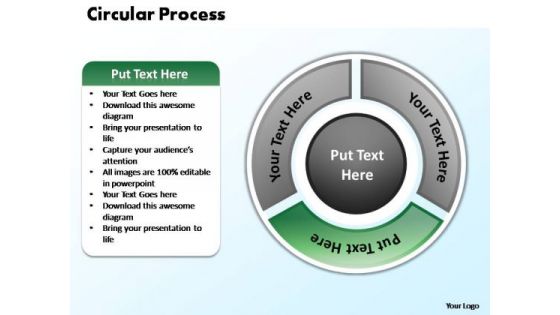
PowerPoint Themes Diagram Circular Process Ppt Theme
PowerPoint Themes Diagram Circular Process PPT Theme-Highlight the key components of your entire manufacturing/ business process. Illustrate how each element flows seamlessly onto the next stage. Emphasise on any critical or key factors within them. Demonstrate how they all combine to form the final product.-PowerPoint Themes Diagram Circular Process PPT Theme Despatch your views with the assistance of our PowerPoint Themes Diagram Circular Process Ppt Theme. They will deliver them on the dot.

 Home
Home