Graph Icon
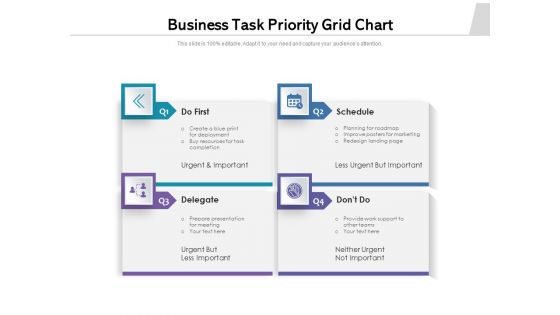
Business Task Priority Grid Chart Ppt PowerPoint Presentation Gallery Graphics Template PDF
Presenting business task priority grid chart ppt powerpoint presentation gallery graphics template pdf to dispense important information. This template comprises four stages. It also presents valuable insights into the topics including planning for roadmap, resources, marketing. This is a completely customizable PowerPoint theme that can be put to use immediately. So, download it and address the topic impactfully.
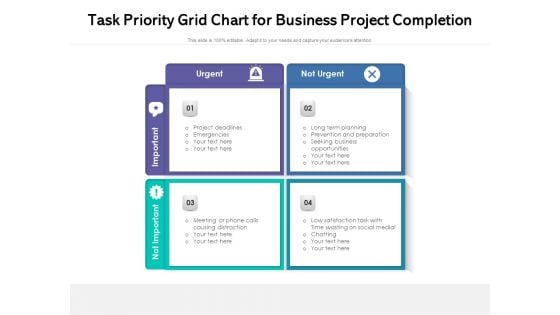
Task Priority Grid Chart For Business Project Completion Ppt PowerPoint Presentation Gallery Rules PDF
Presenting task priority grid chart for business project completion ppt powerpoint presentation gallery rules pdf to dispense important information. This template comprises four stages. It also presents valuable insights into the topics including business, planning, social medial. This is a completely customizable PowerPoint theme that can be put to use immediately. So, download it and address the topic impactfully.
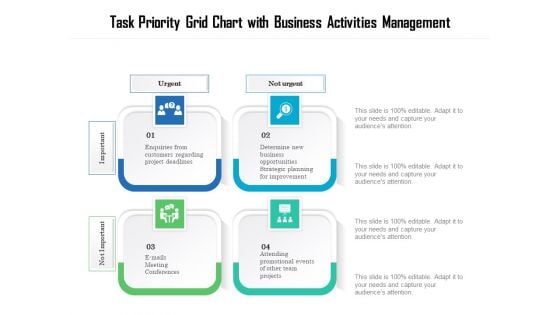
Task Priority Grid Chart With Business Activities Management Ppt PowerPoint Presentation File Format PDF
Presenting task priority grid chart with business activities management ppt powerpoint presentation file format pdf to dispense important information. This template comprises four stages. It also presents valuable insights into the topics including opportunities, strategic, planning. This is a completely customizable PowerPoint theme that can be put to use immediately. So, download it and address the topic impactfully.
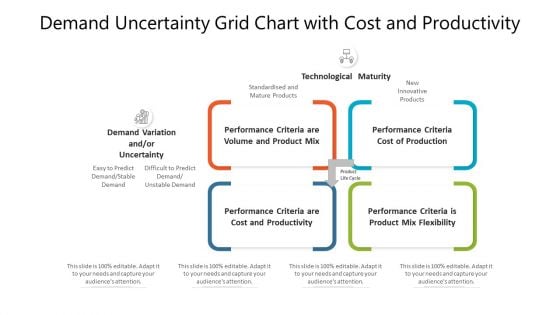
Demand Uncertainty Grid Chart With Cost And Productivity Ppt PowerPoint Presentation Gallery Vector PDF
Presenting demand uncertainty grid chart with cost and productivity ppt powerpoint presentation gallery vector pdf to dispense important information. This template comprises four stages. It also presents valuable insights into the topics including performance, flexibility, criteria. This is a completely customizable PowerPoint theme that can be put to use immediately. So, download it and address the topic impactfully.
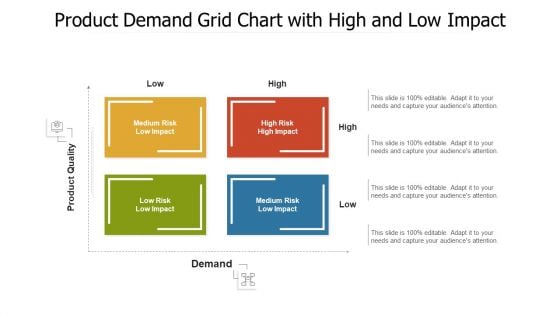
Product Demand Grid Chart With High And Low Impact Ppt PowerPoint Presentation File Graphics PDF
Presenting product demand grid chart with high and low impact ppt powerpoint presentation file graphics pdf to dispense important information. This template comprises four stages. It also presents valuable insights into the topics including product quality, demand. This is a completely customizable PowerPoint theme that can be put to use immediately. So, download it and address the topic impactfully.
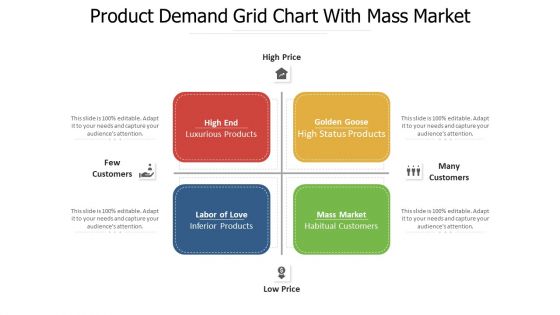
Product Demand Grid Chart With Mass Market Ppt PowerPoint Presentation Gallery Background PDF
Presenting product demand grid chart with mass market ppt powerpoint presentation gallery background pdf to dispense important information. This template comprises four stages. It also presents valuable insights into the topics including inferior products, luxurious products, habitual customers. This is a completely customizable PowerPoint theme that can be put to use immediately. So, download it and address the topic impactfully.
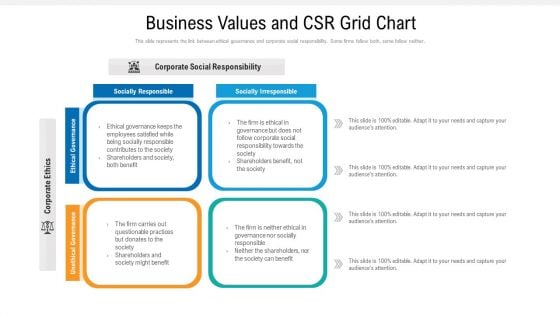
Business Values And CSR Grid Chart Ppt PowerPoint Presentation Gallery Inspiration PDF
business values and csr grid chart ppt powerpoint presentation gallery inspiration pdf. to dispense important information. This template comprises four stages. It also presents valuable insights into the topics including socially responsible, socially irresponsible, corporate social responsibility. This is a completely customizable PowerPoint theme that can be put to use immediately. So, download it and address the topic impactfully.
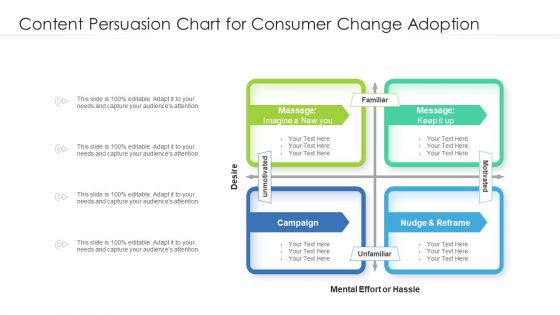
Content Persuasion Chart For Consumer Change Adoption Ppt PowerPoint Presentation Infographics Smartart PDF
Presenting content persuasion chart for consumer change adoption ppt powerpoint presentation infographics smartart pdf to dispense important information. This template comprises four stages. It also presents valuable insights into the topics including unmotivated, mental effort hassle, campaign. This is a completely customizable PowerPoint theme that can be put to use immediately. So, download it and address the topic impactfully.
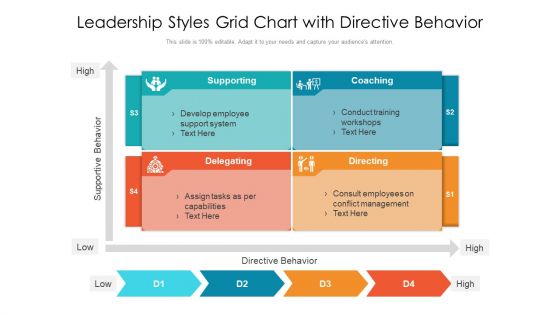
Leadership Styles Grid Chart With Directive Behavior Ppt PowerPoint Presentation Gallery Shapes PDF
Presenting leadership styles grid chart with directive behavior ppt powerpoint presentation gallery shapes pdf to dispense important information. This template comprises four stages. It also presents valuable insights into the topics including supporting, delegating, directing, coaching. This is a completely customizable PowerPoint theme that can be put to use immediately. So, download it and address the topic impactfully.
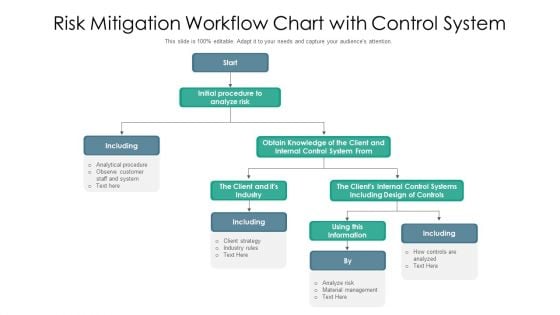
Risk Mitigation Workflow Chart With Control System Ppt PowerPoint Presentation Ideas Display PDF
Presenting risk mitigation workflow chart with control system ppt powerpoint presentation ideas display pdf to dispense important information. This template comprises two stages. It also presents valuable insights into the topics including using this information, including, initial procedure. This is a completely customizable PowerPoint theme that can be put to use immediately. So, download it and address the topic impactfully.
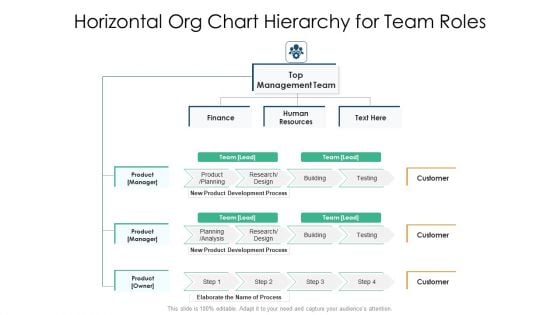
Horizontal Org Chart Hierarchy For Team Roles Ppt PowerPoint Presentation File Structure PDF
Presenting horizontal org chart hierarchy for team roles ppt powerpoint presentation file structure pdf to dispense important information. This template comprises four stages. It also presents valuable insights into the topics including finance, human resources, product planning. This is a completely customizable PowerPoint theme that can be put to use immediately. So, download it and address the topic impactfully.
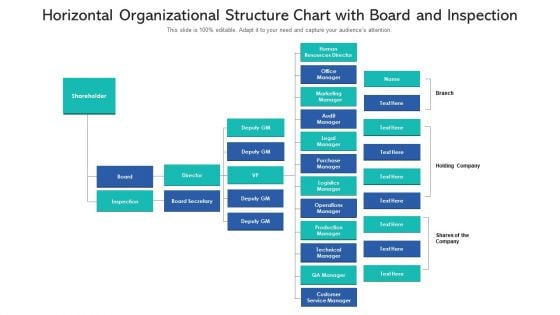
Horizontal Organizational Structure Chart With Board And Inspection Ppt PowerPoint Presentation File Master Slide PDF
Presenting horizontal organizational structure chart with board and inspection ppt powerpoint presentation file master slide pdf to dispense important information. This template comprises five stages. It also presents valuable insights into the topics including technical manager, customer service manager, legal manager. This is a completely customizable PowerPoint theme that can be put to use immediately. So, download it and address the topic impactfully.
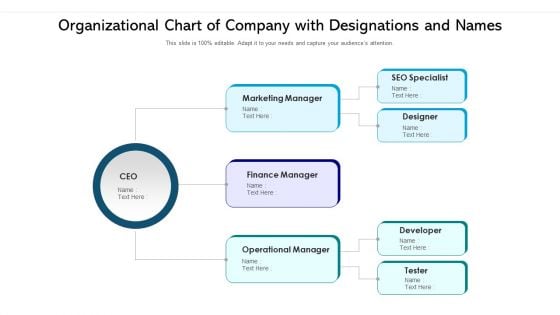
Organizational Chart Of Company With Designations And Names Ppt PowerPoint Presentation Gallery Deck PDF
Presenting organizational chart of company with designations and names ppt powerpoint presentation gallery deck pdf to dispense important information. This template comprises two stages. It also presents valuable insights into the topics including marketing manager, finance manager, operational manager. This is a completely customizable PowerPoint theme that can be put to use immediately. So, download it and address the topic impactfully.
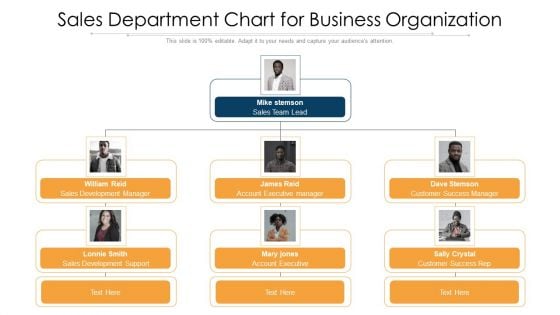
Sales Department Chart For Business Organization Ppt PowerPoint Presentation File Tips PDF
Presenting sales department chart for business organization ppt powerpoint presentation file tips pdf to dispense important information. This template comprises two stages. It also presents valuable insights into the topics including sales team, sales development manager, account executive. This is a completely customizable PowerPoint theme that can be put to use immediately. So, download it and address the topic impactfully.
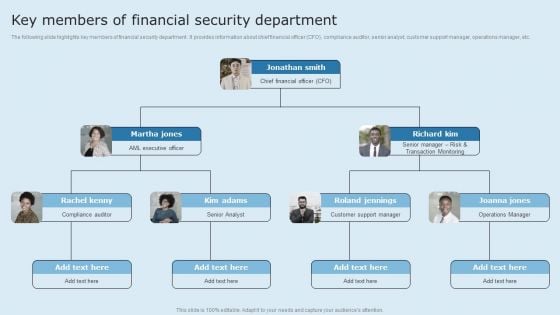
Actual Time Transaction Monitoring Software And Strategies Key Members Of Financial Security Department Diagrams PDF
The following slide highlights key members of financial security department. It provides information about chief financial officer CFO, compliance auditor, senior analyst, customer support manager, operations manager, etc. Coming up with a presentation necessitates that the majority of the effort goes into the content and the message you intend to convey. The visuals of a PowerPoint presentation can only be effective if it supplements and supports the story that is being told. Keeping this in mind our experts created Actual Time Transaction Monitoring Software And Strategies Key Members Of Financial Security Department Diagrams PDF to reduce the time that goes into designing the presentation. This way, you can concentrate on the message while our designers take care of providing you with the right template for the situation.
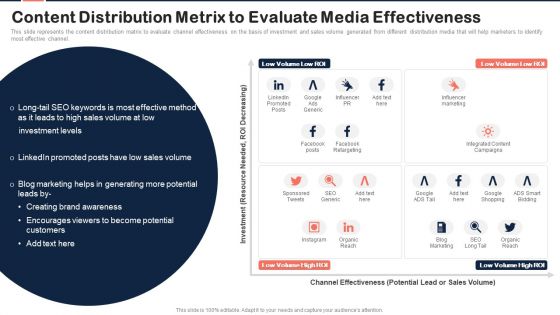
Implementing Content Marketing Plan To Nurture Leads Content Distribution Metrix To Evaluate Media Diagrams PDF
This slide represents the content distribution matrix to evaluate channel effectiveness on the basis of investment and sales volume generated from different distribution media that will help marketers to identify most effective channel. Want to ace your presentation in front of a live audience Our Implementing Content Marketing Plan To Nurture Leads Content Distribution Metrix To Evaluate Media Diagrams PDF can help you do that by engaging all the users towards you. Slidegeeks experts have put their efforts and expertise into creating these impeccable powerpoint presentations so that you can communicate your ideas clearly. Moreover, all the templates are customizable, and easy to edit and downloadable. Use these for both personal and commercial use.
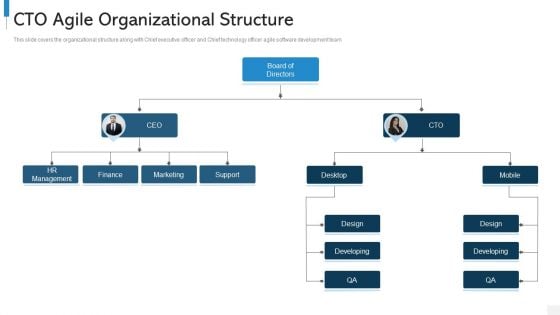
Agile Org Chart It Cto Agile Organizational Structure Download PDF
This slide covers the organizational structure along with Chief executive officer and Chief technology officer agile software development team Presenting agile org chart it cto agile organizational structure download pdf to provide visual cues and insights. Share and navigate important information on three stages that need your due attention. This template can be used to pitch topics like board of directors, hr management, marketing In addtion, this PPT design contains high resolution images, graphics, etc, that are easily editable and available for immediate download.
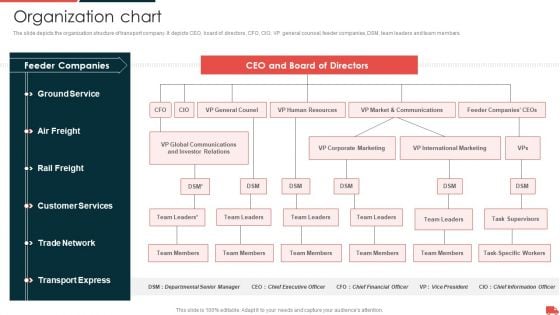
Transportation And Logistics Services Company Profile Organization Chart Graphics PDF
The slide depicts the organization structure of transport company. It depicts CEO, board of directors, CFO, CIO, VP general counsel, feeder companies, DSM, team leaders and team members. Presenting Transportation And Logistics Services Company Profile Organization Chart Graphics PDF to provide visual cues and insights. Share and navigate important information on six stages that need your due attention. This template can be used to pitch topics like Ground Service, Feeder Companies, Customer Services, Trade Network, Transport Express. In addtion, this PPT design contains high resolution images, graphics, etc, that are easily editable and available for immediate download.
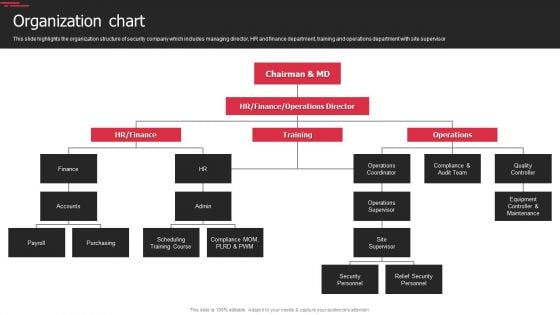
Security Agency Business Profile Organization Chart Topics PDF
This slide highlights the organization structure of security company which includes managing director, HR and finance department, training and operations department with site supervisor. This is a Security Agency Business Profile Organization Chart Topics PDF template with various stages. Focus and dispense information on six stages using this creative set, that comes with editable features. It contains large content boxes to add your information on topics like Operations Supervisor, Security Personnel, Relief Security Personnel. You can also showcase facts, figures, and other relevant content using this PPT layout. Grab it now.
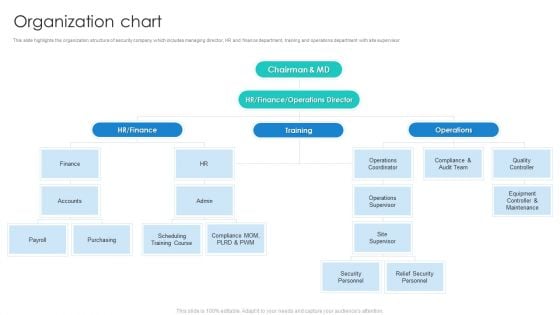
Manpower Corporate Security Business Profile Organization Chart Rules PDF
This slide highlights the organization structure of security company which includes managing director, HR and finance department, training and operations department with site supervisor. This is a Manpower Corporate Security Business Profile Organization Chart Rules PDF template with various stages. Focus and dispense information on six stages using this creative set, that comes with editable features. It contains large content boxes to add your information on topics like Finance, Operations Supervisor, Audit Team. You can also showcase facts, figures, and other relevant content using this PPT layout. Grab it now.
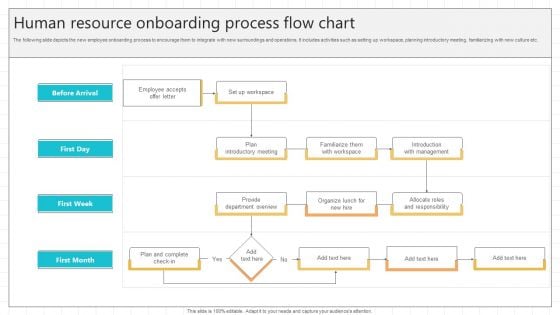
Human Resource Onboarding Process Flow Chart Microsoft PDF
The following slide depicts the new employee onboarding process to encourage them to integrate with new surroundings and operations. It includes activities such as setting up workspace, planning introductory meeting, familiarizing with new culture etc. Persuade your audience using this Human Resource Onboarding Process Flow Chart Microsoft PDF. This PPT design covers one stages, thus making it a great tool to use. It also caters to a variety of topics including Employee Accepts, Plan Introductory Meeting, Provide Department Overview. Download this PPT design now to present a convincing pitch that not only emphasizes the topic but also showcases your presentation skills.
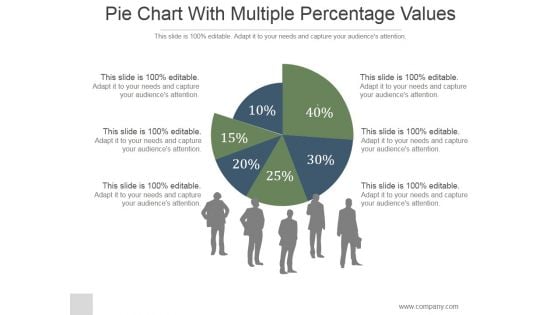
Pie Chart With Multiple Percentage Values Ppt PowerPoint Presentation Show
This is a pie chart with multiple percentage values ppt powerpoint presentation show. This is a six stage process. The stages in this process are pie, finance, people, silhouettes, communication.
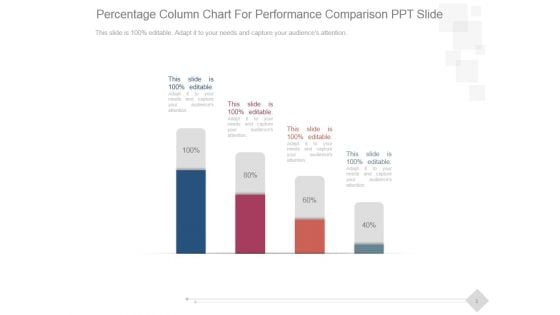
Percentage Column Chart For Performance Comparison Ppt PowerPoint Presentation Good
This is a percentage column chart for performance comparison ppt powerpoint presentation good. This is a four stage process. The stages in this process are business, marketing, technology, presentation, management.
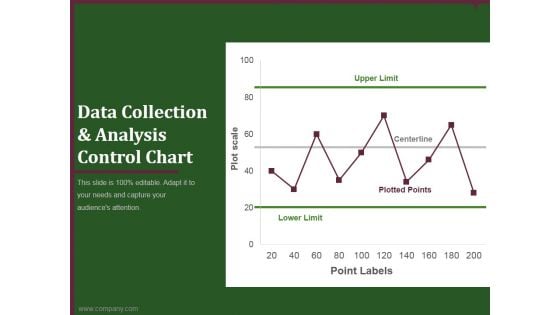
data collection and analysis control chart ppt powerpoint presentation styles
This is a data collection and analysis control chart ppt powerpoint presentation styles. This is a one stage process. The stages in this process are upper limit, centerline, plotted points, lower limit, point labels.
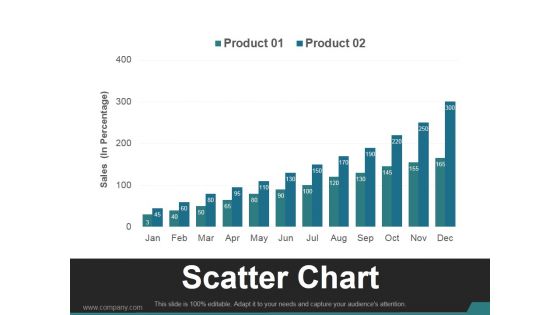
Scatter Chart Template 1 Ppt PowerPoint Presentation Visual Aids
This is a scatter chart template 1 ppt powerpoint presentation visual aids. This is a twelve stage process. The stages in this process are business, marketing, growth, finance, management.
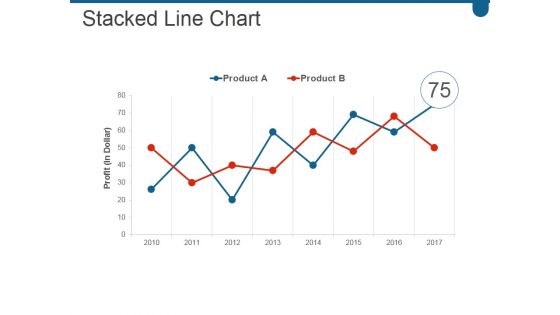
Stacked Line Chart Ppt PowerPoint Presentation Infographic Template Show
This is a stacked line chart ppt powerpoint presentation infographic template show. This is a two stage process. The stages in this process are business, marketing, growth, success, line.
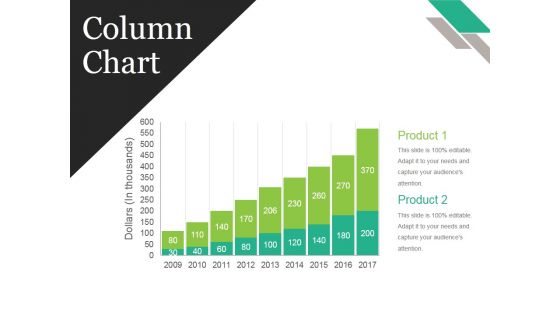
Column Chart Ppt PowerPoint Presentation Show Background Images
This is a column chart ppt powerpoint presentation show background images. This is a nine stage process. The stages in this process are business, strategy, marketing, analysis, growth strategy.
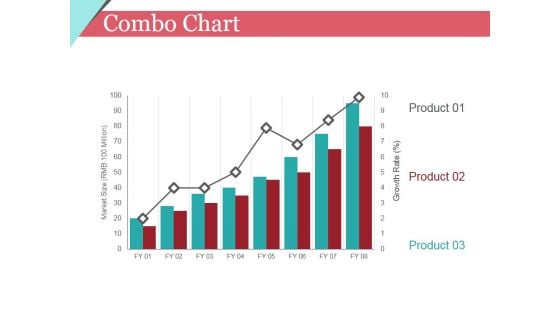
Combo Chart Ppt PowerPoint Presentation Summary Graphics Tutorials
This is a combo chart ppt powerpoint presentation summary graphics tutorials. This is a eight stage process. The stages in this process are product, growth rate, market size, business.
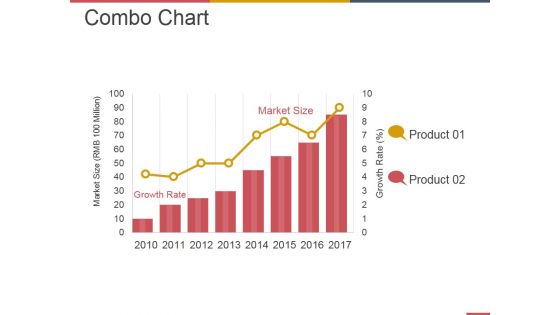
Combo Chart Ppt PowerPoint Presentation Infographic Template Deck
This is a combo chart ppt powerpoint presentation infographic template deck. This is a eight stage process. The stages in this process are business, strategy, marketing, analysis, growth strategy, market size.

Combo Chart Ppt PowerPoint Presentation Infographic Template Influencers
This is a combo chart ppt powerpoint presentation infographic template influencers. This is a three stage process. The stages in this process are market size rmb million, growth rate.
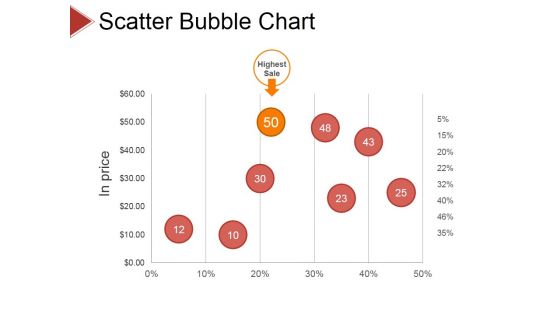
Scatter Bubble Chart Ppt PowerPoint Presentation Pictures Show
This is a scatter bubble chart ppt powerpoint presentation pictures show. This is a eight stage process. The stages in this process are business, strategy, analysis, pretention, highest sale.

High Low Close Chart Ppt PowerPoint Presentation Inspiration Professional
This is a high low close chart ppt powerpoint presentation inspiration professional. This is a ten stage process. The stages in this process are business, strategy, analysis, planning, high, volume, low.
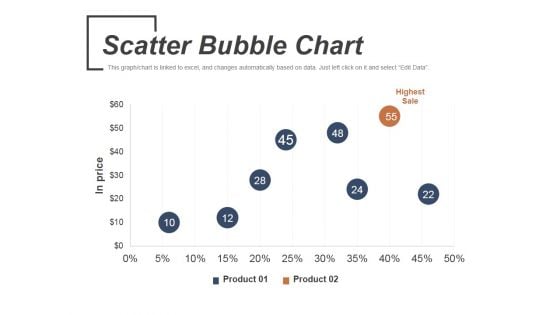
Scatter Bubble Chart Ppt PowerPoint Presentation Infographic Template Graphics
This is a scatter bubble chart ppt powerpoint presentation infographic template graphics. This is a two stage process. The stages in this process are highest sale, product, in price.
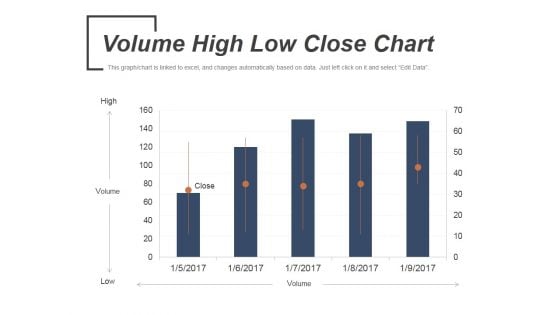
Volume High Low Close Chart Ppt PowerPoint Presentation Slides Portrait
This is a volume high low close chart ppt powerpoint presentation slides portrait. This is a five stage process. The stages in this process are volume, low, high, open, close.
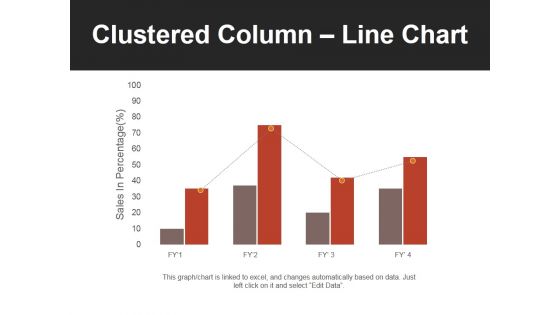
Clustered Column Line Chart Ppt PowerPoint Presentation Professional Slides
This is a clustered column line chart ppt powerpoint presentation professional slides. This is a four stage process. The stages in this process are bar, finance, business, marketing, growth.
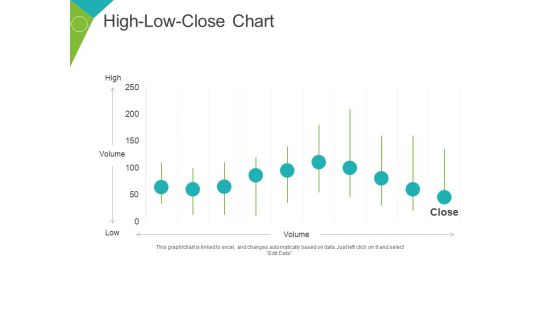
High Low Close Chart Ppt PowerPoint Presentation Layouts Guide
This is a high low close chart ppt powerpoint presentation layouts guide. This is a ten stage process. The stages in this process are high, volume, low, business, marketing, finance.
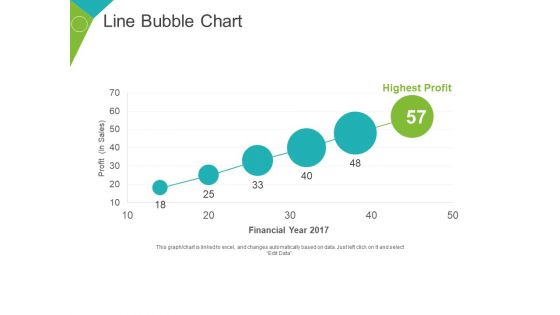
Line Bubble Chart Ppt PowerPoint Presentation Portfolio Slide Portrait
This is a line bubble chart ppt powerpoint presentation portfolio slide portrait. This is a six stage process. The stages in this process are highest profit, financial year, profit in sales, growth, business.
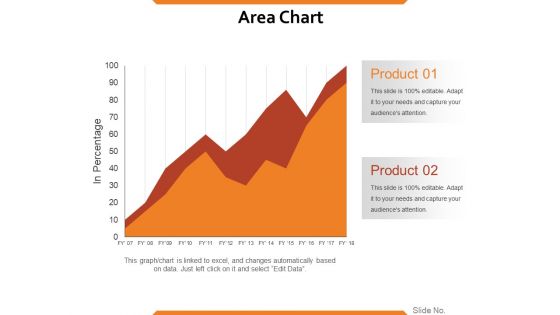
Area Chart Ppt PowerPoint Presentation Inspiration Slide Download
This is a area chart ppt powerpoint presentation inspiration slide download. This is a two stage process. The stages in this process are product, in percentage, business, growth, strategy, finance.
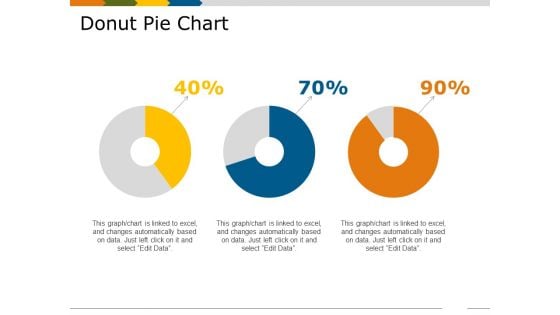
Donut Pie Chart Template 2 Ppt PowerPoint Presentation Show Skills
This is a donut pie chart template 2 ppt powerpoint presentation show skills. This is a three stage process. The stages in this process are percentage, business, marketing, process, finance.
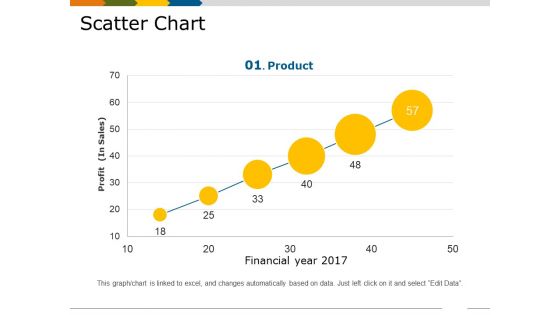
Scatter Chart Template 1 Ppt PowerPoint Presentation Show Slides
This is a scatter chart template 1 ppt powerpoint presentation show slides. This is a six stage process. The stages in this process are financial year, profit in sales, growth, business, marketing, product.
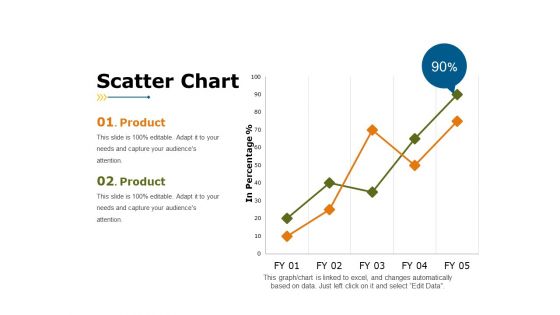
Scatter Chart Template 2 Ppt PowerPoint Presentation Styles Visual Aids
This is a scatter chart template 2 ppt powerpoint presentation styles visual aids. This is a two stage process. The stages in this process are product, business, marketing, in percentage, growth.
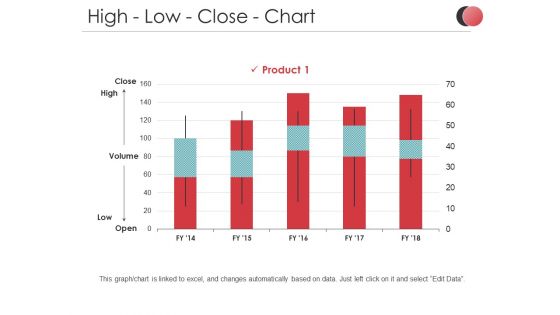
High Low Close Chart Ppt PowerPoint Presentation Ideas Brochure
This is a high low close chart ppt powerpoint presentation ideas brochure. This is a three stage process. The stages in this process are in percentage, product, business, marketing, finance.
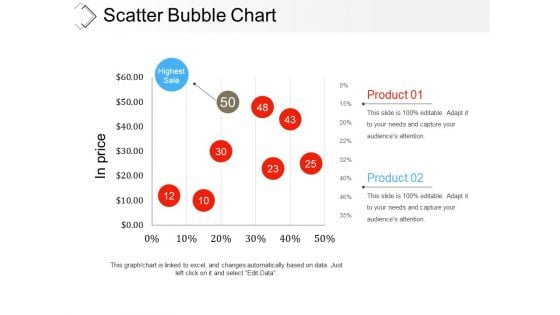
Scatter Bubble Chart Ppt PowerPoint Presentation Infographic Template Examples
This is a scatter bubble chart ppt powerpoint presentation infographic template examples. This is a two stage process. The stages in this process are highest sale, product, in price, finance, business.
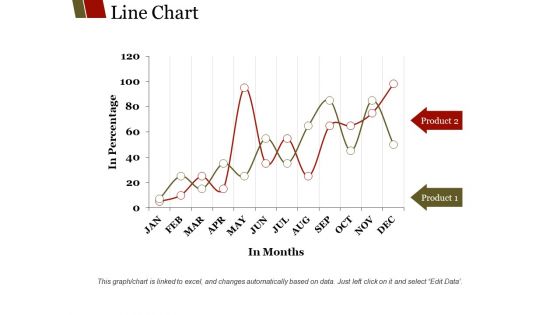
Line Chart Ppt PowerPoint Presentation Show Background Designs
This is a line chart ppt powerpoint presentation show background designs. This is a two stage process. The stages in this process are product, in months, in percentage, business.
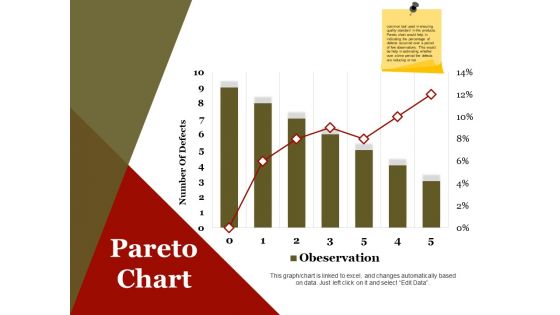
Pareto Chart Ppt PowerPoint Presentation Infographics Design Inspiration
This is a pareto chart ppt powerpoint presentation infographics design inspiration. This is a seven stage process. The stages in this process are number of defects, business, marketing, finance.
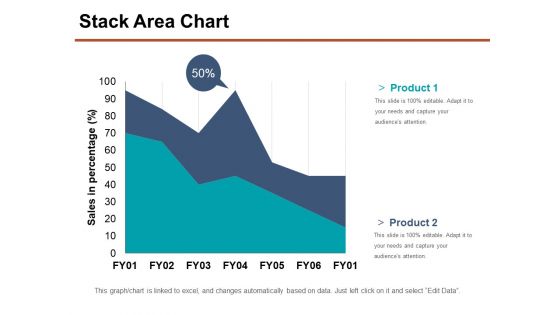
Stack Area Chart Ppt PowerPoint Presentation Show Samples
This is a stack area chart ppt powerpoint presentation show samples. This is a two stage process. The stages in this process are product, sales in percentage, business, marketing, percentage.
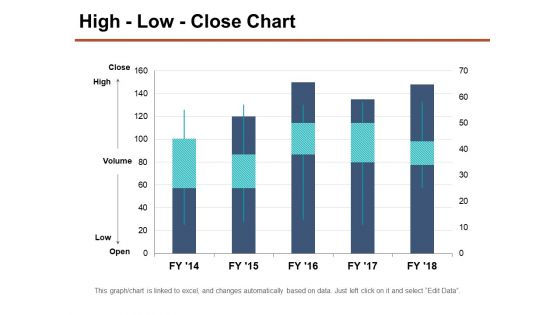
High Low Close Chart Ppt PowerPoint Presentation Layouts Objects
This is a high low close chart ppt powerpoint presentation layouts objects. This is a five stage process. The stages in this process are high, volume, low, business, marketing.
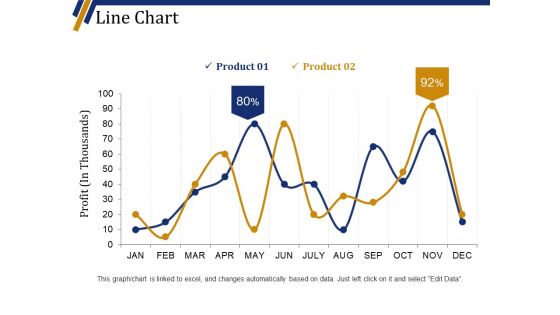
Line Chart Ppt PowerPoint Presentation Portfolio Background Designs
This is a line chart ppt powerpoint presentation portfolio background designs. This is a two stage process. The stages in this process are product, business, finance, marketing, profit in thousands.
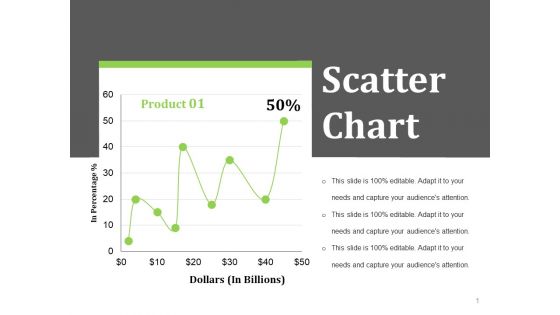
Scatter Chart Ppt PowerPoint Presentation Styles Layout Ideas
This is a scatter chart ppt powerpoint presentation styles layout ideas. This is a one stage process. The stages in this process are dollars in billions, in percentage, business, finance.
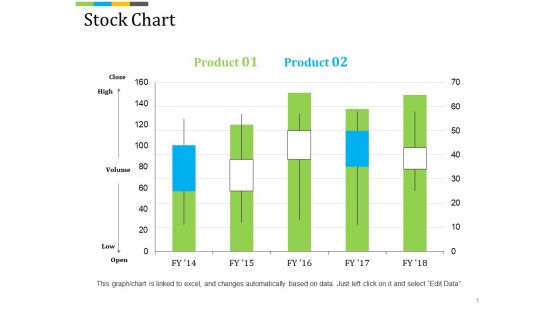
Stock Chart Ppt PowerPoint Presentation Professional Background Image
This is a stock chart ppt powerpoint presentation professional background image. This is a five stage process. The stages in this process are high, volume, low, finance, business, marketing.
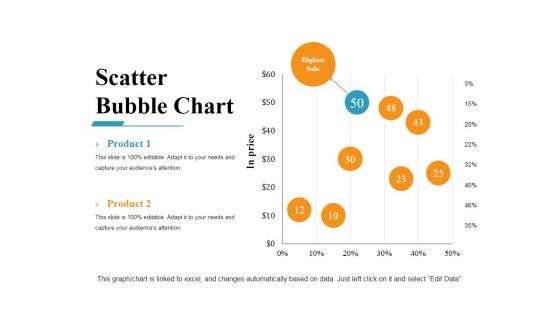
Scatter Bubble Chart Ppt PowerPoint Presentation Gallery Example Introduction
This is a scatter bubble chart ppt powerpoint presentation gallery example introduction. This is a eight stage process. The stages in this process are business, marketing, finance, bubble, scatter.
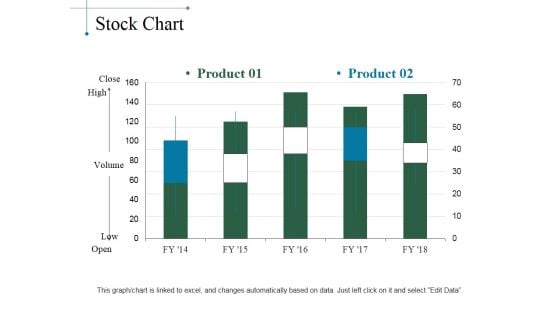
Stock Chart Ppt PowerPoint Presentation Layouts Designs Download
This is a stock chart ppt powerpoint presentation layouts designs download. This is a five stage process. The stages in this process are product, close, high, volume, low, open.

Line Chart Ppt PowerPoint Presentation Infographics Graphic Images
This is a line chart ppt powerpoint presentation infographics graphic images. This is a two stage process. The stages in this process are sales in percentage, financial years, growth, business, marketing.
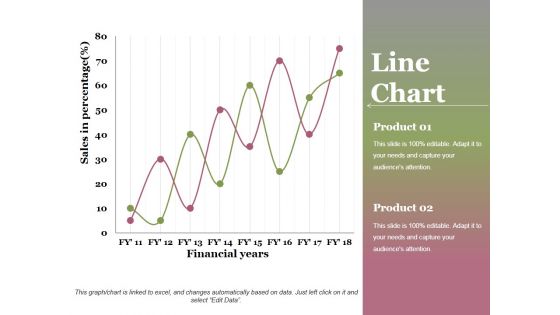
Line Chart Ppt PowerPoint Presentation Professional Graphics Design
This is a line chart ppt powerpoint presentation professional graphics design. This is a two stage process. The stages in this process are financial years, sales in percentage, product, growth, success.
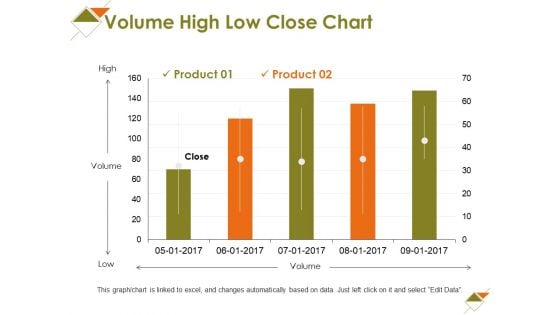
Volume High Low Close Chart Ppt PowerPoint Presentation Slides Styles
This is a volume high low close chart ppt powerpoint presentation slides styles. This is a two stage process. The stages in this process are high, volume, low, business, marketing.
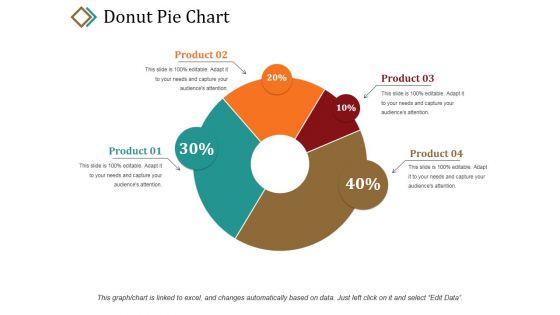
Donut Pie Chart Ppt PowerPoint Presentation Portfolio Graphic Tips
This is a donut pie chart ppt powerpoint presentation portfolio graphic tips. This is a four stage process. The stages in this process are product, percentage, business, marketing, donut.
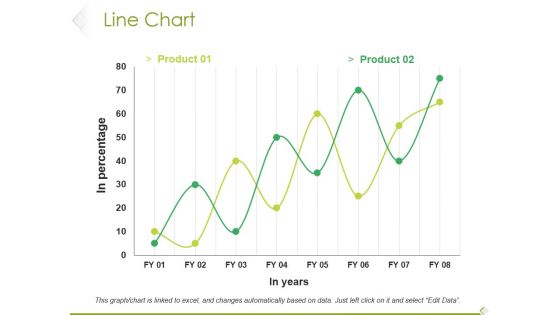
Line Chart Ppt PowerPoint Presentation File Example File
This is a line chart ppt powerpoint presentation file example file. This is a two stage process. The stages in this process are product, in percentage, in years, growth, success.
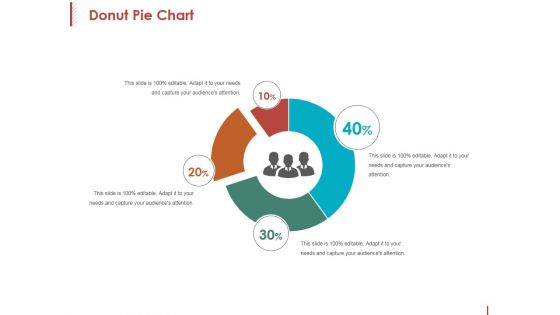
Donut Pie Chart Ppt PowerPoint Presentation Professional Example File
This is a donut pie chart ppt powerpoint presentation professional example file. This is a four stage process. The stages in this process are percentage, finance, donut, business, process.
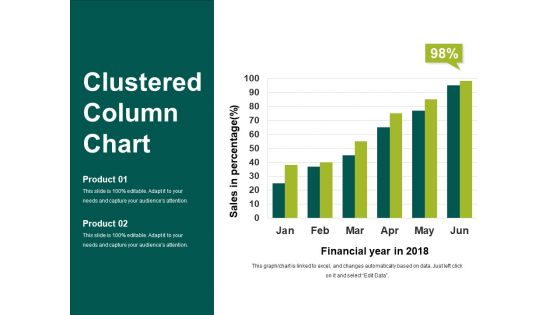
Clustered Column Chart Ppt PowerPoint Presentation Show Slideshow
This is a clustered column chart ppt powerpoint presentation show slideshow. This is a six stage process. The stages in this process are financial year in, sales in percentage, business, marketing, finance.
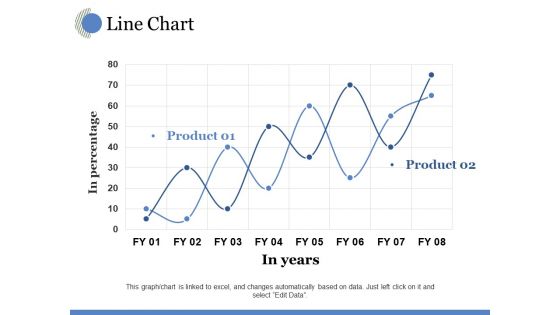
Line Chart Ppt PowerPoint Presentation Model Visual Aids
This is a line chart ppt powerpoint presentation model visual aids. This is a two stage process. The stages in this process are in years, in percentage, growth, business, marketing.
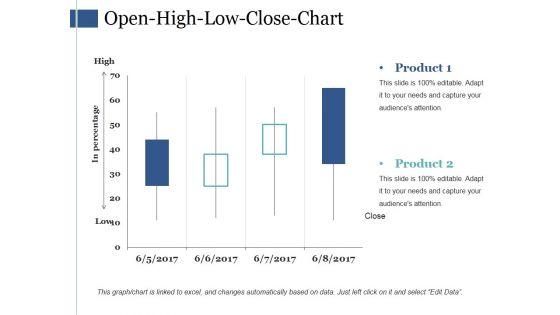
Open High Low Close Chart Ppt PowerPoint Presentation Styles Example
This is a open high low close chart ppt powerpoint presentation styles example. This is a four stage process. The stages in this process are business, marketing, finance, strategy, planning.
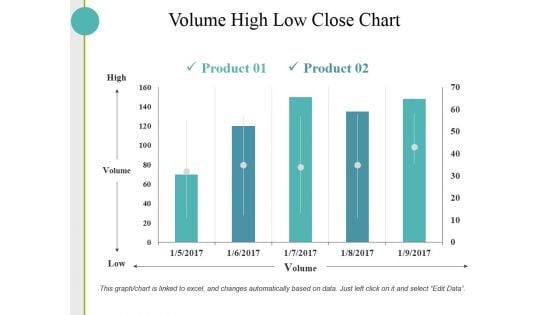
Volume High Low Close Chart Ppt PowerPoint Presentation Inspiration Skills
This is a volume high low close chart ppt powerpoint presentation inspiration skills. This is a two stage process. The stages in this process are high, volume, low, business.
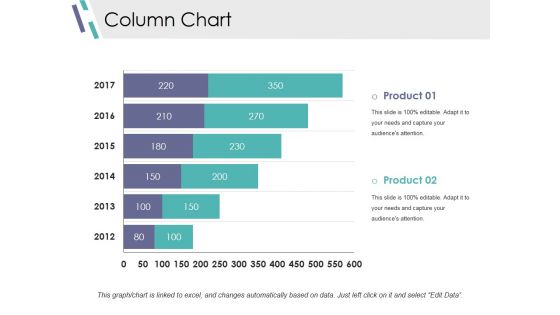
Column Chart Ppt PowerPoint Presentation Infographics Design Inspiration
This is a column chart ppt powerpoint presentation infographics design inspiration. This is a two stage process. The stages in this process are slide bar, marketing, strategy, finance, planning.
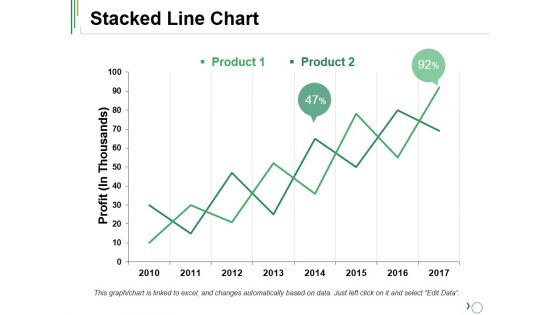
Stacked Line Chart Ppt PowerPoint Presentation Ideas Outfit
This is a stacked line chart ppt powerpoint presentation ideas outfit. This is a two stage process. The stages in this process are product, stacked line, profit, growth, success.
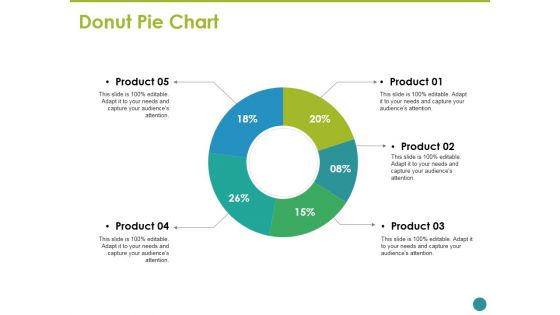
Donut Pie Chart Ppt PowerPoint Presentation Inspiration Graphic Images
This is a donut pie chart ppt powerpoint presentation inspiration graphic images. This is a five stage process. The stages in this process are business, marketing, strategy, planning, donut.
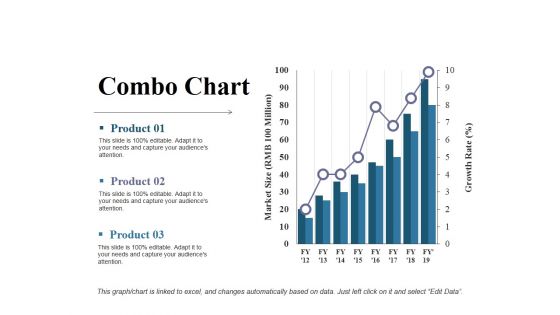
Combo Chart Ppt PowerPoint Presentation Styles Example Introduction
This is a combo chart ppt powerpoint presentation styles example introduction. This is a three stage process. The stages in this process are product, growth rate, market size, growth, success.
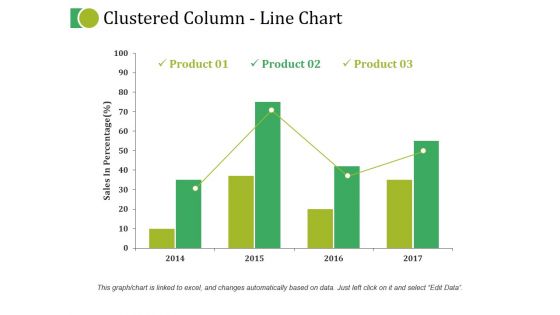
Clustered Column Line Chart Ppt PowerPoint Presentation Inspiration Graphics Pictures
This is a clustered column line chart ppt powerpoint presentation inspiration graphics pictures. This is a four stage process. The stages in this process are business, marketing, strategy, planning, finance.
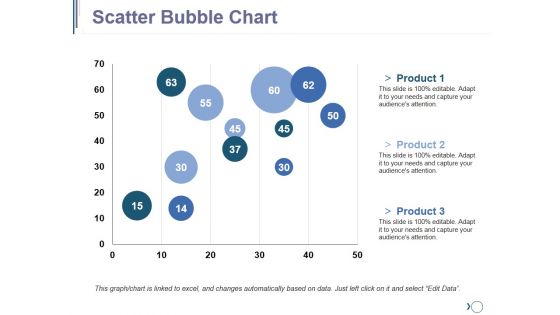
Scatter Bubble Chart Ppt PowerPoint Presentation Outline Graphics Pictures
This is a scatter bubble chart ppt powerpoint presentation outline graphics pictures. This is a three stage process. The stages in this process are finance, planning, business, marketing, strategy.

Column Chart Ppt PowerPoint Presentation Styles Graphics Design
This is a column chart ppt powerpoint presentation styles graphics design. This is a two stage process. The stages in this process are expenditure in, product, years, growth, success.
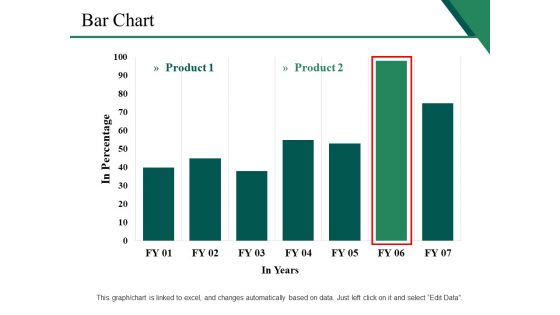
Bar Chart Ppt PowerPoint Presentation Inspiration Background Image
This is a bar chart ppt powerpoint presentation inspiration background image. This is a two stage process. The stages in this process are business, marketing, strategy, finance, in years, in percentage.
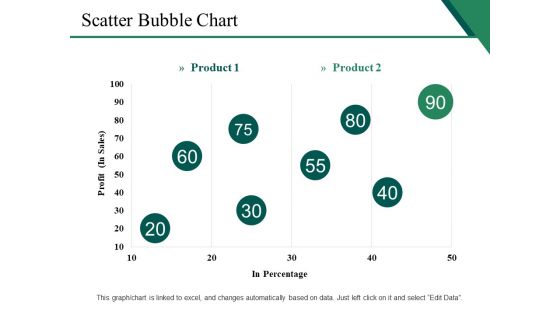
Scatter Bubble Chart Ppt PowerPoint Presentation Gallery Show
This is a scatter bubble chart ppt powerpoint presentation gallery show. This is a two stage process. The stages in this process are profit, in percentage, finance, marketing, business.
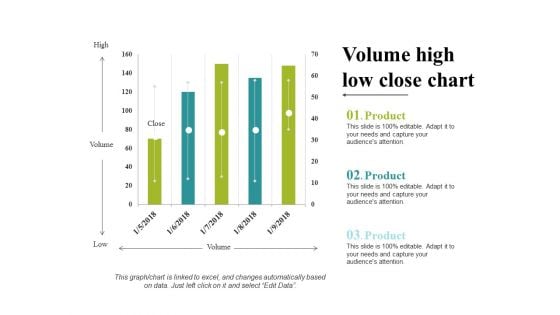
Volume High Low Close Chart Ppt PowerPoint Presentation Portfolio Clipart
This is a volume high low close chart ppt powerpoint presentation portfolio clipart. This is a five stage process. The stages in this process are business, marketing, strategy, planning, finance.
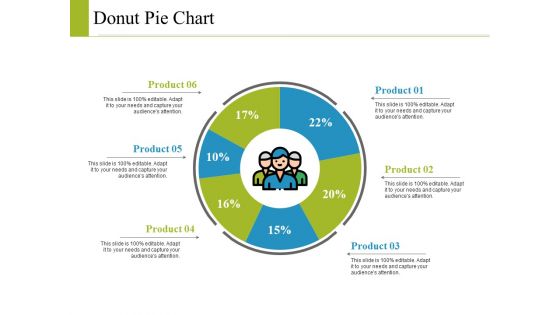
Donut Pie Chart Ppt PowerPoint Presentation Model Graphics Example
This is a donut pie chart ppt powerpoint presentation model graphics example. This is a six stage process. The stages in this process are business, marketing, strategy, planning, finance.
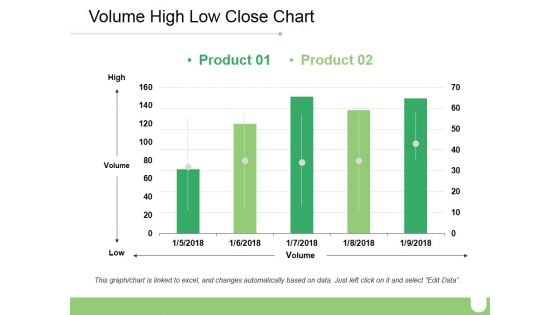
Volume High Low Close Chart Ppt PowerPoint Presentation Inspiration Brochure
This is a volume high low close chart ppt powerpoint presentation inspiration brochure. This is a two stage process. The stages in this process are business, high, volume, low, marketing.
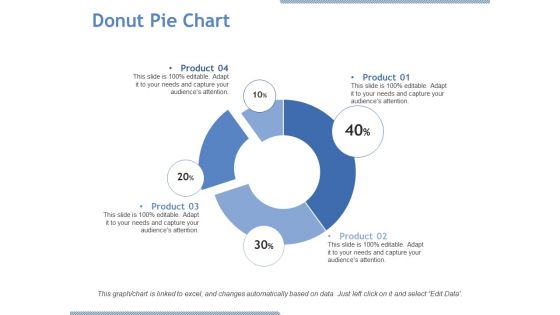
Donut Pie Chart Ppt PowerPoint Presentation Visual Aids Model
This is a donut pie chart ppt powerpoint presentation visual aids model. This is a four stage process. The stages in this process are product, percentage, finance, donut, business.
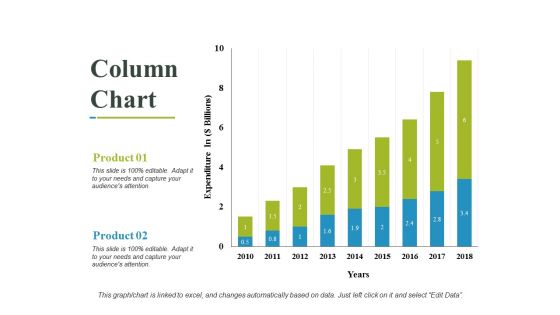
Column Chart Ppt PowerPoint Presentation Outline Design Ideas
This is a column chart ppt powerpoint presentation outline design ideas. This is a two stage process. The stages in this process are business, years, expenditure in, marketing, finance.
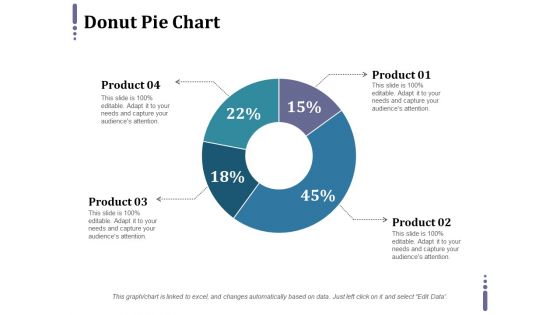
Donut Pie Chart Ppt PowerPoint Presentation Pictures Layout Ideas
This is a donut pie chart ppt powerpoint presentation pictures layout ideas. This is a four stage process. The stages in this process are percentage, finance, donut, business, product.
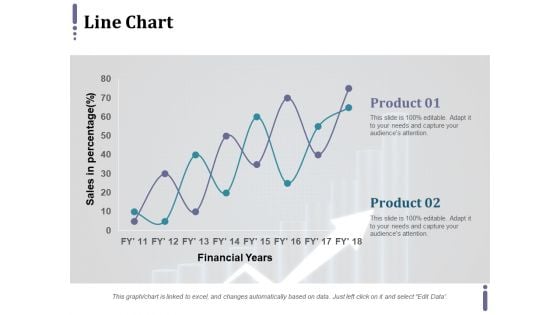
Line Chart Ppt PowerPoint Presentation Infographic Template Master Slide
This is a line chart ppt powerpoint presentation infographic template master slide. This is a two stage process. The stages in this process are product, financial years, sales in percentage.
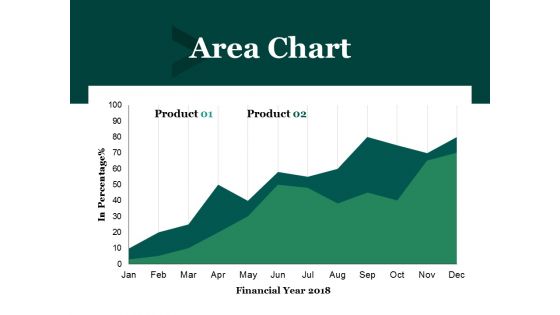
Area Chart Ppt PowerPoint Presentation Outline Graphics Pictures
This is a area chart ppt powerpoint presentation outline graphics pictures. This is a two stage process. The stages in this process are financial year, in percentage, business, marketing, finance.
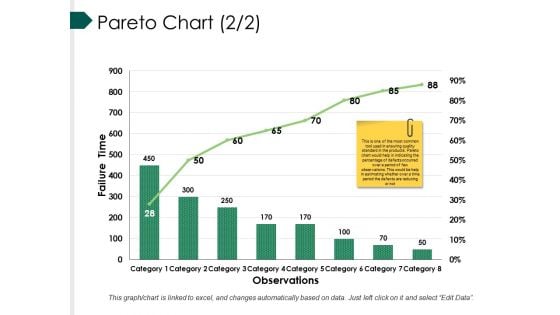
Pareto Chart Template Ppt PowerPoint Presentation Summary Graphic Images
This is a pareto chart template ppt powerpoint presentation summary graphic images. This is a eight stage process. The stages in this process are bar, marketing, strategy, finance, teamwork.
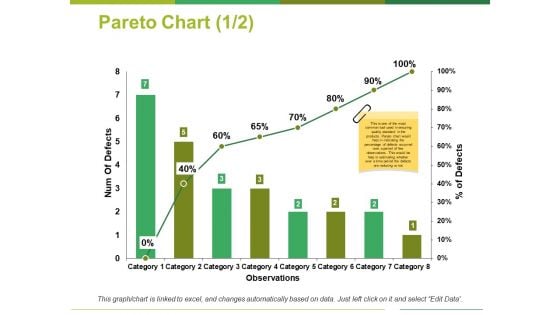
Pareto Chart Template 1 Ppt PowerPoint Presentation Outline Show
This is a pareto chart template 1 ppt powerpoint presentation outline show. This is a eight stage process. The stages in this process are num of defects, percentage of defects, observations, category.
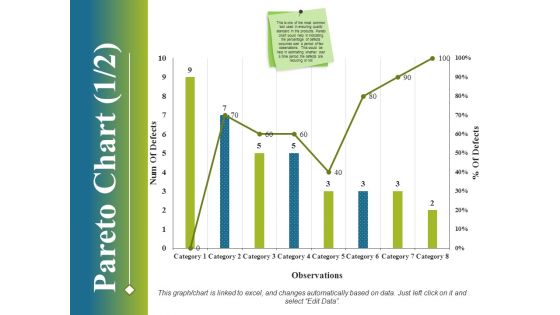
Pareto Chart Template 1 Ppt PowerPoint Presentation File Ideas
This is a pareto chart template 1 ppt powerpoint presentation file ideas. This is a eight stage process. The stages in this process are business, finance, marketing, strategy, analysis.

Regression Line Chart Ppt PowerPoint Presentation Visual Aids Summary
This is a regression line chart ppt powerpoint presentation visual aids summary. This is a two stage process. The stages in this process are linear periodization, linear growth, linear progression.
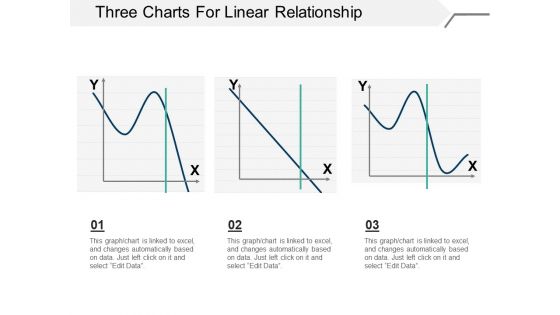
Three Charts For Linear Relationship Ppt PowerPoint Presentation Model Example
This is a three charts for linear relationship ppt powerpoint presentation model example. This is a three stage process. The stages in this process are linear periodization, linear growth, linear progression.
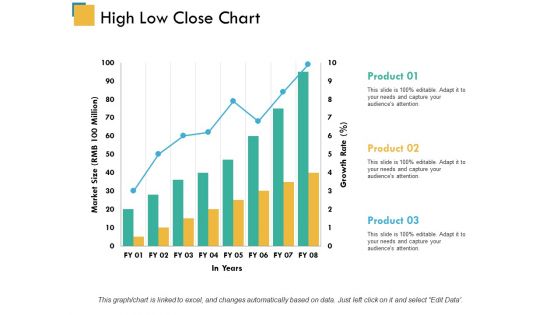
High Low Close Chart Ppt PowerPoint Presentation Model Inspiration
This is a high low close chart ppt powerpoint presentation model inspiration. This is a three stage process. The stages in this process are product, market size, in years.
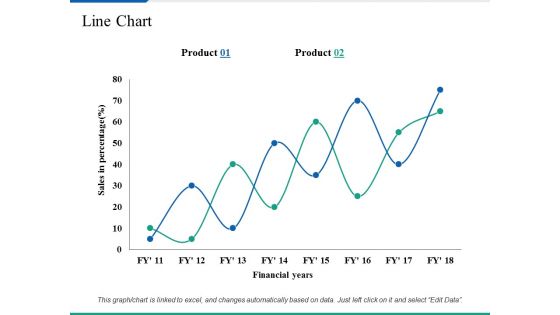
Line Chart Ppt PowerPoint Presentation Summary Clipart Images
This is a line chart ppt powerpoint presentation summary clipart images. This is a two stage process. The stages in this process are business, marketing, sales in percentage, financial years, strategy.
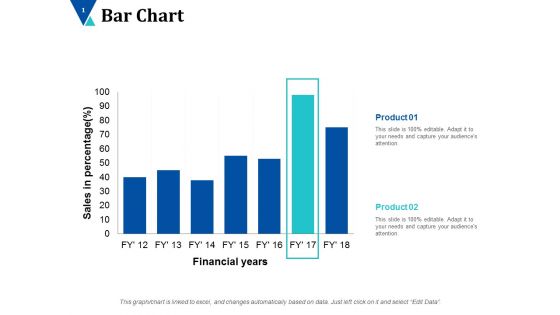
Bar Chart Finance Ppt PowerPoint Presentation Infographics Background Images
This is a bar chart finance ppt powerpoint presentation infographics background images. This is a seven stages process. The stages in this process are alpha testing, beta testing, full scale show.
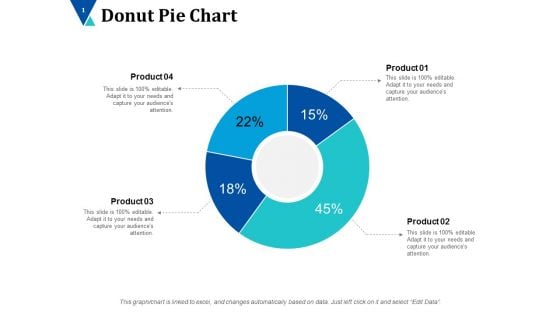
Donut Pie Chart Ppt PowerPoint Presentation Inspiration Designs Download
This is a donut pie chart ppt powerpoint presentation inspiration designs download. This is a four stage process. The stages in this process are donut, business, planning, marketing, finance.
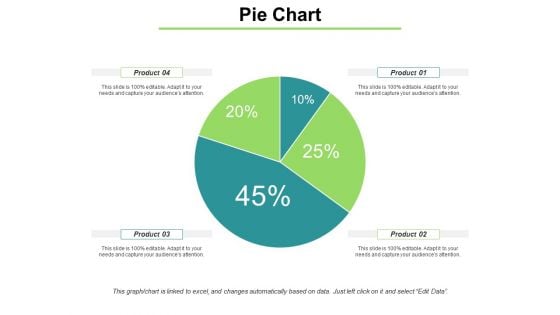
Pie Chart With Distrubation Ppt PowerPoint Presentation Model Ideas
This is a pie chart with distrubation ppt powerpoint presentation model ideas. This is a four stage process. The stages in this process are pie, finance, marketing, strategy, planning.
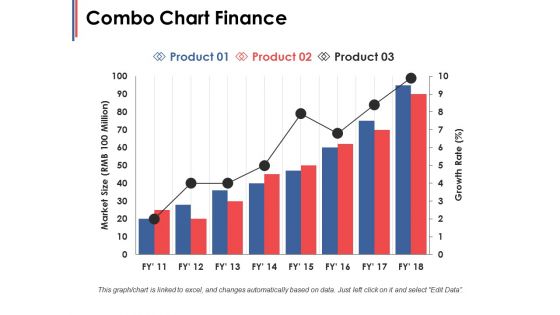
Combo Chart Finance Ppt PowerPoint Presentation Infographic Template Microsoft
This is a combo chart finance ppt powerpoint presentation infographic template microsoft. This is a three stage process. The stages in this process are finance, marketing, management, investment, analysis.
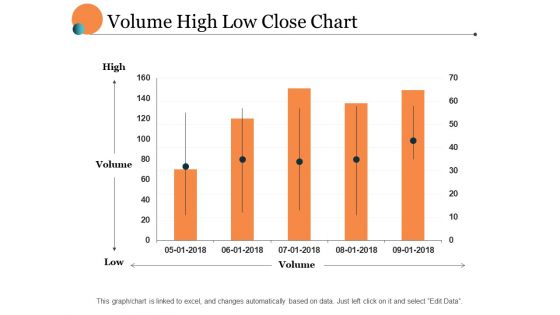
Volume High Low Close Chart Ppt PowerPoint Presentation Portfolio Layout
This is a volume high low close chart ppt powerpoint presentation portfolio layout. This is a five stage process. The stages in this process are finance, marketing, management, investment, analysis.
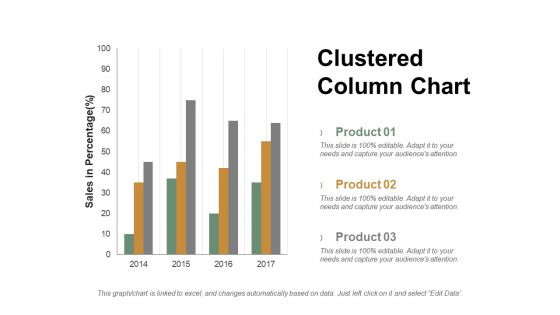
Clustered Column Chart Ppt PowerPoint Presentation Professional Ideas
This is a clustered column chart ppt powerpoint presentation professional ideas. This is a three stage process. The stages in this process are product, sales in percentage, column, years.
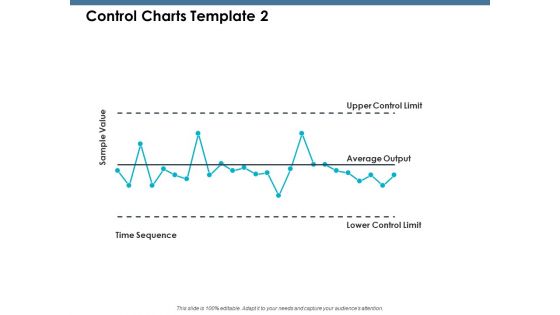
Control Charts Sample Value Ppt PowerPoint Presentation Infographics Demonstration
This is a control charts sample value ppt powerpoint presentation infographics demonstration. This is a five stage process. The stages in this process are product, percentage, marketing, business, management.
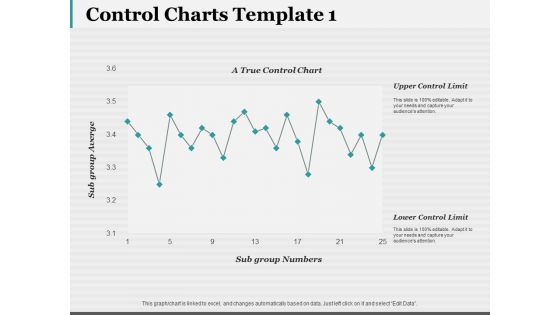
Control Charts Template 1 Ppt PowerPoint Presentation Show Graphics Design
This is a control charts template 1 ppt powerpoint presentation show graphics design. This is a one stage process. The stages in this process are business, finance, marketing, strategy, analysis.
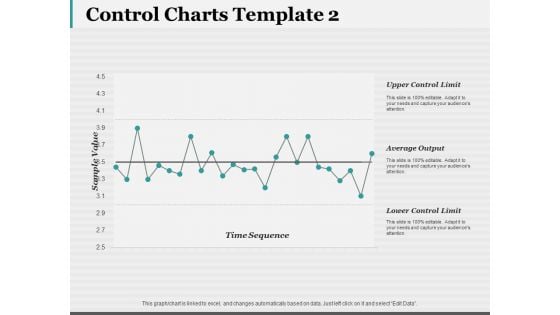
Control Charts Template 2 Ppt PowerPoint Presentation Slides Designs
This is a control charts template 2 ppt powerpoint presentation slides designs. This is a one stage process. The stages in this process are business, finance, marketing, strategy, analysis.
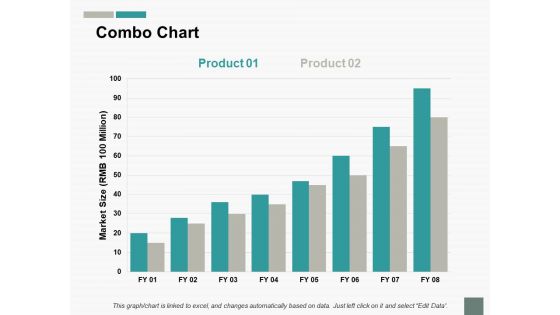
Combo Chart Finance Ppt PowerPoint Presentation Infographic Template Graphics
This is a combo chart finance ppt powerpoint presentation infographic template graphics. This is a two stage process. The stages in this process are growth, finance, marketing, management, investment.
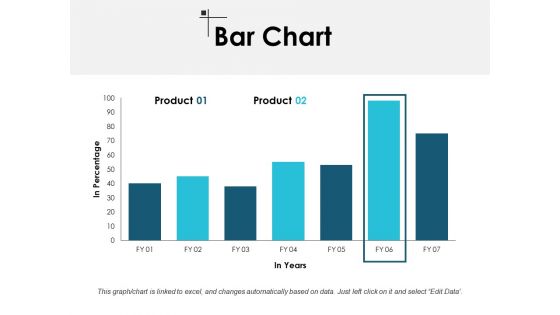
Bar Chart Finance Ppt PowerPoint Presentation Model Master Slide
This is a bar chart finance ppt powerpoint presentation model master slide. This is a two stage process. The stages in this process are finance, marketing, management, investment, analysis.
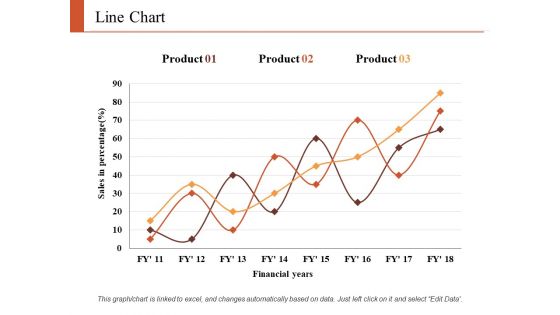
Line Chart Finance Ppt PowerPoint Presentation Infographic Template Graphics Tutorials
This is a line chart finance ppt powerpoint presentation infographic template graphics tutorials. This is a three stage process. The stages in this process are finance, marketing, analysis, business, investment.
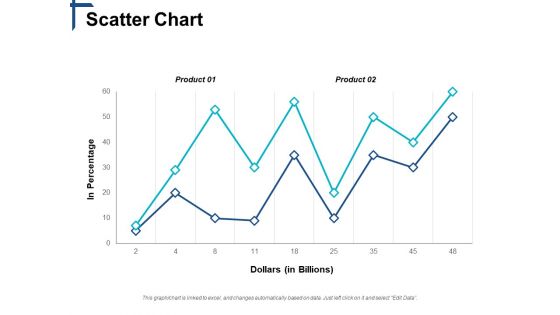
Scatter Chart Competitive Differentiation Ppt PowerPoint Presentation Show Slides
This is a scatter chart competitive differentiation ppt powerpoint presentation show slides. This is a two stage process. The stages in this process are business, management, marketing, strategy, sales.
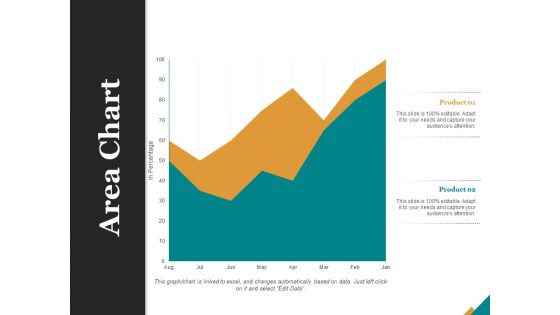
Area Chart Finance Ppt PowerPoint Presentation Summary Design Templates
This is a area chart finance ppt powerpoint presentation summary design templates. This is a two stage process. The stages in this process are finance, marketing, management, investment, analysis.
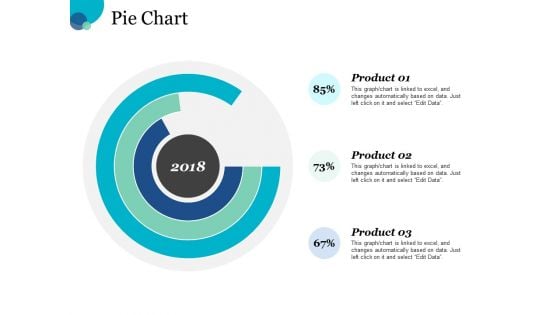
Pie Chart Finance Ppt PowerPoint Presentation Slides Graphic Images
This is a pie chart finance ppt powerpoint presentation slides graphic images. This is a three stage process. The stages in this process are finance, marketing, management, investment, analysis.
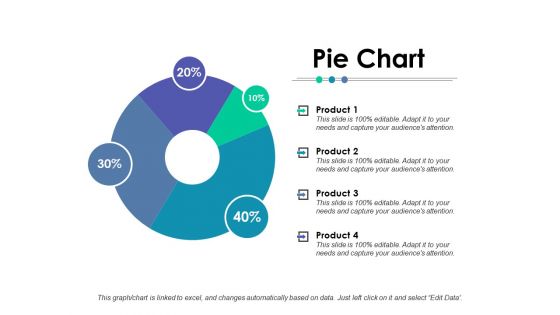
Pie Chart Finance Ppt PowerPoint Presentation Styles File Formats
This is a pie chart finance ppt powerpoint presentation styles file formats. This is a four stage process. The stages in this process are finance, analysis, business, investment, marketing.
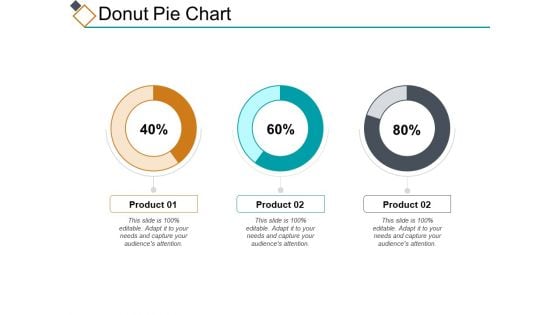
Donut Pie Chart Ppt PowerPoint Presentation Infographic Template Slides
This is a donut pie chart ppt powerpoint presentation infographic template slides. This is a three stage process. The stages in this process are percentage, product, business, management, marketing.
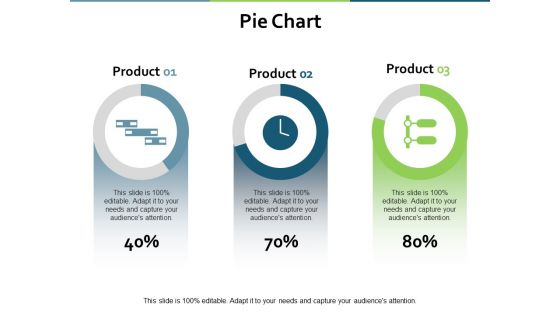
Pie Chart Marketing Finance Ppt PowerPoint Presentation Gallery Good
This is a pie chart marketing finance ppt powerpoint presentation gallery good. This is a three stage process. The stages in this process are finance, analysis, business, investment, marketing.
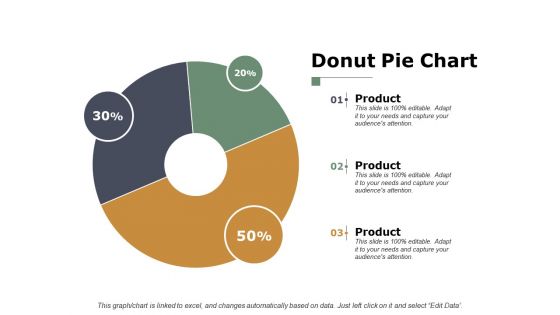
Donut Pie Chart Finance Ppt PowerPoint Presentation Inspiration Graphics
This is a donut pie chart finance ppt powerpoint presentation inspiration graphics. This is a three stage process. The stages in this process are finance, analysis, business, investment, marketing.
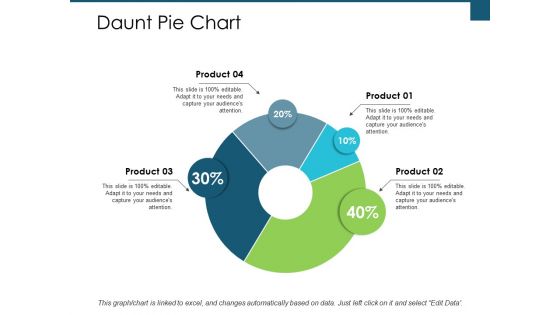
Daunt Pie Chart Investment Ppt PowerPoint Presentation Infographic Template Aids
This is a daunt pie chart investment ppt powerpoint presentation infographic template aids. This is a four stage process. The stages in this process are finance, analysis, business, investment, marketing.
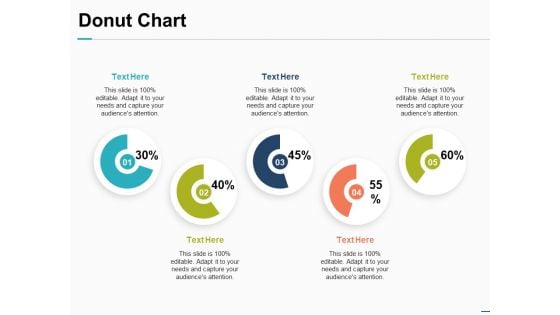
Donut Chart Financial Investment Ppt PowerPoint Presentation Inspiration Introduction
This is a donut chart financial investment ppt powerpoint presentation inspiration introduction. This is a five stage process. The stages in this process are finance, marketing, management, investment, analysis.
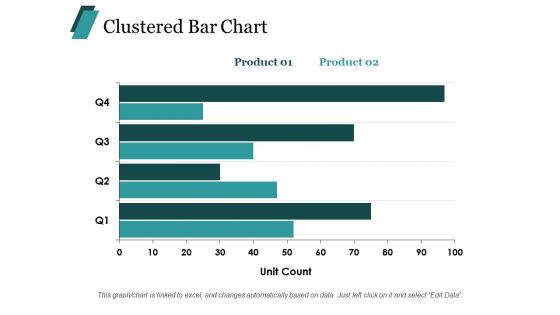
Clustered Bar Chart Finance Ppt PowerPoint Presentation Summary Layouts
This is a clustered bar chart finance ppt powerpoint presentation summary layouts. This is a two stage process. The stages in this process are finance, marketing, management, investment, analysis.
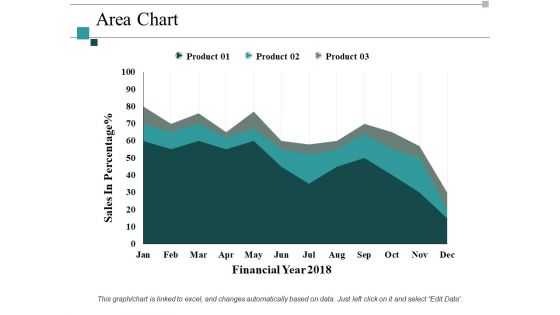
Area Chart Investment Ppt PowerPoint Presentation Summary Design Inspiration
This is a area chart investment ppt powerpoint presentation summary design inspiration. This is a three stage process. The stages in this process are finance, marketing, management, investment, analysis.
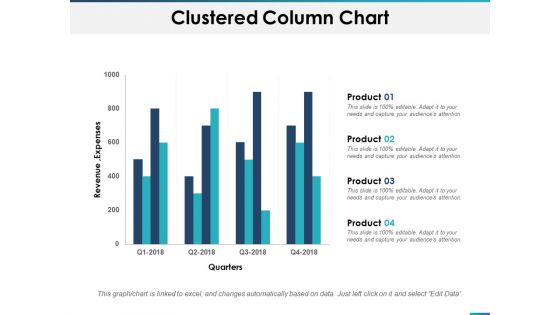
Clustered Column Chart Planning Ppt PowerPoint Presentation Portfolio Information
This is a clustered column chart planning ppt powerpoint presentation portfolio information. This is a four stage process. The stages in this process are finance, marketing, analysis, business, investment.
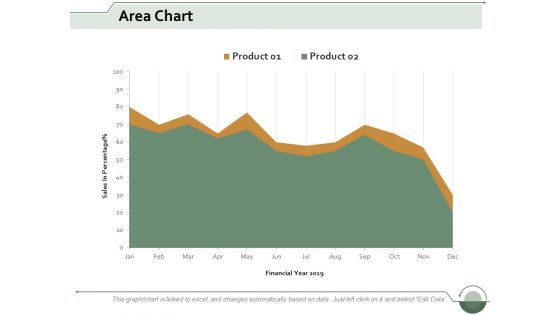
Area Chart Finance Ppt Powerpoint Presentation Infographic Template Clipart Images
This is a area chart finance ppt powerpoint presentation infographic template clipart images. This is a two stage process. The stages in this process are area bar, finance, marketing, management, analysis.
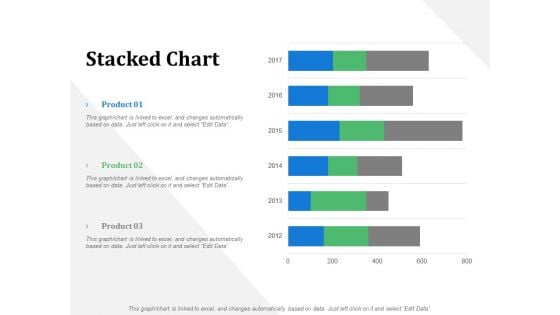
Stacked Chart Business Marketing Ppt PowerPoint Presentation File Design Ideas
This is a stacked chart business marketing ppt powerpoint presentation file design ideas. This is a three stage process. The stages in this process are business, management, marketing, product, percentage.

Donut Chart Marketing Product Ppt PowerPoint Presentation Slides Background Designs
This is a donut chart marketing product ppt powerpoint presentation slides background designs. This is a three stage process. The stages in this process are business, management, marketing, percentage, product.
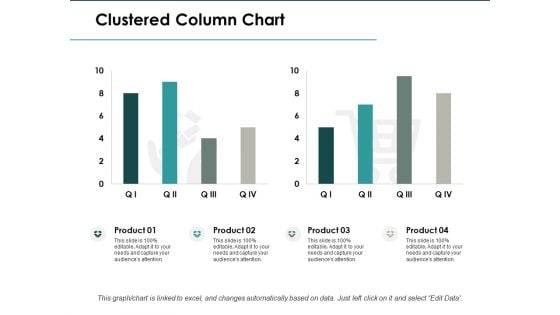
Clustered Column Chart Investment Ppt PowerPoint Presentation Infographic Template Clipart
This is a clustered column chart investment ppt powerpoint presentation infographic template clipart. This is a four stage process. The stages in this process are finance, analysis, business, investment, marketing.
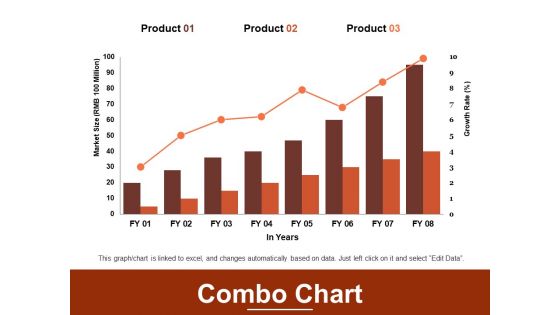
Combo Chart Finance Marketing Ppt PowerPoint Presentation File Guidelines
This is a combo chart finance marketing ppt powerpoint presentation file guidelines. This is a three stage process. The stages in this process are finance, analysis, business, investment, marketing.
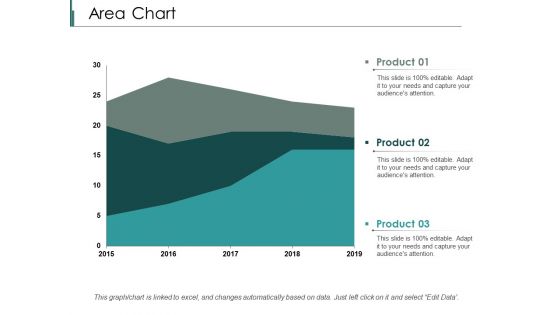
Area Chart Finance Ppt PowerPoint Presentation Styles Designs Download
This is a area chart finance ppt powerpoint presentation styles designs download. This is a three stage process. The stages in this process are finance, analysis, business, investment, marketing.
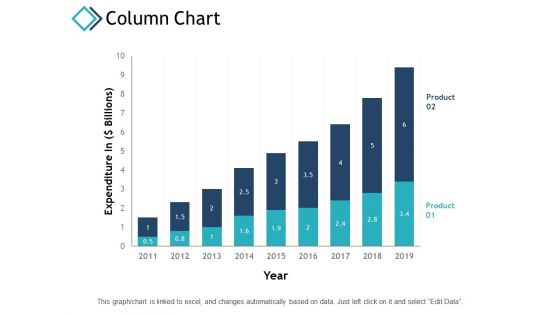
Column Chart Finance Investment Ppt PowerPoint Presentation Inspiration Template
This is a column chart finance investment ppt powerpoint presentation inspiration template. This is a two stage process. The stages in this process are finance, analysis, business, investment, marketing.
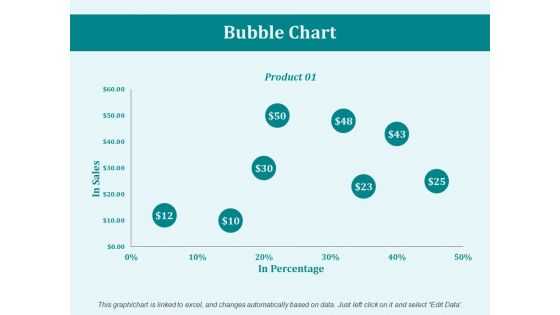
Bubble Chart Product Ppt PowerPoint Presentation Inspiration Design Ideas
This is a bubble chart product ppt powerpoint presentation inspiration design ideas. This is a one stage process. The stages in this process are business, management, marketing, product, percentage.
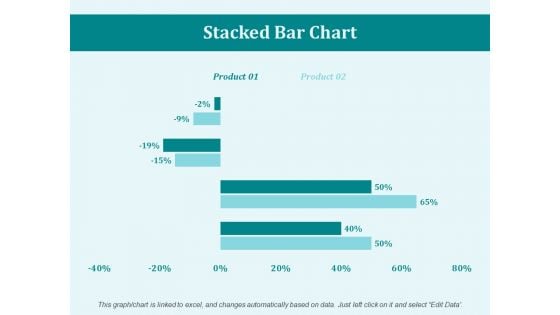
Stacked Bar Chart Percentage Ppt PowerPoint Presentation Portfolio Mockup
This is a stacked bar chart percentage ppt powerpoint presentation portfolio mockup. This is a two stage process. The stages in this process are business, marketing, management, percentage, product.
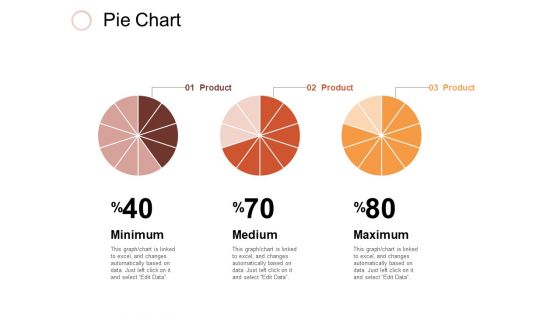
Pie Chart Investment Ppt PowerPoint Presentation Inspiration Design Inspiration
This is a pie chart investment ppt powerpoint presentation inspiration design inspiration. This is a three stage process. The stages in this process are business, management, marketing, percentage, product.

 Home
Home