Graph Icon
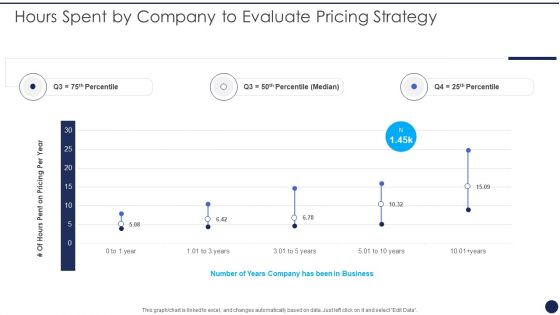
Hours Spent By Company To Evaluate Pricing Strategy Product Pricing Strategies Analysis Themes PDF
This graph or chart is linked to excel, and changes automatically based on data. Just left click on it and select Edit Data. Deliver and pitch your topic in the best possible manner with this Hours Spent By Company To Evaluate Pricing Strategy Product Pricing Strategies Analysis Themes PDF. Use them to share invaluable insights on Pricing Per Year, Number Years Business and impress your audience. This template can be altered and modified as per your expectations. So, grab it now.
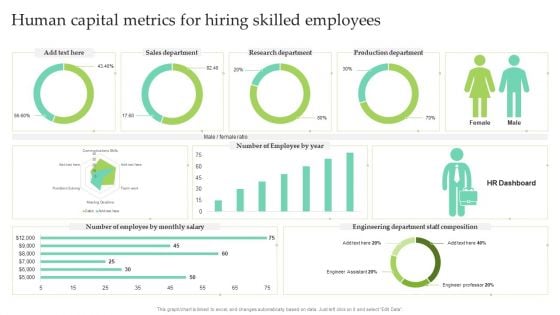
Human Capital Metrics For Hiring Skilled Employees Ppt Slides Themes PDF
This graph or chart is linked to excel, and changes automatically based on data. Just left click on it and select Edit Data. Showcasing this set of slides titled Human Capital Metrics For Hiring Skilled Employees Ppt Slides Themes PDF. The topics addressed in these templates are Sales Department, Research Department, Production Department. All the content presented in this PPT design is completely editable. Download it and make adjustments in color, background, font etc. as per your unique business setting.
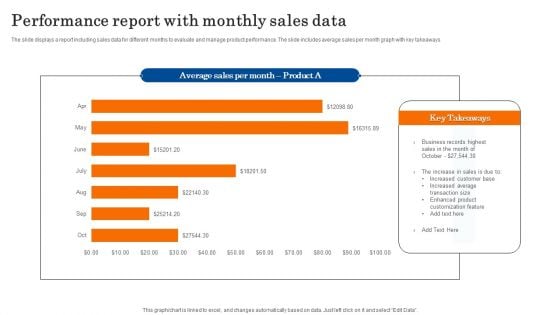
Performance Report With Monthly Sales Data Diagrams PDF
The slide displays a report including sales data for different months to evaluate and manage product performance. The slide includes average sales per month graph with key takeaways. Showcasing this set of slides titled Performance Report With Monthly Sales Data Diagrams PDF. The topics addressed in these templates are Business, Sales, Customization. All the content presented in this PPT design is completely editable. Download it and make adjustments in color, background, font etc. as per your unique business setting.
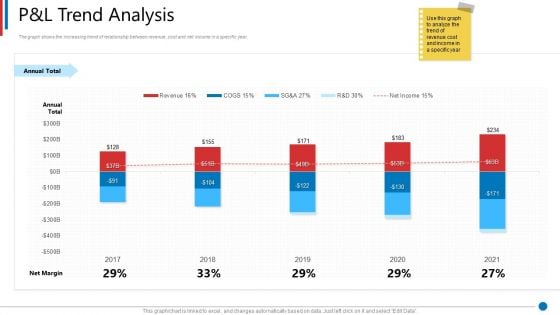
Business Synergies P And L Trend Analysis Ppt Gallery Themes PDF
The graph shows the increasing trend of relationship between revenue, cost and net income in a specific year. Deliver an awe-inspiring pitch with this creative business synergies p and l trend analysis ppt gallery themes pdf bundle. Topics like p and l trend analysis can be discussed with this completely editable template. It is available for immediate download depending on the needs and requirements of the user.
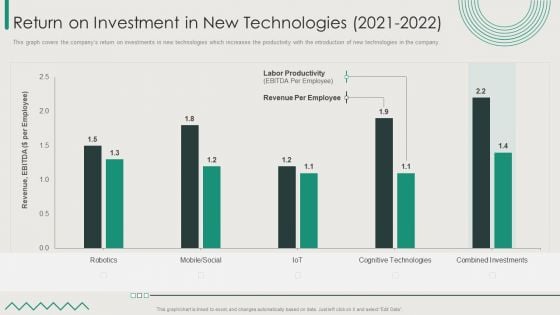
Organization Transition Return On Investment In New Technologies 2021 To 2022 Themes PDF
This graph covers the companys return on investments in new technologies which increases the productivity with the introduction of new technologies in the company. Deliver an awe inspiring pitch with this creative Organization Transition Return On Investment In New Technologies 2021 To 2022 Themes PDF bundle. Topics like Revenue per Employee, Labour Productivity, IOT can be discussed with this completely editable template. It is available for immediate download depending on the needs and requirements of the user.
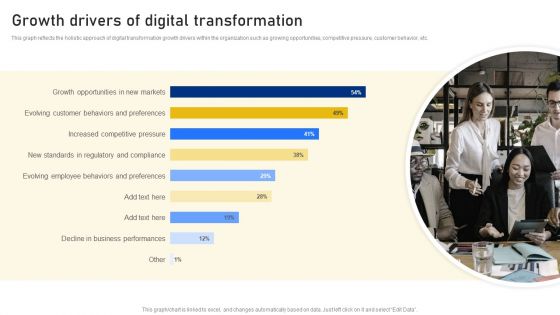
Reshaping Business In Digital Growth Drivers Of Digital Transformation Themes PDF
This graph reflects the holistic approach of digital transformation growth drivers within the organization such as growing opportunities, competitive pressure, customer behavior, etc. Deliver and pitch your topic in the best possible manner with this Reshaping Business In Digital Growth Drivers Of Digital Transformation Themes PDF. Use them to share invaluable insights on Growth Opportunities, New Markets, Evolving Customer and impress your audience. This template can be altered and modified as per your expectations. So, grab it now.
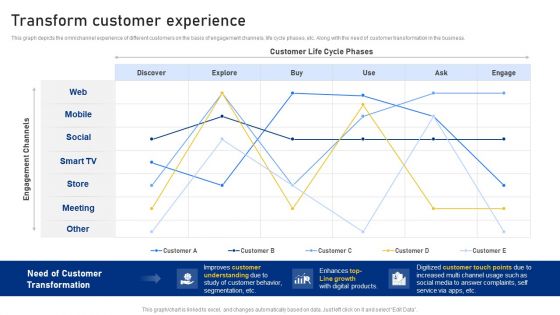
Reshaping Business In Digital Transform Customer Experience Mockup PDF
This graph depicts the omnichannel experience of different customers on the basis of engagement channels, life cycle phases, etc. Along with the need of customer transformation in the business. Deliver and pitch your topic in the best possible manner with this Reshaping Business In Digital Transform Customer Experience Mockup PDF. Use them to share invaluable insights on Customer Life, Cycle Phases, Improves Customer Understanding and impress your audience. This template can be altered and modified as per your expectations. So, grab it now.
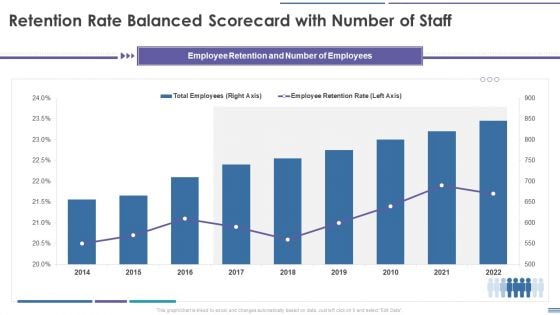
Staff Retention Balanced Scorecard Retention Rate Balanced Scorecard With Number Of Staff Diagrams PDF
This graph or chart is linked to excel, and changes automatically based on data. Just left click on it and select Edit Data. Deliver an awe inspiring pitch with this creative Staff Retention Balanced Scorecard Retention Rate Balanced Scorecard With Number Of Staff Diagrams PDF bundle. Topics like Total Employees, Employee Retention Rate, 2014 To 2022 can be discussed with this completely editable template. It is available for immediate download depending on the needs and requirements of the user.

Past Trends In Revenue Of XYZ Logistic Company Worldwide Diagrams PDF
This slide shows the past trends in revenue of XYZ Logistic Company worldwide. The graph shows a constant decline in sales since 2017.Deliver and pitch your topic in the best possible manner with this past trends in revenue of xyz logistic company worldwide diagrams pdf. Use them to share invaluable insights on past trends in revenue of xyz logistic company worldwide and impress your audience. This template can be altered and modified as per your expectations. So, grab it now.
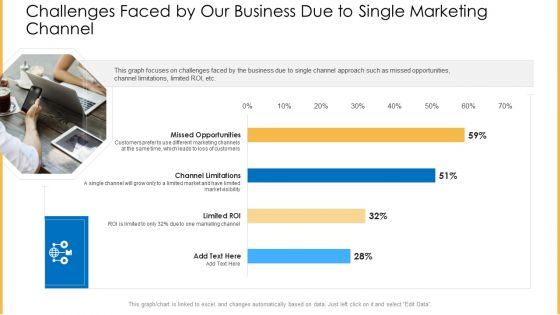
Amalgamation Marketing Pitch Deck Challenges Faced By Our Business Due To Single Marketing Channel Diagrams PDF
This graph focuses on challenges faced by the business due to single channel approach such as missed opportunities, channel limitations, limited ROI, etc. Deliver and pitch your topic in the best possible manner with this amalgamation marketing pitch deck challenges faced by our business due to single marketing channel diagrams pdf. Use them to share invaluable insights on opportunities, limitation, marketing and impress your audience. This template can be altered and modified as per your expectations. So, grab it now.
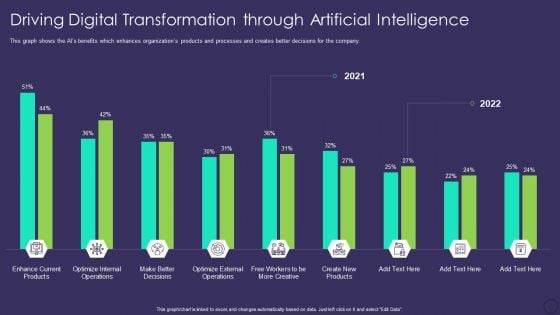
Comprehensive Business Digitization Deck Driving Digital Transformation Through Artificial Intelligence Diagrams PDF
This graph shows the AIs benefits which enhances organizations products and processes and creates better decisions for the company. Deliver and pitch your topic in the best possible manner with this comprehensive business digitization deck driving digital transformation through artificial intelligence diagrams pdf. Use them to share invaluable insights on driving digital transformation through artificial intelligence and impress your audience. This template can be altered and modified as per your expectations. So, grab it now.
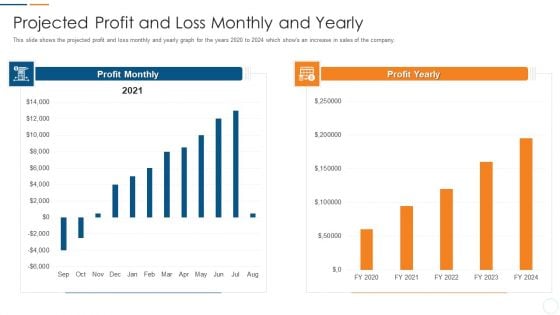
Organization Development Initiatives For Startups Projected Profit And Loss Monthly And Yearly Diagrams PDF
This slide shows the projected profit and loss monthly and yearly graph for the years 2020 to 2024 which shows an increase in sales of the company. Deliver an awe inspiring pitch with this creative organization development initiatives for startups projected profit and loss monthly and yearly diagrams pdf bundle. Topics like projected profit and loss monthly and yearly can be discussed with this completely editable template. It is available for immediate download depending on the needs and requirements of the user.
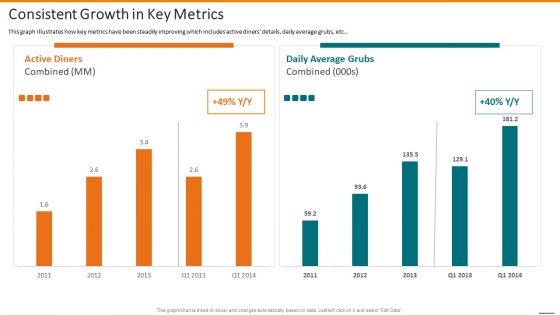
Grubhub Fund Raising Elevator Consistent Growth In Key Metrics Diagrams PDF
This graph illustrates how key metrics have been steadily improving which includes active diners details, daily average grubs, etc. Deliver and pitch your topic in the best possible manner with this grubhub fund raising elevator consistent growth in key metrics diagrams pdf. Use them to share invaluable insights on consistent growth in key metrics and impress your audience. This template can be altered and modified as per your expectations. So, grab it now.
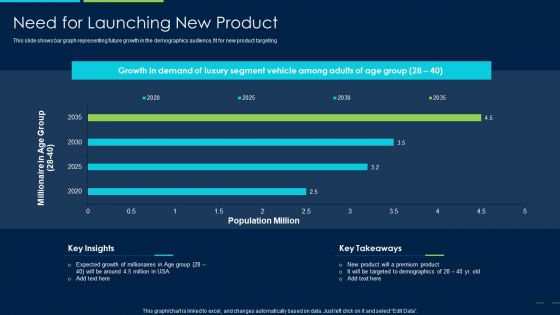
Marketing Strategy New Product Introduction Need For Launching New Product Diagrams PDF
This slide shows bar graph representing future growth in the demographics audience, fit for new product targeting Deliver an awe inspiring pitch with this creative marketing strategy new product introduction need for launching new product diagrams pdf bundle. Topics like need for launching new product can be discussed with this completely editable template. It is available for immediate download depending on the needs and requirements of the user.

Alejandro Cremades Investor Financing Pitch Deck SOMA Growing Potential User Base Of SOMA Diagrams PDF
The following slide provides information about the growing and increasing potential user base of SOMA along with graph showing percentage of increasing overweight population. Deliver and pitch your topic in the best possible manner with this alejandro cremades investor financing pitch deck soma growing potential user base of soma diagrams pdf. Use them to share invaluable insights on growing potential user base of soma and impress your audience. This template can be altered and modified as per your expectations. So, grab it now.
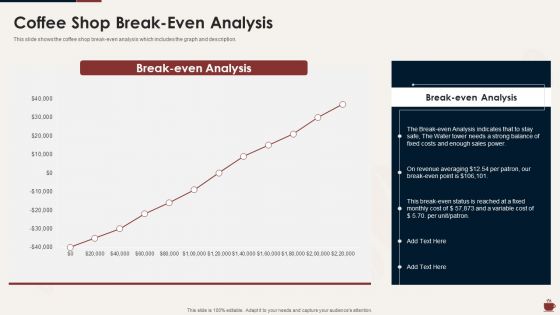
Master Plan For Opening Bistro Coffee Shop Break Even Analysis Diagrams PDF
This slide shows the coffee shop break even analysis which includes the graph and description. Deliver an awe inspiring pitch with this creative master plan for opening bistro coffee shop break even analysis diagrams pdf bundle. Topics like coffee shop break even analysis can be discussed with this completely editable template. It is available for immediate download depending on the needs and requirements of the user.
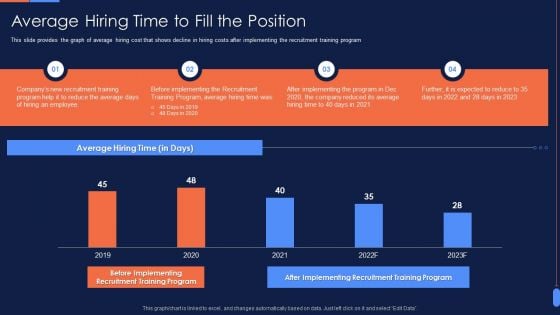
Recruitment Training To Optimize Average Hiring Time To Fill The Position Diagrams PDF
This slide provides the graph of average hiring cost that shows decline in hiring costs after implementing the recruitment training program. Deliver and pitch your topic in the best possible manner with this Recruitment Training To Optimize Average Hiring Time To Fill The Position Diagrams PDF. Use them to share invaluable insights on Average Hiring Time, 2019 To 2023, Employee and impress your audience. This template can be altered and modified as per your expectations. So, grab it now.
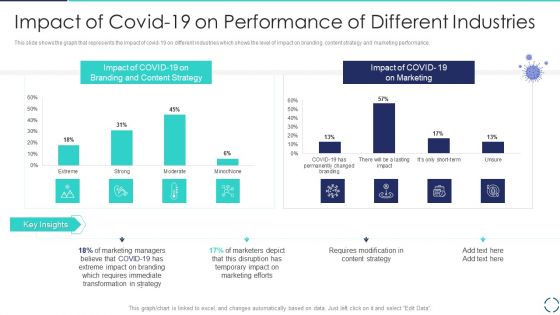
Optimizing E Business Promotion Plan Impact Of Covid 19 On Performance Of Different Industries Diagrams PDF
This slide shows the graph that represents the impact of covid 19 on different industries which shows the level of impact on branding, content strategy and marketing performance. Deliver an awe inspiring pitch with this creative Optimizing E Business Promotion Plan Impact Of Covid 19 On Performance Of Different Industries Diagrams PDF bundle. Topics like Strategy, Marketing, Branding can be discussed with this completely editable template. It is available for immediate download depending on the needs and requirements of the user.
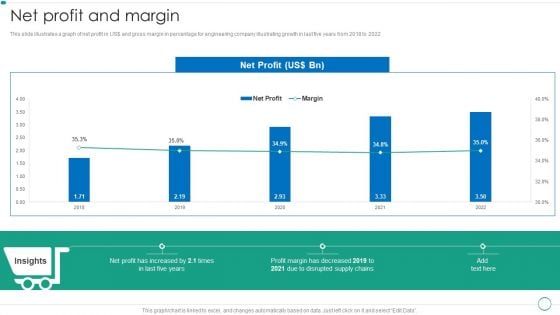
Real Estate Construction And Engineering Company Profile Net Profit And Margin Diagrams PDF
This slide illustrates a graph of net profit in US and gross margin in percentage for engineering company illustrating growth in last five years from 2018 to 2022.Deliver an awe inspiring pitch with this creative Real Estate Construction And Engineering Company Profile Net Profit And Margin Diagrams PDF bundle. Topics like Disrupted Supply, Profit Margin, Increased can be discussed with this completely editable template. It is available for immediate download depending on the needs and requirements of the user.
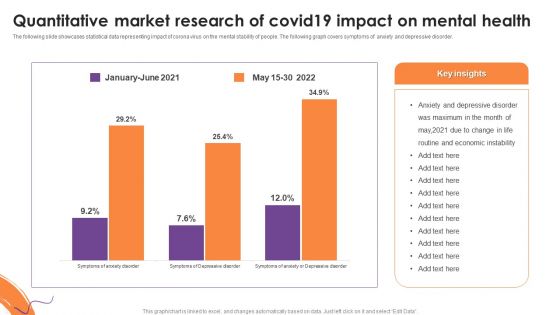
Quantitative Market Research Of Covid19 Impact On Mental Health Diagrams PDF
The following slide showcases statistical data representing impact of corona virus on the mental stability of people. The following graph covers symptoms of anxiety and depressive disorder. Showcasing this set of slides titled Quantitative Market Research Of Covid19 Impact On Mental Health Diagrams PDF. The topics addressed in these templates are Quantitative Market Research, Economic Instability. All the content presented in this PPT design is completely editable. Download it and make adjustments in color, background, font etc. as per your unique business setting.
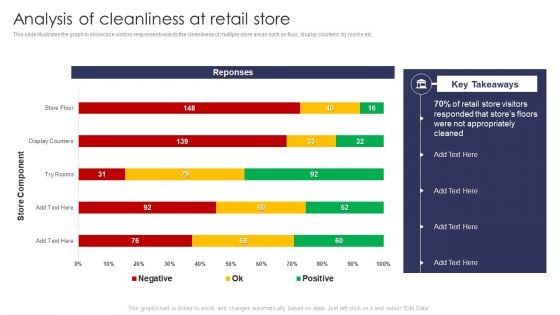
Analysis Of Cleanliness At Retail Store Retail Outlet Operations Performance Evaluation Diagrams PDF
This slide illustrates the graph to showcase visitors responses towards the cleanliness of multiple store areas such as floor, display counters, try rooms etc.Deliver and pitch your topic in the best possible manner with this Analysis Of Cleanliness At Retail Store Retail Outlet Operations Performance Evaluation Diagrams PDF. Use them to share invaluable insights on Retail Store, Visitors Responded, Stores Floors and impress your audience. This template can be altered and modified as per your expectations. So, grab it now.
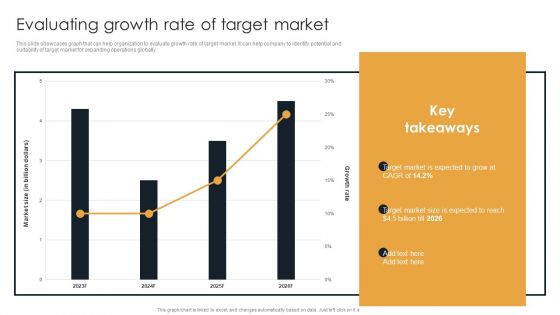
Target Customer Analysis Evaluating Growth Rate Of Target Market Diagrams PDF
This slide showcases graph that can help organization to evaluate growth rate of target market. It can help company to identify potential and suitability of target market for expanding operations globally. There are so many reasons you need a Target Customer Analysis Evaluating Growth Rate Of Target Market Diagrams PDF. The first reason is you cant spend time making everything from scratch, Thus, Slidegeeks has made presentation templates for you too. You can easily download these templates from our website easily.
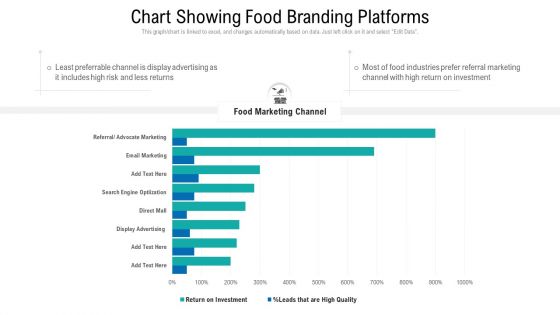
Chart Showing Food Branding Platforms Ppt Summary Gridlines PDF
This graph or chart is linked to excel, and changes automatically based on data. Just left click on it and select Edit Data. Showcasing this set of slides titled chart showing food branding platforms ppt summary gridlines pdf. The topics addressed in these templates are chart showing food branding platforms. All the content presented in this PPT design is completely editable. Download it and make adjustments in color, background, font etc. as per your unique business setting.
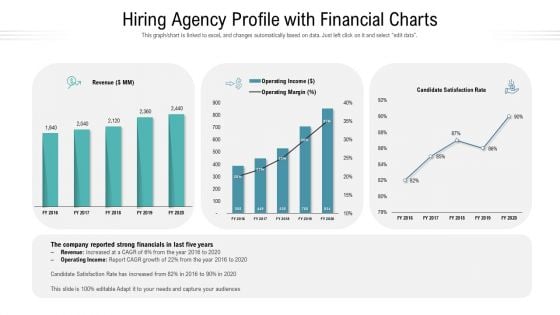
Hiring Agency Profile With Financial Charts Ppt Model Example PDF
This graph or chart is linked to excel, and changes automatically based on data. Just left click on it and select edit data. Pitch your topic with ease and precision using this hiring agency profile with financial charts ppt model example pdf. This layout presents information on revenue, operating income, operating margin, satisfaction rate. It is also available for immediate download and adjustment. So, changes can be made in the color, design, graphics or any other component to create a unique layout.
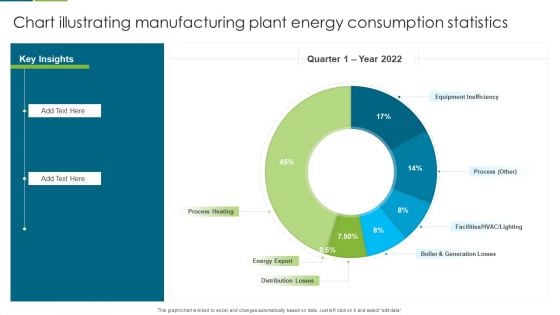
Chart Illustrating Manufacturing Plant Energy Consumption Statistics Slides PDF
This graph or chart is linked to excel, and changes automatically based on data. Just left click on it and select edit data. Pitch your topic with ease and precision using this Chart Illustrating Manufacturing Plant Energy Consumption Statistics Slides PDF. This layout presents information on Equipment Inefficiency, Process Heating, Energy Export. It is also available for immediate download and adjustment. So, changes can be made in the color, design, graphics or any other component to create a unique layout.
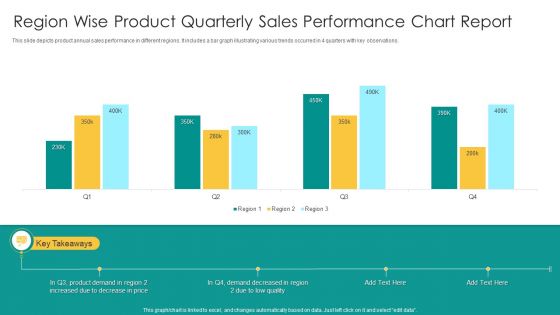
Region Wise Product Quarterly Sales Performance Chart Report Topics PDF
This slide depicts product annual sales performance in different regions. It includes a bar graph illustrating various trends occurred in 4 quarters with key observations. Showcasing this set of slides titled Region Wise Product Quarterly Sales Performance Chart Report Topics PDF. The topics addressed in these templates are Product Demand, Price, Low Quality. All the content presented in this PPT design is completely editable. Download it and make adjustments in color, background, font etc. as per your unique business setting.
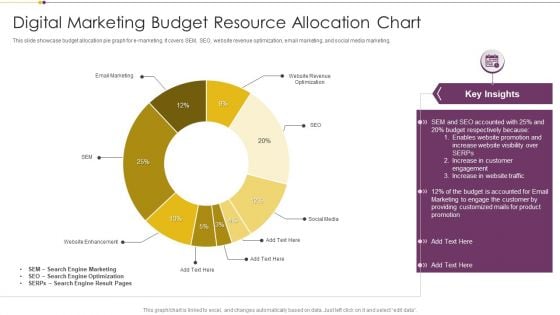
Digital Marketing Budget Resource Allocation Chart Download PDF
This slide showcase budget allocation pie graph for e marketing. It covers SEM, SEO, website revenue optimization, email marketing, and social media marketing. Pitch your topic with ease and precision using this Digital Marketing Budget Resource Allocation Chart Download PDF. This layout presents information on Search Engine Marketing, Search Engine Optimization, Budget. It is also available for immediate download and adjustment. So, changes can be made in the color, design, graphics or any other component to create a unique layout.
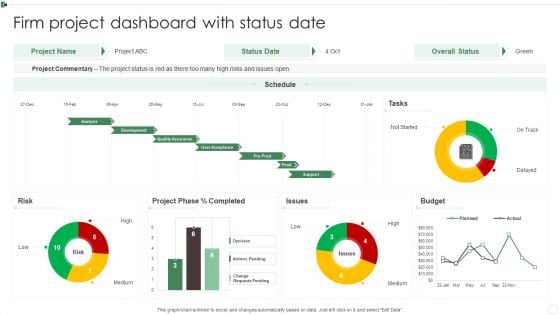
Firm Project Dashboard With Status Date Ppt Infographics Slides PDF
This graph or chart is linked to excel, and changes automatically based on data. Just left click on it and select Edit Data. Pitch your topic with ease and precision using this Firm Project Dashboard With Status Date Ppt Infographics Slides PDF. This layout presents information on Project Commentary, Budget, Project Phase, Risk. It is also available for immediate download and adjustment. So, changes can be made in the color, design, graphics or any other component to create a unique layout.
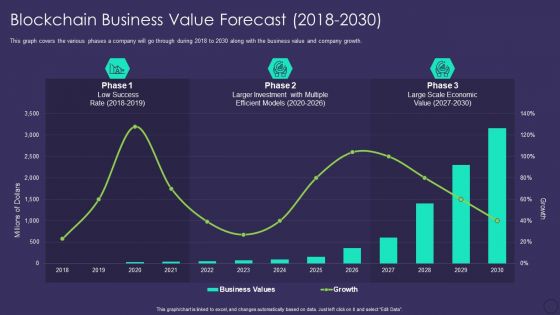
Comprehensive Business Digitization Deck Blockchain Business Value Forecast 2018 2030 Inspiration PDF
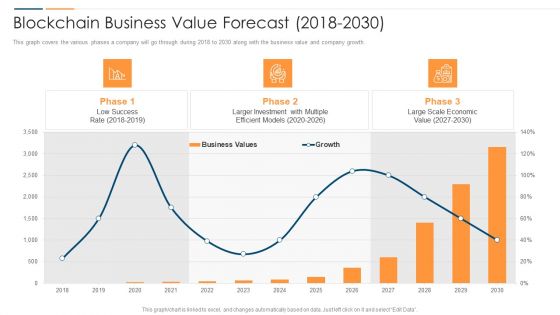
This graph covers the various phases a company will go through during 2018 to 2030 along with the business value and company growth. Deliver an awe inspiring pitch with this creative comprehensive business digitization deck blockchain business value forecast 2018 2030 inspiration pdf bundle. Topics like business value, growth, success rate, investment efficient, economic value can be discussed with this completely editable template. It is available for immediate download depending on the needs and requirements of the user.
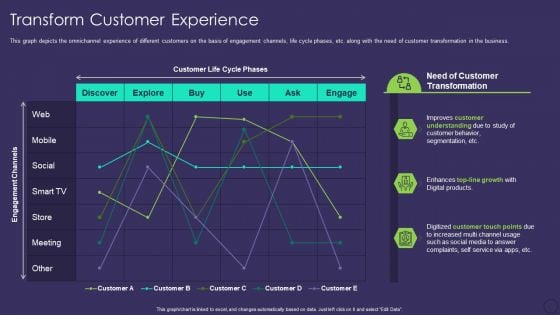
Comprehensive Business Digitization Deck Transform Customer Experience Formats PDF
This graph depicts the omnichannel experience of different customers on the basis of engagement channels, life cycle phases, etc. along with the need of customer transformation in the business. Deliver and pitch your topic in the best possible manner with this comprehensive business digitization deck transform customer experience formats pdf. Use them to share invaluable insights on segmentation, digital products, service, social media, growth and impress your audience. This template can be altered and modified as per your expectations. So, grab it now.
Revolution In Online Business Blockchain Business Value Forecast 2018 To 2030 Designs PDF
This graph covers the various phases a company will go through during 2018 to 2030 along with the business value and company growth. Deliver an awe inspiring pitch with this creative Revolution In Online Business Blockchain Business Value Forecast 2018 To 2030 Designs PDF bundle. Topics like Low Success Rate, Larger Investment Multiple, Large Scale Economic, 2017 To 2030 can be discussed with this completely editable template. It is available for immediate download depending on the needs and requirements of the user.
Accelerate Online Journey Now Blockchain Business Value Forecast 2018 To 2030 Designs PDF
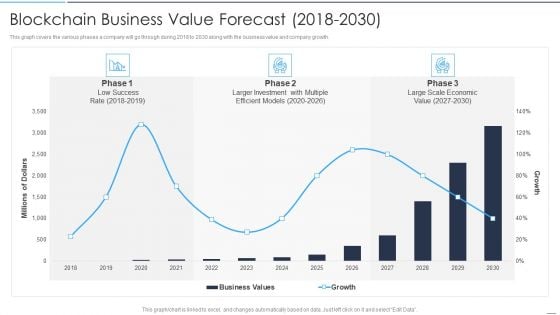
This graph covers the various phases a company will go through during 2018 to 2030 along with the business value and company growth.Deliver an awe inspiring pitch with this creative Accelerate Online Journey Now Blockchain Business Value Forecast 2018 To 2030 Designs PDF bundle. Topics like Larger Investment, Multiple Efficient, Large Scale can be discussed with this completely editable template. It is available for immediate download depending on the needs and requirements of the user.
Accelerate Online Journey Now Transform Customer Experience Demonstration PDF
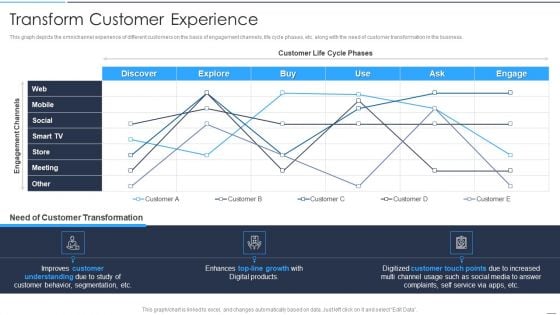
This graph depicts the omnichannel experience of different customers on the basis of engagement channels, life cycle phases, etc. along with the need of customer transformation in the business.Deliver an awe inspiring pitch with this creative Accelerate Online Journey Now Transform Customer Experience Demonstration PDF bundle. Topics like Understanding, Customer Points, Increased Channel can be discussed with this completely editable template. It is available for immediate download depending on the needs and requirements of the user.
Organization Reinvention Blockchain Business Value Forecast 2018 To 2030 Topics PDF
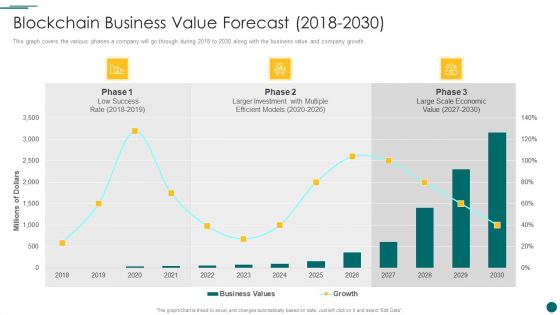
This graph covers the various phases a company will go through during 2018 to 2030 along with the business value and company growth. Deliver an awe inspiring pitch with this creative Organization Reinvention Blockchain Business Value Forecast 2018 To 2030 Topics PDF bundle. Topics like Larger Investment, Large Scale Economic, Growth can be discussed with this completely editable template. It is available for immediate download depending on the needs and requirements of the user.
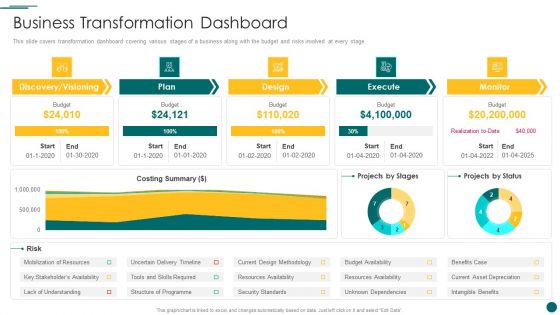
Organization Reinvention Business Transformation Dashboard Formats PDF
This graph covers the various phases a company will go through during 2018 to 2030 along with the business value and company growth. Deliver and pitch your topic in the best possible manner with this Organization Reinvention Business Transformation Dashboard Formats PDF. Use them to share invaluable insights on Plan, Design, Execute and impress your audience. This template can be altered and modified as per your expectations. So, grab it now.
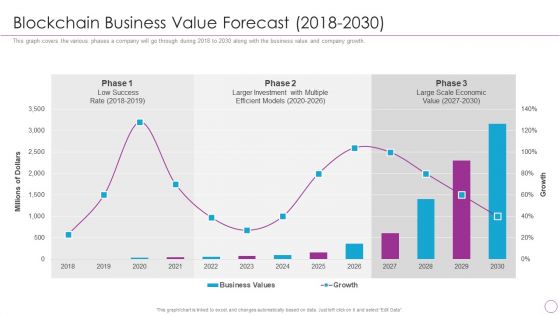
Integration Of Digital Technology In Organization Blockchain Business Value Forecast 2018 To 2030 Slides PDF
This graph covers the various phases a company will go through during 2018 to 2030 along with the business value and company growth.Deliver an awe inspiring pitch with this creative Integration Of Digital Technology In Organization Blockchain Business Value Forecast 2018 To 2030 Slides PDF bundle. Topics like Larger Investment, Scale Economic, Low Success can be discussed with this completely editable template. It is available for immediate download depending on the needs and requirements of the user.
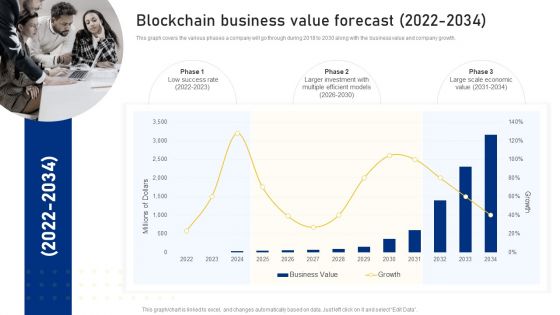
Reshaping Business In Digital Blockchain Business Value Forecast 2022 To 2034 Topics PDF
This graph covers the various phases a company will go through during 2018 to 2030 along with the business value and company growth Deliver an awe inspiring pitch with this creative Reshaping Business In Digital Blockchain Business Value Forecast 2022 To 2034 Topics PDF bundle. Topics like Low Success Rate, Larger Investment, Multiple Efficient Models can be discussed with this completely editable template. It is available for immediate download depending on the needs and requirements of the user.
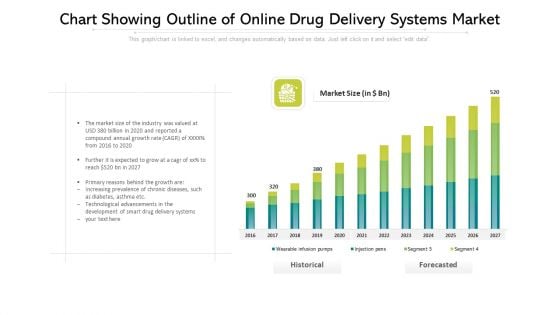
Chart Showing Outline Of Online Drug Delivery Systems Market Ppt PowerPoint Presentation File Clipart PDF
This graph or chart is linked to excel, and changes automatically based on data. Just left click on it and select edit data. Showcasing this set of slides titled chart showing outline of online drug delivery systems market ppt powerpoint presentation file clipart pdf. The topics addressed in these templates are technological, development, growth. All the content presented in this PPT design is completely editable. Download it and make adjustments in color, background, font etc. as per your unique business setting.
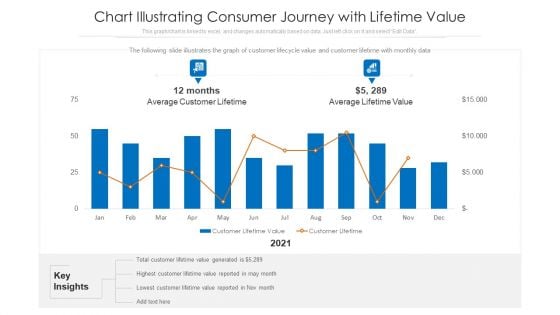
Chart Illustrating Consumer Journey With Lifetime Value Ppt PowerPoint Presentation File Background Images PDF
The following slide illustrates the graph of customer lifecycle value and customer lifetime with monthly data. Pitch your topic with ease and precision using this chart illustrating consumer journey with lifetime value ppt powerpoint presentation file background images pdf. This layout presents information on chart illustrating consumer journey with lifetime value. It is also available for immediate download and adjustment. So, changes can be made in the color, design, graphics or any other component to create a unique layout.
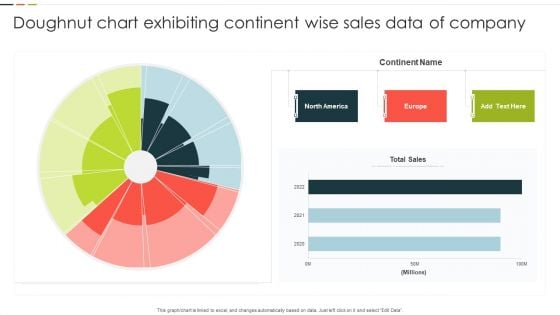
Doughnut Chart Exhibiting Continent Wise Sales Data Of Company Background PDF
This graph or chart is linked to excel, and changes automatically based on data. Just left click on it and select Edit Data. Showcasing this set of slides titled Doughnut Chart Exhibiting Continent Wise Sales Data Of Company Background PDF. The topics addressed in these templates are Continent Name, Total Sales, 2020 To 2022. All the content presented in this PPT design is completely editable. Download it and make adjustments in color, background, font etc. as per your unique business setting.
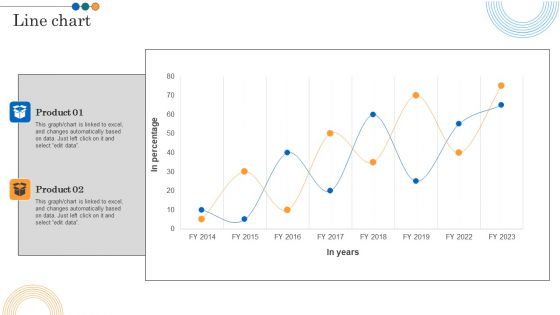
Implementing Marketing Strategies Line Chart Ppt PowerPoint Presentation File Mockup PDF
This graph or chart is linked to excel, and changes automatically based on data. Just left click on it and select edit data. There are so many reasons you need a Implementing Marketing Strategies Line Chart Ppt PowerPoint Presentation File Mockup PDF. The first reason is you can not spend time making everything from scratch, Thus, Slidegeeks has made presentation templates for you too. You can easily download these templates from our website easily.
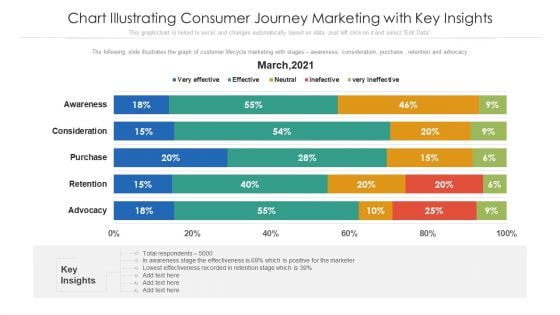
Chart Illustrating Consumer Journey Marketing With Key Insights Ppt PowerPoint Presentation File Demonstration PDF
The following slide illustrates the graph of customer lifecycle marketing with stages awareness, consideration, purchase , retention and advocacy. Showcasing this set of slides titled chart illustrating consumer journey marketing with key insights ppt powerpoint presentation file demonstration pdf. The topics addressed in these templates are awareness, consideration, purchase. All the content presented in this PPT design is completely editable. Download it and make adjustments in color, background, font etc. as per your unique business setting.
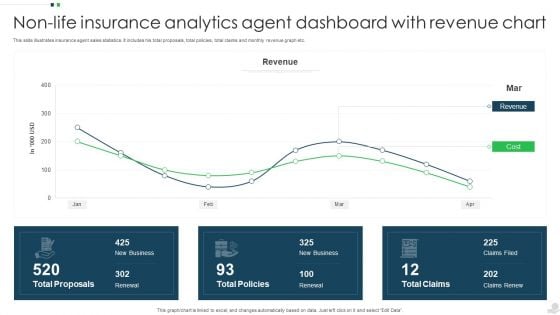
Non Life Insurance Analytics Agent Dashboard With Revenue Chart Infographics PDF
This slide illustrates insurance agent sales statistics. It includes his total proposals, total policies, total claims and monthly revenue graph etc. Showcasing this set of slides titled Non Life Insurance Analytics Agent Dashboard With Revenue Chart Infographics PDF. The topics addressed in these templates are Revenue, Cost, Total Proposals. All the content presented in this PPT design is completely editable. Download it and make adjustments in color, background, font etc. as per your unique business setting.
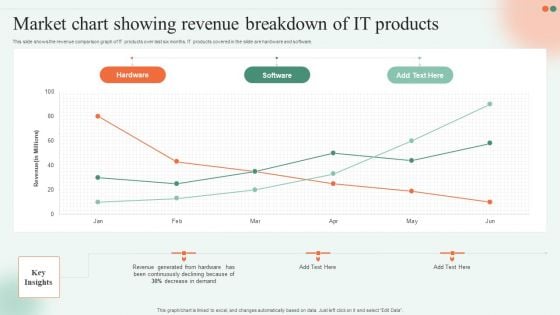
Market Chart Showing Revenue Breakdown Of IT Products Ppt File Elements PDF
This slide shows the revenue comparison graph of IT products over last six months. IT products covered in the slide are hardware and software. Pitch your topic with ease and precision using this Market Chart Showing Revenue Breakdown Of IT Products Ppt File Elements PDF. This layout presents information on Hardware, Software, Key Insights. It is also available for immediate download and adjustment. So, changes can be made in the color, design, graphics or any other component to create a unique layout.
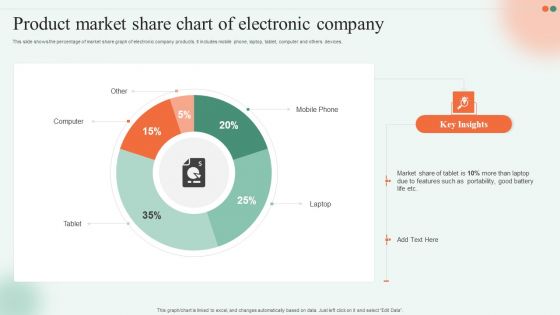
Product Market Share Chart Of Electronic Company Ppt Gallery Graphic Tips PDF
This slide shows the percentage of market share graph of electronic company products. It includes mobile phone, laptop, tablet, computer and others devices. Pitch your topic with ease and precision using this Product Market Share Chart Of Electronic Company Ppt Gallery Graphic Tips PDF. This layout presents information on Mobile Phone, Computer, Laptop, Tablet. It is also available for immediate download and adjustment. So, changes can be made in the color, design, graphics or any other component to create a unique layout.
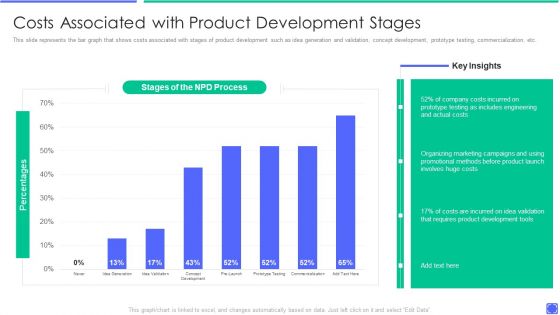
Best Techniques To Enhance New Product Management Efficiency Costs Associated With Product Formats PDF
This slide represents the bar graph that shows costs associated with stages of product development such as idea generation and validation, concept development, prototype testing, commercialization, etc. Deliver an awe inspiring pitch with this creative best techniques to enhance new product management efficiency comparing product metrics themes pdf bundle. Topics like costs associated with product development stages can be discussed with this completely editable template. It is available for immediate download depending on the needs and requirements of the user.
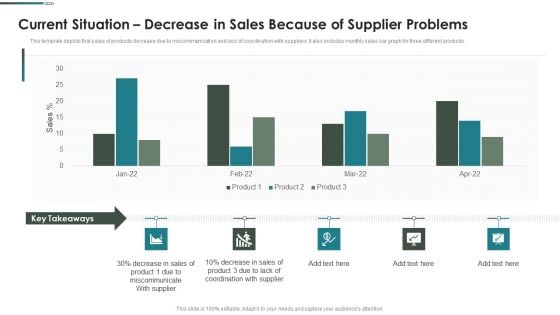
Purchase Assessment Process Current Situation Decrease In Sales Because Of Supplier Problems Sample PDF
This template depicts that sales of products decrease due to miscommunication and lack of coordination with suppliers. It also includes monthly sales bar graph for three different products.Deliver an awe inspiring pitch with this creative Purchase Assessment Process Current Situation Decrease In Sales Because Of Supplier Problems Sample PDF bundle. Topics like Coordination Supplier, Miscommunicate Supplier, Decrease Sale can be discussed with this completely editable template. It is available for immediate download depending on the needs and requirements of the user.
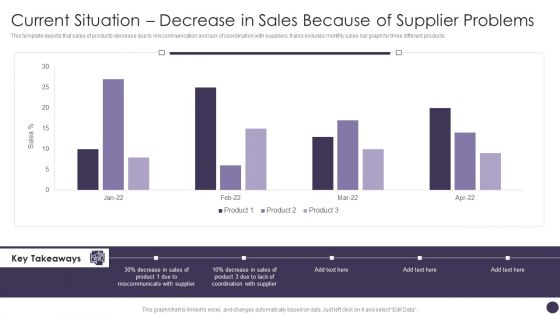
Current Situation Decrease In Sales Because Of Supplier Problems Mockup PDF
This template depicts that sales of products decrease due to miscommunication and lack of coordination with suppliers. It also includes monthly sales bar graph for three different products.Deliver and pitch your topic in the best possible manner with this Current Situation Decrease In Sales Because Of Supplier Problems Mockup PDF. Use them to share invaluable insights on Miscommunicate, Supplier, Coordination and impress your audience. This template can be altered and modified as per your expectations. So, grab it now.
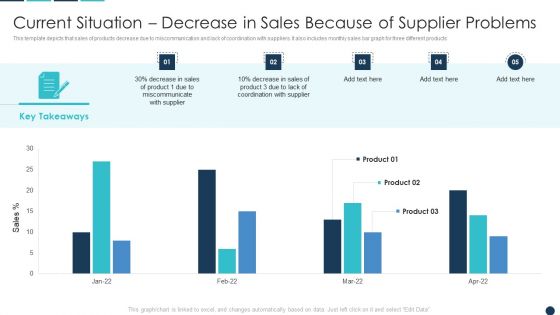
Current Situation Decrease In Sales Because Of Supplier Problems Download PDF
This template depicts that sales of products decrease due to miscommunication and lack of coordination with suppliers. It also includes monthly sales bar graph for three different products.Deliver and pitch your topic in the best possible manner with this Current Situation Decrease In Sales Because Of Supplier Problems Download PDF. Use them to share invaluable insights on Coordination Supplier, Key Takeaways, Miscommunicate Supplier and impress your audience. This template can be altered and modified as per your expectations. So, grab it now.
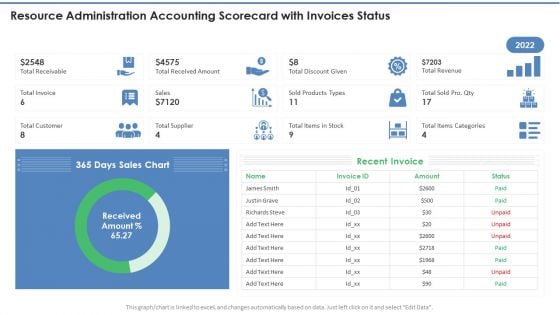
Resource Administration Accounting Scorecard With Invoices Status Topics PDF
This graph or chart is linked to excel, and changes automatically based on data. Just left click on it and select Edit Data. Deliver an awe inspiring pitch with this creative Resource Administration Accounting Scorecard With Invoices Status Topics PDF bundle. Topics like Recent Invoice, Sales Chart, Total Receivable can be discussed with this completely editable template. It is available for immediate download depending on the needs and requirements of the user.
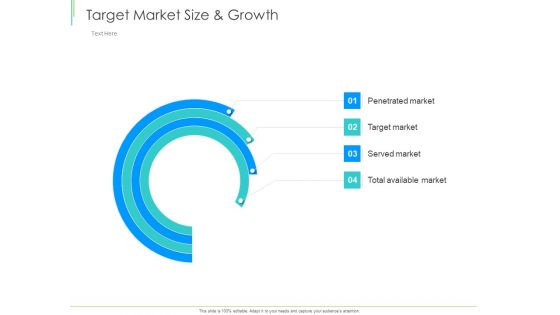
Marketing Plan Implementation Target Market Size And Growth Ppt File Model PDF
This graph or chart is linked to excel, and changes automatically based on data. Just left click on it and select Edit Data. Deliver an awe-inspiring pitch with this creative marketing plan implementation target market size and growth ppt file model pdf bundle. Topics like target market size and growth can be discussed with this completely editable template. It is available for immediate download depending on the needs and requirements of the user.
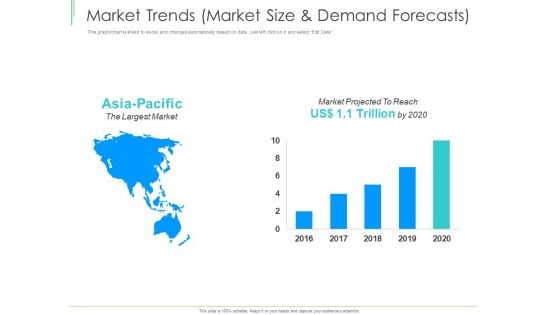
Marketing Plan Implementation Market Trends Market Size And Demand Forecasts Topics PDF
This graph or chart is linked to excel, and changes automatically based on data. Just left click on it and select Edit Data. Deliver an awe-inspiring pitch with this creative marketing plan implementation market trends market size and demand forecasts topics pdf bundle. Topics like market trends, market size and demand forecasts can be discussed with this completely editable template. It is available for immediate download depending on the needs and requirements of the user.
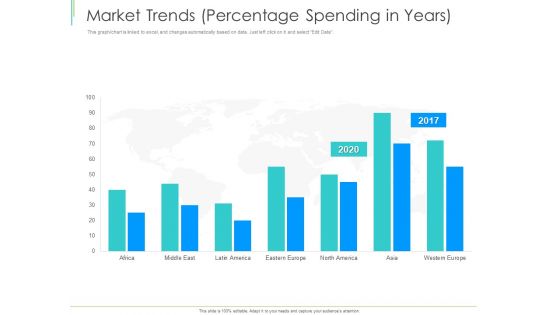
Marketing Plan Implementation Market Trends Percentage Spending In Years Demonstration PDF
This graph or chart is linked to excel, and changes automatically based on data. Just left click on it and select Edit Data. Deliver an awe-inspiring pitch with this creative marketing plan implementation market trends percentage spending in years demonstration pdf bundle. Topics like market trends, percentage spending in years can be discussed with this completely editable template. It is available for immediate download depending on the needs and requirements of the user.
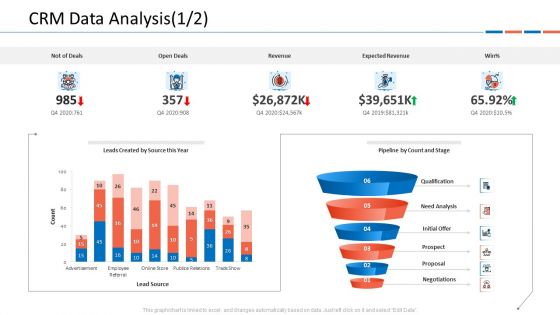
Customer Relationship Management Dashboard CRM Data Analysis Deals Ideas PDF
This graph or chart is linked to excel, and changes automatically based on data. Just left click on it and select Edit Data.Deliver and pitch your topic in the best possible manner with this customer relationship management dashboard crm data analysis deals ideas pdf. Use them to share invaluable insights on v and impress your audience. This template can be altered and modified as per your expectations. So, grab it now.
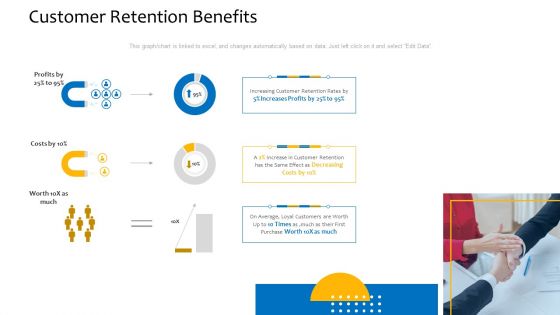
Customer Relationship Management Procedure Customer Retention Benefits Introduction PDF
This graph chart is linked to excel, and changes automatically based on data. Just left click on it and select Edit Data. Deliver an awe inspiring pitch with this creative customer relationship management procedure customer retention benefits introduction pdf bundle. Topics like customer retention benefits, profits, costs can be discussed with this completely editable template. It is available for immediate download depending on the needs and requirements of the user.
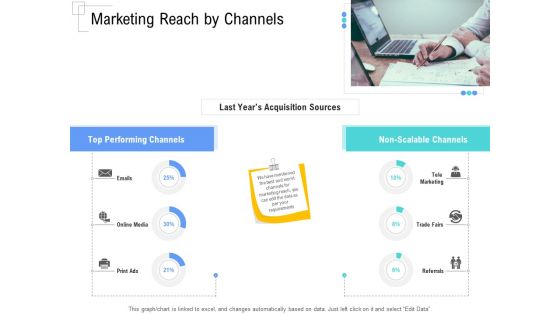
Managing Customer Experience Marketing Reach By Channels Elements PDF
This graph or chart is linked to excel, and changes automatically based on data. Just left click on it and select Edit Data.Deliver and pitch your topic in the best possible manner with this managing customer experience marketing reach by channels elements pdf. Use them to share invaluable insights on last years acquisition sources, top performing channels, non scalable channels and impress your audience. This template can be altered and modified as per your expectations. So, grab it now.
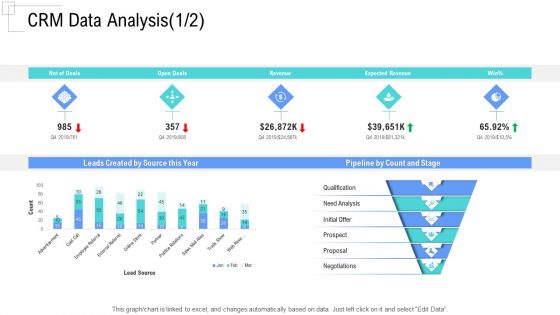
Managing Customer Experience CRM Data Analysis Revenue Designs PDF
This graph or chart is linked to excel, and changes automatically based on data. Just left click on it and select Edit Data.Deliver an awe-inspiring pitch with this creative managing customer experience crm data analysis revenue designs pdf bundle. Topics like leads created by source this year, pipeline by count and stage, qualification, need analysis, initial offer can be discussed with this completely editable template. It is available for immediate download depending on the needs and requirements of the user.
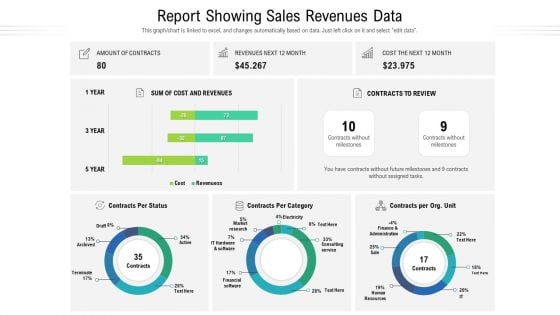
Report Showing Sales Revenues Data Ppt Show Backgrounds PDF
This graph or chart is linked to excel, and changes automatically based on data. Just left click on it and select edit data. Showcasing this set of slides titled report showing sales revenues data ppt show backgrounds pdf. The topics addressed in these templates are cost and revenues, market research, finance and administration. All the content presented in this PPT design is completely editable. Download it and make adjustments in color, background, font etc. as per your unique business setting.
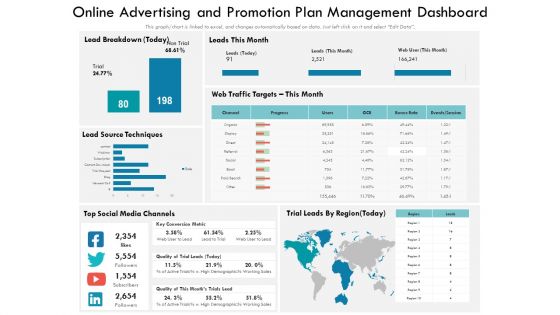
Online Advertising And Promotion Plan Management Dashboard Ppt PowerPoint Presentation Show Tips PDF
This graph chart is linked to excel, and changes automatically based on data. Just left click on it and select Edit Data. Showcasing this set of slides titled online advertising and promotion plan management dashboard ppt powerpoint presentation show tips pdf. The topics addressed in these templates are source techniques, social media channels, traffic targets. All the content presented in this PPT design is completely editable. Download it and make adjustments in color, background, font etc. as per your unique business setting.
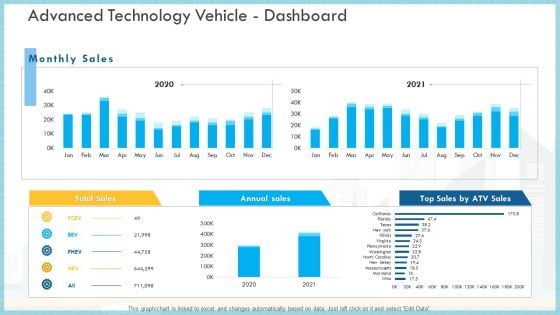
Loss Of Income And Financials Decline In An Automobile Organization Case Study Advanced Technology Vehicle Dashboard Infographics PDF
This graph or chart is linked to excel, and changes automatically based on data. Just left click on it and select Edit Data.Deliver an awe inspiring pitch with this creative loss of income and financials decline in an automobile organization case study advanced technology vehicle dashboard infographics pdf bundle. Topics like total sales, annual sales, monthly sales can be discussed with this completely editable template. It is available for immediate download depending on the needs and requirements of the user.

 Home
Home