Graph Trend
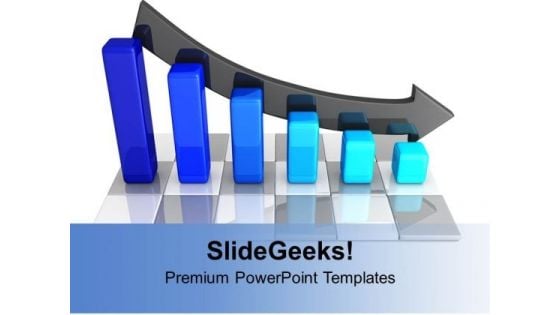
Blue Bar Graph Decreasing Arrow PowerPoint Templates Ppt Backgrounds For Slides 0313
We present our Blue Bar Graph Decreasing Arrow PowerPoint Templates PPT Backgrounds For Slides 0313.Present our Arrows PowerPoint Templates because Our PowerPoint Templates and Slides are Clear and concise. Use them and dispel any doubts your team may have. Use our Business PowerPoint Templates because Our PowerPoint Templates and Slides will effectively help you save your valuable time. They are readymade to fit into any presentation structure. Present our Success PowerPoint Templates because Our PowerPoint Templates and Slides are specially created by a professional team with vast experience. They diligently strive to come up with the right vehicle for your brilliant Ideas. Download and present our Shapes PowerPoint Templates because It will get your audience in sync. Present our Marketing PowerPoint Templates because Timeline crunches are a fact of life. Meet all deadlines using our PowerPoint Templates and Slides.Use these PowerPoint slides for presentations relating to Graph bars decreasing arrow, arrows, business, success, shapes, marketing. The prominent colors used in the PowerPoint template are Blue, Gray, White. Support your thoughts with our Blue Bar Graph Decreasing Arrow PowerPoint Templates Ppt Backgrounds For Slides 0313. Download without worries with our money back guaranteee.
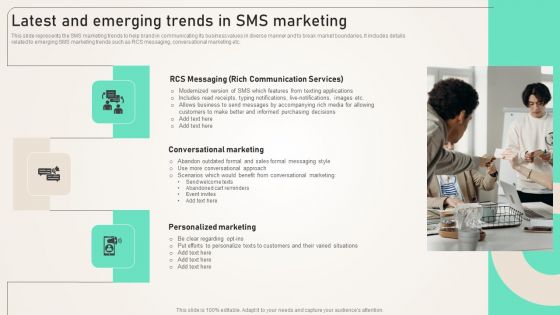
Latest And Emerging Trends In SMS Marketing Ppt PowerPoint Presentation Diagram Graph Charts PDF
This slide represents the SMS marketing trends to help brand in communicating its business values in diverse manner and to break market boundaries. It includes details related to emerging SMS marketing trends such as RCS messaging, conversational marketing etc. Present like a pro with Latest And Emerging Trends In SMS Marketing Ppt PowerPoint Presentation Diagram Graph Charts PDF Create beautiful presentations together with your team, using our easy to use presentation slides. Share your ideas in real time and make changes on the fly by downloading our templates. So whether you are in the office, on the go, or in a remote location, you can stay in sync with your team and present your ideas with confidence. With Slidegeeks presentation got a whole lot easier. Grab these presentations today.
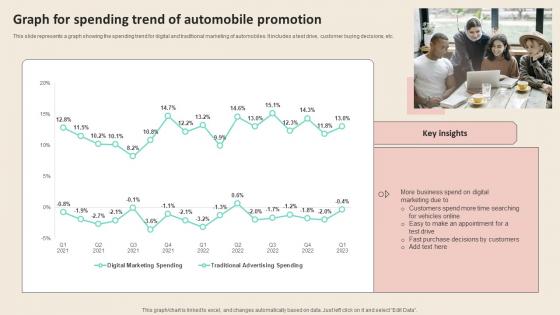
Graph For Spending Trend Of Automobile Promotional Strategies To Increase Download PDF
This slide represents a graph showing the spending trend for digital and traditional marketing of automobiles. It includes a test drive, customer buying decisions, etc. Whether you have daily or monthly meetings, a brilliant presentation is necessary. Graph For Spending Trend Of Automobile Promotional Strategies To Increase Download PDF can be your best option for delivering a presentation. Represent everything in detail using Graph For Spending Trend Of Automobile Promotional Strategies To Increase Download PDF and make yourself stand out in meetings. The template is versatile and follows a structure that will cater to your requirements. All the templates prepared by Slidegeeks are easy to download and edit. Our research experts have taken care of the corporate themes as well. So, give it a try and see the results. This slide represents a graph showing the spending trend for digital and traditional marketing of automobiles. It includes a test drive, customer buying decisions, etc.
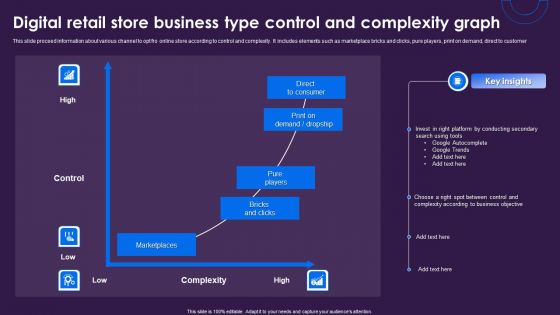
Digital Retail Store Business Type Control And Complexity Graph Sample PDF
This slide proceed information about various channel to opt fro online store according to control and complexity. It includes elements such as marketplace bricks and clicks, pure players, print on demand, direct to customer. Showcasing this set of slides titled Digital Retail Store Business Type Control And Complexity Graph Sample PDF. The topics addressed in these templates are Google Autocomplete, Google Trends, Conducting Secondary. All the content presented in this PPT design is completely editable. Download it and make adjustments in color, background, font etc. as per your unique business setting.
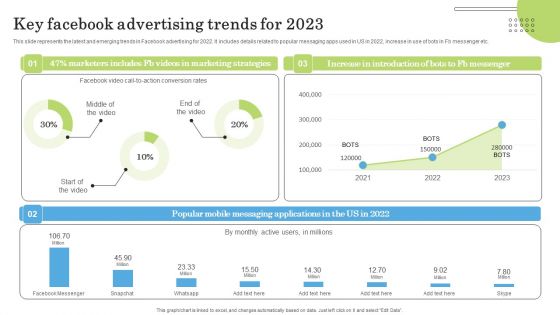
Key Facebook Advertising Trends For 2023 Ppt PowerPoint Presentation Diagram Graph Charts PDF
This slide represents the latest and emerging trends in Facebook advertising for 2022. It includes details related to popular messaging apps used in US in 2022, increase in use of bots in Fb messenger etc. Welcome to our selection of the Key Facebook Advertising Trends For 2023 Ppt PowerPoint Presentation Diagram Graph Charts PDF. These are designed to help you showcase your creativity and bring your sphere to life. Planning and Innovation are essential for any business that is just starting out. This collection contains the designs that you need for your everyday presentations. All of our PowerPoints are 100 percent editable, so you can customize them to suit your needs. This multi purpose template can be used in various situations. Grab these presentation templates today.
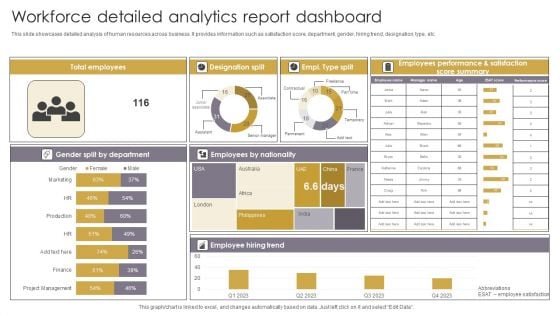
Workforce Detailed Analytics Report Dashboard Mockup PDF
This slide showcases detailed analysis of human resources across business. It provides information such as satisfaction score, department, gender, hiring trend, designation, type, etc. Showcasing this set of slides titled Workforce Detailed Analytics Report Dashboard Mockup PDF. The topics addressed in these templates are Employees, Designation Split, Employees By Nationality. All the content presented in this PPT design is completely editable. Download it and make adjustments in color, background, font etc. as per your unique business setting.
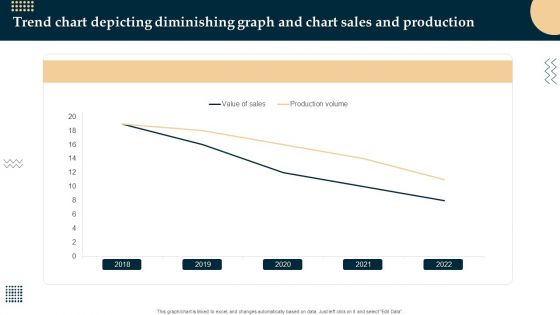
Trend Chart Depicting Diminishing Graph And Chart Sales And Production Structure PDF
Pitch your topic with ease and precision using this Trend Chart Depicting Diminishing Graph And Chart Sales And Production Structure PDF. This layout presents information on Trend Chart Depicting, Diminishing Graph, Chart Sales And Production. It is also available for immediate download and adjustment. So, changes can be made in the color, design, graphics or any other component to create a unique layout.
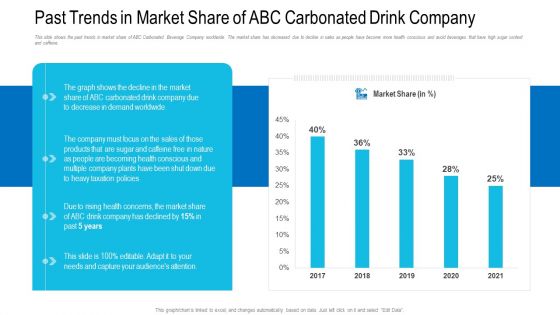
Past Trends In Market Share Of ABC Carbonated Drink Company Ppt Diagram Graph Charts PDF
This slide shows the past trends in market share of ABC Carbonated Beverage Company worldwide. The market share has decreased due to decline in sales as people have become more health conscious and avoid beverages that have high sugar content and caffeine. Deliver an awe inspiring pitch with this creative past trends in market share of abc carbonated drink company ppt diagram graph charts pdf bundle. Topics like past trends in market share of abc carbonated drink company can be discussed with this completely editable template. It is available for immediate download depending on the needs and requirements of the user.
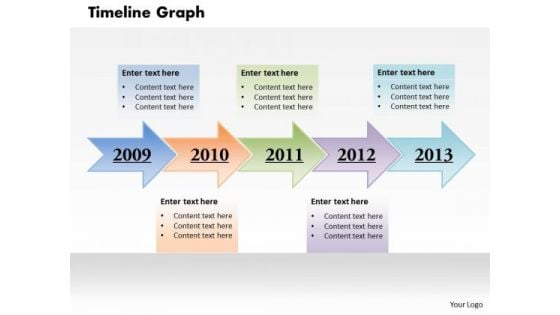
Timeline Graph PowerPoint Presentation Template
Our Timeline Graph PowerPoint Presentation Template Powerpoint Templates Enjoy Drama. They Provide Entertaining Backdrops. Our Business Plan Powerpoint Templates Help To Make A Draft. They Give You A Good Place To Start.
Budgetary Trends Graph Icon With Magnifying Glass And Trend Line Introduction PDF
Presenting Budgetary Trends Graph Icon With Magnifying Glass And Trend Line Introduction PDF to dispense important information. This template comprises four stages. It also presents valuable insights into the topics including Budgetary Trends, Graph Icon, Magnifying Glass. This is a completely customizable PowerPoint theme that can be put to use immediately. So, download it and address the topic impactfully.

Graph Indicating Business Sales Growth Trend Ppt PowerPoint Presentation File Slide Portrait PDF
Persuade your audience using this graph indicating business sales growth trend ppt powerpoint presentation file slide portrait pdf. This PPT design covers three stages, thus making it a great tool to use. It also caters to a variety of topics including graph indicating business sales growth trend. Download this PPT design now to present a convincing pitch that not only emphasizes the topic but also showcases your presentation skills.
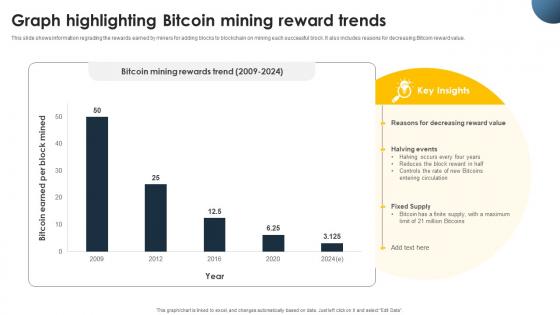
Complete Beginners Guide Graph Highlighting Bitcoin Mining Reward Trends Fin SS V
This slide shows information regrading the rewards earned by miners for adding blocks to blockchain on mining each successful block. It also includes reasons for decreasing Bitcoin reward value. Coming up with a presentation necessitates that the majority of the effort goes into the content and the message you intend to convey. The visuals of a PowerPoint presentation can only be effective if it supplements and supports the story that is being told. Keeping this in mind our experts created Complete Beginners Guide Graph Highlighting Bitcoin Mining Reward Trends Fin SS V to reduce the time that goes into designing the presentation. This way, you can concentrate on the message while our designers take care of providing you with the right template for the situation. This slide shows information regrading the rewards earned by miners for adding blocks to blockchain on mining each successful block. It also includes reasons for decreasing Bitcoin reward value.
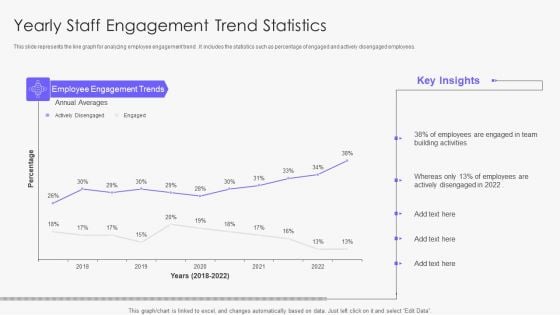
Yearly Staff Engagement Trend Statistics Demonstration PDF
This slide represents the line graph for analyzing employee engagement trend . It includes the statistics such as percentage of engaged and actively disengaged employees. Pitch your topic with ease and precision using this Yearly Staff Engagement Trend Statistics Demonstration PDF. This layout presents information on Team, Employees, Average. It is also available for immediate download and adjustment. So, changes can be made in the color, design, graphics or any other component to create a unique layout.
Growth Trend Arrow Graph Icon Ppt PowerPoint Presentation Summary Model
This is a growth trend arrow graph icon ppt powerpoint presentation summary model. This is a one stage process. The stages in this process are growth, upward trends, uptrends, upward arrow.
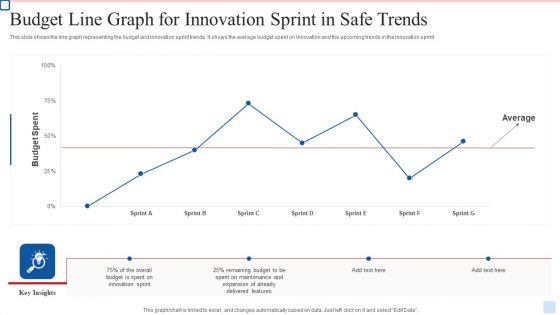
Budget Line Graph For Innovation Sprint In Safe Trends Diagrams PDF
This slide shows the line graph representing the budget and innovation sprint trends. It shows the average budget spent on innovation and the upcoming trends in the innovation sprint. Pitch your topic with ease and precision using this Budget Line Graph For Innovation Sprint In Safe Trends Diagrams PDF. This layout presents information on Budget Line Graph, For Innovation Sprint, In Safe Trends. It is also available for immediate download and adjustment. So, changes can be made in the color, design, graphics or any other component to create a unique layout.
Icon Of Statistical Chart Presenting Growth Trend Graph Brochure PDF
Presenting Icon Of Statistical Chart Presenting Growth Trend Graph Brochure PDF to dispense important information. This template comprises Four stages. It also presents valuable insights into the topics including Icon Of Statistical, Chart Presenting, Growth Trend This is a completely customizable PowerPoint theme that can be put to use immediately. So, download it and address the topic impactfully.
Net Promoter Score Graph Icon For Industry Trend Graphics PDF
Showcasing this set of slides titled Net Promoter Score Graph Icon For Industry Trend Graphics PDF. The topics addressed in these templates are Net Promoter, Score Graph, Industry Trend. All the content presented in this PPT design is completely editable. Download it and make adjustments in color, background, font etc. as per your unique business setting.
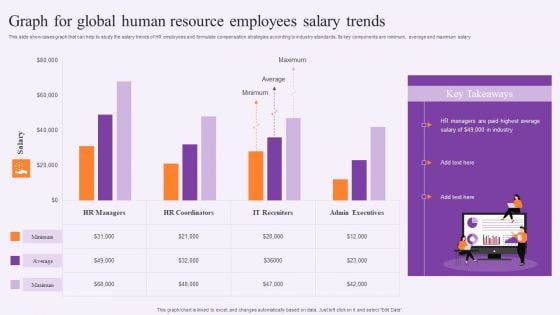
Graph For Global Human Resource Employees Salary Trends Demonstration PDF
This slide showcases graph that can help to study the salary trends of HR employees and formulate compensation strategies according to industry standards. Its key components are minimum, average and maximum salary. Showcasing this set of slides titled Graph For Global Human Resource Employees Salary Trends Demonstration PDF. The topics addressed in these templates are Global Human Resource, Employees Salary Trends. All the content presented in this PPT design is completely editable. Download it and make adjustments in color, background, font etc. as per your unique business setting.
Growth Trend Graph Vector Icon Ppt PowerPoint Presentation Gallery Sample
Presenting this set of slides with name growth trend graph vector icon ppt powerpoint presentation gallery sample. This is a three stage process. The stages in this process are growth trend graph vector icon. This is a completely editable PowerPoint presentation and is available for immediate download. Download now and impress your audience.
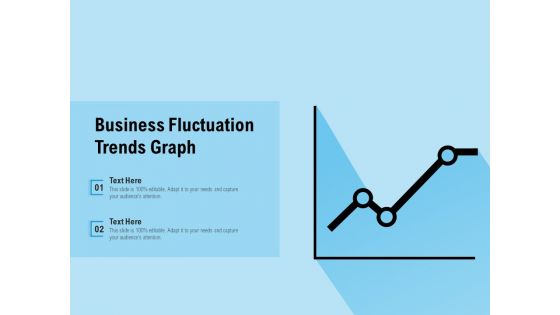
Business Fluctuation Trends Graph Ppt PowerPoint Presentation Gallery Graphics Design PDF
Presenting this set of slides with name business fluctuation trends graph ppt powerpoint presentation gallery graphics design pdf. This is a two stage process. The stages in this process are business fluctuation trends graph. This is a completely editable PowerPoint presentation and is available for immediate download. Download now and impress your audience.
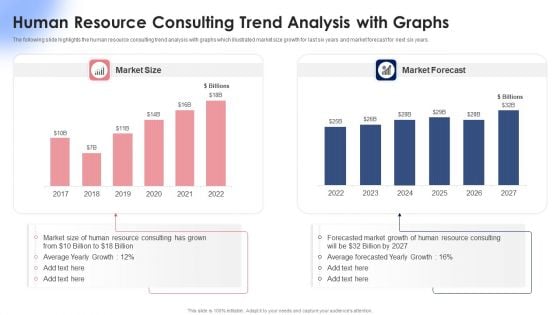
Human Resource Consulting Trend Analysis With Graphs Ppt Summary Clipart Images PDF
The following slide highlights the human resource consulting trend analysis with graphs which illustrated market size growth for last six years and market forecast for next six years. Pitch your topic with ease and precision using this Human Resource Consulting Trend Analysis With Graphs Ppt Summary Clipart Images PDF. This layout presents information on Market Size, Market Forecast, 2017 To 2022. It is also available for immediate download and adjustment. So, changes can be made in the color, design, graphics or any other component to create a unique layout.
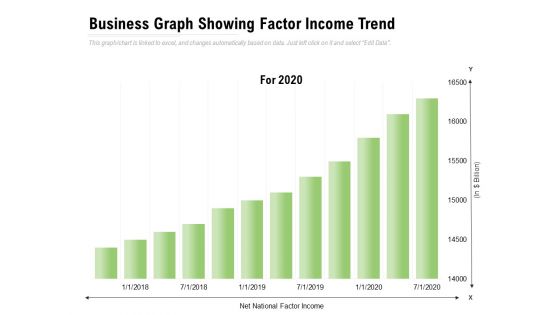
Business Graph Showing Factor Income Trend Ppt PowerPoint Presentation Slides Mockup
Presenting this set of slides with name business graph showing factor income trend ppt powerpoint presentation slides mockup. The topics discussed in these slide is business graph showing factor income trend. This is a completely editable PowerPoint presentation and is available for immediate download. Download now and impress your audience.
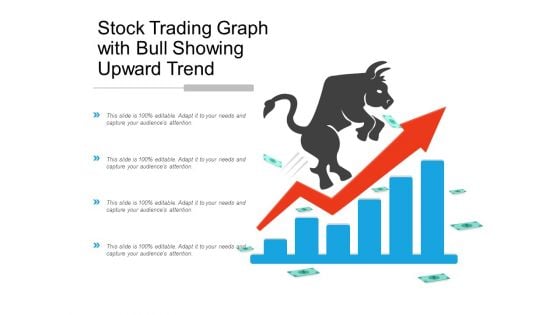
Stock Trading Graph With Bull Showing Upward Trend Ppt Powerpoint Presentation Pictures Outfit
This is a stock trading graph with bull showing upward trend ppt powerpoint presentation pictures outfit. This is a four stage process. The stages in this process are stock market, financial market, bull market.
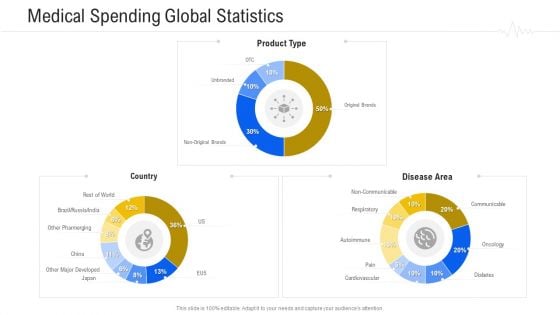
Hospital Management System Medical Spending Global Statistics Introduction PDF
Deliver an awe inspiring pitch with this creative hospital management system medical spending global statistics introduction pdf bundle. Topics like product type, disease area, country can be discussed with this completely editable template. It is available for immediate download depending on the needs and requirements of the user.
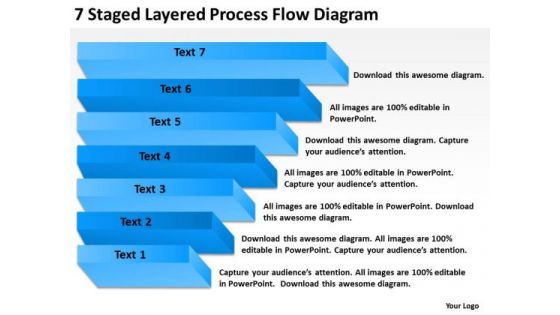
7 Staged Layered Process Flow Diagram Ppt Business Plan Outline PowerPoint Templates
We present our 7 staged layered process flow diagram ppt business plan outline PowerPoint templates.Download our Flow Charts PowerPoint Templates because They will bring a lot to the table. Their alluring flavours will make your audience salivate. Use our Business PowerPoint Templates because It can be used to Set your controls for the heart of the sun. Our PowerPoint Templates and Slides will be the propellant to get you there. Download and present our Finance PowerPoint Templates because Our PowerPoint Templates and Slides will let your team Walk through your plans. See their energy levels rise as you show them the way. Use our Process and Flows PowerPoint Templates because Timeline crunches are a fact of life. Meet all deadlines using our PowerPoint Templates and Slides. Download our Shapes PowerPoint Templates because Our PowerPoint Templates and Slides are created by a hardworking bunch of busybees. Always flitting around with solutions gauranteed to please.Use these PowerPoint slides for presentations relating to Diagram, process, chart, business, isolated, step, order, presentation, glossy, elements, graphic, level, layer, work flow, management, manage, illustration, system, strategy, shiny, procedure, company . The prominent colors used in the PowerPoint template are Blue, Black, Blue light. Feast your eyes on our 7 Staged Layered Process Flow Diagram Ppt Business Plan Outline PowerPoint Templates. Their colourful display will keep you enthralled.
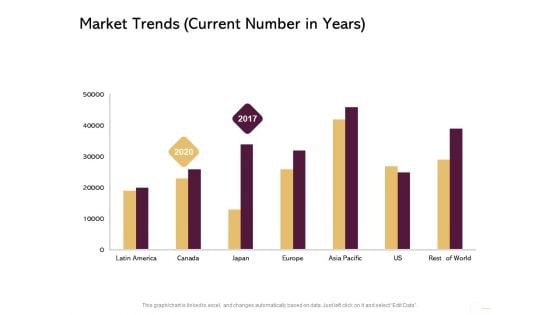
Managing Portfolio Growth Options Market Trends Current Number In Years Slides PDF
Presenting this set of slides with name managing portfolio growth options market trends current number in years slides pdf. The topics discussed in these slides are market trends. This is a completely editable PowerPoint presentation and is available for immediate download. Download now and impress your audience.

Trend Graph Ppt PowerPoint Presentation Complete Deck With Slides
This Trend Graph Ppt PowerPoint Presentation Complete Deck With Slides acts as backup support for your ideas, vision, thoughts, etc. Use it to present a thorough understanding of the topic. This PPT slideshow can be utilized for both in-house and outside presentations depending upon your needs and business demands. Entailing twelve slides with a consistent design and theme, this template will make a solid use case. As it is intuitively designed, it suits every business vertical and industry. All you have to do is make a few tweaks in the content or any other component to design unique presentations. The biggest advantage of this complete deck is that it can be personalized multiple times once downloaded. The color, design, shapes, and other elements are free to modify to add personal touches. You can also insert your logo design in this PPT layout. Therefore a well-thought and crafted presentation can be delivered with ease and precision by downloading this Trend Graph Ppt PowerPoint Presentation Complete Deck With Slides PPT slideshow.
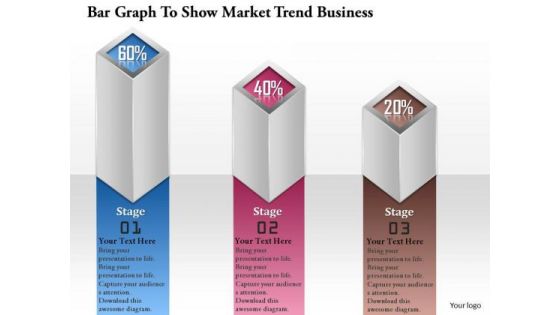
Consulting Slides Bar Graph To Show Market Trend Business Presentation
This bar graph can be very useful in presentations where you need to market trend. This can be used as a visualization tool because the audience can get a better view about what you want to show.
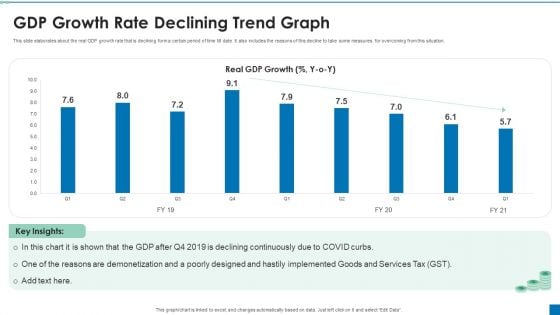
GDP Growth Rate Declining Trend Graph Ppt PowerPoint Presentation Slides Professional PDF
This slide elaborates about the real GDP growth rate that is declining form a certain period of time till date. It also includes the reasons of this decline to take some measures for overcoming from this situation. Showcasing this set of slides titled GDP Growth Rate Declining Trend Graph Ppt PowerPoint Presentation Slides Professional PDF. The topics addressed in these templates are Declining Continuously, Poorly Designed, Reasons Demonetization. All the content presented in this PPT design is completely editable. Download it and make adjustments in color, background, font etc. as per your unique business setting.
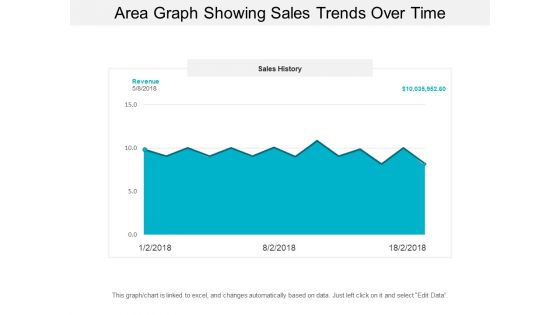
Area Graph Showing Sales Trends Over Time Ppt PowerPoint Presentation Model Background Designs
This is a area graph showing sales trends over time ppt powerpoint presentation model background designs. This is a three stage process. The stages in this process are financial analysis, quantitative, statistical modelling.
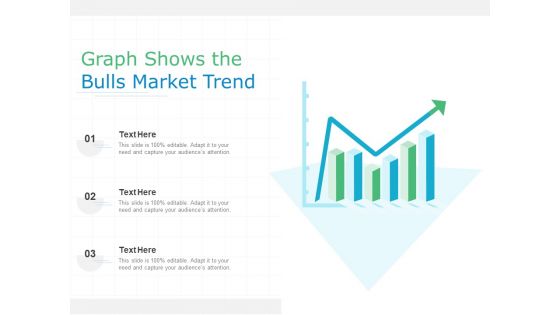
Graph Shows The Bulls Market Trend Ppt PowerPoint Presentation Professional Format PDF
Persuade your audience using this graph shows the bulls market trend ppt powerpoint presentation professional format pdf. This PPT design covers three stages, thus making it a great tool to use. It also caters to a variety of topics including graph shows the bulls market trend. Download this PPT design now to present a convincing pitch that not only emphasizes the topic but also showcases your presentation skills.

Stock Market Trend Dollar Sign On Bar Graph Ppt Powerpoint Presentation Show Deck
This is a stock market trend dollar sign on bar graph ppt powerpoint presentation show deck. This is a four stage process. The stages in this process are stock market, financial market, bull market.
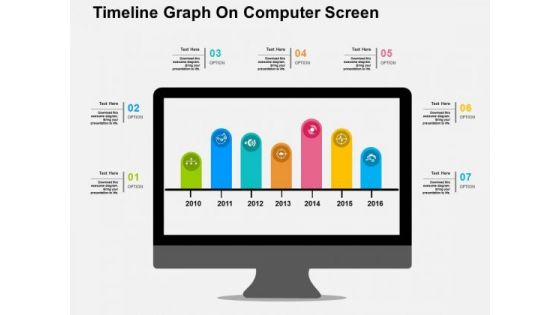
Timeline Graph On Computer Screen PowerPoint Template
Create dynamic presentations with our professional template containing diagram of bar graph on computer screen. This diagram is useful to display business timeline. Download this template to leave permanent impression on your audience.
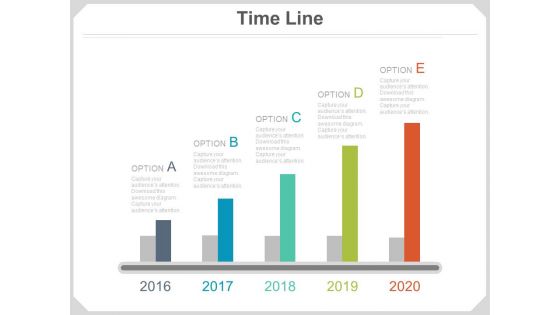
Five Growth Steps Timeline Graph Powerpoint Slides
This PowerPoint timeline slide design can be used to display growth steps. This timeline template has been designed with timeline growth graph. Download this PowerPoint timeline template to make impressive presentations.
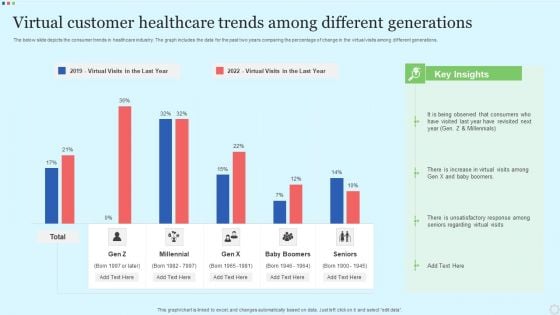
Virtual Customer Healthcare Trends Among Different Generations Professional PDF
The below slide depicts the consumer trends in healthcare industry. The graph includes the data for the past two years comparing the percentage of change in the virtual visits among different generations. Pitch your topic with ease and precision using this Virtual Customer Healthcare Trends Among Different Generations Professional PDF. This layout presents information on Millennial, Baby Boomers, Seniors. It is also available for immediate download and adjustment. So, changes can be made in the color, design, graphics or any other component to create a unique layout.
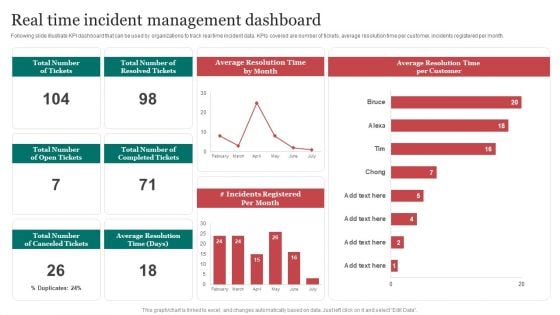
Real Time Incident Management Improving Cybersecurity With Incident Professional PDF
Following slide illustrate KPI dashboard that can be used by organizations to track real time incident data. KPIs covered are number of tickets, average resolution time per customer, incidents registered per month. The Real Time Incident Management Improving Cybersecurity With Incident Professional PDF is a compilation of the most recent design trends as a series of slides. It is suitable for any subject or industry presentation, containing attractive visuals and photo spots for businesses to clearly express their messages. This template contains a variety of slides for the user to input data, such as structures to contrast two elements, bullet points, and slides for written information. Slidegeeks is prepared to create an impression.
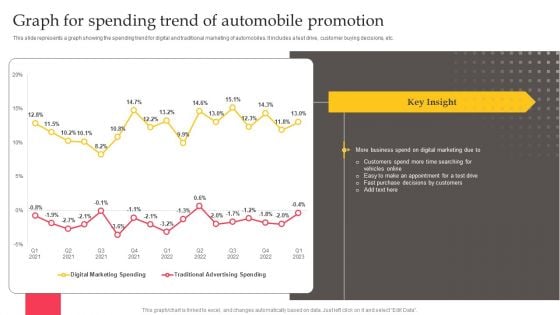
Executing Automotive Marketing Tactics For Sales Boost Graph For Spending Trend Information PDF
This slide represents a graph showing the spending trend for digital and traditional marketing of automobiles. It includes a test drive, customer buying decisions, etc. There are so many reasons you need a Executing Automotive Marketing Tactics For Sales Boost Graph For Spending Trend Information PDF. The first reason is you can not spend time making everything from scratch, Thus, Slidegeeks has made presentation templates for you too. You can easily download these templates from our website easily.
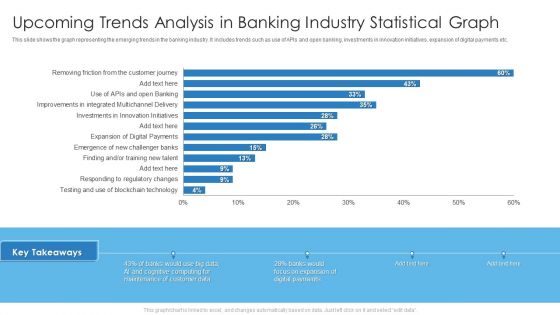
Upcoming Trends Analysis In Banking Industry Statistical Graph Brochure PDF
This slide shows the graph representing the emerging trends in the banking industry. It includes trends such as use of APIs and open banking, investments in innovation initiatives, expansion of digital payments etc. Deliver and pitch your topic in the best possible manner with this Upcoming Trends Analysis In Banking Industry Statistical Graph Brochure PDF. Use them to share invaluable insights on Upcoming Trends Analysis, Banking Industry Statistical Graph and impress your audience. This template can be altered and modified as per your expectations. So, grab it now.
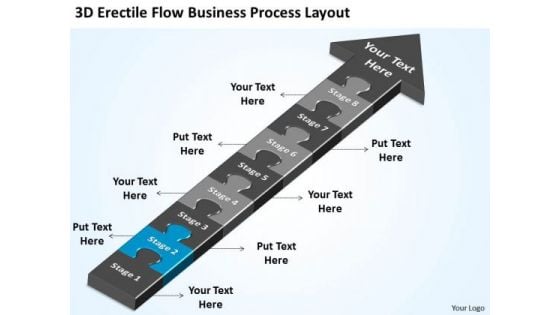
Flow Business PowerPoint Theme Process Layout Examples Plan Slides
We present our flow business powerpoint theme process layout examples plan Slides.Download and present our Symbol PowerPoint Templates because they will Amplify your basic corporate concept and forefront the benefits of overlapping processes to arrive at common goals. Use our Business PowerPoint Templates because you have churned your mind and come upwith solutions. Download and present our Flow charts PowerPoint Templates because you can Start with the fundamental basic activities and slowly but surely hone them down to the top of the pyramid, the ultimate goal. Present our Arrows PowerPoint Templates because you have a great training programme in mind to upgrade the skills of your staff. Use our Puzzles or Jigsaws PowerPoint Templates because you have the product you are very confident of and are very sure it will prove immensely popular with clients all over your target areas.Use these PowerPoint slides for presentations relating to 3d, Puzzle, Process, Arrow, Arrows, Block, Business, Chart, Design, Development, Diagram, Direction, Element, Flow, Flowchart, Graph, Linear, Management, Organization, Process, Program, Section, Sign, Solution, Symbol. The prominent colors used in the PowerPoint template are Blue, Gray, Black. Presenters tell us our flow business powerpoint theme process layout examples plan Slides are Fun. Use our Block PowerPoint templates and PPT Slides are Magnificent. You can be sure our flow business powerpoint theme process layout examples plan Slides are Stylish. Professionals tell us our Arrows PowerPoint templates and PPT Slides are topically designed to provide an attractive backdrop to any subject. Presenters tell us our flow business powerpoint theme process layout examples plan Slides are Elevated. PowerPoint presentation experts tell us our Business PowerPoint templates and PPT Slides are Multicolored. Get things going for you with our Flow Business PowerPoint Theme Process Layout Examples Plan Slides. The audience will be in a favourable mood.

Trend Graph Mobile Advertising Ppt PowerPoint Presentation Complete Deck With Slides
Improve your presentation delivery using this trend graph mobile advertising ppt powerpoint presentation complete deck with slides. Support your business vision and objectives using this well-structured PPT deck. This template offers a great starting point for delivering beautifully designed presentations on the topic of your choice. Comprising twelve this professionally designed template is all you need to host discussion and meetings with collaborators. Each slide is self-explanatory and equipped with high-quality graphics that can be adjusted to your needs. Therefore, you will face no difficulty in portraying your desired content using this PPT slideshow. This PowerPoint slideshow contains every important element that you need for a great pitch. It is not only editable but also available for immediate download and utilization. The color, font size, background, shapes everything can be modified to create your unique presentation layout. Therefore, download it now.
Downward Arrow Trend Graph Vector Icon Ppt PowerPoint Presentation Pictures PDF
Presenting this set of slides with name downward arrow trend graph vector icon ppt powerpoint presentation pictures pdf. This is a three stage process. The stages in this process are downward arrow trend graph vector icon. This is a completely editable PowerPoint presentation and is available for immediate download. Download now and impress your audience.
Bar Graph With Dollar Sign For Profit Trends Vector Icon Ppt PowerPoint Presentation Show Designs
Presenting this set of slides with name bar graph with dollar sign for profit trends vector icon ppt powerpoint presentation show designs. This is a one stage process. The stage in this process is bar graph with dollar sign for profit trends vector icon. This is a completely editable PowerPoint presentation and is available for immediate download. Download now and impress your audience.
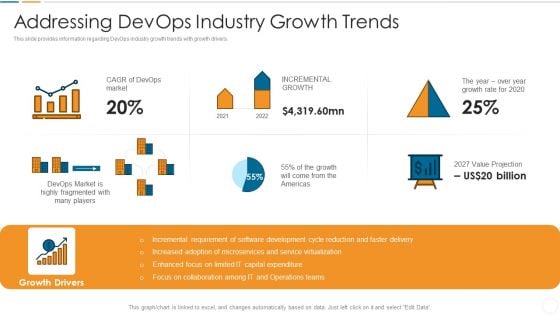
Future Trends Of Devops Industry IT Addressing Devops Industry Growth Trends Information PDF
This slide provides information regarding DevOps industry growth trends with growth drivers.Deliver and pitch your topic in the best possible manner with this future trends of devops industry it addressing devops industry growth trends information pdf. Use them to share invaluable insights on highly fragmented, incremental requirement, increased adoption and impress your audience. This template can be altered and modified as per your expectations. So, grab it now.
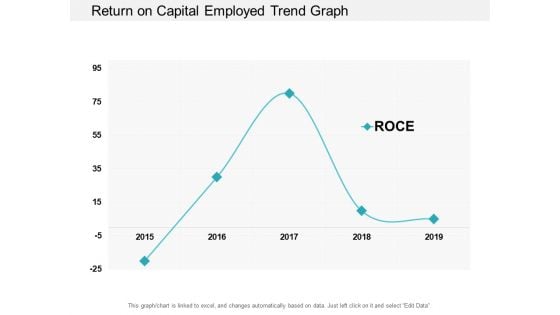
Return On Capital Employed Trend Graph Ppt PowerPoint Presentation Professional Example Topics
This is a return on capital employed trend graph ppt powerpoint presentation professional example topics. This is a one stage process. The stages in this process are accounting ratio, roce, return on capital employed.
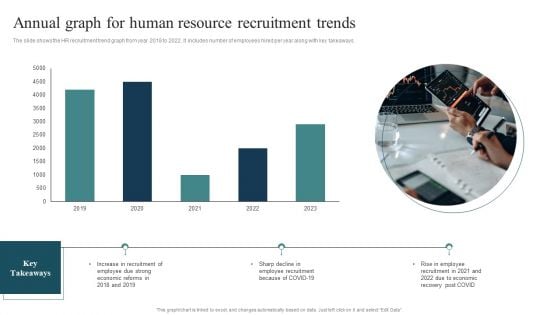
Annual Graph For Human Resource Recruitment Trends Summary PDF
The slide shows the HR recruitment trend graph from year 2018 to 2022. It includes number of employees hired per year along with key takeaways. Pitch your topic with ease and precision using this Annual Graph For Human Resource Recruitment Trends Summary PDF. This layout presents information on Employee Recruitment, Rise Employee, Economic Reforms. It is also available for immediate download and adjustment. So, changes can be made in the color, design, graphics or any other component to create a unique layout.
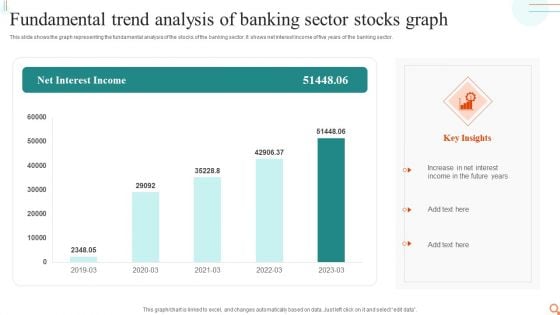
Fundamental Trend Analysis Of Banking Sector Stocks Graph Mockup PDF
This slide shows the graph representing the fundamental analysis of the stocks of the banking sector. It shows net interest income of five years of the banking sector.Pitch your topic with ease and precision using this Fundamental Trend Analysis Of Banking Sector Stocks Graph Mockup PDF. This layout presents information on Increase Interest, Income Future, Interest Income. It is also available for immediate download and adjustment. So, changes can be made in the color, design, graphics or any other component to create a unique layout.
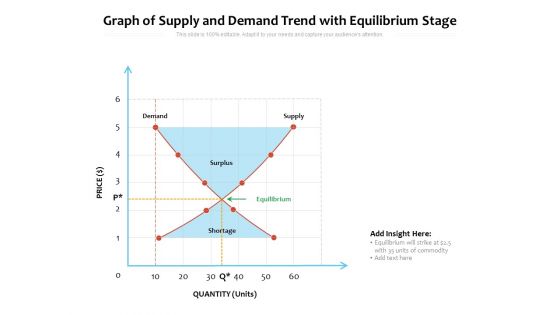
Graph Of Supply And Demand Trend With Equilibrium Stage Ppt PowerPoint Presentation File Model PDF
Presenting this set of slides with name graph of supply and demand trend with equilibrium stage ppt powerpoint presentation file model pdf. This is a six stage process. The stages in this process are price, quantity, supply. This is a completely editable PowerPoint presentation and is available for immediate download. Download now and impress your audience.
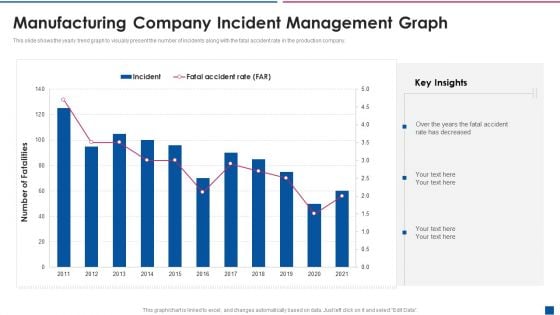
Manufacturing Company Incident Management Graph Information PDF
This slide shows the yearly trend graph to visually present the number of incidents along with the fatal accident rate in the production company. Showcasing this set of slides titled manufacturing company incident management graph information pdf. The topics addressed in these templates are manufacturing company incident management graph. All the content presented in this PPT design is completely editable. Download it and make adjustments in color, background, font etc. as per your unique business setting.
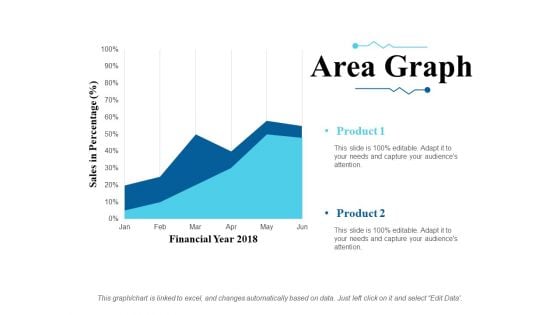
Area Graph Ppt PowerPoint Presentation Slides Ideas
This is a area graph ppt powerpoint presentation slides ideas. This is a two stage process. The stages in this process are sales in percentage, financial year, product.
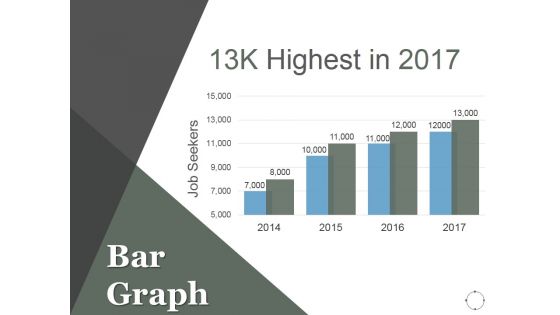
Bar Graph Ppt PowerPoint Presentation Model Images
This is a bar graph ppt powerpoint presentation model images. This is a four stage process. The stages in this process are business, marketing, finance, growth, management.
Real Estate Market Trends One Trend Per Slide Prices Ppt Icon Templates PDF
Deliver an awe-inspiring pitch with this creative real estate market trends one trend per slide prices ppt icon templates pdf. bundle. Topics like markets like san francisco, 2003 to 2021 can be discussed with this completely editable template. It is available for immediate download depending on the needs and requirements of the user.
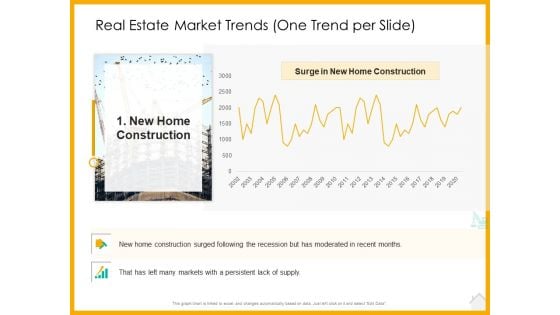
Real Estate Property Management System Real Estate Market Trends One Trend Per Slide Construction Ppt Infographics Visuals PDF
Deliver and pitch your topic in the best possible manner with this real estate property management system real estate market trends one trend per slide construction ppt infographics visuals pdf. Use them to share invaluable insights on real estate market trends one trend per slide and impress your audience. This template can be altered and modified as per your expectations. So, grab it now.
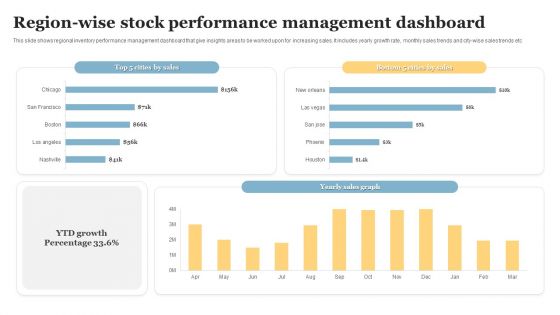
Region Wise Stock Performance Management Dashboard Introduction PDF
This slide shows regional inventory performance management dashboard that give insights areas to be worked upon for increasing sales. It includes yearly growth rate, monthly sales trends and city wise sales trends etc. Pitch your topic with ease and precision using this Region Wise Stock Performance Management Dashboard Introduction PDF. This layout presents information on Stock Performance, Management Dashboard. It is also available for immediate download and adjustment. So, changes can be made in the color, design, graphics or any other component to create a unique layout.
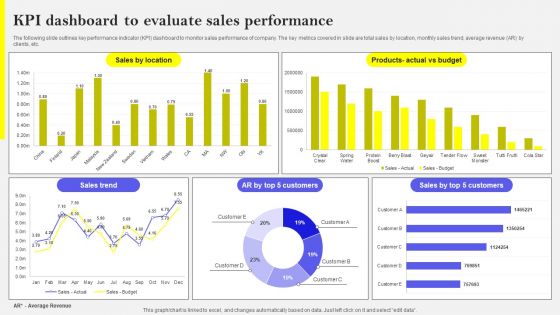
KPI Dashboard To Evaluate Sales Performance Template PDF
The following slide outlines key performance indicator KPI dashboard to monitor sales performance of company. The key metrics covered in slide are total sales by location, monthly sales trend, average revenue AR by clients, etc. Welcome to our selection of the KPI Dashboard To Evaluate Sales Performance Template PDF. These are designed to help you showcase your creativity and bring your sphere to life. Planning and Innovation are essential for any business that is just starting out. This collection contains the designs that you need for your everyday presentations. All of our PowerPoints are 100 percent editable, so you can customize them to suit your needs. This multi-purpose template can be used in various situations. Grab these presentation templates today
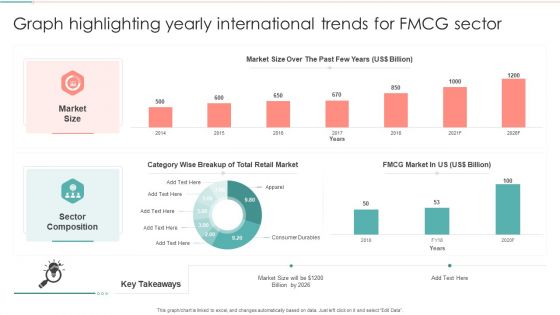
Graph Highlighting Yearly International Trends For FMCG Sector Information PDF
Pitch your topic with ease and precision using this Graph Highlighting Yearly International Trends For FMCG Sector Information PDF. This layout presents information on Sector Composition, Wise Breakup, Retail Market. It is also available for immediate download and adjustment. So, changes can be made in the color, design, graphics or any other component to create a unique layout.
Stock Market Upward Trends Graph With Dollar Sign And Arrow Up Ppt PowerPoint Presentation Professional Graphics Download
This is a stock market upward trends graph with dollar sign and arrow up ppt powerpoint presentation professional graphics download. This is a four stage process. The stages in this process are stock market, financial markets, bull market.
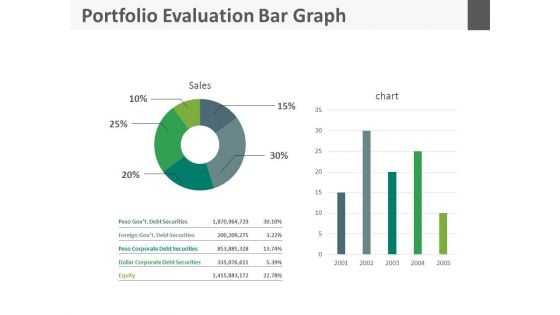
Portfolio Evaluation Bar Graph Ppt Slides
This is a portfolio evaluation bar graph ppt slides. This is a five stage process. The stages in this process are business, finance, marketing.
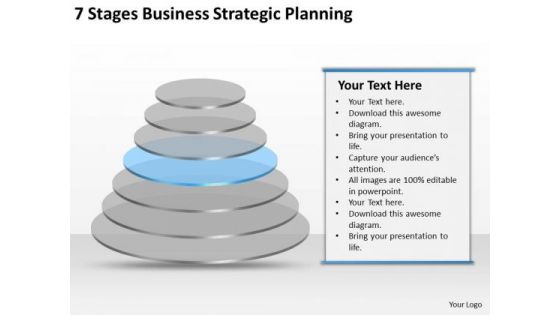
7 Stgaes Business Strategic Planning Plans Examples PowerPoint Slides
We present our 7 stgaes business strategic planning plans examples PowerPoint Slides.Use our Business PowerPoint Templates because It will Raise the bar of your Thoughts. They are programmed to take you to the next level. Download our Process and Flows PowerPoint Templates because Our PowerPoint Templates and Slides will bullet point your ideas. See them fall into place one by one. Use our Shapes PowerPoint Templates because You are working at that stage with an air of royalty. Let our PowerPoint Templates and Slides be the jewels in your crown. Present our Flow Charts PowerPoint Templates because Our PowerPoint Templates and Slides will provide you a launch platform. Give a lift off to your ideas and send them into orbit. Use our Spheres PowerPoint Templates because It is Aesthetically crafted by artistic young minds. Our PowerPoint Templates and Slides are designed to display your dexterity.Use these PowerPoint slides for presentations relating to Business, vector, pyramid, logo, soft, triangle, concept, sign, glossy, symbol, design, template, circle, pastel, element, graphics, shape, abstract, trend, modern, illustration, icon, collection, web, design, company, set, prospect, part, background, advertising, statistic . The prominent colors used in the PowerPoint template are Blue , Gray, White. Our 7 Stgaes Business Strategic Planning Plans Examples PowerPoint Slides come in all colours, shades and hues. They help highlight the importance of your views.
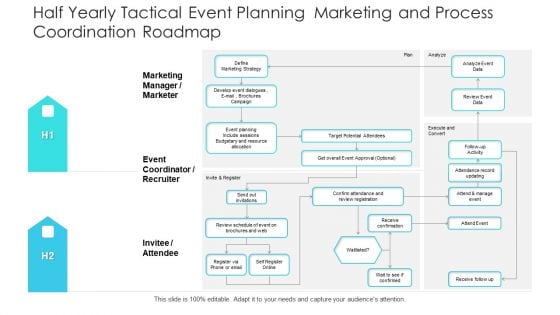
Half Yearly Tactical Event Planning Marketing And Process Coordination Roadmap Professional
Presenting our innovatively structured half yearly tactical event planning marketing and process coordination roadmap professional Template. Showcase your roadmap process in different formats like PDF, PNG, and JPG by clicking the download button below. This PPT design is available in both Standard Screen and Widescreen aspect ratios. It can also be easily personalized and presented with modified font size, font type, color, and shapes to measure your progress in a clear way.
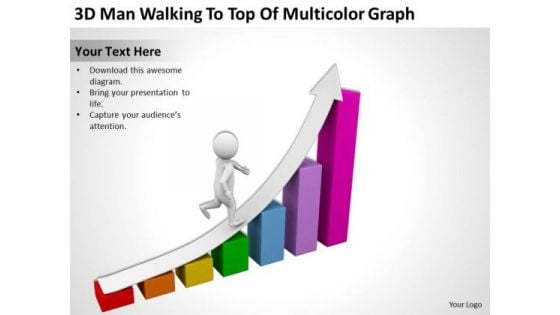
Famous Business People 3d Man Walking To Top Of Multicolor Graph PowerPoint Slides
We present our famous business people 3d man walking to top of multicolor graph PowerPoint Slides.Present our Business PowerPoint Templates because Our PowerPoint Templates and Slides team portray an attitude of elegance. Personify this quality by using them regularly. Present our Finance PowerPoint Templates because Our PowerPoint Templates and Slides help you pinpoint your timelines. Highlight the reasons for your deadlines with their use. Download and present our Marketing PowerPoint Templates because You have gained great respect for your brilliant ideas. Use our PowerPoint Templates and Slides to strengthen and enhance your reputation. Download our Success PowerPoint Templates because Our PowerPoint Templates and Slides are specially created by a professional team with vast experience. They diligently strive to come up with the right vehicle for your brilliant Ideas. Use our Process and Flows PowerPoint Templates because You can Double your output with our PowerPoint Templates and Slides. They make beating deadlines a piece of cake.Use these PowerPoint slides for presentations relating to 3d, achieve, aim, ambition, business, challenge, chart, company, competition, concept, confident, corporate, employee, finance, goal, graph, growth, job, leader, man, market, opportunity, path, person, progress, red, render, success, up, walking, way, white, worker. The prominent colors used in the PowerPoint template are White, Red, Green. The feedback we get is that our famous business people 3d man walking to top of multicolor graph PowerPoint Slides are designed to make your presentations professional. Professionals tell us our aim PowerPoint templates and PPT Slides are designed by a team of presentation professionals. PowerPoint presentation experts tell us our famous business people 3d man walking to top of multicolor graph PowerPoint Slides are designed to make your presentations professional. People tell us our ambition PowerPoint templates and PPT Slides will make you look like a winner. Presenters tell us our famous business people 3d man walking to top of multicolor graph PowerPoint Slides will impress their bosses and teams. Professionals tell us our company PowerPoint templates and PPT Slides will make the presenter successul in his career/life. Your thoughts will leave an everlasting image. Etch them in the memory with our Famous Business People 3d Man Walking To Top Of Multicolor Graph PowerPoint Slides.


 Continue with Email

 Home
Home


