Graph
Agile Techniques For Data Migration Determining The Most Used Agile Scaling Methods Icons PDF
This slide portrays informational statistics about most used agile scaling methods and approaches. Here the graph indicates that most of the organization prefers SAFe agile scaling methods and approaches. Deliver an awe inspiring pitch with this creative Agile Techniques For Data Migration Determining The Most Used Agile Scaling Methods Icons PDF bundle. Topics like Organizations, Scaling Lean, Agile Practices can be discussed with this completely editable template. It is available for immediate download depending on the needs and requirements of the user.

Auto Sales Profit Scorecard For Two And Four Wheeler Vehicles Inspiration PDF
This graph or chart is linked to excel, and changes automatically based on data. Just left click on it and select Edit Data. Deliver an awe inspiring pitch with this creative Auto Sales Profit Scorecard For Two And Four Wheeler Vehicles Inspiration PDF bundle. Topics like Two Wheeler Vehicles, Four Wheeler Vehicles, Six Wheeler Vehicles can be discussed with this completely editable template. It is available for immediate download depending on the needs and requirements of the user.
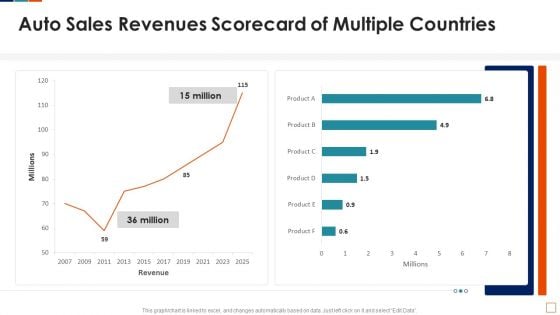
Auto Sales Revenues Scorecard Of Multiple Countries Inspiration PDF
This graph or chart is linked to excel, and changes automatically based on data. Just left click on it and select Edit Data. Deliver an awe inspiring pitch with this creative Auto Sales Revenues Scorecard Of Multiple Countries Inspiration PDF bundle. Topics like Auto Sales Revenues, Scorecard Multiple Countries can be discussed with this completely editable template. It is available for immediate download depending on the needs and requirements of the user.
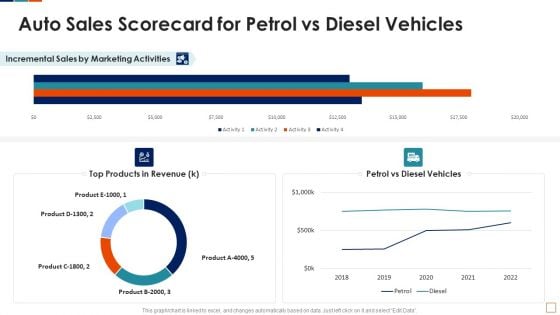
Auto Sales Scorecard For Petrol Vs Diesel Vehicles Template PDF
This graph or chart is linked to excel, and changes automatically based on data. Just left click on it and select Edit Data. Deliver an awe inspiring pitch with this creative Auto Sales Scorecard For Petrol Vs Diesel Vehicles Template PDF bundle. Topics like Top Products Revenue, Petrol Vs Diesel, Vehicles Incremental Sales, Marketing Activities Product can be discussed with this completely editable template. It is available for immediate download depending on the needs and requirements of the user.
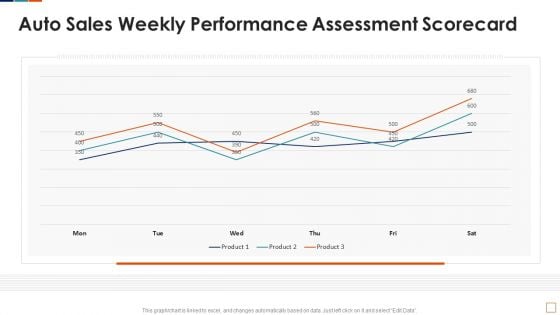
Auto Sales Weekly Performance Assessment Scorecard Background PDF
This graph or chart is linked to excel, and changes automatically based on data. Just left click on it and select Edit Data. Deliver and pitch your topic in the best possible manner with this Auto Sales Weekly Performance Assessment Scorecard Background PDF. Use them to share invaluable insights on Auto Sales Weekly, Performance Assessment Scorecard and impress your audience. This template can be altered and modified as per your expectations. So, grab it now.
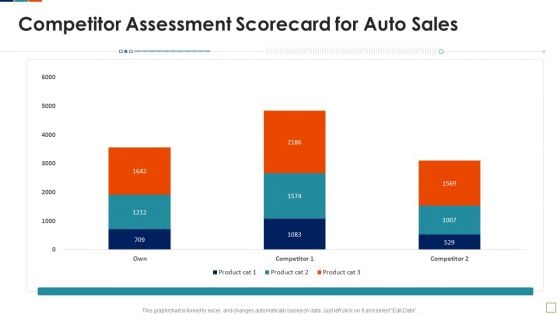
Automobile Sales Scorecard Competitor Assessment Scorecard For Auto Sales Demonstration PDF
This graph or chart is linked to excel, and changes automatically based on data. Just left click on it and select Edit Data. Deliver an awe inspiring pitch with this creative Automobile Sales Scorecard Competitor Assessment Scorecard For Auto Sales Demonstration PDF bundle. Topics like Competitor Assessment Scorecard, Auto Sales Product can be discussed with this completely editable template. It is available for immediate download depending on the needs and requirements of the user.
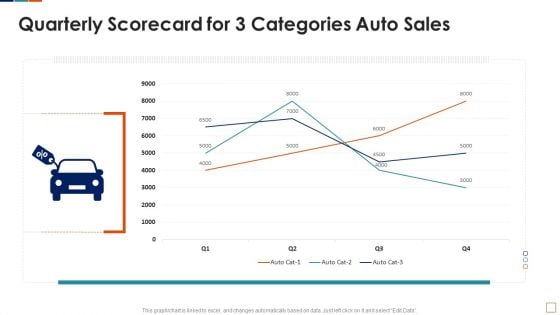
Automobile Sales Scorecard Quarterly Scorecard For 3 Categories Auto Sales Microsoft PDF
This graph or chart is linked to excel, and changes automatically based on data. Just left click on it and select Edit Data. Deliver an awe inspiring pitch with this creative Automobile Sales Scorecard Quarterly Scorecard For 3 Categories Auto Sales Microsoft PDF bundle. Topics like Quarterly Scorecard Three, Categories Auto Sales can be discussed with this completely editable template. It is available for immediate download depending on the needs and requirements of the user.
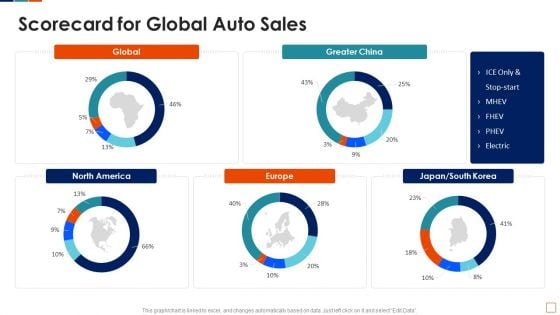
Automobile Sales Scorecard Scorecard For Global Auto Sales Themes PDF
This graph or chart is linked to excel, and changes automatically based on data. Just left click on it and select Edit Data. Deliver and pitch your topic in the best possible manner with this Automobile Sales Scorecard Scorecard For Global Auto Sales Themes PDF. Use them to share invaluable insights on Scorecard For Global, Auto Sales Global and impress your audience. This template can be altered and modified as per your expectations. So, grab it now.
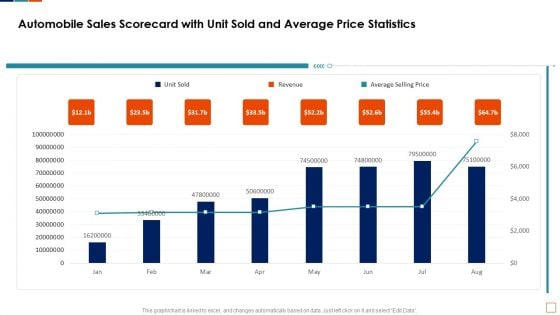
Automobile Sales Scorecard With Unit Sold And Average Price Statistics Formats PDF
This graph or chart is linked to excel, and changes automatically based on data. Just left click on it and select Edit Data. Deliver an awe inspiring pitch with this creative Automobile Sales Scorecard With Unit Sold And Average Price Statistics Formats PDF bundle. Topics like Automobile Sales Scorecard, Unit Sold Revenue, Average Price Statistics can be discussed with this completely editable template. It is available for immediate download depending on the needs and requirements of the user.
Automobile Sales Scorecard Yoy Percentage Comparison For Auto Sales Icons PDF
This graph or chart is linked to excel, and changes automatically based on data. Just left click on it and select Edit Data.Deliver and pitch your topic in the best possible manner with this Automobile Sales Scorecard Yoy Percentage Comparison For Auto Sales Icons PDF. Use them to share invaluable insights on Electric Vehicle Full, Hybrid Electric Vehicle, Ybrid Electric Vehicle, 2020 TO 2021 and impress your audience. This template can be altered and modified as per your expectations. So, grab it now.
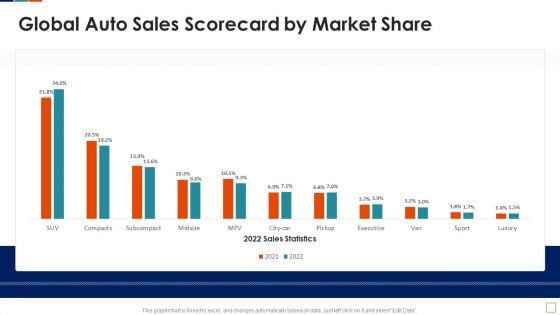
Global Auto Sales Scorecard By Market Share Ideas PDF
This graph or chart is linked to excel, and changes automatically based on data. Just left click on it and select Edit Data. Deliver an awe inspiring pitch with this creative Global Auto Sales Scorecard By Market Share Ideas PDF bundle. Topics like 2022 Sales Statistics, Global Auto Sales, Scorecard Market Share can be discussed with this completely editable template. It is available for immediate download depending on the needs and requirements of the user.
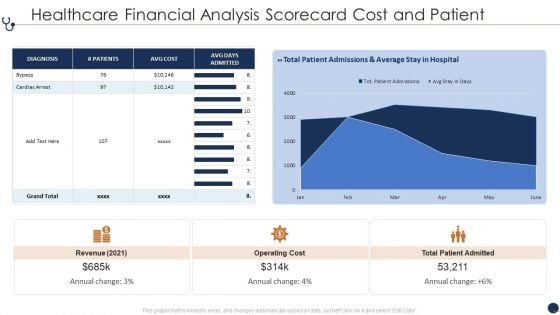
Healthcare Financial Analysis Scorecard Cost And Patient Ppt Pictures Rules PDF
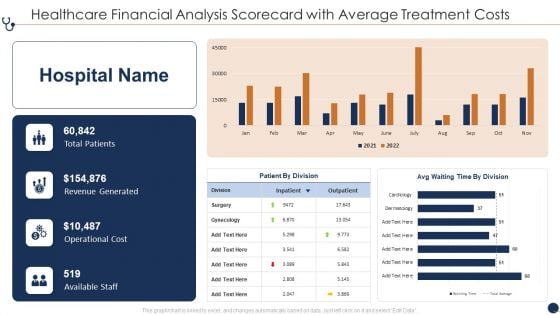
Healthcare Financial Analysis Scorecard With Average Treatment Costs Ppt Gallery Inspiration PDF
This graph or chart is linked to excel, and changes automatically based on data. Just left click on it and select Edit Data. Deliver and pitch your topic in the best possible manner with this Healthcare Financial Analysis Scorecard With Average Treatment Costs Ppt Gallery Inspiration PDF. Use them to share invaluable insights on Total Patients Revenue, Generated Operational Cost, Available Staff Outpatient and impress your audience. This template can be altered and modified as per your expectations. So, grab it now.
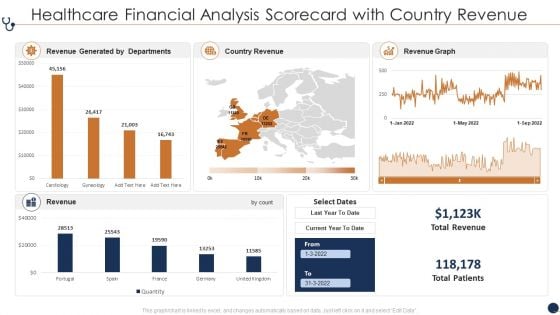
Healthcare Financial Analysis Scorecard With Country Revenue Ppt Layouts PDF
This graph or chart is linked to excel, and changes automatically based on data. Just left click on it and select Edit Data. Deliver an awe inspiring pitch with this creative Healthcare Financial Analysis Scorecard With Country Revenue Ppt Layouts PDF bundle. Topics like Revenue Generated Departments, Country Revenue Current can be discussed with this completely editable template. It is available for immediate download depending on the needs and requirements of the user.
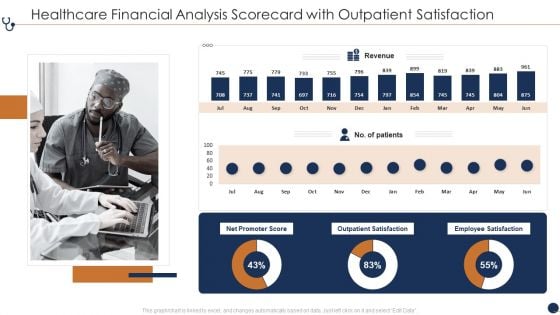
Healthcare Financial Analysis Scorecard With Outpatient Satisfaction Ppt Professional Background Image PDF
This graph or chart is linked to excel, and changes automatically based on data. Just left click on it and select Edit Data. Deliver and pitch your topic in the best possible manner with this Healthcare Financial Analysis Scorecard With Outpatient Satisfaction Ppt Professional Background Image PDF. Use them to share invaluable insights on Net Promoter Score, Outpatient Satisfaction Employee, Revenue Satisfaction Patients and impress your audience. This template can be altered and modified as per your expectations. So, grab it now.
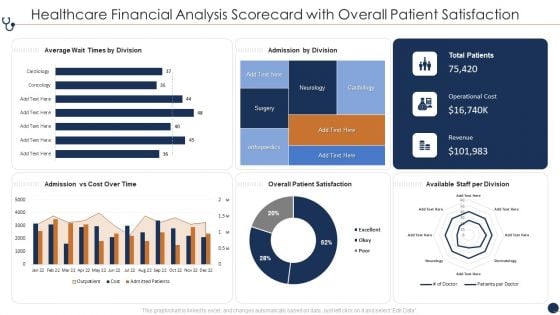
Healthcare Financial Analysis Scorecard With Overall Patient Satisfaction Ppt File Graphics PDF
This graph or chart is linked to excel, and changes automatically based on data. Just left click on it and select Edit Data. Deliver an awe inspiring pitch with this creative Healthcare Financial Analysis Scorecard With Overall Patient Satisfaction Ppt File Graphics PDF bundle. Topics like Average Wait Times, Admission By Division, Admission Vs Cost, Overall Patient Satisfaction can be discussed with this completely editable template. It is available for immediate download depending on the needs and requirements of the user.
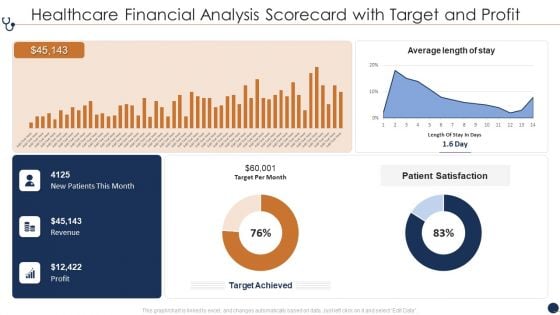
Healthcare Financial Analysis Scorecard With Target And Profit Ppt Gallery Example File PDF
This graph or chart is linked to excel, and changes automatically based on data. Just left click on it and select Edit Data. Deliver an awe inspiring pitch with this creative Avg Nurse Patient, Revenue And Expenses, Avg Treatment Costs bundle. Topics like Average Length Stay, Patient Satisfaction Target, Target Per Month can be discussed with this completely editable template. It is available for immediate download depending on the needs and requirements of the user.
Healthcare Financial Analysis Scorecard With Turnover And Net Income Ppt Icon Show PDF
This graph or chart is linked to excel, and changes automatically based on data. Just left click on it and select Edit Data. Deliver and pitch your topic in the best possible manner with this Healthcare Financial Analysis Scorecard With Turnover And Net Income Ppt Icon Show PDF. Use them to share invaluable insights on Planned Turnover Net, 2016 To 2020 and impress your audience. This template can be altered and modified as per your expectations. So, grab it now.
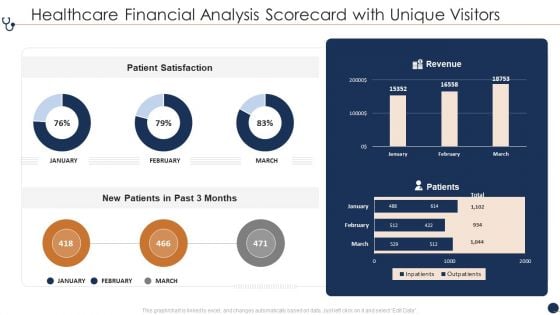
Healthcare Financial Analysis Scorecard With Unique Visitors Ppt File Visuals PDF
This graph or chart is linked to excel, and changes automatically based on data. Just left click on it and select Edit Data. Deliver an awe inspiring pitch with this creative Healthcare Financial Analysis Scorecard With Unique Visitors Ppt File Visuals PDF bundle. Topics like Patient Satisfaction Revenue, New Patients Past can be discussed with this completely editable template. It is available for immediate download depending on the needs and requirements of the user.
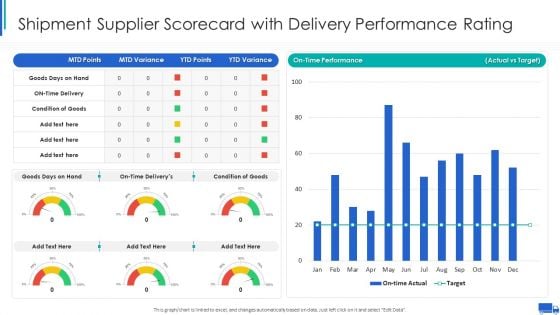
Shipment Supplier Scorecard With Delivery Performance Rating Ppt Ideas Graphic Tips PDF
This graph or chart is linked to excel, and changes automatically based on data. Just left click on it and select Edit Data. Deliver an awe inspiring pitch with this creative Shipment Supplier Scorecard With Delivery Performance Rating Ppt Ideas Graphic Tips PDF bundle. Topics like On Time Performance, Actual Vs Target, Goods Days Hand can be discussed with this completely editable template. It is available for immediate download depending on the needs and requirements of the user.
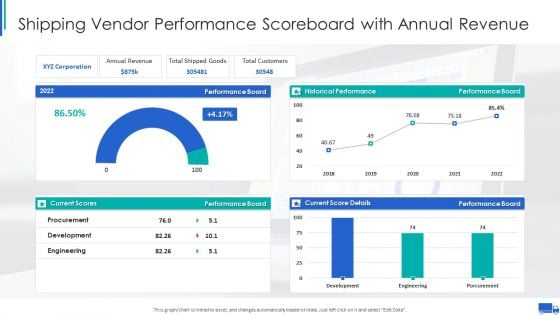
Shipping Vendor Performance Scoreboard With Annual Revenue Ppt Infographics Graphics PDF
This graph or chart is linked to excel, and changes automatically based on data. Just left click on it and select Edit Data. Deliver an awe inspiring pitch with this creative Shipping Vendor Performance Scoreboard With Annual Revenue Ppt Infographics Graphics PDF bundle. Topics like Annual Revenue Board, Total Shipped Goods, Total Customers Performance can be discussed with this completely editable template. It is available for immediate download depending on the needs and requirements of the user.
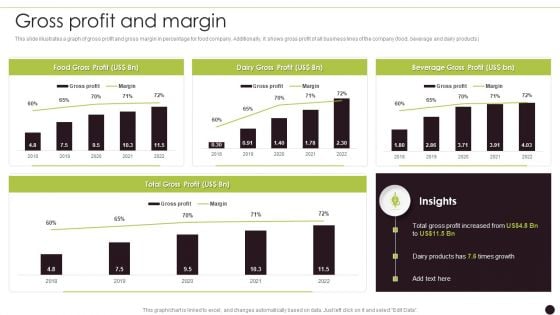
Canned Food Company Profile Gross Profit And Margin Portrait PDF
This slide illustrates a graph of gross profit and gross margin in percentage for food company. Additionally, it shows gross profit of all business lines of the company food, beverage and dairy products Deliver an awe inspiring pitch with this creative Canned Food Company Profile Gross Profit And Margin Portrait PDF bundle. Topics like Total Gross, Dairy Profit, Beverage Gross can be discussed with this completely editable template. It is available for immediate download depending on the needs and requirements of the user.
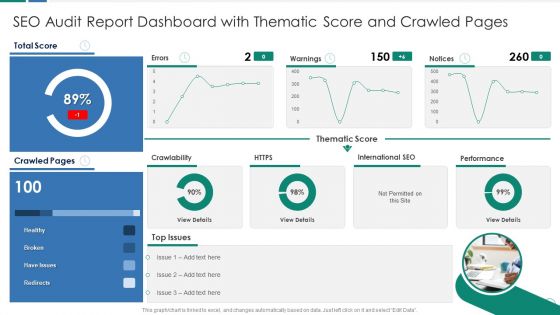
SEO Audit Report Dashboard With Thematic Score And Crawled Pages Download PDF
This graph or chart is linked to excel, and changes automatically based on data. Just left click on it and select Edit Data. Deliver and pitch your topic in the best possible manner with this SEO Audit Report Dashboard With Thematic Score And Crawled Pages Download PDF. Use them to share invaluable insights on Thematic Score Warnings, International SEO Performance, Total Score Healthy and impress your audience. This template can be altered and modified as per your expectations. So, grab it now.
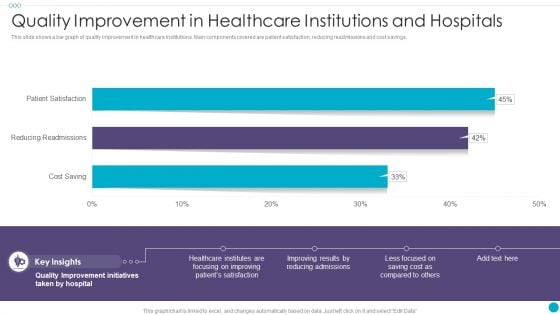
Quality Improvement In Healthcare Institutions And Hospitals Ideas PDF
This slide shows a bar graph of quality improvement in healthcare institutions. Main components covered are patient satisfaction, reducing readmissions and cost savings.Showcasing this set of slides titled Quality Improvement In Healthcare Institutions And Hospitals Ideas PDF The topics addressed in these templates are Improvement Initiatives, Healthcare Institutes ,Focusing Improving All the content presented in this PPT design is completely editable. Download it and make adjustments in color, background, font etc. as per your unique business setting.
Finance Metrics Dashboard Illustrating Gross And Operating Profit Margin Icons PDF
This graph or chart is linked to excel, and changes automatically based on data. Just left click on it and select edit data. Showcasing this set of slides titled Finance Metrics Dashboard Illustrating Gross And Operating Profit Margin Icons PDF. The topics addressed in these templates are Gross Profit Margin, Operating Profit Margin, Net Profit Margin. All the content presented in this PPT design is completely editable. Download it and make adjustments in color, background, font etc. as per your unique business setting.
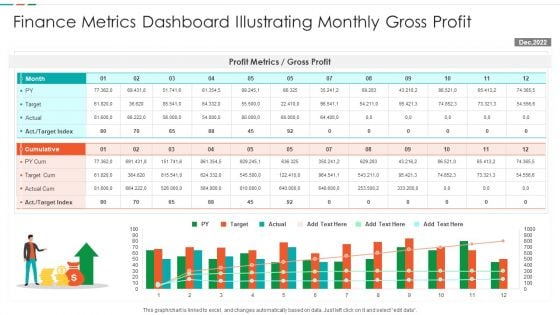
Finance Metrics Dashboard Illustrating Monthly Gross Profit Formats PDF
This graph or chart is linked to excel, and changes automatically based on data. Just left click on it and select edit data. Showcasing this set of slides titled Finance Metrics Dashboard Illustrating Monthly Gross Profit Formats PDF. The topics addressed in these templates are Profit Metrics Gross, Profit Target Cum, Actual Cum Target. All the content presented in this PPT design is completely editable. Download it and make adjustments in color, background, font etc. as per your unique business setting.
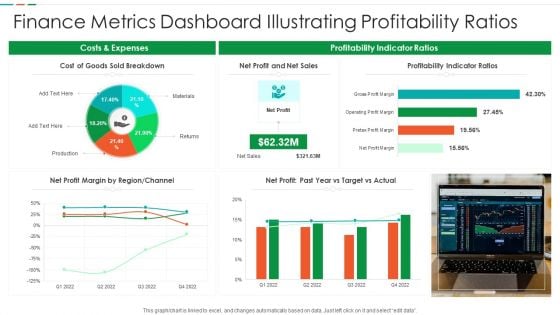
Finance Metrics Dashboard Illustrating Profitability Ratios Diagrams PDF
This graph or chart is linked to excel, and changes automatically based on data. Just left click on it and select edit data. Pitch your topic with ease and precision using this Finance Metrics Dashboard Illustrating Profitability Ratios Diagrams PDF. This layout presents information on Cost Goods Sold, Net Profit Net, Sales Profitability Indicator. It is also available for immediate download and adjustment. So, changes can be made in the color, design, graphics or any other component to create a unique layout.
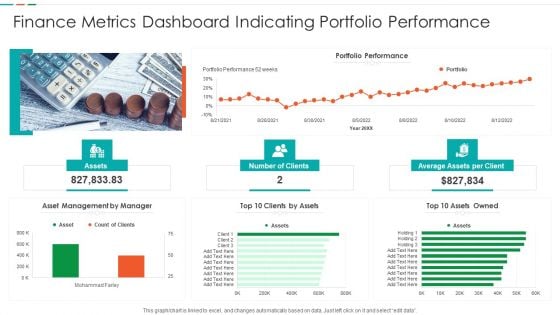
Finance Metrics Dashboard Indicating Portfolio Performance Microsoft PDF
This graph or chart is linked to excel, and changes automatically based on data. Just left click on it and select edit data. Pitch your topic with ease and precision using this Finance Metrics Dashboard Indicating Portfolio Performance Microsoft PDF. This layout presents information on Portfolio Performance Portfolio, Asset Management Manager, Top 10 Assets. It is also available for immediate download and adjustment. So, changes can be made in the color, design, graphics or any other component to create a unique layout.
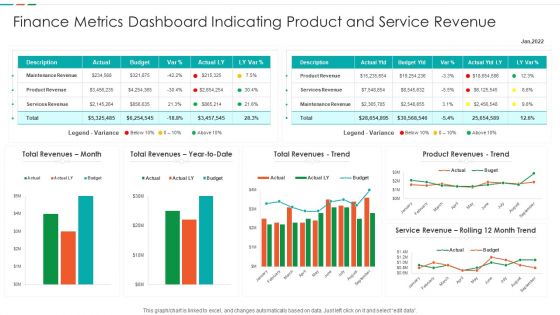
Finance Metrics Dashboard Indicating Product And Service Revenue Designs PDF
This graph or chart is linked to excel, and changes automatically based on data. Just left click on it and select edit data. Showcasing this set of slides titled Finance Metrics Dashboard Indicating Product And Service Revenue Designs PDF. The topics addressed in these templates are Maintenance Revenue Product, Revenue Product Revenues, Service Revenue Rolling. All the content presented in this PPT design is completely editable. Download it and make adjustments in color, background, font etc. as per your unique business setting.
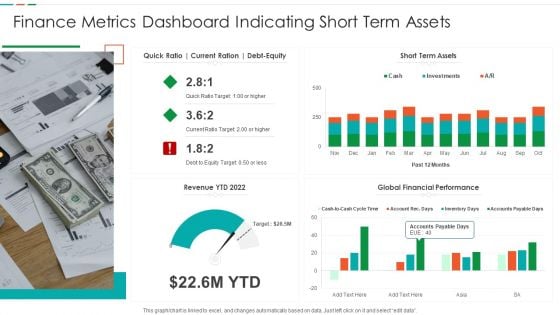
Finance Metrics Dashboard Indicating Short Term Assets Download PDF
This graph or chart is linked to excel, and changes automatically based on data. Just left click on it and select edit data. Pitch your topic with ease and precision using this Finance Metrics Dashboard Indicating Short Term Assets Download PDF. This layout presents information on Short Term Assets, Global Financial Performance, Revenue YTD 2022. It is also available for immediate download and adjustment. So, changes can be made in the color, design, graphics or any other component to create a unique layout.
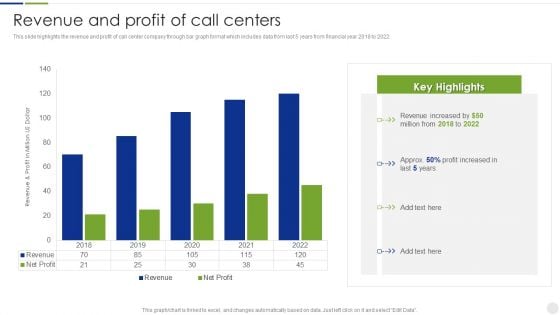
Business Process Outsourcing Company Profile Revenue And Profit Of Call Centers Brochure PDF
This slide highlights the revenue and profit of call center company through bar graph format which includes data from last 5 years from financial year 2018 to 2022. Deliver and pitch your topic in the best possible manner with this Business Process Outsourcing Company Profile Revenue And Profit Of Call Centers Brochure PDF. Use them to share invaluable insights on Revenue, Net Profit and impress your audience. This template can be altered and modified as per your expectations. So, grab it now.
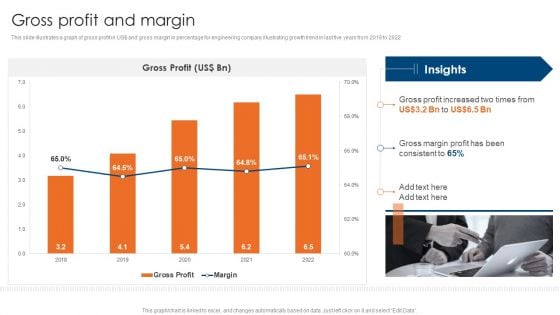
Engineering Consultancy Works Company Profile Gross Profit And Margin Infographics PDF
This slide illustrates a graph of gross profit in US doller and gross margin in percentage for engineering company illustrating growth trend in last five years from 2018 to 2022. Deliver an awe inspiring pitch with this creative Engineering Consultancy Works Company Profile Gross Profit And Margin Infographics PDF bundle. Topics like Gross Profit, Margin can be discussed with this completely editable template. It is available for immediate download depending on the needs and requirements of the user.
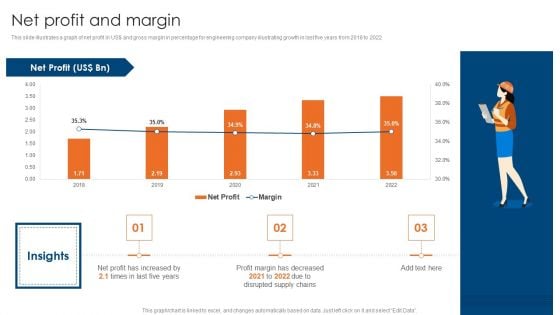
Engineering Consultancy Works Company Profile Net Profit And Margin Clipart PDF
This slide illustrates a graph of net profit in US doller and gross margin in percentage for engineering company illustrating growth in last five years from 2018 to 2022. Deliver an awe inspiring pitch with this creative Engineering Consultancy Works Company Profile Net Profit And Margin Clipart PDF bundle. Topics like Net Profit And Margin can be discussed with this completely editable template. It is available for immediate download depending on the needs and requirements of the user.
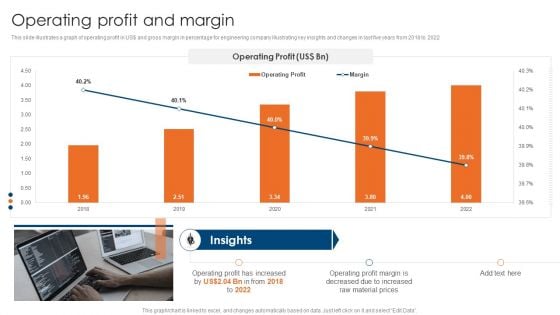
Engineering Consultancy Works Company Profile Operating Profit And Margin Topics PDF
This slide illustrates a graph of operating profit in US doller and gross margin in percentage for engineering company illustrating key insights and changes in last five years from 2018 to 2022. Deliver an awe inspiring pitch with this creative Engineering Consultancy Works Company Profile Operating Profit And Margin Topics PDF bundle. Topics like Operating, Profit, Margin can be discussed with this completely editable template. It is available for immediate download depending on the needs and requirements of the user.
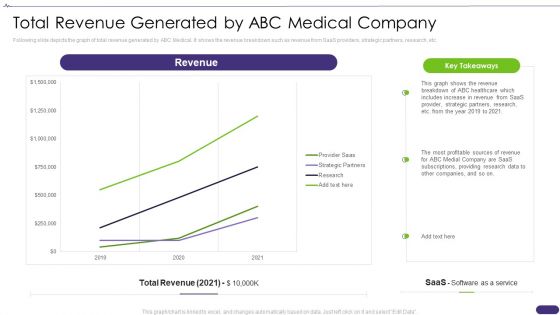
Pitch Deck For Healthcare Application Total Revenue Generated By Abc Medical Company Demonstration PDF
Following slide depicts the graph of total revenue generated by ABC Medical. It shows the revenue breakdown such as revenue from SaaS providers, strategic partners, research, etc. Deliver an awe inspiring pitch with this creative Pitch Deck For Healthcare Application Total Revenue Generated By Abc Medical Company Demonstration PDF bundle. Topics like Revenue, Generated, Medical Company can be discussed with this completely editable template. It is available for immediate download depending on the needs and requirements of the user.
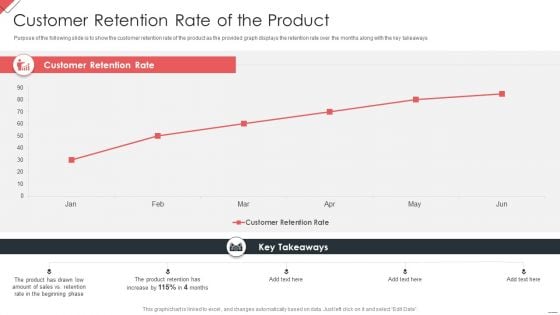
New Commodity Market Viability Review Customer Retention Rate Of The Product Slides PDF
Purpose of the following slide is to show the customer retention rate of the product as the provided graph displays the retention rate over the months along with the key takeaways Deliver an awe inspiring pitch with this creative New Commodity Market Viability Review Customer Retention Rate Of The Product Slides PDF bundle. Topics like Customer, Retention, Rate Product can be discussed with this completely editable template. It is available for immediate download depending on the needs and requirements of the user.

Healthcare Hospital Performance Data Scorecard With Average Admission Cost Ppt Summary Grid PDF
This graph or chart is linked to excel, and changes automatically based on data. Just left click on it and select Edit Data. Deliver an awe inspiring pitch with this creative Healthcare Hospital Performance Data Scorecard With Average Admission Cost Ppt Summary Grid PDF bundle. Topics like Average Admission Cost, Total Cost Patients, Average Days Admitted, Total Patients Admitted can be discussed with this completely editable template. It is available for immediate download depending on the needs and requirements of the user.
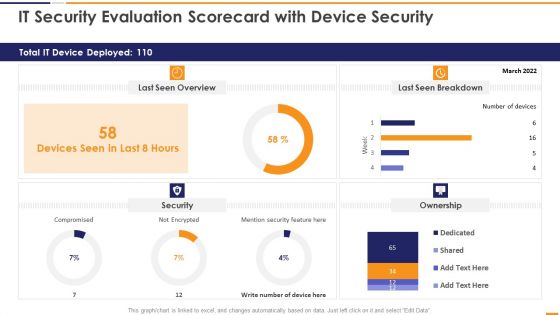
IT Security Evaluation Scorecard With Device Security Ppt Slides Good PDF
This graph or chart is linked to excel, and changes automatically based on data. Just left click on it and select Edit Data. Deliver an awe inspiring pitch with this creative IT Security Evaluation Scorecard With Device Security Ppt Slides Good PDF bundle. Topics like Total IT Device, Last Seen Overview, Last Seen Breakdown, Mention Security Feature can be discussed with this completely editable template. It is available for immediate download depending on the needs and requirements of the user.
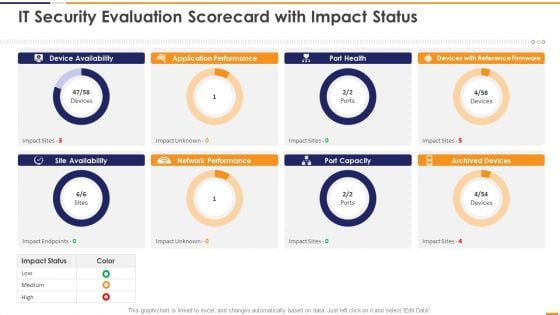
IT Security Evaluation Scorecard With Impact Status Ppt Portfolio Guidelines PDF
This graph or chart is linked to excel, and changes automatically based on data. Just left click on it and select Edit Data. Deliver and pitch your topic in the best possible manner with this IT Security Evaluation Scorecard With Impact Status Ppt Portfolio Guidelines PDF. Use them to share invaluable insights on Device Availability Application, Performance Port Health, Devices Reference Firmware and impress your audience. This template can be altered and modified as per your expectations. So, grab it now.
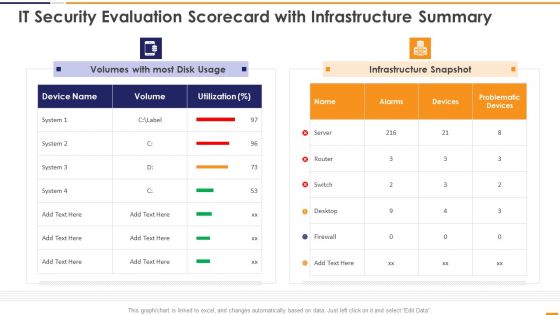
IT Security Evaluation Scorecard With Infrastructure Summary Ppt Slides Portrait PDF
This graph or chart is linked to excel, and changes automatically based on data. Just left click on it and select Edit Data. Deliver an awe inspiring pitch with this creative IT Security Evaluation Scorecard With Infrastructure Summary Ppt Slides Portrait PDF bundle. Topics like Volumes Most Disk, Usage Infrastructure Snapshot can be discussed with this completely editable template. It is available for immediate download depending on the needs and requirements of the user.
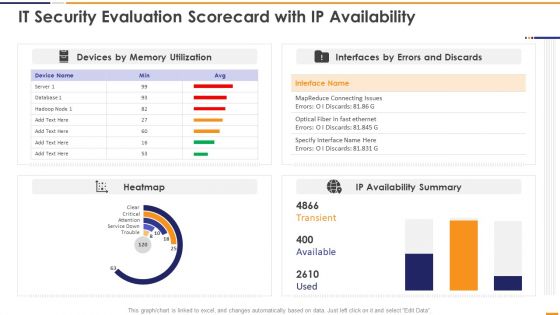
IT Security Evaluation Scorecard With Ip Availability Ppt Pictures Portrait PDF
This graph or chart is linked to excel, and changes automatically based on data. Just left click on it and select Edit Data. Deliver and pitch your topic in the best possible manner with this IT Security Evaluation Scorecard With Ip Availability Ppt Pictures Portrait PDF. Use them to share invaluable insights on Devices Memory Utilization, Interfaces Errors Discards, IP Availability Summary and impress your audience. This template can be altered and modified as per your expectations. So, grab it now.
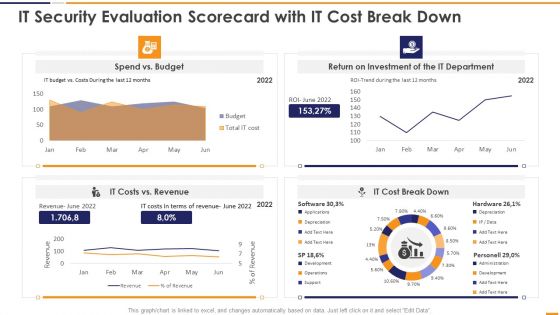
IT Security Evaluation Scorecard With It Cost Break Down Ppt Infographics Slideshow PDF
This graph or chart is linked to excel, and changes automatically based on data. Just left click on it and select Edit Data. Deliver an awe inspiring pitch with this creative IT Security Evaluation Scorecard With It Cost Break Down Ppt Infographics Slideshow PDF bundle. Topics like Spend Vs Budget, Return On Investment, IT Department Revenue, IT Costs Vs can be discussed with this completely editable template. It is available for immediate download depending on the needs and requirements of the user.
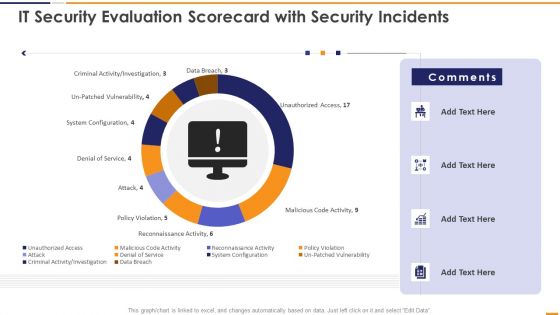
IT Security Evaluation Scorecard With Security Incidents Ppt Pictures Vector PDF
This graph or chart is linked to excel, and changes automatically based on data. Just left click on it and select Edit Data. Deliver and pitch your topic in the best possible manner with this IT Security Evaluation Scorecard With Security Incidents Ppt Pictures Vector PDF. Use them to share invaluable insights on Unauthorized Access Sales, Malicious Code Activity, Reconnaissance Activity Attack and impress your audience. This template can be altered and modified as per your expectations. So, grab it now.
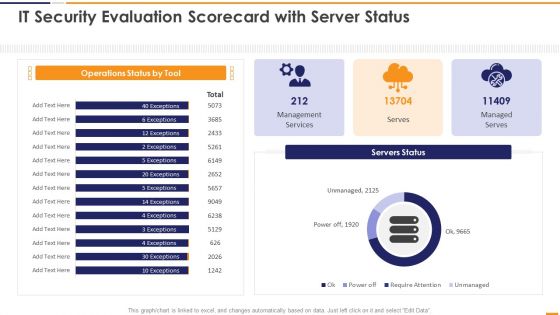
IT Security Evaluation Scorecard With Server Status Ppt Professional Images PDF
This graph or chart is linked to excel, and changes automatically based on data. Just left click on it and select Edit Data. Deliver an awe inspiring pitch with this creative IT Security Evaluation Scorecard With Server Status Ppt Professional Images PDF bundle. Topics like Operations Status Tool, Management Services Managed can be discussed with this completely editable template. It is available for immediate download depending on the needs and requirements of the user.
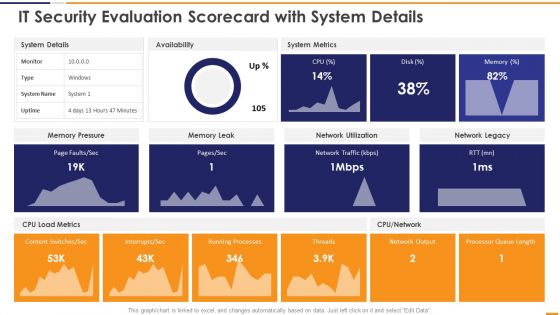
IT Security Evaluation Scorecard With System Details Ppt Inspiration Vector PDF
This graph or chart is linked to excel, and changes automatically based on data. Just left click on it and select Edit Data. Deliver and pitch your topic in the best possible manner with this IT Security Evaluation Scorecard With System Details Ppt Inspiration Vector PDF. Use them to share invaluable insights on System Details Availability, System Metrics Memory, Pressure Memory Leak and impress your audience. This template can be altered and modified as per your expectations. So, grab it now.
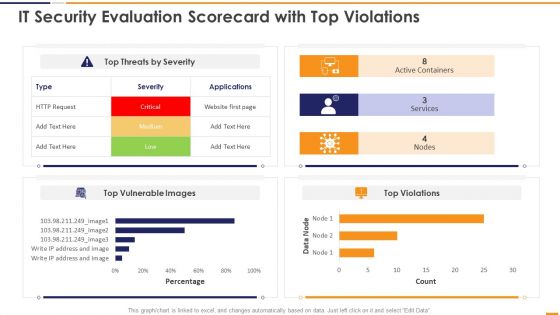
IT Security Evaluation Scorecard With Top Violations Ppt Portfolio Deck PDF
This graph or chart is linked to excel, and changes automatically based on data. Just left click on it and select Edit Data. Deliver an awe inspiring pitch with this creative IT Security Evaluation Scorecard With Top Violations Ppt Portfolio Deck PDF bundle. Topics like Top Threats Severity, Active Containers Services, Top Vulnerable Images can be discussed with this completely editable template. It is available for immediate download depending on the needs and requirements of the user.
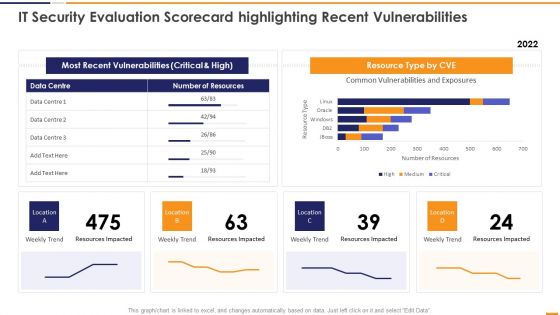
IT Security Evaluation Scorecard Highlighting Recent Vulnerabilities Introduction PDF
This graph or chart is linked to excel, and changes automatically based on data. Just left click on it and select Edit Data. Deliver an awe inspiring pitch with this creative IT Security Evaluation Scorecard Highlighting Recent Vulnerabilities Introduction PDF bundle. Topics like Most Recent Vulnerabilities, Resource Type CVE, Weekly Trend Location can be discussed with this completely editable template. It is available for immediate download depending on the needs and requirements of the user.
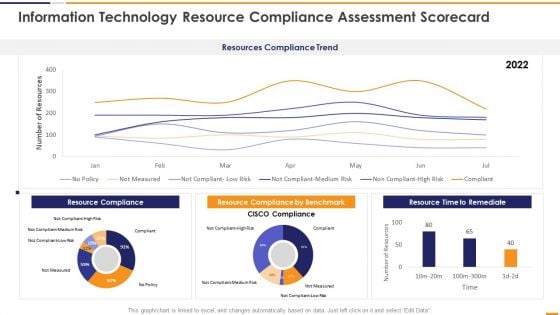
IT Security Evaluation Scorecard Information Technology Resource Compliance Background PDF
This graph or chart is linked to excel, and changes automatically based on data. Just left click on it and select Edit Data. Deliver and pitch your topic in the best possible manner with this IT Security Evaluation Scorecard Information Technology Resource Compliance Background PDF. Use them to share invaluable insights on Resources Compliance Trend, Resource Compliance 2022, Resource Compliance Benchmark, Resource Time Remediate and impress your audience. This template can be altered and modified as per your expectations. So, grab it now.
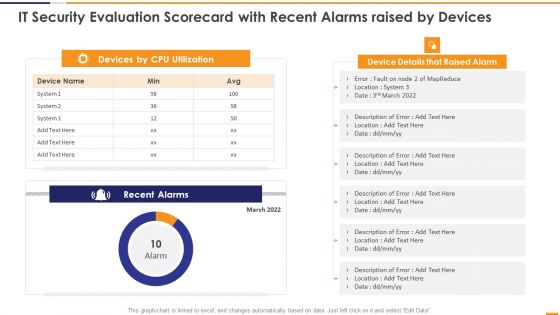
IT Security Evaluation Scorecard With Recent Alarms Raised By Devices Guidelines PDF
This graph or chart is linked to excel, and changes automatically based on data. Just left click on it and select Edit Data. Deliver an awe inspiring pitch with this creative IT Security Evaluation Scorecard With Recent Alarms Raised By Devices Guidelines PDF bundle. Topics like Devices CPU Utilization, Device Details Raised can be discussed with this completely editable template. It is available for immediate download depending on the needs and requirements of the user.

IT Security Evaluation Scorecard With Response Time And Availability Brochure PDF
This graph or chart is linked to excel, and changes automatically based on data. Just left click on it and select Edit Data. Deliver and pitch your topic in the best possible manner with this IT Security Evaluation Scorecard With Response Time And Availability Brochure PDF. Use them to share invaluable insights on Response Time 2022, Disk Utilization Availability and impress your audience. This template can be altered and modified as per your expectations. So, grab it now.
IT Security Evaluation Scorecard With Server Uptime And Downtime Icons PDF
This graph or chart is linked to excel, and changes automatically based on data. Just left click on it and select Edit Data. Deliver an awe inspiring pitch with this creative IT Security Evaluation Scorecard With Server Uptime And Downtime Icons PDF bundle. Topics like IT Support Employee, Per Thousand End, user Over Time, Uptime And Downtime can be discussed with this completely editable template. It is available for immediate download depending on the needs and requirements of the user.
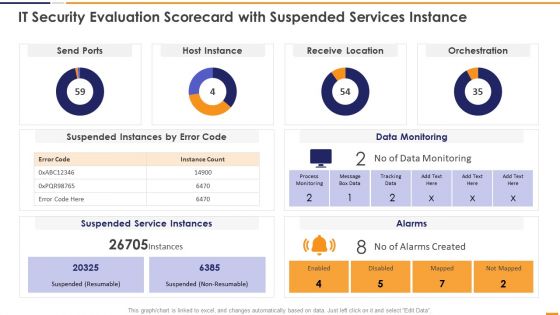
IT Security Evaluation Scorecard With Suspended Services Instance Graphics PDF
This graph or chart is linked to excel, and changes automatically based on data. Just left click on it and select Edit Data. Deliver and pitch your topic in the best possible manner with this IT Security Evaluation Scorecard With Suspended Services Instance Graphics PDF. Use them to share invaluable insights on Send Ports Alarms, Host Instance Orchestration, Receive Location Data and impress your audience. This template can be altered and modified as per your expectations. So, grab it now.
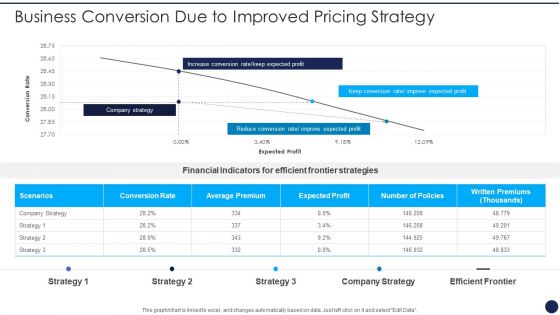
Product Pricing Strategies Analysis Business Conversion Due To Improved Pricing Strategy Slides PDF
This graph or chart is linked to excel, and changes automatically based on data. Just left click on it and select Edit Data. Deliver an awe inspiring pitch with this creative Product Pricing Strategies Analysis Business Conversion Due To Improved Pricing Strategy Slides PDF bundle. Topics like Increase Conversion Rate, Keep Expected Profit, Reduce Conversion Rate, Improve Expected Profit can be discussed with this completely editable template. It is available for immediate download depending on the needs and requirements of the user.
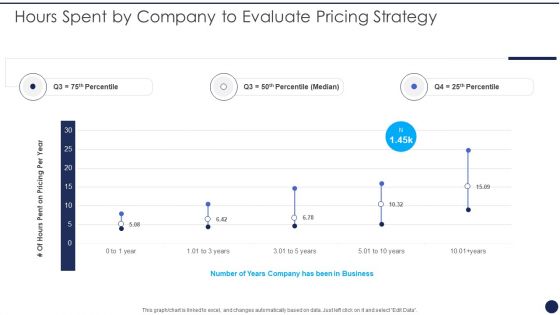
Product Pricing Strategies Analysis Hours Spent By Company To Evaluate Pricing Strategy Professional PDF
This graph or chart is linked to excel, and changes automatically based on data. Just left click on it and select Edit Data. Deliver an awe inspiring pitch with this creative Product Pricing Strategies Analysis Hours Spent By Company To Evaluate Pricing Strategy Professional PDF bundle. Topics like Pricing Per Year, Number Years Business can be discussed with this completely editable template. It is available for immediate download depending on the needs and requirements of the user.
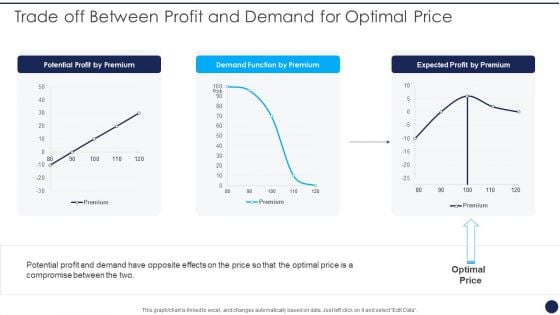
Product Pricing Strategies Analysis Trade Off Between Profit And Demand For Optimal Price Portrait PDF
This graph or chart is linked to excel, and changes automatically based on data. Just left click on it and select Edit Data. Deliver and pitch your topic in the best possible manner with this Product Pricing Strategies Analysis Trade Off Between Profit And Demand For Optimal Price Portrait PDF. Use them to share invaluable insights on Potential Profit Premium, Demand Function Premium and impress your audience. This template can be altered and modified as per your expectations. So, grab it now.
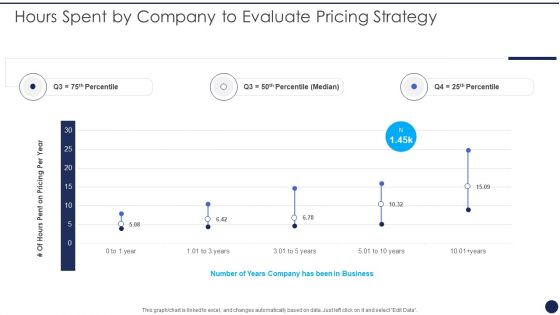
Hours Spent By Company To Evaluate Pricing Strategy Product Pricing Strategies Analysis Themes PDF
This graph or chart is linked to excel, and changes automatically based on data. Just left click on it and select Edit Data. Deliver and pitch your topic in the best possible manner with this Hours Spent By Company To Evaluate Pricing Strategy Product Pricing Strategies Analysis Themes PDF. Use them to share invaluable insights on Pricing Per Year, Number Years Business and impress your audience. This template can be altered and modified as per your expectations. So, grab it now.
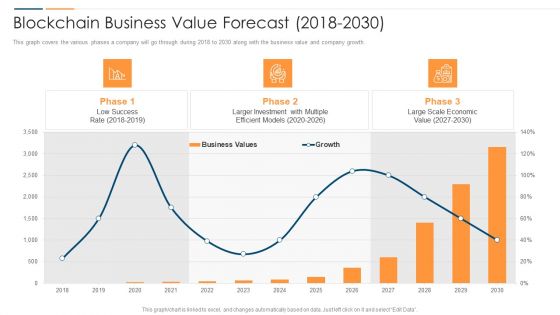
Revolution In Online Business Blockchain Business Value Forecast 2018 To 2030 Designs PDF
This graph covers the various phases a company will go through during 2018 to 2030 along with the business value and company growth. Deliver an awe inspiring pitch with this creative Revolution In Online Business Blockchain Business Value Forecast 2018 To 2030 Designs PDF bundle. Topics like Low Success Rate, Larger Investment Multiple, Large Scale Economic, 2017 To 2030 can be discussed with this completely editable template. It is available for immediate download depending on the needs and requirements of the user.
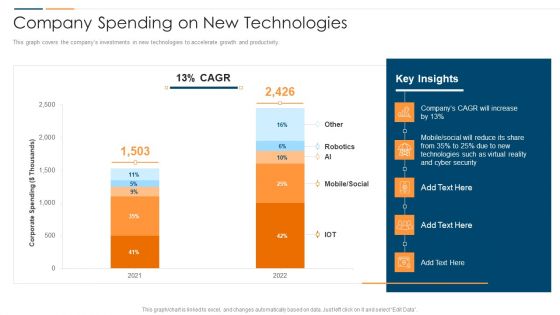
Revolution In Online Business Company Spending On New Technologies Mockup PDF
This graph covers the companys investments in new technologies to accelerate growth and productivity. Deliver an awe inspiring pitch with this creative Revolution In Online Business Company Spending On New Technologies Mockup PDF bundle. Topics like Corporate Spending Thousands, Mobile Social Robotics, 2021 To 2022 can be discussed with this completely editable template. It is available for immediate download depending on the needs and requirements of the user.
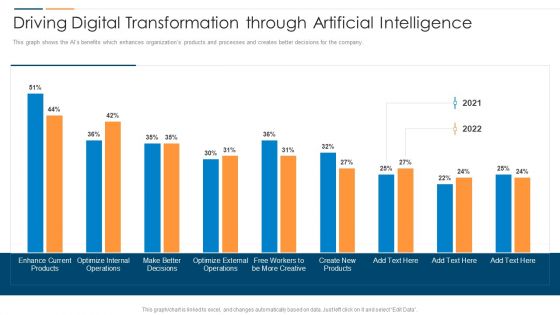
Revolution In Online Business Driving Digital Transformation Through Artificial Intelligence Template PDF
This graph shows the AIs benefits which enhances organizations products and processes and creates better decisions for the company. Deliver and pitch your topic in the best possible manner with this Revolution In Online Business Driving Digital Transformation Through Artificial Intelligence Template PDF. Use them to share invaluable insights on Enhance Current Products, Optimize Internal Operations, Make Better Decisions and impress your audience. This template can be altered and modified as per your expectations. So, grab it now.
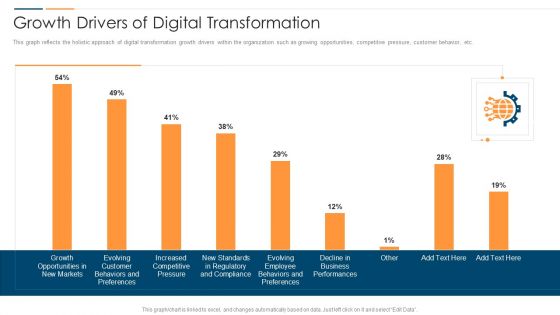
Revolution In Online Business Growth Drivers Of Digital Transformation Pictures PDF
This graph reflects the holistic approach of digital transformation growth drivers within the organization such as growing opportunities, competitive pressure, customer behavior, etc. Deliver an awe inspiring pitch with this creative Revolution In Online Business Growth Drivers Of Digital Transformation Pictures PDF bundle. Topics like Increased Competitive Pressure, Decline Business Performances, Evolving Employee Behaviors can be discussed with this completely editable template. It is available for immediate download depending on the needs and requirements of the user.


 Continue with Email

 Home
Home


