Graph
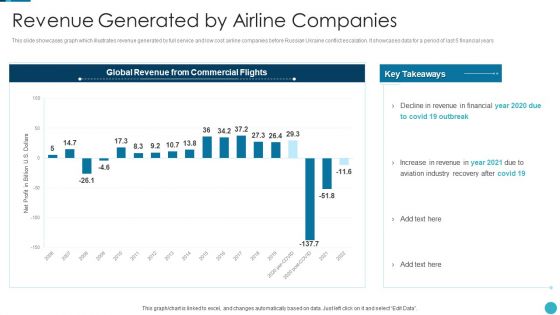
Russia Ukraine War Influence On Airline Sector Revenue Generated By Airline Companies Guidelines PDF
This slide showcases graph which illustrates revenue generated by full service and low cost airline companies before Russian Ukraine conflict escalation. It showcases data for a period of last 5 financial years Deliver an awe inspiring pitch with this creative russia ukraine war influence on airline sector revenue generated by airline companies guidelines pdf bundle. Topics like revenue generated by airline companies can be discussed with this completely editable template. It is available for immediate download depending on the needs and requirements of the user.
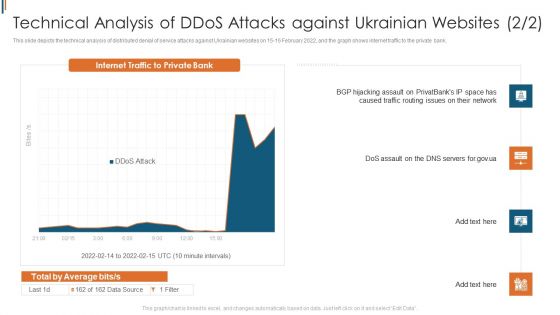
Ukraine Cyberwarfare Technical Analysis Of Ddos Attacks Against Ukrainian Hijacking Pictures Pdf
This slide depicts the technical analysis of distributed denial of service attacks against Ukrainian websites on 15 16 February 2022, and the graph shows internet traffic to the private bank. Deliver an awe inspiring pitch with this creative ukraine cyberwarfare technical analysis of ddos attacks against ukrainian hijacking pictures pdf bundle. Topics like bgp hijacking assault on privatbanks, traffic routing issues on their network, dos assault on the dns servers for gov ua can be discussed with this completely editable template. It is available for immediate download depending on the needs and requirements of the user.
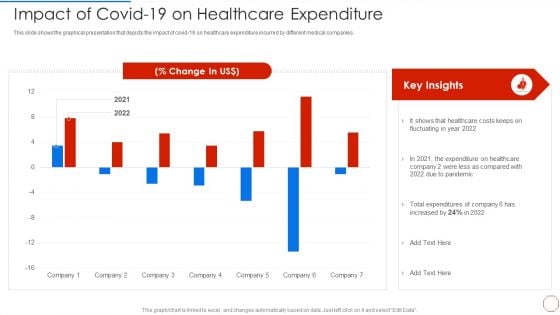
Minimizing Operational Cost Through Iot Virtual Twins Implementation Impact Of Covid 19 On Healthcare Microsoft PDF
This slide shows the graph that represents the impact of Covid 19 on GDP and supply chain industry which depicts the quarterly percentage change in growth of GDP and trade. Deliver and pitch your topic in the best possible manner with this minimizing operational cost through iot virtual twins implementation impact of covid 19 on healthcare microsoft pdf. Use them to share invaluable insights on costs, pandemic, expenditures and impress your audience. This template can be altered and modified as per your expectations. So, grab it now.
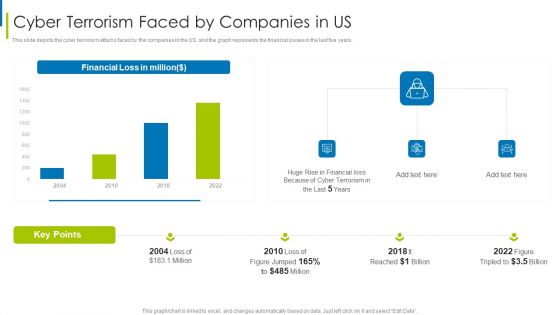
Cyber Terrorism Assault Cyber Terrorism Faced By Companies In US Mockup PDF
This slide depicts the cyber terrorism attacks faced by the companies in the US, and the graph represents the financial losses in the last five years. Deliver and pitch your topic in the best possible manner with this cyber terrorism assault cyber terrorism faced by companies in us mockup pdf Use them to share invaluable insights on Consequences Of Cyber Attacks, Response Planning, Recovery Strategies and impress your audience. This template can be altered and modified as per your expectations. So, grab it now.
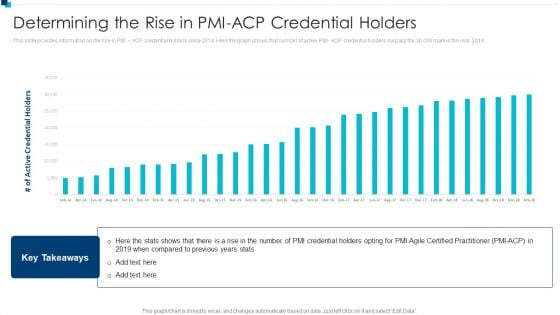
PMI Agile Certification Program IT Determining The Rise In PMI-ACP Credential Holders Guidelines PDF
This slide provides information on the rise in PMI ACP credential holders since 2014. Here the graph shows that number of active PMI- ACP credential holders surpass the 30,000 mark in the year 2019.Deliver and pitch your topic in the best possible manner with this pmi agile certification program it determining the rise in pmi-acp credential holders guidelines pdf Use them to share invaluable insights on determining the rise in pmi acp credential holders and impress your audience. This template can be altered and modified as per your expectations. So, grab it now.
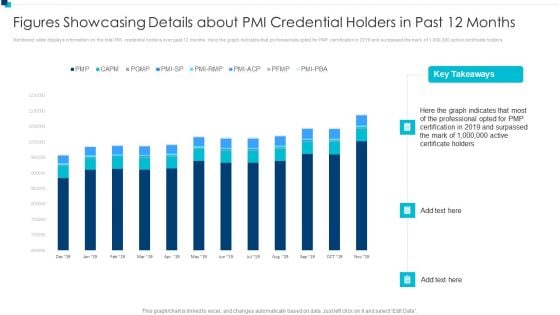
PMI Agile Certification Program IT Figures Showcasing Details About PMI Credential Holders Clipart PDF
Mentioned slide displays information on the total PMI credential holders over past 12 months. Here the graph indicates that professionals opted for PMP certification in 2019 and surpassed the mark of 1,000,000 active certificate holders.Deliver an awe inspiring pitch with this creative pmi agile certification program it figures showcasing details about pmi credential holders clipart pdf bundle. Topics like figures showcasing details about pmi credential holders in past 12 months can be discussed with this completely editable template. It is available for immediate download depending on the needs and requirements of the user.
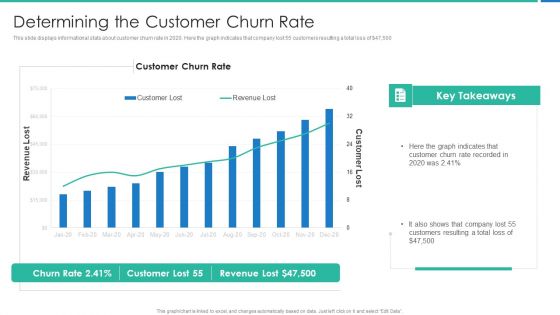
Strong Business Partnership To Ensure Company Success Determining The Customer Churn Rate Elements PDF
This slide displays informational stats about customer churn rate in 2020. Here the graph indicates that company lost 55 customers resulting a total loss of dollar 47,500 Deliver and pitch your topic in the best possible manner with this strong business partnership to ensure company success determining the customer churn rate elements pdf Use them to share invaluable insights on determining the customer churn rate and impress your audience. This template can be altered and modified as per your expectations. So, grab it now.
M Banking System Improving Consumer Mobile Subscribers Projection And Tele Density Growth Icons PDF
Mentioned slide shows informational stats about mobile subscribers and tele density growth for five years. The graph depicts that Total mobile subscription for MFS will get increased by 84 percent in 2026. Deliver an awe inspiring pitch with this creative m banking system improving consumer mobile subscribers projection and tele density growth icons pdf bundle. Topics like rural teledensity, urban teledensity, total mobile subscribers, mobile teledensity, 2021 to 2024 can be discussed with this completely editable template. It is available for immediate download depending on the needs and requirements of the user.
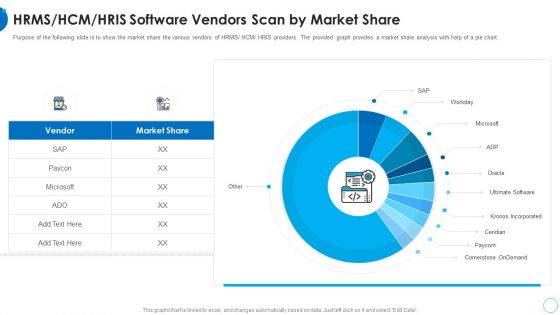
RMS HCM HRIS Software Vendors Scan By Market Share HR Change Management Tools Introduction PDF
Purpose of the following slide is to show the market share the various vendors of HRMS or HCM or HRIS providers. The provided graph provides a market share analysis with help of a pie chart. Deliver and pitch your topic in the best possible manner with this rms hcm hris software vendors scan by market share hr change management tools introduction pdf. Use them to share invaluable insights on hrms or hcm or hris software vendors scan by market share and impress your audience. This template can be altered and modified as per your expectations. So, grab it now.
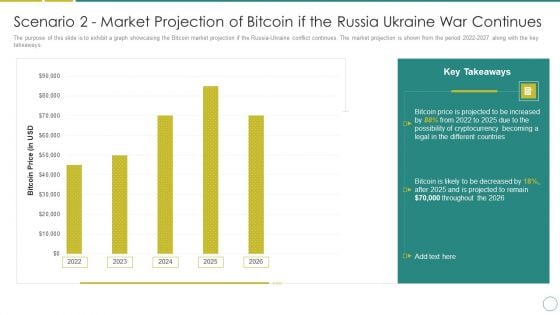
Russia Ukraine Scenario 2 Market Projection Of Bitcoin If The Russia Ukraine War Continues Brochure PDF
The purpose of this slide is to exhibit a graph showcasing the Bitcoin market projection if the Russia-Ukraine conflict continues. The market projection is shown from the period 2022-2027 along with the key takeaways. Deliver and pitch your topic in the best possible manner with this russia ukraine scenario 2 market projection of bitcoin if the russia ukraine war continues brochure pdf. Use them to share invaluable insights on bitcoin price, 2022 to 2026 and impress your audience. This template can be altered and modified as per your expectations. So, grab it now.
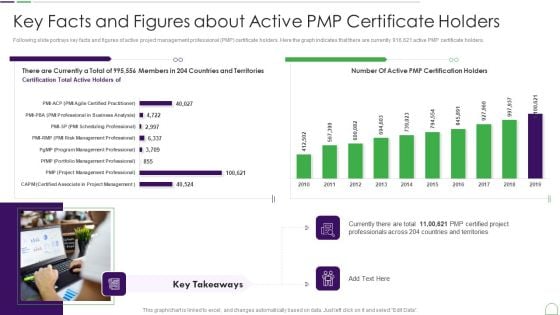
Project Management Professional Guide IT Key Facts And Figures About Active PMP Certificate Holders Brochure PDF
Following slide portrays key facts and figures of active project management professional PMP certificate holders. Here the graph indicates that there are currently 916,621 active PMP certificate holders.Deliver an awe inspiring pitch with this creative project management professional guide it key facts and figures about active pmp certificate holders brochure pdf bundle. Topics like key facts and figures about active pmp certificate holders can be discussed with this completely editable template. It is available for immediate download depending on the needs and requirements of the user.
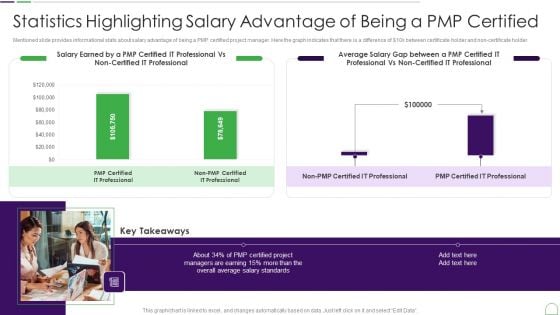
Project Management Professional Guide IT Statistics Highlighting Salary Advantage Portrait PDF
Mentioned slide provides informational stats about salary advantage of being a PMP certified project manager. Here the graph indicates that there is a difference of dollar10k between certificate holder and non certificate holder.Deliver and pitch your topic in the best possible manner with this project management professional guide it statistics highlighting salary advantage portrait pdf Use them to share invaluable insights on statistics highlighting salary advantage of being a pmp certified and impress your audience. This template can be altered and modified as per your expectations. So, grab it now.
Project Management Professional Guide IT Stats Showing Number Of Job Opportunities Icons PDF
This slide provides informational statistics about number of job opportunities for project manager roles by the year 2020. Here the graph indicates that most of the job opportunities for PM role will be in China.Deliver an awe inspiring pitch with this creative project management professional guide it stats showing number of job opportunities icons pdf bundle. Topics like stats showing number of job opportunities for project manager roles by 2020 can be discussed with this completely editable template. It is available for immediate download depending on the needs and requirements of the user.
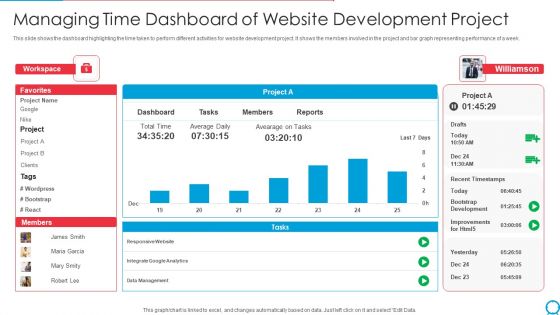
Managing Time Dashboard Of Website Development Project Ppt PowerPoint Presentation Gallery Outline PDF
This slide shows the dashboard highlighting the time taken to perform different activities for website development project. It shows the members involved in the project and bar graph representing performance of a week. Showcasing this set of slides titled managing time dashboard of website development project ppt powerpoint presentation gallery outline pdf. The topics addressed in these templates are workspace, project, data management, recent timestamps. All the content presented in this PPT design is completely editable. Download it and make adjustments in color, background, font etc. as per your unique business setting.
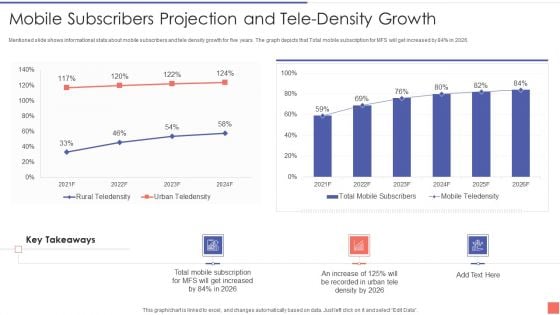
Providing Electronic Financial Services To Existing Consumers Mobile Subscribers Projection Demonstration PDF
Mentioned slide shows informational stats about mobile subscribers and tele density growth for five years. The graph depicts that Total mobile subscription for MFS will get increased by 84 percentage in 2026. Deliver an awe inspiring pitch with this creative Providing Electronic Financial Services To Existing Consumers Mobile Subscribers Projection Demonstration PDF bundle. Topics like Mobile Subscribers Projection And Tele Density Growth can be discussed with this completely editable template. It is available for immediate download depending on the needs and requirements of the user.
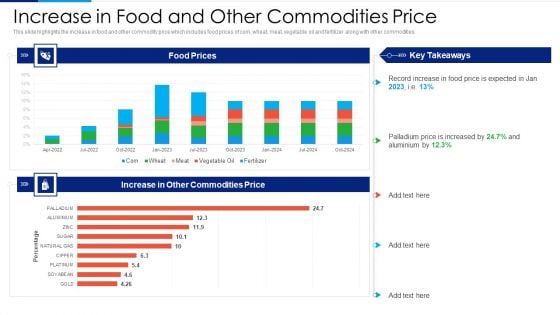
Russia Ukraine Conflict Effect Increase In Food And Other Commodities Price Pictures PDF
This slide highlights the global inflation rises and weakens in global GDP which includes line graph with two scenarios highlighting if disruption is limited and if the military conflict is lengthy. Deliver and pitch your topic in the best possible manner with this Russia Ukraine Conflict Effect Increase In Food And Other Commodities Price Pictures PDF. Use them to share invaluable insights on Global Inflation Rises, Global GDP Weakens, Feb Baseline, Limited Disruption and impress your audience. This template can be altered and modified as per your expectations. So, grab it now.
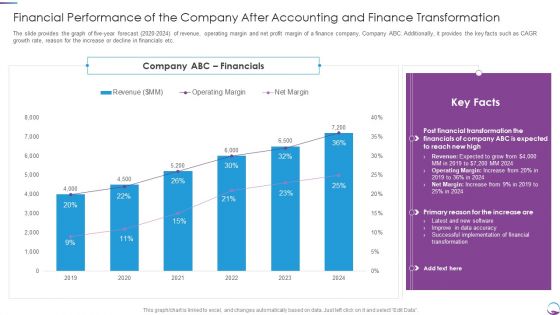
Financial Performance Of The Company After Accounting And Finance Transformation Mockup PDF
The slide provides the graph of five year forecast 2020 to 2024 of revenue, operating margin and net profit margin of a finance company, Company ABC. Additionally, it provides the key facts such as CAGR growth rate, reason for the increase or decline in financials etc. Deliver and pitch your topic in the best possible manner with this Financial Performance Of The Company After Accounting And Finance Transformation Mockup PDF. Use them to share invaluable insights on Financial, Revenue, Margin, Implementation and impress your audience. This template can be altered and modified as per your expectations. So, grab it now.
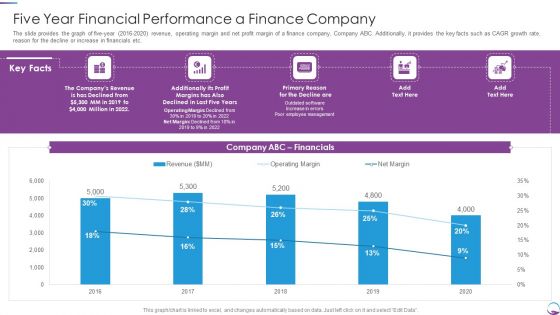
Five Year Financial Performance A Finance Company Slides PDF
The slide provides the graph of five year 2016 to 2020 revenue, operating margin and net profit margin of a finance company, Company ABC. Additionally, it provides the key facts such as CAGR growth rate, reason for the decline or increase in financials etc. Deliver and pitch your topic in the best possible manner with this Five Year Financial Performance A Finance Company Slides PDF. Use them to share invaluable insights on Five Year Financial Performance A Finance Company and impress your audience. This template can be altered and modified as per your expectations. So, grab it now.
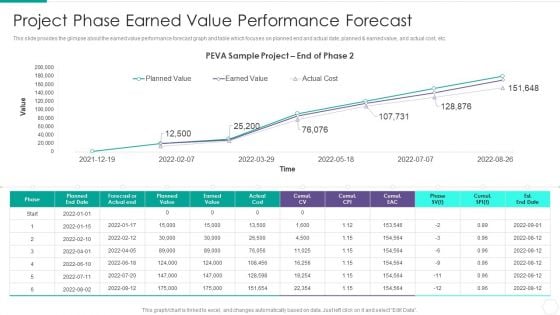
Quantitative Risk Assessment Project Phase Earned Value Performance Forecast Microsoft PDF
This slide provides the glimpse about the earned value performance forecast graph and table which focuses on planned end and actual date, planned and earned value, and actual cost, etc. Deliver and pitch your topic in the best possible manner with this Quantitative Risk Assessment Project Phase Earned Value Performance Forecast Microsoft PDF. Use them to share invaluable insights on Project Phase Earned Value Performance Forecast and impress your audience. This template can be altered and modified as per your expectations. So, grab it now.
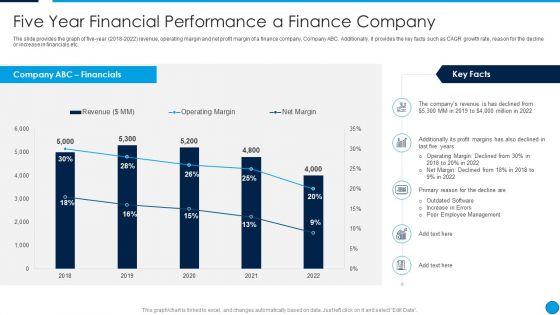
Summary Financial Five Year Financial Performance A Finance Company Themes PDF
The slide provides the graph of five-year 2018 to 2022 revenue, operating margin and net profit margin of a finance company, Company ABC. Additionally, it provides the key facts such as CAGR growth rate, reason for the decline or increase in financials etc. Deliver and pitch your topic in the best possible manner with this Summary Financial Five Year Financial Performance A Finance Company Themes PDF. Use them to share invaluable insights on Revenue, Operating Margin, Net Margin, 2018 To 2022 and impress your audience. This template can be altered and modified as per your expectations. So, grab it now.
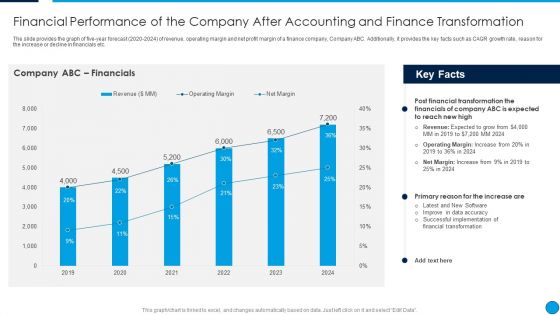
Summary Financial Performance Of The Company After Accounting And Finance Ideas PDF
The slide provides the graph of five-year forecast 2020 to 2024 of revenue, operating margin and net profit margin of a finance company, Company ABC. Additionally, it provides the key facts such as CAGR growth rate, reason for the increase or decline in financials etc. Deliver and pitch your topic in the best possible manner with this Summary Financial Performance Of The Company After Accounting And Finance Ideas PDF. Use them to share invaluable insights on Financials, Revenue, Operating Margin, Net Margin, 2019 To 2024 and impress your audience. This template can be altered and modified as per your expectations. So, grab it now.
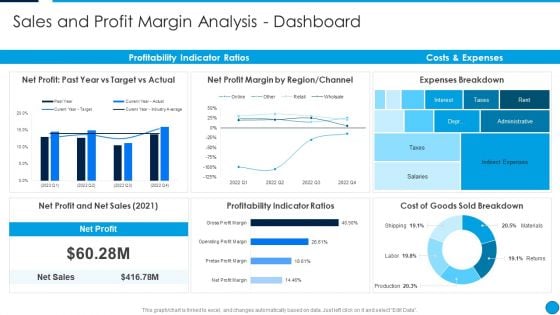
Summary Financial Sales And Profit Margin Analysis Dashboard Pictures PDF
This graph or chart is linked to excel, and changes automatically based on data. Just left click on it and select Edit Data. Deliver an awe inspiring pitch with this creative Summary Financial Sales And Profit Margin Analysis Dashboard Pictures PDF bundle. Topics like Net Profit, Past Year Vs Target Vs Actual, Net Profit Margin By Region, Channel, Expenses Breakdown, Costs And Expenses, Profitability Indicator Ratios can be discussed with this completely editable template. It is available for immediate download depending on the needs and requirements of the user.
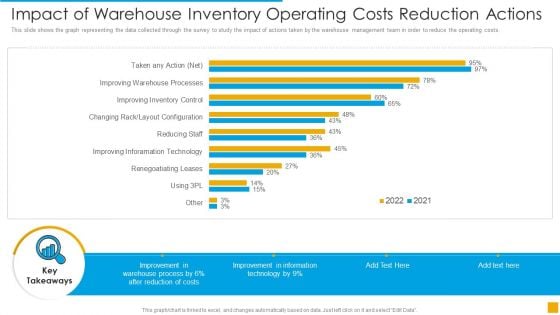
Impact Of Warehouse Inventory Operating Costs Reduction Actions Sample PDF
This slide shows the graph representing the data collected through the survey to study the impact of actions taken by the warehouse management team in order to reduce the operating costs Showcasing this set of slides titled Impact Of Warehouse Inventory Operating Costs Reduction Actions Sample PDF. The topics addressed in these templates are Information, Technology, Cost. All the content presented in this PPT design is completely editable. Download it and make adjustments in color, background, font etc. as per your unique business setting.
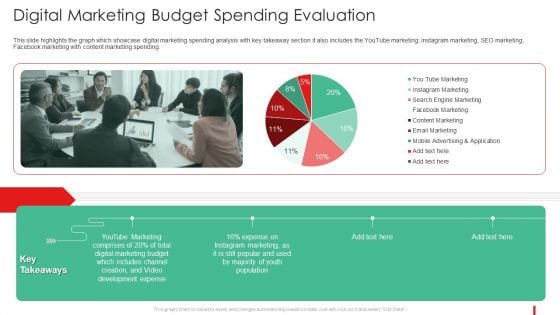
Promotion Guide To Advertise Brand On Youtube Digital Marketing Budget Spending Pictures PDF
This slide highlights the graph which showcase digital marketing spending analysis with key takeaway section it also includes the YouTube marketing, Instagram marketing, SEO marketing, Facebook marketing with content marketing spending.Deliver and pitch your topic in the best possible manner with this Promotion Guide To Advertise Brand On Youtube Digital Marketing Budget Spending Pictures PDF Use them to share invaluable insights on Digital Marketing Budget Spending Evaluation and impress your audience. This template can be altered and modified as per your expectations. So, grab it now.
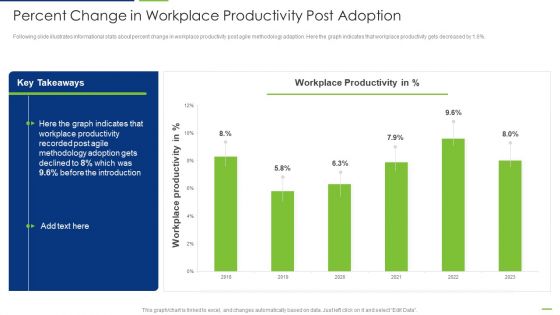
Professional Scrum Master Percent Change In Workplace Productivity Post Adoption Summary PDF
Following slide illustrates informational stats about percent change in workplace productivity post agile methodology adaption. Here the graph indicates that workplace productivity gets decreased by 1.6 percent. Deliver and pitch your topic in the best possible manner with this Professional Scrum Master Percent Change In Workplace Productivity Post Adoption Summary PDF. Use them to share invaluable insights on Workplace Productivity, 2018 To 2023, Agile Methodology and impress your audience. This template can be altered and modified as per your expectations. So, grab it now.
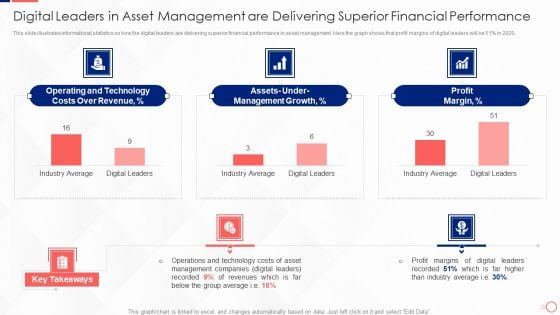
Digital Leaders In Asset Management Are Delivering Superior Financial Performance Structure PDF
This slide illustrates informational statistics on how the digital leaders are delivering superior financial performance in asset management. Here the graph shows that profit margins of digital leaders will be 51 percent in 2020. Deliver an awe inspiring pitch with this creative Digital Leaders In Asset Management Are Delivering Superior Financial Performance Structure PDF bundle. Topics like Operating And Technology, Management Growth, Profit Margin can be discussed with this completely editable template. It is available for immediate download depending on the needs and requirements of the user.
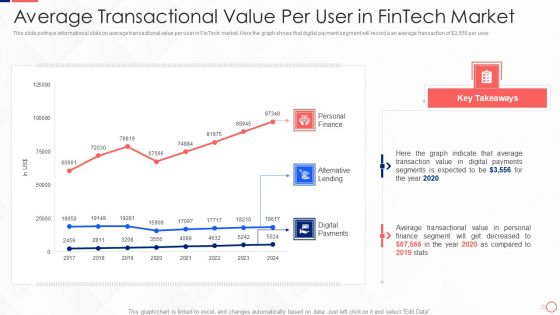
Investing In Tech Innovation Average Transactional Value Per User In Fintech Market Graphics PDF
This slide portrays informational stats on average transactional value per user in FinTech market. Here the graph shows that digital payment segment will record a an average transaction of Dollar 3,556 per user. Deliver and pitch your topic in the best possible manner with this Investing In Tech Innovation Average Transactional Value Per User In Fintech Market Graphics PDF. Use them to share invaluable insights on Personal Finance, Alternative Lending, Digital Payments and impress your audience. This template can be altered and modified as per your expectations. So, grab it now.
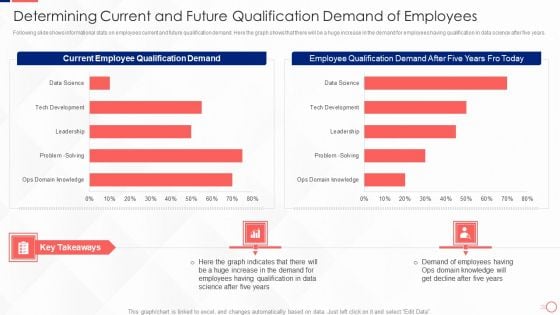
Investing In Tech Innovation Determining Current And Future Qualification Demand Graphics PDF
Following slide shows informational stats on employees current and future qualification demand. Here the graph shows that there will be a huge increase in the demand for employees having qualification in data science after five years. Deliver an awe inspiring pitch with this creative Investing In Tech Innovation Determining Current And Future Qualification Demand Graphics PDF bundle. Topics like Current Employee Qualification Demand, Employee Qualification, Demand After Five Years can be discussed with this completely editable template. It is available for immediate download depending on the needs and requirements of the user.
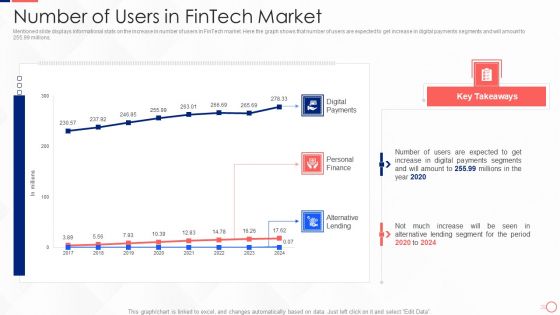
Investing In Tech Innovation Number Of Users In Fintech Market Pictures PDF
Mentioned slide displays informational stats on the increase in number of users in FinTech market. Here the graph shows that number of users are expected to get increase in digital payments segments and will amount to 255.99 millions. Deliver an awe inspiring pitch with this creative Investing In Tech Innovation Number Of Users In Fintech Market Pictures PDF bundle. Topics like Digital Payments, Personal Finance, Alternative Lending can be discussed with this completely editable template. It is available for immediate download depending on the needs and requirements of the user.
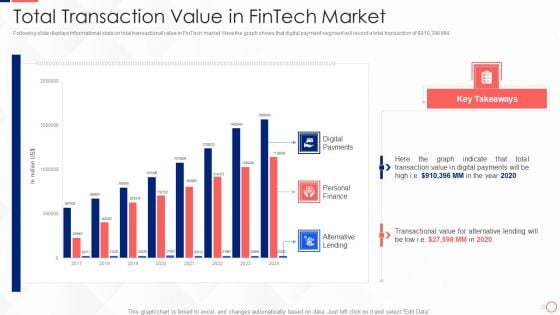
Investing In Tech Innovation Total Transaction Value In Fintech Market Mockup PDF
Following slide displays informational stats on total transactional value in FinTech market. Here the graph shows that digital payment segment will record a total transaction of Dollar 910,396 MM. Deliver an awe inspiring pitch with this creative Investing In Tech Innovation Total Transaction Value In Fintech Market Mockup PDF bundle. Topics like Digital Payments, Personal Finance, Alternative Lending, 2017 To 2024 can be discussed with this completely editable template. It is available for immediate download depending on the needs and requirements of the user.
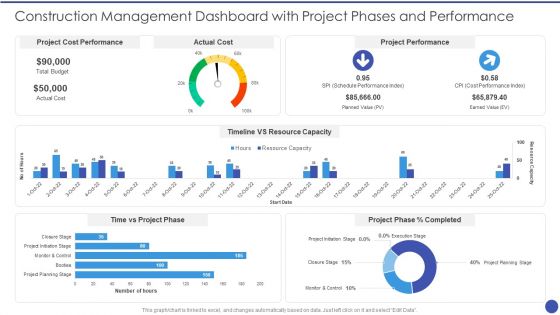
Construction Management Dashboard With Project Phases And Performance Inspiration PDF
This graph for chart is linked to excel, and changes automatically based on data. Just left click on it and select Edit Data. Deliver and pitch your topic in the best possible manner with this Construction Management Dashboard With Project Phases And Performance Inspiration PDF. Use them to share invaluable insights on Project Cost Performance, Actual Cost, Project Performance, Timeline VS Resource Capacity, Time vs Project Phase and impress your audience. This template can be altered and modified as per your expectations. So, grab it now.
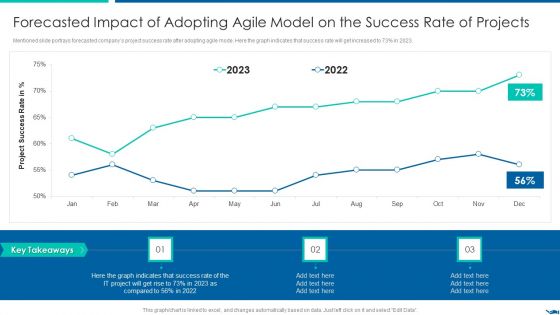
Project QA Through Agile Methodology IT Forecasted Impact Of Adopting Agile Model Microsoft PDF
Mentioned slide portrays forecasted companys project success rate after adopting agile mode. Here the graph indicates that success rate will get increased to 73percent in 2023.Deliver an awe inspiring pitch with this creative Project QA Through Agile Methodology IT Forecasted Impact Of Adopting Agile Model Microsoft PDF bundle. Topics like Forecasted Impact Of Adopting Agile Model On The Success Rate Of Projects can be discussed with this completely editable template. It is available for immediate download depending on the needs and requirements of the user.
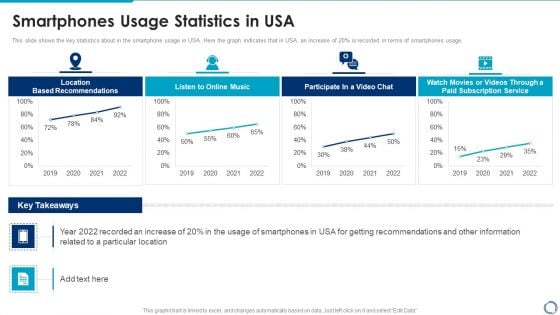
Location And Navigation Smartphones Usage Statistics In Usa Demonstration PDF
This slide shows the key statistics about in the smartphone usage in USA. Here the graph indicates that in USA, an increase of 20 percent is recorded in terms of smartphones usage. Deliver an awe inspiring pitch with this creative Location And Navigation Smartphones Usage Statistics In Usa Demonstration PDF bundle. Topics like Location Based Recommendations, Listen to Online Music, Participate In a Video Chat can be discussed with this completely editable template. It is available for immediate download depending on the needs and requirements of the user.
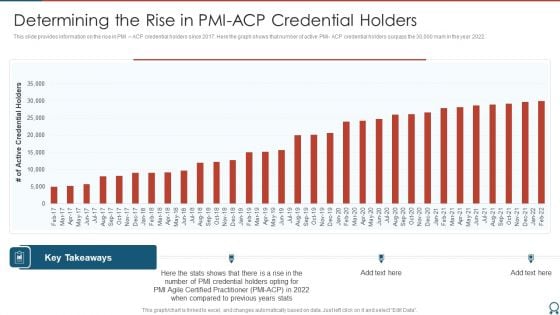
Agile Certified Professional Determining The Rise In PMI ACP Credential Holders Inspiration PDF
This slide provides information on the rise in PMI ACP credential holders since 2017. Here the graph shows that number of active PMI ACP credential holders surpass the 30,000 mark in the year 2022. Deliver an awe inspiring pitch with this creative Agile Certified Professional Determining The Rise In PMI ACP Credential Holders Inspiration PDF bundle. Topics like PMI Credential Holders, Determining Rise, PMI ACP Credential Holders can be discussed with this completely editable template. It is available for immediate download depending on the needs and requirements of the user.
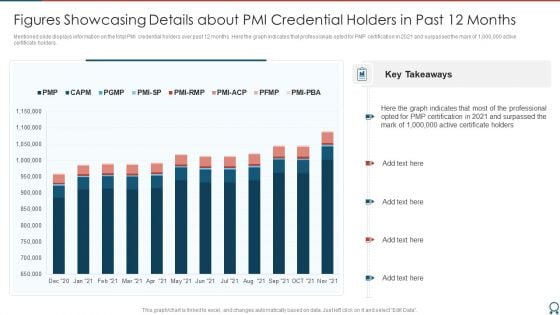
Agile Certified Professional Figures Showcasing Details About PMI Credential Holders Professional PDF
Mentioned slide displays information on the total PMI credential holders over past 12 months. Here the graph indicates that professionals opted for PMP certification in 2021 and surpassed the mark of 1,000,000 active certificate holders. Deliver an awe inspiring pitch with this creative Agile Certified Professional Figures Showcasing Details About PMI Credential Holders Professional PDF bundle. Topics like Certificate Holders, PMP Certification can be discussed with this completely editable template. It is available for immediate download depending on the needs and requirements of the user.
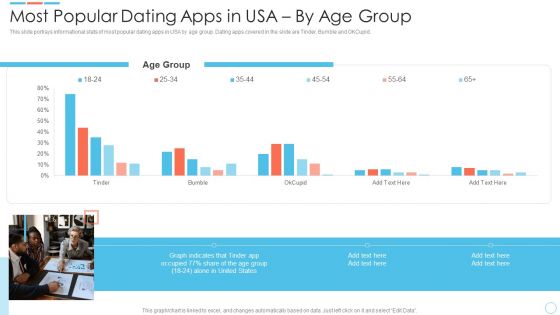
Elevator Online Dating Software Most Popular Dating Apps In USA By Age Group Introduction PDF
Elevator Online Dating Software Most Popular Dating Apps In USA By Audience Ideas PDFThis slide portrays informational stats of most popular dating apps in USA by age group. Dating apps covered in the slide are Tinder, Bumble and OKCupid. Deliver and pitch your topic in the best possible manner with this Elevator Online Dating Software Most Popular Dating Apps In USA By Age Group Introduction PDF. Use them to share invaluable insights on Age Group, Graph indicates and impress your audience. This template can be altered and modified as per your expectations. So, grab it now.
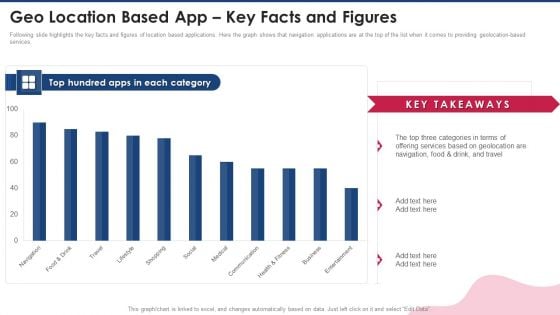
Capital Raising Pitch Presentation Geo Location Based App Key Facts And Figures Graphics PDF
Following slide highlights the key facts and figures of location based applications. Here the graph shows that navigation applications are at the top of the list when it comes to providing geolocation-based services. Deliver an awe inspiring pitch with this creative Capital Raising Pitch Presentation Geo Location Based App Key Facts And Figures Graphics PDF bundle. Topics like Top Hundred Apps Each Category, Geolocation, Health And Fitness, Business, Communication can be discussed with this completely editable template. It is available for immediate download depending on the needs and requirements of the user.
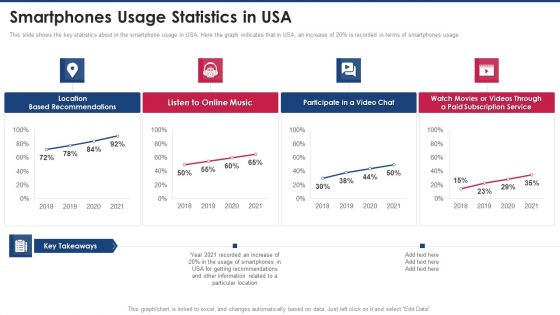
Capital Raising Pitch Presentation Smartphones Usage Statistics In USA Pictures PDF
This slide shows the key statistics about in the smartphone usage in USA. Here the graph indicates that in USA, an increase of 20 percent is recorded in terms of smartphones usage. Deliver an awe inspiring pitch with this creative Capital Raising Pitch Presentation Smartphones Usage Statistics In USA Pictures PDF bundle. Topics like Location, Based Recommendations, Listen To Online Music, Participate Video Chat, 2018 To 2021 can be discussed with this completely editable template. It is available for immediate download depending on the needs and requirements of the user.
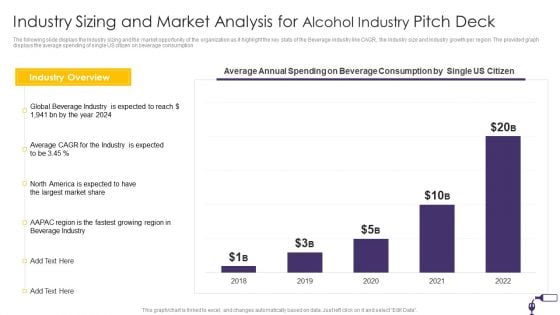
Industry Sizing And Market Analysis For Alcohol Industry Pitch Deck Formats PDF
The following slide displays the Industry sizing and the market opportunity of the organization as it highlight the key stats of the Beverage industry like CAGR, the Industry size and Industry growth per region. The provided graph displays the average spending of single US citizen on beverage consumption. Deliver and pitch your topic in the best possible manner with this Industry Sizing And Market Analysis For Alcohol Industry Pitch Deck Formats PDF. Use them to share invaluable insights on Industry Overview, Average Annual Spending, Beverage Consumption, 2018 To 2022 and impress your audience. This template can be altered and modified as per your expectations. So, grab it now.
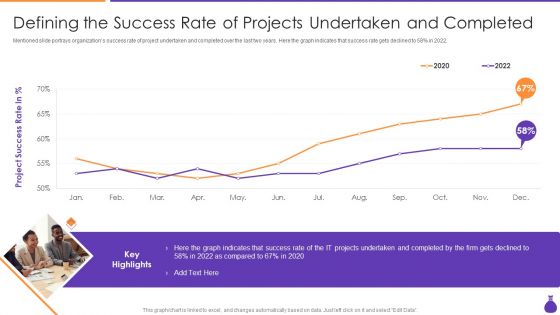
Why Is Agile Cost Effective IT Defining The Success Rate Of Projects Undertaken Mockup PDF
Mentioned slide portrays organizations success rate of project undertaken and completed over the last two years. Here the graph indicates that success rate gets declined to 58 percent in 2022. Deliver an awe inspiring pitch with this creative Why Is Agile Cost Effective IT Defining The Success Rate Of Projects Undertaken Mockup PDF bundle. Topics like Project Success Rate, IT Projects, 2020 To 2022 can be discussed with this completely editable template. It is available for immediate download depending on the needs and requirements of the user.
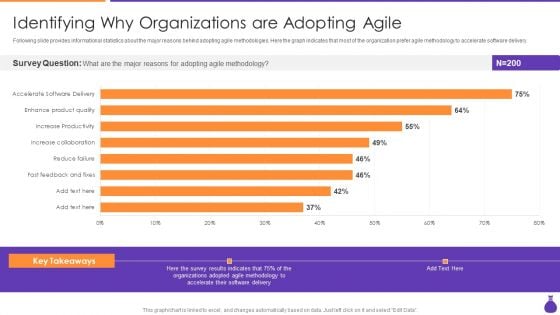
Why Is Agile Cost Effective IT Dentifying Why Organizations Are Adopting Agile Guidelines PDF
Following slide provides informational statistics about the major reasons behind adopting agile methodologies. Here the graph indicates that most of the organization prefer agile methodology to accelerate software delivery. Deliver an awe inspiring pitch with this creative Why Is Agile Cost Effective IT Dentifying Why Organizations Are Adopting Agile Guidelines PDF bundle. Topics like Survey Question, Adopting Agile Methodology, Fast Feedback And Fixes, Reduce Failure can be discussed with this completely editable template. It is available for immediate download depending on the needs and requirements of the user.
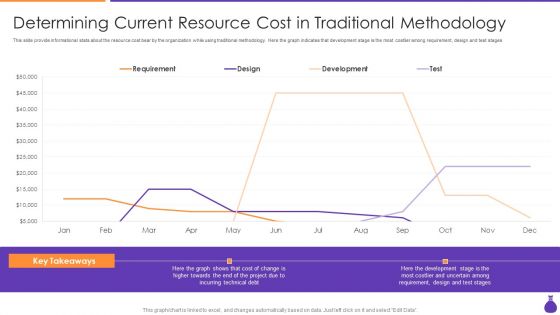
Why Is Agile Cost Effective IT Determining Current Resource Cost In Traditional Methodology Information PDF
This slide provide informational stats about the resource cost bear by the organization while using traditional methodology. Here the graph indicates that development stage is the most costlier among requirement, design and test stages. Deliver an awe inspiring pitch with this creative Why Is Agile Cost Effective IT Determining Current Resource Cost In Traditional Methodology Information PDF bundle. Topics like Requirement, Design, Development, Test can be discussed with this completely editable template. It is available for immediate download depending on the needs and requirements of the user.
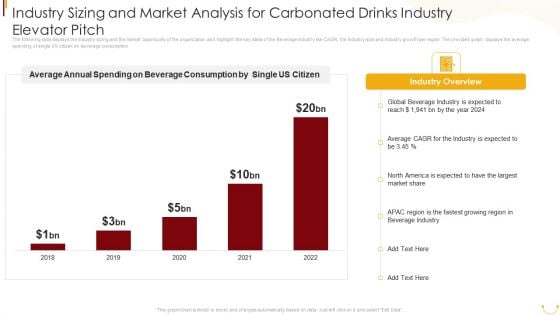
Industry Sizing And Market Analysis For Carbonated Drinks Industry Elevator Pitch Diagrams PDF
The following slide displays the Industry sizing and the market opportunity of the organization as it highlight the key stats of the Beverage industry like CAGR, the Industry size and Industry growth per region. The provided graph displays the average spending of single US citizen on beverage consumption. Deliver and pitch your topic in the best possible manner with this Industry Sizing And Market Analysis For Carbonated Drinks Industry Elevator Pitch Diagrams PDF. Use them to share invaluable insights on Average Annual Spending, Beverage Consumption, Single US Citizen, Global Beverage Industry, 2018 To 2022 and impress your audience. This template can be altered and modified as per your expectations. So, grab it now.

Monthly Cost Comparative Analysis Of Advertising Expenditure Introduction PDF
This slide represents the bar graph on marketing monthly cost comparative analysis for increasing organisation revenue. It includes methods like online, catalogues, conventions, trade shows, print, radio and magazines Pitch your topic with ease and precision using this Monthly Cost Comparative Analysis Of Advertising Expenditure Introduction PDF This layout presents information on Monthly Cost Comparative Analysis Of Advertising Expenditure It is also available for immediate download and adjustment. So, changes can be made in the color, design, graphics or any other component to create a unique layout.
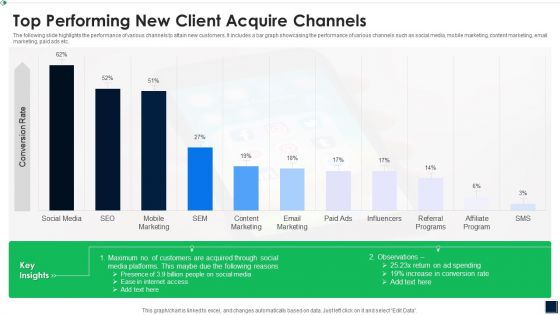
Top Performing New Client Acquire Channels Elements PDF
The following slide highlights the performance of various channels to attain new customers. It includes a bar graph showcasing the performance of various channels such as social media, mobile marketing, content marketing, email marketing, paid ads etc. Showcasing this set of slides titled Top Performing New Client Acquire Channels Elements PDF The topics addressed in these templates are Top Performing New Client Acquire Channels All the content presented in this PPT design is completely editable. Download it and make adjustments in color, background, font etc. as per your unique business setting.
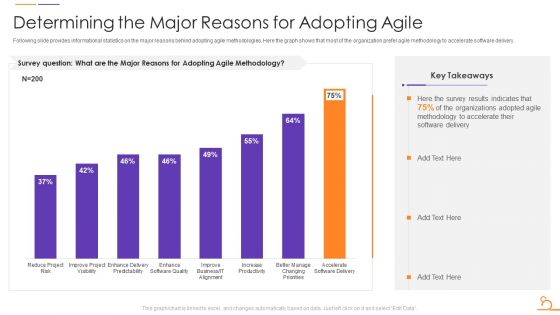
Agile Techniques For Data Migration Determining The Major Reasons For Adopting Agile Formats PDF
Following slide provides informational statistics on the major reasons behind adopting agile methodologies. Here the graph shows that most of the organization prefer agile methodology to accelerate software delivery. Deliver an awe inspiring pitch with this creative Agile Techniques For Data Migration Determining The Major Reasons For Adopting Agile Formats PDF bundle. Topics like Reduce Project Risk, Improve Project Visibility, Enhance Delivery Predictability can be discussed with this completely editable template. It is available for immediate download depending on the needs and requirements of the user.
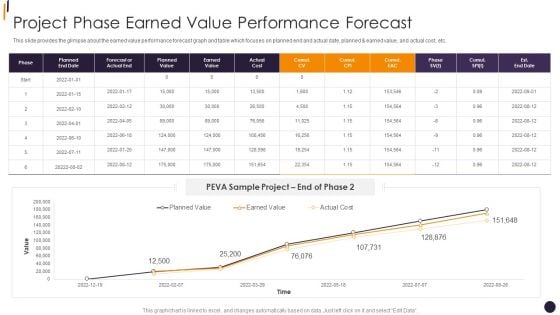
PMP Tools Project Phase Earned Value Performance Forecast Demonstration PDF
This slide provides the glimpse about the earned value performance forecast graph and table which focuses on planned end and actual date, planned and earned value, and actual cost, etc.Deliver and pitch your topic in the best possible manner with this PMP Tools Project Phase Earned Value Performance Forecast Demonstration PDF Use them to share invaluable insights on Forecast Or Actual, Earned Value, Actual Cost and impress your audience. This template can be altered and modified as per your expectations. So, grab it now.
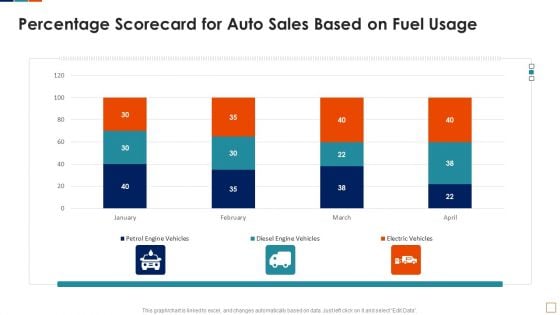
Automobile Sales Scorecard Percentage Scorecard For Auto Sales Based On Fuel Usage Graphics PDF
This graph or chart is linked to excel, and changes automatically based on data. Just left click on it and select Edit Data. Deliver and pitch your topic in the best possible manner with this Automobile Sales Scorecard Percentage Scorecard For Auto Sales Based On Fuel Usage Graphics PDF. Use them to share invaluable insights on Petrol Engine Vehicles, Diesel Engine Vehicles, Electric Vehicles Sales and impress your audience. This template can be altered and modified as per your expectations. So, grab it now.
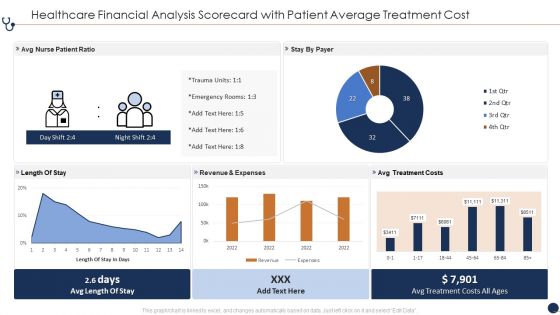
Healthcare Financial Analysis Scorecard With Patient Average Treatment Cost Ppt Infographic Template Slide Portrait PDF
This graph or chart is linked to excel, and changes automatically based on data. Just left click on it and select Edit Data. Deliver and pitch your topic in the best possible manner with this Healthcare Financial Analysis Scorecard With Patient Average Treatment Cost Ppt Infographic Template Slide Portrait PDF. Use them to share invaluable insights on Avg Nurse Patient, Revenue And Expenses, Avg Treatment Costs and impress your audience. This template can be altered and modified as per your expectations. So, grab it now.
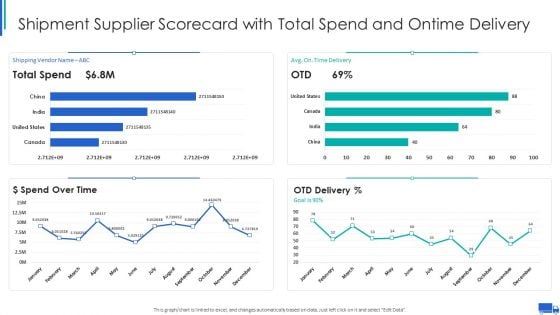
Shipment Supplier Scorecard With Total Spend And Ontime Delivery Ppt Slides Templates PDF
This graph or chart is linked to excel, and changes automatically based on data. Just left click on it and select Edit Data. Deliver and pitch your topic in the best possible manner with this Shipment Supplier Scorecard With Total Spend And Ontime Delivery Ppt Slides Templates PDF. Use them to share invaluable insights on Shipping Vendor Avg, Time Delivery Goal, Spend Over Time, OTD Delivery Percent and impress your audience. This template can be altered and modified as per your expectations. So, grab it now.
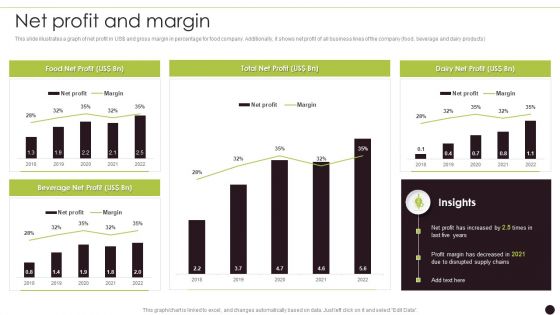
Canned Food Company Profile Net Profit And Margin Information PDF
This slide illustrates a graph of net profit in USdollar and gross margin in percentage for food company. Additionally, it shows net profit of all business lines of the company food, beverage and dairy products Deliver and pitch your topic in the best possible manner with this Canned Food Company Profile Net Profit And Margin Information PDF Use them to share invaluable insights on Net Profit, Margin and impress your audience. This template can be altered and modified as per your expectations. So, grab it now.
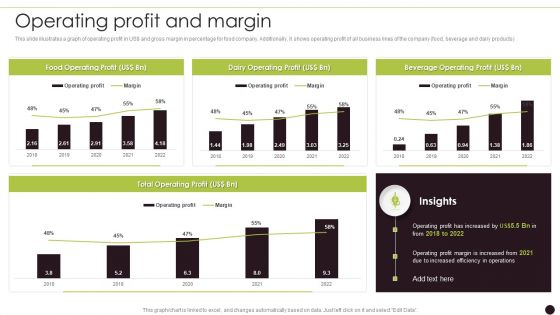
Canned Food Company Profile Operating Profit And Margin Background PDF
This slide illustrates a graph of operating profit in USdollar and gross margin in percentage for food company. Additionally, it shows operating profit of all business lines of the company food, beverage and dairy products Deliver an awe inspiring pitch with this creative Canned Food Company Profile Operating Profit And Margin Background PDF bundle. Topics like Dairy Operating, Beverage Operating , Total Operating can be discussed with this completely editable template. It is available for immediate download depending on the needs and requirements of the user.
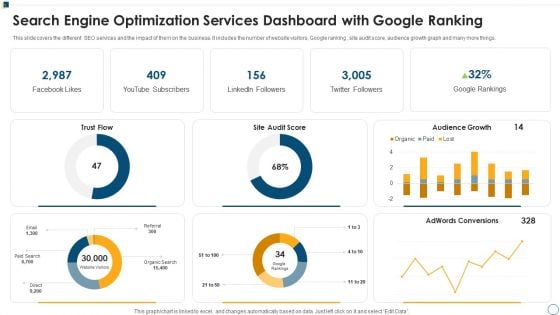
Search Engine Optimization Services Dashboard With Google Ranking Ppt Gallery Demonstration PDF
This slide covers the different SEO services and the impact of them on the business. It includes the number of website visitors, Google ranking , site audit score, audience growth graph and many more things. Pitch your topic with ease and precision using this Search Engine Optimization Services Dashboard With Google Ranking Ppt Gallery Demonstration PDF. This layout presents information on Audience Growth Paid, Adwords Conversions Score. It is also available for immediate download and adjustment. So, changes can be made in the color, design, graphics or any other component to create a unique layout.
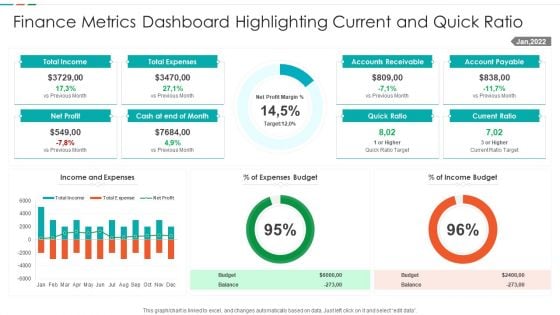
Finance Metrics Dashboard Highlighting Current And Quick Ratio Template PDF
This graph or chart is linked to excel, and changes automatically based on data. Just left click on it and select edit data. Showcasing this set of slides titled Finance Metrics Dashboard Highlighting Current And Quick Ratio Template PDF. The topics addressed in these templates are Total Income Budget, Total Expenses Balance, Net Profit Quick, Ratio Current Ratio. All the content presented in this PPT design is completely editable. Download it and make adjustments in color, background, font etc. as per your unique business setting.
Finance Metrics Dashboard Illustrating Account Payables Icons PDF
This graph or chart is linked to excel, and changes automatically based on data. Just left click on it and select edit data. Pitch your topic with ease and precision using this Total Income Budget, Total Expenses Balance, Net Profit Quick, Ratio Current Ratio. This layout presents information on Account Payable Age, Average Creditor Days, Cash On Hand. It is also available for immediate download and adjustment. So, changes can be made in the color, design, graphics or any other component to create a unique layout.
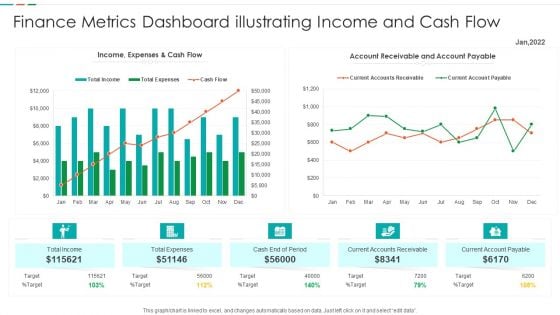
Finance Metrics Dashboard Illustrating Income And Cash Flow Template PDF
This graph or chart is linked to excel, and changes automatically based on data. Just left click on it and select edit data. Pitch your topic with ease and precision using this Finance Metrics Dashboard Illustrating Income And Cash Flow Template PDF. This layout presents information on Current Accounts Receivable, Current Account Payable, Cash End Period, Account Receivable Account. It is also available for immediate download and adjustment. So, changes can be made in the color, design, graphics or any other component to create a unique layout.
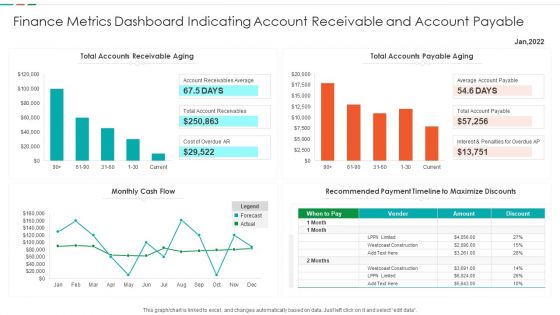
Finance Metrics Dashboard Indicating Account Receivable And Account Payable Demonstration PDF
This graph or chart is linked to excel, and changes automatically based on data. Just left click on it and select edit data. Showcasing this set of slides titled Finance Metrics Dashboard Indicating Account Receivable And Account Payable Demonstration PDF. The topics addressed in these templates are Total Accounts Receivable, Total Accounts Payable, Recommended Payment Timeline, Monthly Cash Flow. All the content presented in this PPT design is completely editable. Download it and make adjustments in color, background, font etc. as per your unique business setting.
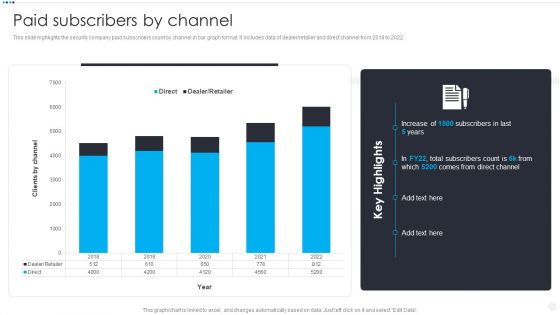
Smart Home Security Solutions Company Profile Paid Subscribers By Channel Clipart PDF
This slide highlights the security company paid subscribers count by channel in bar graph format. It includes data of dealer or retailer and direct channel from 2018 to 2022. Deliver an awe inspiring pitch with this creative Smart Home Security Solutions Company Profile Paid Subscribers By Channel Clipart PDF bundle. Topics like Direct Dealer Retailer, 2018 To 2022, Clients By Channel can be discussed with this completely editable template. It is available for immediate download depending on the needs and requirements of the user.
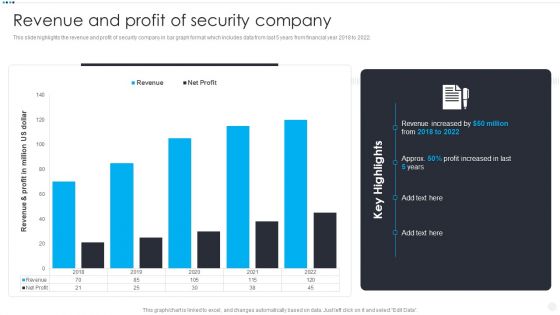
Smart Home Security Solutions Company Profile Revenue And Profit Of Security Company Elements PDF
This slide highlights the revenue and profit of security company in bar graph format which includes data from last 5 years from financial year 2018 to 2022. Deliver and pitch your topic in the best possible manner with this Smart Home Security Solutions Company Profile Revenue And Profit Of Security Company Elements PDF. Use them to share invaluable insights on Revenue And Profit, Million US Dollar, Revenue Increased Profit and impress your audience. This template can be altered and modified as per your expectations. So, grab it now.
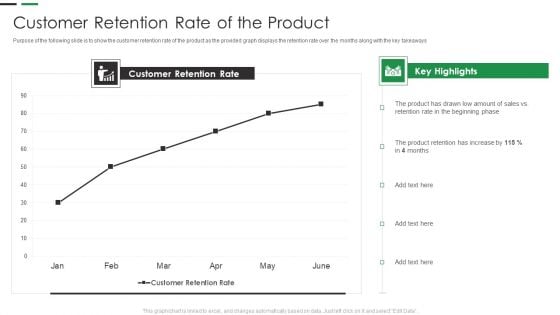
Evaluating New Commodity Impact On Market Customer Retention Rate Of The Product Rules PDF
Purpose of the following slide is to show the customer retention rate of the product as the provided graph displays the retention rate over the months along with the key takeaways Deliver and pitch your topic in the best possible manner with this Evaluating New Commodity Impact On Market Customer Retention Rate Of The Product Rules PDF Use them to share invaluable insights on Key Highlights, Product Retention, Customer Retention and impress your audience. This template can be altered and modified as per your expectations. So, grab it now.


 Continue with Email

 Home
Home


