Graphics
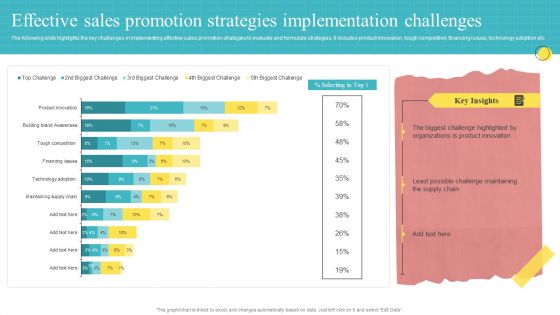
Effective Sales Promotion Strategies Implementation Challenges Ppt PowerPoint Presentation Ideas Graphics Tutorials PDF
The following slide highlights the key challenges in implementing effective sales promotion strategies to evaluate and formulate strategies. It includes product innovation, tough competition, financing issues, technology adoption etc. Pitch your topic with ease and precision using this Effective Sales Promotion Strategies Implementation Challenges Ppt PowerPoint Presentation Ideas Graphics Tutorials PDF. This layout presents information on Biggest Challenge, Product Innovation, Challenge Maintaining. It is also available for immediate download and adjustment. So, changes can be made in the color, design, graphics or any other component to create a unique layout.
5 Years Profit And Loss Comparative Analysis Chart Of Enterprise Ppt Icon Graphics PDF
This slide represents the comparison of profit and loss of an organization for the five years. It includes details related to profit and loss from various accounts such as order fees, concession income, facility rental etc. Pitch your topic with ease and precision using this 5 Years Profit And Loss Comparative Analysis Chart Of Enterprise Ppt Icon Graphics PDF. This layout presents information on Account, 2018 To 2022, Exchange Fees. It is also available for immediate download and adjustment. So, changes can be made in the color, design, graphics or any other component to create a unique layout.

5S Lean Production Strategies Audit Sheet For Safety Ppt Infographics Graphics Template PDF
This slide defines the 5s lean safety audit sheet for an organization. It includes information related observations, remarks and suggestions along with the scores. Pitch your topic with ease and precision using this 5S Lean Production Strategies Audit Sheet For Safety Ppt Infographics Graphics Template PDF. This layout presents information on Remarks And Suggestion, Safety Equipment, Extinguishers Available. It is also available for immediate download and adjustment. So, changes can be made in the color, design, graphics or any other component to create a unique layout.
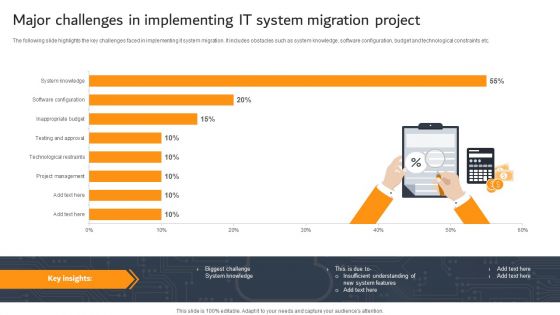
Major Challenges In Implementing IT System Migration Project Ppt PowerPoint Presentation Outline Graphics PDF
The following slide highlights the key challenges faced in implementing it system migration. It includes obstacles such as system knowledge, software configuration, budget and technological constraints etc.Pitch your topic with ease and precision using this Major Challenges In Implementing IT System Migration Project Ppt PowerPoint Presentation Outline Graphics PDF. This layout presents information on Insufficient Understanding, System Features, Project Management. It is also available for immediate download and adjustment. So, changes can be made in the color, design, graphics or any other component to create a unique layout.
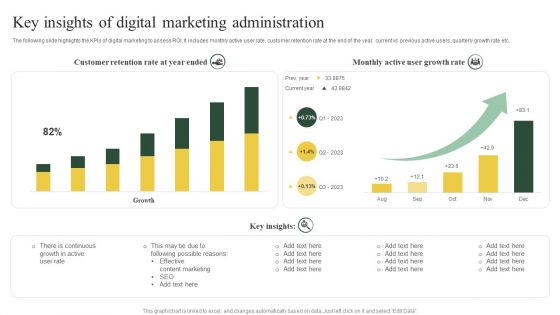
Key Insights Of Digital Marketing Administration Ppt PowerPoint Presentation Styles Graphics Template PDF
The following slide highlights the KPIs of digital marketing to assess ROI. It includes monthly active user rate, customer retention rate at the end of the year, current vs previous active users, quarterly growth rate etc.Pitch your topic with ease and precision using this Key Insights Of Digital Marketing Administration Ppt PowerPoint Presentation Styles Graphics Template PDF. This layout presents information on Possible Reasons, Content Marketing, Growth Rate. It is also available for immediate download and adjustment. So, changes can be made in the color, design, graphics or any other component to create a unique layout.
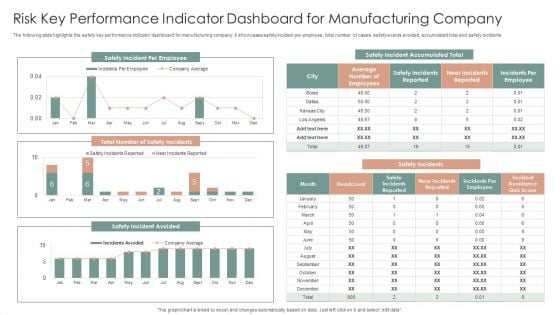
Risk Key Performance Indicator Dashboard For Manufacturing Company Ppt Gallery Graphics Design PDF
The following slide highlights the safety key performance indicator dashboard for manufacturing company. It showcases safety incident per employee, total number of cases, safety events avoided, accumulated total and safety incidents. Pitch your topic with ease and precision using this Risk Key Performance Indicator Dashboard For Manufacturing Company Ppt Gallery Graphics Design PDF. This layout presents information on Safety Incidents, Safety Incident Avoided, Safety Incident Accumulated. It is also available for immediate download and adjustment. So, changes can be made in the color, design, graphics or any other component to create a unique layout.
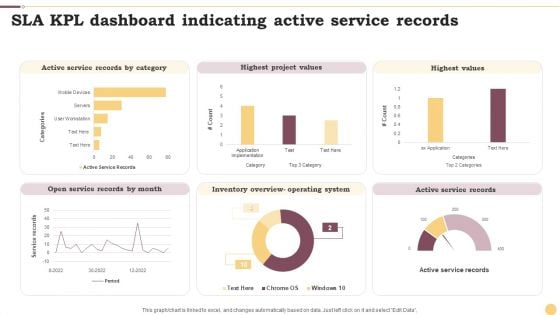
SLA KPL Dashboard Indicating Active Service Records Ppt Professional Graphics Example PDF
This graph or chart is linked to excel, and changes automatically based on data. Just left click on it and select Edit Data. Pitch your topic with ease and precision using this SLA KPL Dashboard Indicating Active Service Records Ppt Professional Graphics Example PDF. This layout presents information on Active Service Records, Highest Project Values, Highest Values. It is also available for immediate download and adjustment. So, changes can be made in the color, design, graphics or any other component to create a unique layout.
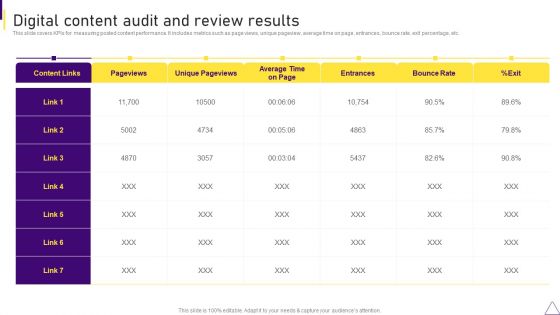
Consumer Journey Mapping Techniques Digital Content Audit And Review Results Graphics PDF
This slide covers KPIs for measuring posted content performance. It includes metrics such as page views, unique pageview, average time on page, entrances, bounce rate, exit percentage, etc. Pitch your topic with ease and precision using this Consumer Journey Mapping Techniques Digital Content Audit And Review Results Graphics PDF. This layout presents information on Digital Content Audit, Review Results. It is also available for immediate download and adjustment. So, changes can be made in the color, design, graphics or any other component to create a unique layout.
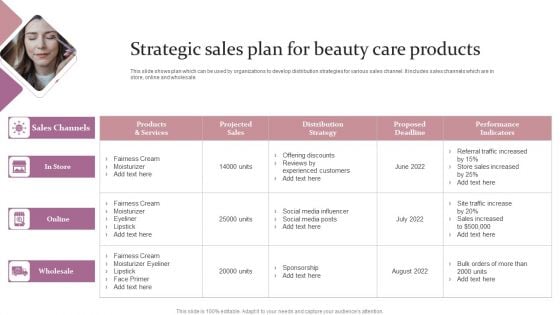
Strategic Sales Plan For Beauty Care Products Ppt Summary Graphics PDF
This slide shows plan which can be used by organizations to develop distribution strategies for various sales channel. It includes sales channels which are in store, online and wholesale. Pitch your topic with ease and precision using this Strategic Sales Plan For Beauty Care Products Ppt Summary Graphics PDF. This layout presents information on Sales Channels, Online, Wholesale. It is also available for immediate download and adjustment. So, changes can be made in the color, design, graphics or any other component to create a unique layout.
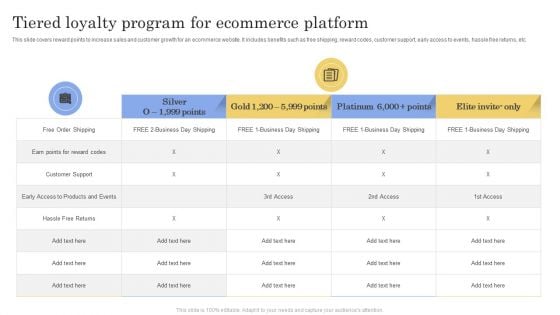
Tiered Loyalty Program For Ecommerce Platform Ppt Pictures Graphics Example PDF
This slide covers reward points to increase sales and customer growth for an ecommerce website. It includes benefits such as free shipping, reward codes, customer support, early access to events, hassle free returns, etc. Pitch your topic with ease and precision using this Tiered Loyalty Program For Ecommerce Platform Ppt Pictures Graphics Example PDF. This layout presents information on Free Order Shipping, Customer Support, Hassle Free Returns. It is also available for immediate download and adjustment. So, changes can be made in the color, design, graphics or any other component to create a unique layout.
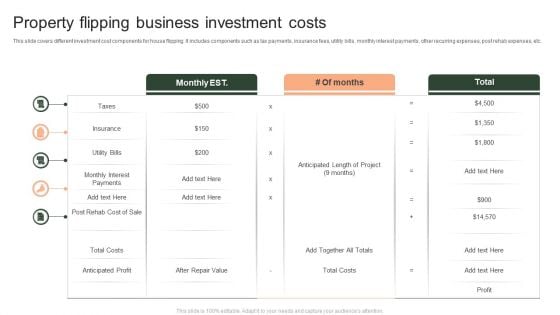
Property Flipping Business Investment Costs Ppt PowerPoint Presentation File Graphics Template PDF
This slide covers different investment cost components for house flipping. It includes components such as tax payments, insurance fees, utility bills, monthly interest payments, other recurring expenses, post rehab expenses, etc. Pitch your topic with ease and precision using this Property Flipping Business Investment Costs Ppt PowerPoint Presentation File Graphics Template PDF. This layout presents information on Insurance, Total Costs, Anticipated Profit. It is also available for immediate download and adjustment. So, changes can be made in the color, design, graphics or any other component to create a unique layout.
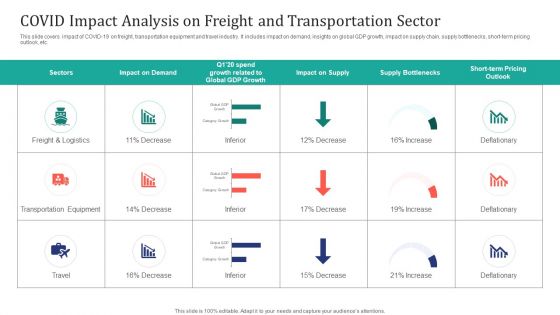
COVID Impact Analysis On Freight And Transportation Sector Ppt Outline Graphics Tutorials PDF
This slide covers impact of COVID-19 on freight, transportation equipment and travel industry. It includes impact on demand, insights on global GDP growth, impact on supply chain, supply bottlenecks, short-term pricing outlook, etc. Pitch your topic with ease and precision using this COVID Impact Analysis On Freight And Transportation Sector Ppt Outline Graphics Tutorials PDF. This layout presents information on Freight And Logistics, Transportation Equipment, Deflationary. It is also available for immediate download and adjustment. So, changes can be made in the color, design, graphics or any other component to create a unique layout.
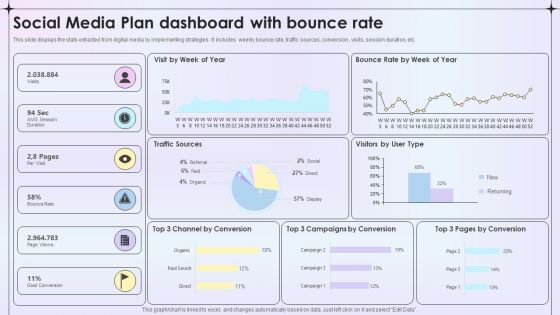
Social Media Plan Dashboard With Bounce Rate Ppt Ideas Graphics Template PDF
This slide displays the stats extracted from digital media by implementing strategies . It includes weekly bounce rate, traffic sources, conversion , visits, session duration, etc. Pitch your topic with ease and precision using this Social Media Plan Dashboard With Bounce Rate Ppt Ideas Graphics Template PDF. This layout presents information on Traffic Sources, Visitors User Type, Goal Conversion. It is also available for immediate download and adjustment. So, changes can be made in the color, design, graphics or any other component to create a unique layout.
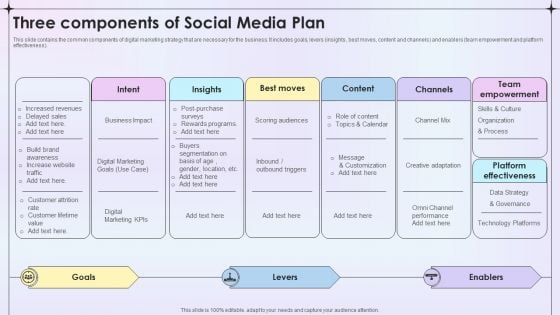
Three Components Of Social Media Plan Ppt Ideas Graphics Template PDF
This slide contains the common components of digital marketing strategy that are necessary for the business. It includes goals, levers insights , best moves, content and channels and enablers team empowerment and platform effectiveness. Pitch your topic with ease and precision using this Three Components Of Social Media Plan Ppt Ideas Graphics Template PDF. This layout presents information on Intent, Insights, Best Moves, Content, Channels, Team Empowerment. It is also available for immediate download and adjustment. So, changes can be made in the color, design, graphics or any other component to create a unique layout.
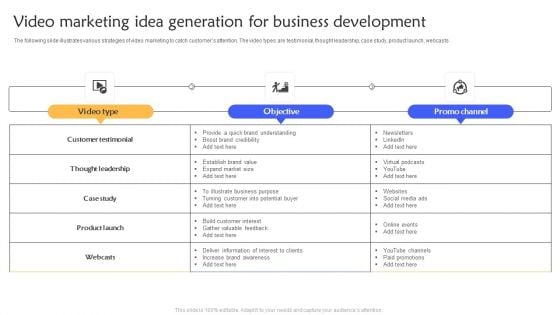
Video Marketing Idea Generation For Business Development Ppt Model Graphics Tutorials PDF
The following slide illustrates various strategies of video marketing to catch customers attention. The video types are testimonial, thought leadership, case study, product launch, webcasts. Pitch your topic with ease and precision using this Video Marketing Idea Generation For Business Development Ppt Model Graphics Tutorials PDF. This layout presents information on Customer Testimonial, Thought Leadership, Case Study. It is also available for immediate download and adjustment. So, changes can be made in the color, design, graphics or any other component to create a unique layout.
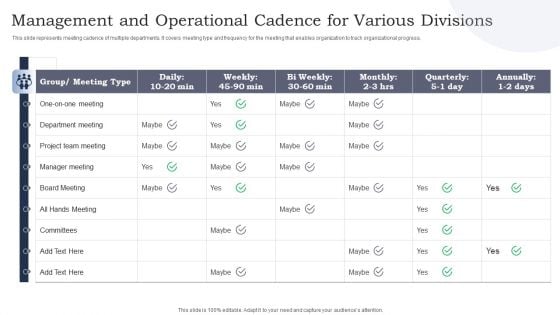
Management And Operational Cadence For Various Divisions Ppt Portfolio Graphics Download PDF
This slide represents meeting cadence of multiple departments. It covers meeting type and frequency for the meeting that enables organization to track organizational progress. Pitch your topic with ease and precision using this Management And Operational Cadence For Various Divisions Ppt Portfolio Graphics Download PDF. This layout presents information on Department Meeting, Project Team Meeting, Manager Meeting. It is also available for immediate download and adjustment. So, changes can be made in the color, design, graphics or any other component to create a unique layout.
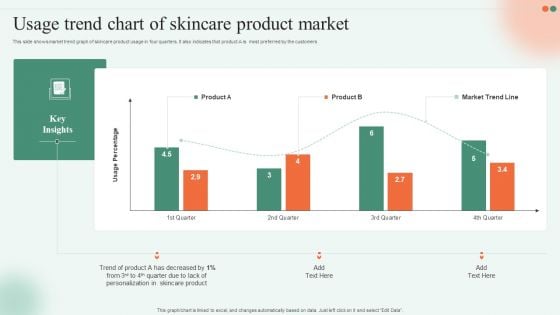
Usage Trend Chart Of Skincare Product Market Ppt Slides Graphics Download PDF
This slide shows market trend graph of skincare product usage in four quarters. It also indicates that product A is most preferred by the customers. Pitch your topic with ease and precision using this Usage Trend Chart Of Skincare Product Market Ppt Slides Graphics Download PDF. This layout presents information on Trend Product, Skincare Product, Quarter Due. It is also available for immediate download and adjustment. So, changes can be made in the color, design, graphics or any other component to create a unique layout.
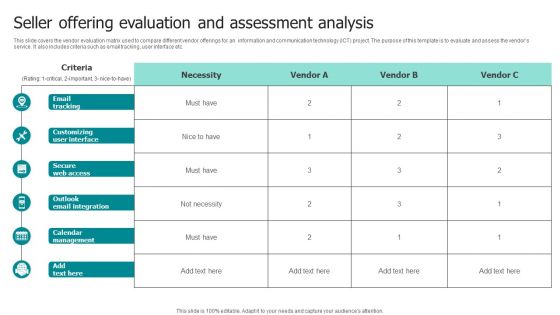
Seller Offering Evaluation And Assessment Analysis Ppt Infographic Template Graphics PDF
This slide covers the vendor evaluation matrix used to compare different vendor offerings for an information and communication technology ICT project. The purpose of this template is to evaluate and assess the vendors service. It also includes criteria such as email tracking, user interface etc. Pitch your topic with ease and precision using this Seller Offering Evaluation And Assessment Analysis Ppt Infographic Template Graphics PDF. This layout presents information on Email Tracking, Customizing User Interface, Secure Web Access. It is also available for immediate download and adjustment. So, changes can be made in the color, design, graphics or any other component to create a unique layout.
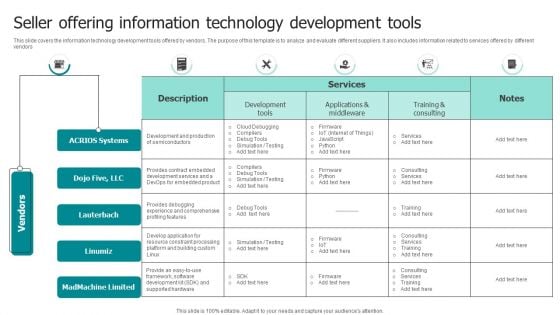
Seller Offering Information Technology Development Tools Ppt Styles Graphics Template PDF
This slide covers the information technology development tools offered by vendors. The purpose of this template is to analyze and evaluate different suppliers. It also includes information related to services offered by different vendors. Pitch your topic with ease and precision using this Seller Offering Information Technology Development Tools Ppt Styles Graphics Template PDF. This layout presents information on ACRIOS Systems, Services, Development Tools. It is also available for immediate download and adjustment. So, changes can be made in the color, design, graphics or any other component to create a unique layout.
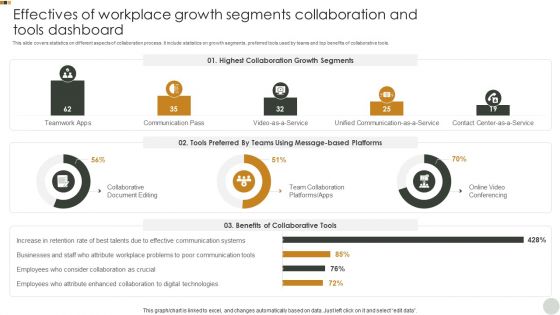
Effectives Of Workplace Growth Segments Collaboration And Tools Dashboard Graphics PDF
This slide covers statistics on different aspects of collaboration process. It include statistics on growth segments, preferred tools used by teams and top benefits of collaborative tools. Pitch your topic with ease and precision using this Effectives Of Workplace Growth Segments Collaboration And Tools Dashboard Graphics PDF. This layout presents information on Highest Collaboration, Growth Segments, Tools Preferred. It is also available for immediate download and adjustment. So, changes can be made in the color, design, graphics or any other component to create a unique layout.
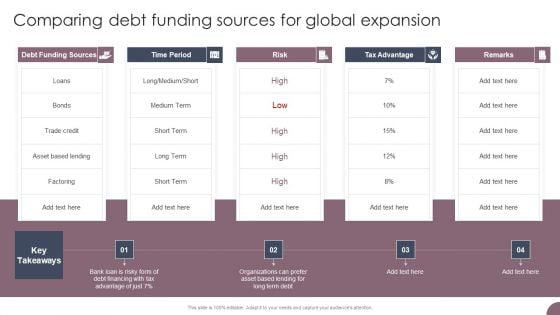
International Business Extension Comparing Debt Funding Sources For Global Expansion Graphics PDF
Whether you have daily or monthly meetings, a brilliant presentation is necessary. International Business Extension Comparing Debt Funding Sources For Global Expansion Graphics PDF can be your best option for delivering a presentation. Represent everything in detail using International Business Extension Comparing Debt Funding Sources For Global Expansion Graphics PDF and make yourself stand out in meetings. The template is versatile and follows a structure that will cater to your requirements. All the templates prepared by Slidegeeks are easy to download and edit. Our research experts have taken care of the corporate themes as well. So, give it a try and see the results.
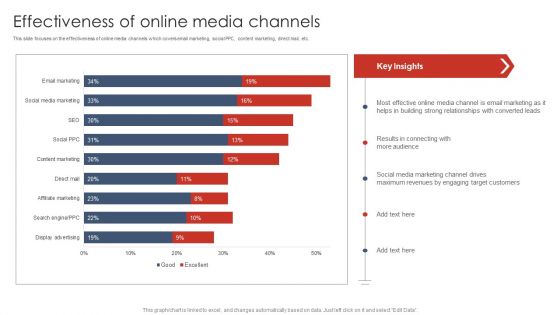
Effectiveness Of Online Media Channels Digital Marketing Strategy Deployment Graphics PDF
This slide focuses on the effectiveness of online media channels which covers email marketing, social PPC, content marketing, direct mail, etc.Get a simple yet stunning designed Effectiveness Of Online Media Channels Digital Marketing Strategy Deployment Graphics PDF. It is the best one to establish the tone in your meetings. It is an excellent way to make your presentations highly effective. So, download this PPT today from Slidegeeks and see the positive impacts. Our easy-to-edit Effectiveness Of Online Media Channels Digital Marketing Strategy Deployment Graphics PDF can be your go-to option for all upcoming conferences and meetings. So, what are you waiting for Grab this template today.
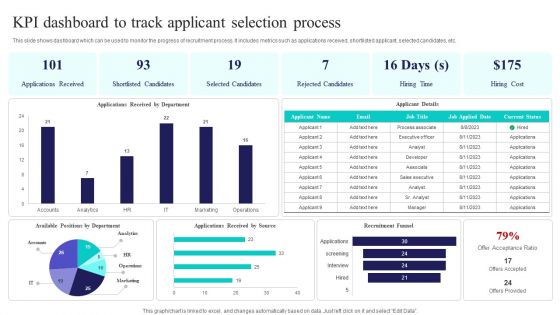
Kpi Dashboard To Track Applicant Selection Process Ppt PowerPoint Presentation File Graphics Template PDF
This slide shows dashboard which can be used to monitor the progress of recruitment process. It includes metrics such as applications received, shortlisted applicant, selected candidates, etc. Pitch your topic with ease and precision using this Kpi Dashboard To Track Applicant Selection Process Ppt PowerPoint Presentation File Graphics Template PDF. This layout presents information on Applications Received, Shortlisted Candidates, Selected Candidates. It is also available for immediate download and adjustment. So, changes can be made in the color, design, graphics or any other component to create a unique layout.
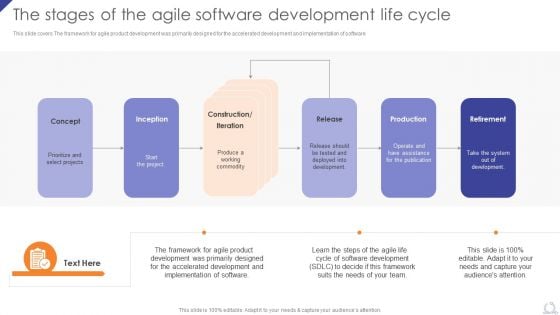
The Stages Of The Agile Software Development Life Cycle Agile Project Development Strategies Graphics PDF
This slide covers The framework for agile product development was primarily designed for the accelerated development and implementation of software. Create an editable The Stages Of The Agile Software Development Life Cycle Agile Project Development Strategies Graphics PDF that communicates your idea and engages your audience. Whether you are presenting a business or an educational presentation, pre-designed presentation templates help save time. The Stages Of The Agile Software Development Life Cycle Agile Project Development Strategies Graphics PDF is highly customizable and very easy to edit, covering many different styles from creative to business presentations. Slidegeeks has creative team members who have crafted amazing templates. So, go and get them without any delay.
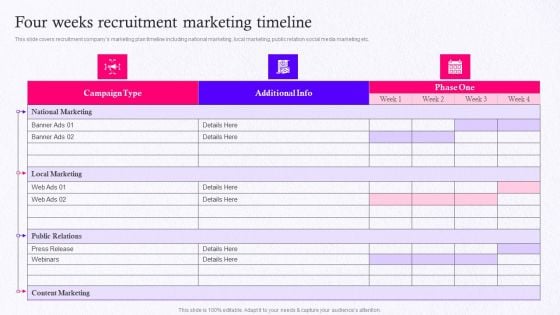
Employer Brand Marketing On Social Media Platform Four Weeks Recruitment Marketing Timeline Graphics PDF
This slide covers recruitment companys marketing plan timeline including national marketing, local marketing, public relation social media marketing etc. Create an editable Employer Brand Marketing On Social Media Platform Four Weeks Recruitment Marketing Timeline Graphics PDF that communicates your idea and engages your audience. Whether you are presenting a business or an educational presentation, pre-designed presentation templates help save time. Employer Brand Marketing On Social Media Platform Four Weeks Recruitment Marketing Timeline Graphics PDF is highly customizable and very easy to edit, covering many different styles from creative to business presentations. Slidegeeks has creative team members who have crafted amazing templates. So, go and get them without any delay.
Icons Slide Employer Brand Marketing On Social Media Platform Graphics PDF
This slide covers primary trends affecting growth of recruitment marketing such as stiff competition for talent, technology improvement, entry of millennial generation into workforce etc. Help your business to create an attention-grabbing presentation using our Icons Slide Employer Brand Marketing On Social Media Platform Graphics PDF set of slides. The slide contains innovative icons that can be flexibly edited. Choose this Icons Slide Employer Brand Marketing On Social Media Platform Graphics PDF template to create a satisfactory experience for your customers. Go ahead and click the download button.
Nonprofit Fundraising Communication Strategy For Social Cause Ppt Icon Graphics Template PDF
In slide showcase non profit project communion plan to collect funds weaker section of society to provide free education and necessity for living. It includes elements such as organization name, appeal date, brief description, fundraising target etc. Pitch your topic with ease and precision using this Nonprofit Fundraising Communication Strategy For Social Cause Ppt Icon Graphics Template PDF. This layout presents information on Scottish International Department, Aid Fund, Online Advertisements. It is also available for immediate download and adjustment. So, changes can be made in the color, design, graphics or any other component to create a unique layout.
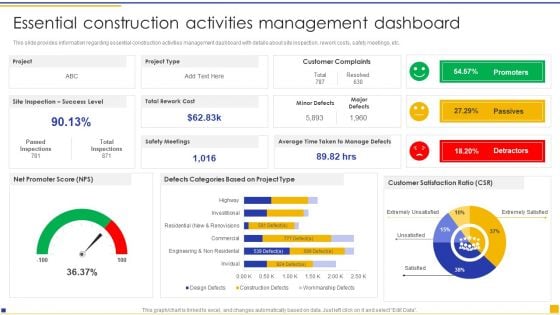
Construction Project Instructions Playbook Essential Construction Activities Management Dashboard Graphics PDF
This slide provides information regarding essential construction activities management dashboard with details about site inspection, rework costs, safety meetings, etc. Crafting an eye catching presentation has never been more straightforward. Let your presentation shine with this tasteful yet straightforward Construction Project Instructions Playbook Essential Construction Activities Management Dashboard Graphics PDF template. It offers a minimalistic and classy look that is great for making a statement. The colors have been employed intelligently to add a bit of playfulness while still remaining professional. Construct the ideal Construction Project Instructions Playbook Essential Construction Activities Management Dashboard Graphics PDF that effortlessly grabs the attention of your audience Begin now and be certain to wow your customers.
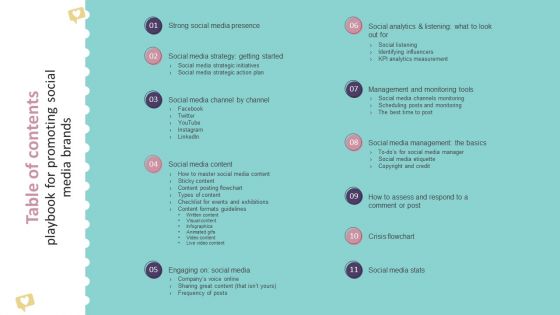
Table Of Contents Playbook For Promoting Social Media Brands Graphics PDF
Explore a selection of the finest Table Of Contents Playbook For Promoting Social Media Brands Graphics PDF here. With a plethora of professionally designed and pre-made slide templates, you can quickly and easily find the right one for your upcoming presentation. You can use our Table Of Contents Playbook For Promoting Social Media Brands Graphics PDF to effectively convey your message to a wider audience. Slidegeeks has done a lot of research before preparing these presentation templates. The content can be personalized and the slides are highly editable. Grab templates today from Slidegeeks.
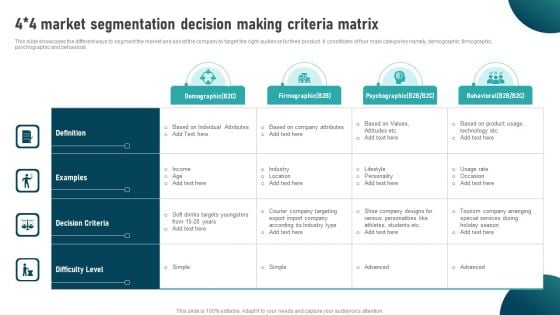
4 4 Market Segmentation Decision Making Criteria Matrix Ppt Summary Graphics PDF
This slide showcases the different ways to segment the market and assist the company to target the right audience for their product. It constitutes of four main categories namely, demographic, firmographic, psychographic and behavioral. Pitch your topic with ease and precision using this 4 4 Market Segmentation Decision Making Criteria Matrix Ppt Summary Graphics PDF. This layout presents information on Definition, Examples, Decision Criteria, Difficulty Level. It is also available for immediate download and adjustment. So, changes can be made in the color, design, graphics or any other component to create a unique layout.
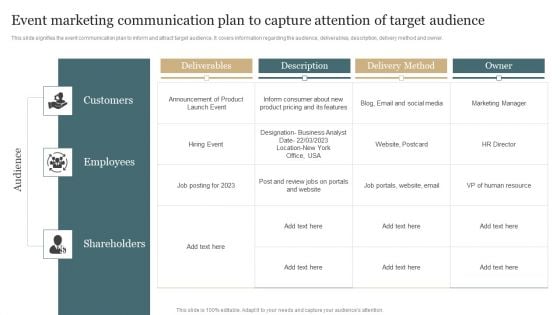
Event Marketing Communication Plan To Capture Attention Of Target Audience Graphics PDF
This slide signifies the event communication plan to inform and attract target audience. It covers information regarding the audience, deliverables, description, delivery method and owner. Pitch your topic with ease and precision using this Event Marketing Communication Plan To Capture Attention Of Target Audience Graphics PDF. This layout presents information on Deliverables, Description, Delivery Method, Owner. It is also available for immediate download and adjustment. So, changes can be made in the color, design, graphics or any other component to create a unique layout.

Integrating Nlp To Enhance Processes Main Functions Of Natural Language Processing Algorithms Graphics PDF
This slide shows the main functions of NLP algorithms, such as text classification, text extraction, machine translation, and natural language generation NLG.Create an editable Integrating Nlp To Enhance Processes Main Functions Of Natural Language Processing Algorithms Graphics PDF that communicates your idea and engages your audience. Whether you are presenting a business or an educational presentation, pre-designed presentation templates help save time. Integrating Nlp To Enhance Processes Main Functions Of Natural Language Processing Algorithms Graphics PDF is highly customizable and very easy to edit, covering many different styles from creative to business presentations. Slidegeeks has creative team members who have crafted amazing templates. So, go and get them without any delay.
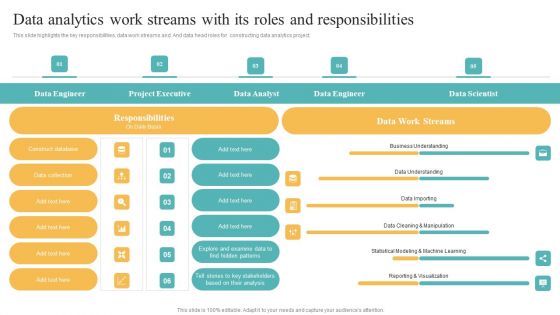
Data Analytics Work Streams With Its Roles And Responsibilities Graphics PDF
This slide highlights the key responsibilities, data work streams and. And data head roles for constructing data analytics project. Crafting an eye catching presentation has never been more straightforward. Let your presentation shine with this tasteful yet straightforward Data Analytics Work Streams With Its Roles And Responsibilities Graphics PDF template. It offers a minimalistic and classy look that is great for making a statement. The colors have been employed intelligently to add a bit of playfulness while still remaining professional. Construct the ideal Data Analytics Work Streams With Its Roles And Responsibilities Graphics PDF that effortlessly grabs the attention of your audience Begin now and be certain to wow your customers.
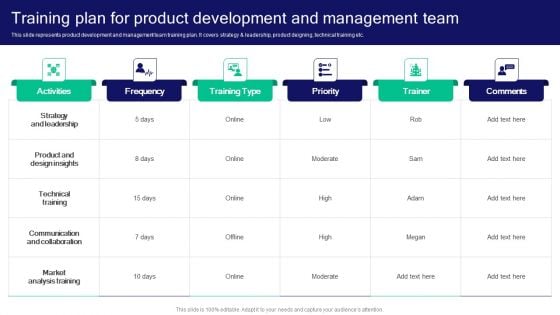
Strategies For Effective Product Training Plan For Product Development And Management Team Graphics PDF
This slide represents product development and management team training plan. It covers strategy and leadership, product deigning, technical training etc. Get a simple yet stunning designed Strategies For Effective Product Training Plan For Product Development And Management Team Graphics PDF. It is the best one to establish the tone in your meetings. It is an excellent way to make your presentations highly effective. So, download this PPT today from Slidegeeks and see the positive impacts. Our easy-to-edit Strategies For Effective Product Training Plan For Product Development And Management Team Graphics PDF can be your go-to option for all upcoming conferences and meetings. So, what are you waiting for Grab this template today.
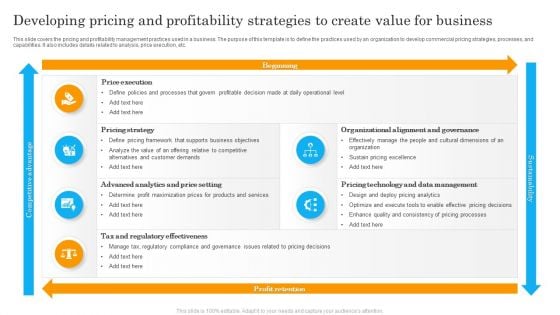
Developing Pricing And Profitability Strategies To Create Value For Business Graphics PDF
This slide covers the pricing and profitability management practices used in a business. The purpose of this template is to define the practices used by an organization to develop commercial pricing strategies, processes, and capabilities. It also includes details related to analysis, price execution, etc. Pitch your topic with ease and precision using this Developing Pricing And Profitability Strategies To Create Value For Business Graphics PDF. This layout presents information on Price Execution, Pricing Strategy, Advanced Analytics, Price Setting. It is also available for immediate download and adjustment. So, changes can be made in the color, design, graphics or any other component to create a unique layout.
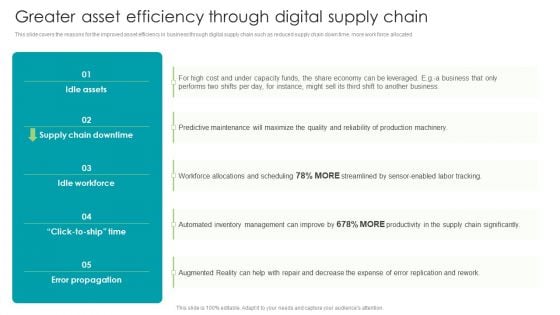
Robotic Process Automation Greater Asset Efficiency Through Digital Supply Chain Graphics PDF
This slide covers the reasons for the improved asset efficiency in business through digital supply chain such as reduced supply chain down time, more work force allocated Create an editable Robotic Process Automation Greater Asset Efficiency Through Digital Supply Chain Graphics PDF that communicates your idea and engages your audience. Whether youre presenting a business or an educational presentation, pre-designed presentation templates help save time. Robotic Process Automation Greater Asset Efficiency Through Digital Supply Chain Graphics PDF is highly customizable and very easy to edit, covering many different styles from creative to business presentations. Slidegeeks has creative team members who have crafted amazing templates. So, go and get them without any delay.
Table Of Contents Highway Snow Removal Business Proposal Ppt Icon Graphics Example PDF
Explore a selection of the finest Table Of Contents Highway Snow Removal Business Proposal Ppt Icon Graphics Example PDF here. With a plethora of professionally designed and pre-made slide templates, you can quickly and easily find the right one for your upcoming presentation. You can use our Table Of Contents Highway Snow Removal Business Proposal Ppt Icon Graphics Example PDF to effectively convey your message to a wider audience. Slidegeeks has done a lot of research before preparing these presentation templates. The content can be personalized and the slides are highly editable. Grab templates today from Slidegeeks.
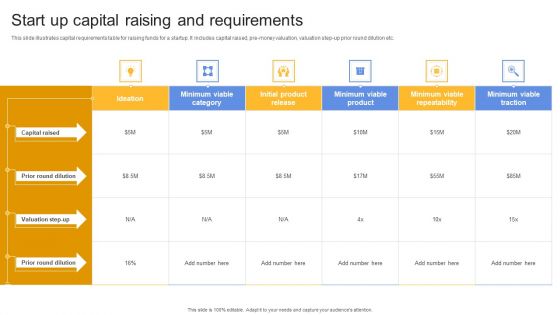
Start Up Capital Raising And Requirements Ppt Inspiration Graphics Tutorials PDF
This slide illustrates capital requirements table for raising funds for a startup. It includes capital raised, pre-money valuation, valuation step-up prior round dilution etc. Pitch your topic with ease and precision using this Start Up Capital Raising And Requirements Ppt Inspiration Graphics Tutorials PDF. This layout presents information on Capital Raised, Prior Round Dilution, Prior Round Dilution. It is also available for immediate download and adjustment. So, changes can be made in the color, design, graphics or any other component to create a unique layout.
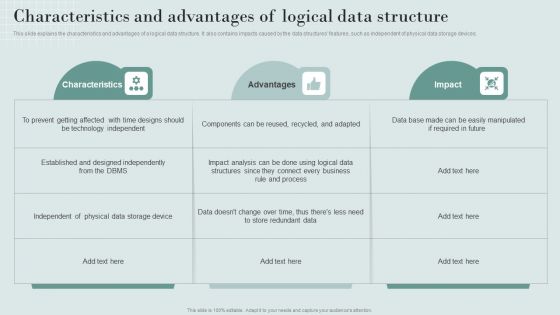
Data Structure IT Characteristics And Advantages Of Logical Data Structure Graphics PDF
Do you have to make sure that everyone on your team knows about any specific topic. I yes, then you should give Data Structure IT Characteristics And Advantages Of Logical Data Structure Graphics PDF a try. Our experts have put a lot of knowledge and effort into creating this impeccable Data Structure IT Characteristics And Advantages Of Logical Data Structure Graphics PDF. You can use this template for your upcoming presentations, as the slides are perfect to represent even the tiniest detail. You can download these templates from the Slidegeeks website and these are easy to edit. So grab these today.
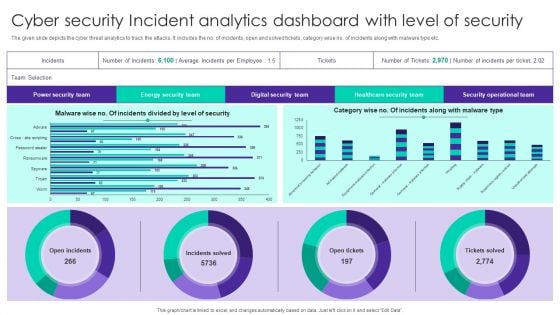
Cyber Security Incident Analytics Dashboard With Level Of Security Ppt Ideas Graphics Tutorials PDF
The given slide depicts the cyber threat analytics to track the attacks. It includes the no. of incidents, open and solved tickets, category wise no. of incidents along with malware type etc. Pitch your topic with ease and precision using this Cyber Security Incident Analytics Dashboard With Level Of Security Ppt Ideas Graphics Tutorials PDF. This layout presents information on Power Security Team, Open Incidents, Incidents Solved, Open Tickets. It is also available for immediate download and adjustment. So, changes can be made in the color, design, graphics or any other component to create a unique layout.
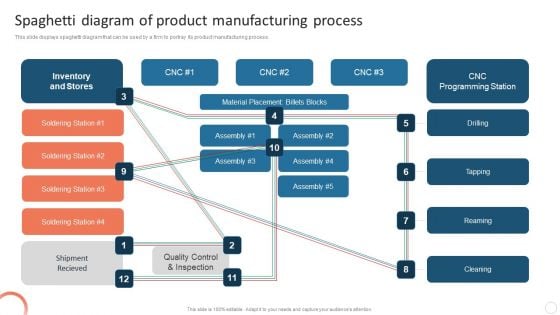
Quality Control Plan Spaghetti Diagram Of Product Manufacturing Process Graphics PDF
This slide displays spaghetti diagram that can be used by a firm to portray its product manufacturing process. Explore a selection of the finest Quality Control Plan Spaghetti Diagram Of Product Manufacturing Process Graphics PDF here. With a plethora of professionally designed and pre-made slide templates, you can quickly and easily find the right one for your upcoming presentation. You can use our Quality Control Plan Spaghetti Diagram Of Product Manufacturing Process Graphics PDF to effectively convey your message to a wider audience. Slidegeeks has done a lot of research before preparing these presentation templates. The content can be personalized and the slides are highly editable. Grab templates today from Slidegeeks.
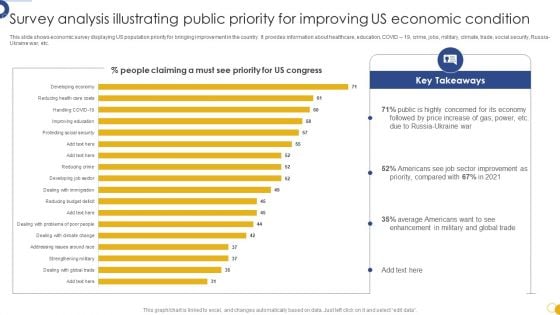
Survey Analysis Illustrating Public Priority For Improving US Economic Condition Graphics PDF
This slide shows economic survey displaying US population priority for bringing improvement in the country. It provides information about healthcare, education, COVID 19, crime, jobs, military, climate, trade, social security, Russia-Ukraine war, etc. Pitch your topic with ease and precision using this Survey Analysis Illustrating Public Priority For Improving US Economic Condition Graphics PDF. This layout presents information on Survey Analysis, Illustrating Public, Priority Improving US Economic. It is also available for immediate download and adjustment. So, changes can be made in the color, design, graphics or any other component to create a unique layout.
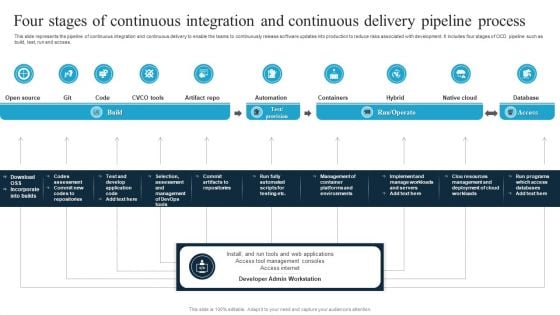
Four Stages Of Continuous Integration And Continuous Delivery Pipeline Process Graphics PDF
This slide represents the pipeline of continuous integration and continuous delivery to enable the teams to continuously release software updates into production to reduce risks associated with development. It includes four stages of CICD pipeline such as build, test, run and access. Pitch your topic with ease and precision using this Four Stages Of Continuous Integration And Continuous Delivery Pipeline Process Graphics PDF. This layout presents information on Build, Run Operate, Access. It is also available for immediate download and adjustment. So, changes can be made in the color, design, graphics or any other component to create a unique layout.

System Integration Deployment Timeline To Enhance Efficiency Demonstration PDF Graphics PDF
This slide covers system integration implementation timeline to ensure accuracy. It involves three key steps such as determine integration needs, design integration and implement integration. Pitch your topic with ease and precision using this System Integration Deployment Timeline To Enhance Efficiency Demonstration PDF Graphics PDF. This layout presents information on Determine Integration Needs, Design Integration, Implement Integration. It is also available for immediate download and adjustment. So, changes can be made in the color, design, graphics or any other component to create a unique layout.
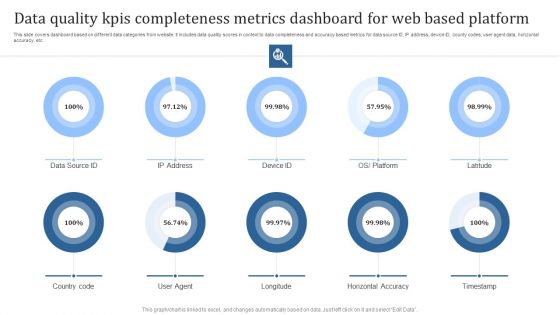
Data Quality Kpis Completeness Metrics Dashboard For Web Based Platform Graphics PDF
This slide covers dashboard based on different data categories from website. It includes data quality scores in context to data completeness and accuracy based metrics for data source ID, IP address, device ID, county codes, user agent data, horizontal accuracy, etc. Pitch your topic with ease and precision using this Data Quality Kpis Completeness Metrics Dashboard For Web Based Platform Graphics PDF. This layout presents information on Country Code, User Agent, Longitude. It is also available for immediate download and adjustment. So, changes can be made in the color, design, graphics or any other component to create a unique layout.
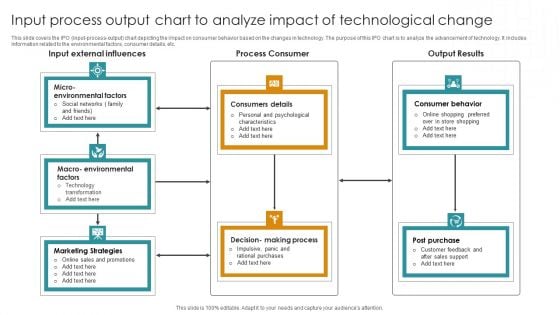
Input Process Output Chart To Analyze Impact Of Technological Change Graphics PDF
This slide covers the IPO input-process-output chart depicting the impact on consumer behavior based on the changes in technology. The purpose of this IPO chart is to analyze the advancement of technology. It includes information related to the environmental factors, consumer details, etc. Pitch your topic with ease and precision using this Input Process Output Chart To Analyze Impact Of Technological Change Graphics PDF. This layout presents information on Input External Influences, Process Consumer, Output Results. It is also available for immediate download and adjustment. So, changes can be made in the color, design, graphics or any other component to create a unique layout.
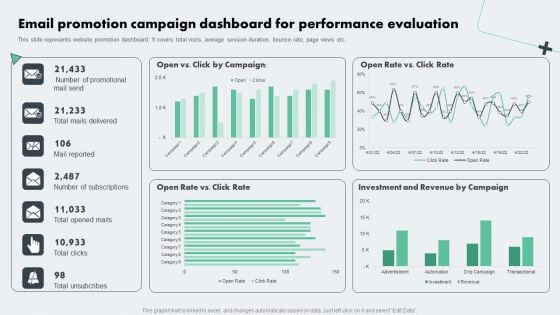
Deploying Online Marketing Email Promotion Campaign Dashboard For Performance Graphics PDF
This slide represents website promotion dashboard. It covers total visits, average session duration, bounce rate, page views etc. This Deploying Online Marketing Email Promotion Campaign Dashboard For Performance Graphics PDF is perfect for any presentation, be it in front of clients or colleagues. It is a versatile and stylish solution for organizing your meetings. The Deploying Online Marketing Email Promotion Campaign Dashboard For Performance Graphics PDF features a modern design for your presentation meetings. The adjustable and customizable slides provide unlimited possibilities for acing up your presentation. Slidegeeks has done all the homework before launching the product for you. So, dont wait, grab the presentation templates today.
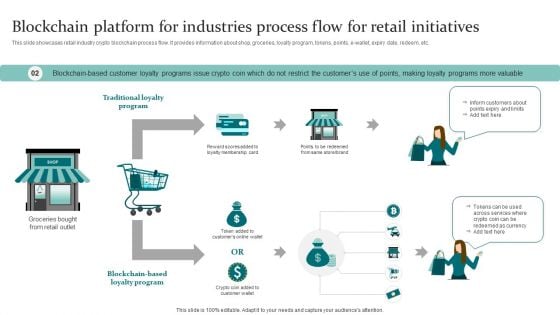
Blockchain Platform For Industries Process Flow For Retail Initiatives Graphics PDF
This slide showcases retail industry crypto blockchain process flow. It provides information about shop, groceries, loyalty program, tokens, points, e wallet, expiry date, redeem, etc. Pitch your topic with ease and precision using this Blockchain Platform For Industries Process Flow For Retail Initiatives Graphics PDF. This layout presents information on Traditional Loyalty Program, Inform Customers, Across Services. It is also available for immediate download and adjustment. So, changes can be made in the color, design, graphics or any other component to create a unique layout.
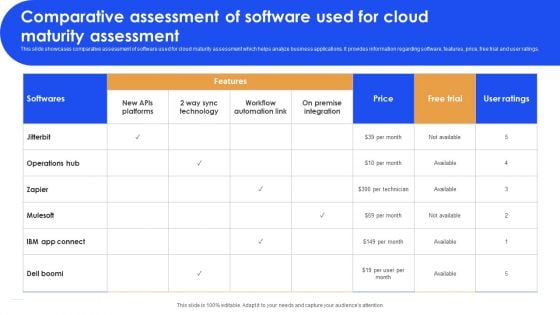
Comparative Assessment Of Software Used For Cloud Maturity Assessment Graphics PDF
This slide showcases comparative assessment of software used for cloud maturity assessment which helps analyze business applications. It provides information regarding software, features, price, free trial and user ratings. Pitch your topic with ease and precision using this Comparative Assessment Of Software Used For Cloud Maturity Assessment Graphics PDF. This layout presents information on Softwares, Features, Free Trial. It is also available for immediate download and adjustment. So, changes can be made in the color, design, graphics or any other component to create a unique layout.
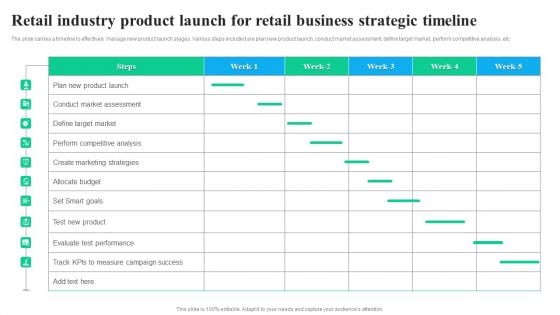
Retail Industry Product Launch For Retail Business Strategic Timeline Graphics PDF
The slide carries a timeline to effectively manage new product launch stages. Various steps included are plan new product launch, conduct market assessment, define target market, perform competitive analysis, etc. Pitch your topic with ease and precision using this Retail Industry Product Launch For Retail Business Strategic Timeline Graphics PDF. This layout presents information on Retail Industry, Product Launch, Retail Business, Strategic Timeline. It is also available for immediate download and adjustment. So, changes can be made in the color, design, graphics or any other component to create a unique layout
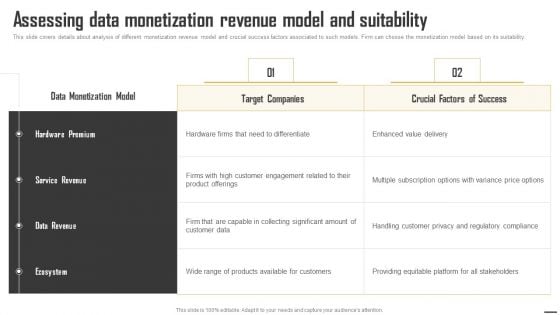
Data Monetization And Management Assessing Data Monetization Revenue Model Graphics PDF
This slide covers details about analysis of different monetization revenue model and crucial success factors associated to such models. Firm can choose the monetization model based on its suitability. Create an editable Data Monetization And Management Assessing Data Monetization Revenue Model Graphics PDF that communicates your idea and engages your audience. Whether youre presenting a business or an educational presentation, pre-designed presentation templates help save time. Data Monetization And Management Assessing Data Monetization Revenue Model Graphics PDF is highly customizable and very easy to edit, covering many different styles from creative to business presentations. Slidegeeks has creative team members who have crafted amazing templates. So, go and get them without any delay.
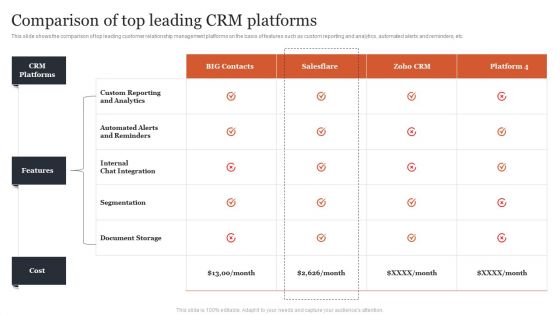
Managing Customer Attrition Comparison Of Top Leading Crm Platforms Graphics PDF
This slide shows the comparison of top leading customer relationship management platforms on the basis of features such as custom reporting and analytics, automated alerts and reminders, etc. Create an editable Managing Customer Attrition Comparison Of Top Leading Crm Platforms Graphics PDF that communicates your idea and engages your audience. Whether youre presenting a business or an educational presentation, pre-designed presentation templates help save time. Managing Customer Attrition Comparison Of Top Leading Crm Platforms Graphics PDF is highly customizable and very easy to edit, covering many different styles from creative to business presentations. Slidegeeks has creative team members who have crafted amazing templates. So, go and get them without any delay.
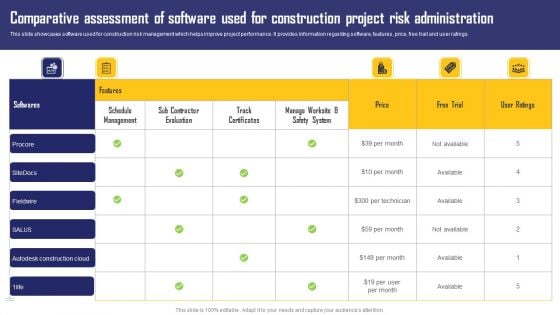
Comparative Assessment Of Software Used For Construction Project Risk Administration Graphics PDF
This slide showcases software used for construction risk management which helps improve project performance. It provides information regarding software, features, price, free trail and user ratings. Pitch your topic with ease and precision using this Comparative Assessment Of Software Used For Construction Project Risk Administration Graphics PDF. This layout presents information on Price, Schedule Management, Safety System. It is also available for immediate download and adjustment. So, changes can be made in the color, design, graphics or any other component to create a unique layout.
Project Tracking And Control Report Showing Accomplishments And Issues Faced Graphics PDF
This slide delineates project monitoring and control report which shows various types of projects undertaken by organization, project objectives, status, accomplishments, issues faced and action plan. Business organization can take appropriate actions when projects deviates from the actual plan. Pitch your topic with ease and precision using this Project Tracking And Control Report Showing Accomplishments And Issues Faced Graphics PDF. This layout presents information on System, Budget, Management. It is also available for immediate download and adjustment. So, changes can be made in the color, design, graphics or any other component to create a unique layout.
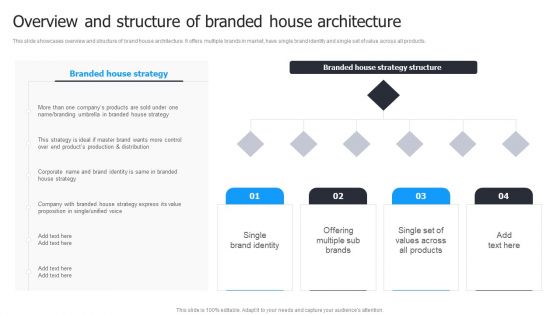
Multi Brand Launch Strateic Plan Overview And Structure Of Branded House Architecture Graphics PDF
Are you searching for a Multi Brand Launch Strateic Plan Overview And Structure Of Branded House Architecture Graphics PDF that is uncluttered, straightforward, and original. Its easy to edit, and you can change the colors to suit your personal or business branding. For a presentation that expresses how much effort youve put in, this template is ideal. With all of its features, including tables, diagrams, statistics, and lists, its perfect for a business plan presentation. Make your ideas more appealing with these professional slides. Download Multi Brand Launch Strateic Plan Overview And Structure Of Branded House Architecture Graphics PDF from Slidegeeks today.
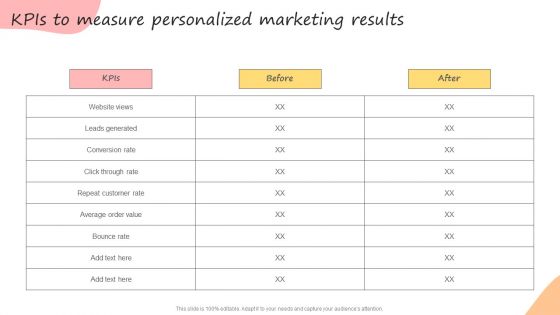
Developing Promotional Strategic Plan For Online Marketing Kpis To Measure Personalized Graphics PDF
Explore a selection of the finest Developing Promotional Strategic Plan For Online Marketing Kpis To Measure Personalized Graphics PDF here. With a plethora of professionally designed and pre-made slide templates, you can quickly and easily find the right one for your upcoming presentation. You can use our Developing Promotional Strategic Plan For Online Marketing Kpis To Measure Personalized Graphics PDF to effectively convey your message to a wider audience. Slidegeeks has done a lot of research before preparing these presentation templates. The content can be personalized and the slides are highly editable. Grab templates today from Slidegeeks.
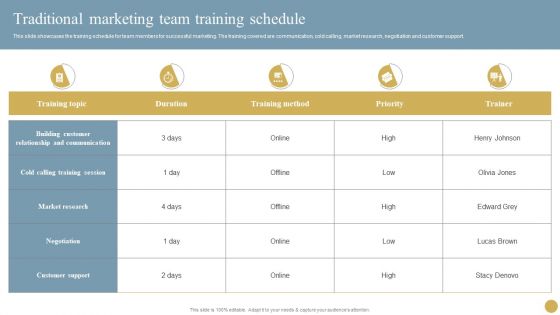
Optimizing Traditional Media To Boost Sales Traditional Marketing Team Training Schedule Graphics PDF
Get a simple yet stunning designed Optimizing Traditional Media To Boost Sales Traditional Marketing Team Training Schedule Graphics PDF. It is the best one to establish the tone in your meetings. It is an excellent way to make your presentations highly effective. So, download this PPT today from Slidegeeks and see the positive impacts. Our easy-to-edit Optimizing Traditional Media To Boost Sales Traditional Marketing Team Training Schedule Graphics PDF can be your go-to option for all upcoming conferences and meetings. So, what are you waiting for. Grab this template today.
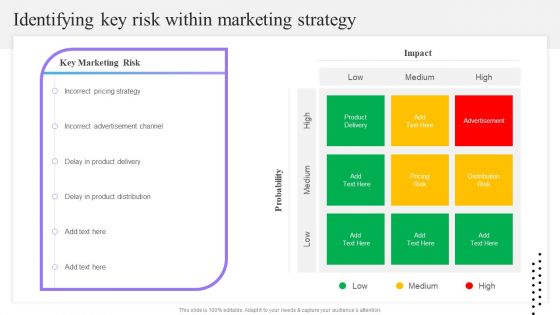
Content And Permission Marketing Tactics For Enhancing Business Ridentifying Key Risk Within Marketing Strategy Graphics PDF
Are you searching for a Content And Permission Marketing Tactics For Enhancing Business Ridentifying Key Risk Within Marketing Strategy Graphics PDF that is uncluttered, straightforward, and original Its easy to edit, and you can change the colors to suit your personal or business branding. For a presentation that expresses how much effort you have put in, this template is ideal With all of its features, including tables, diagrams, statistics, and lists, its perfect for a business plan presentation. Make your ideas more appealing with these professional slides. Download Content And Permission Marketing Tactics For Enhancing Business Ridentifying Key Risk Within Marketing Strategy Graphics PDF from Slidegeeks today.
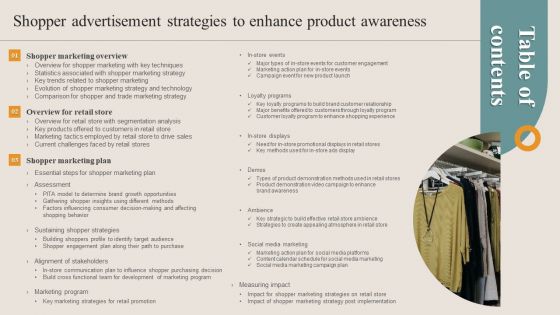
Table Of Contents Shopper Advertisement Strategies To Enhance Product Awareness Graphics PDF
Crafting an eye-catching presentation has never been more straightforward. Let your presentation shine with this tasteful yet straightforward Table Of Contents Shopper Advertisement Strategies To Enhance Product Awareness Graphics PDF template. It offers a minimalistic and classy look that is great for making a statement. The colors have been employed intelligently to add a bit of playfulness while still remaining professional. Construct the ideal Table Of Contents Shopper Advertisement Strategies To Enhance Product Awareness Graphics PDF that effortlessly grabs the attention of your audience Begin now and be certain to wow your customers.
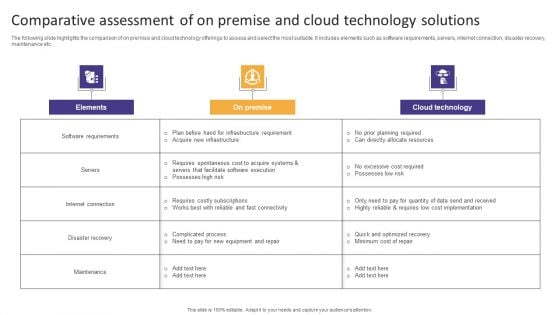
Comparative Assessment Of On Premise And Cloud Technology Solutions Graphics PDF
The following slide highlights the comparison of on premise and cloud technology offerings to assess and select the most suitable. It includes elements such as software requirements, servers, internet connection, disaster recovery, maintenance etc. Pitch your topic with ease and precision using this Comparative Assessment Of On Premise And Cloud Technology Solutions Graphics PDF. This layout presents information on Internet Connection, Disaster Recovery, Server. It is also available for immediate download and adjustment. So, changes can be made in the color, design, graphics or any other component to create a unique layout.


 Continue with Email

 Home
Home


