Graphics
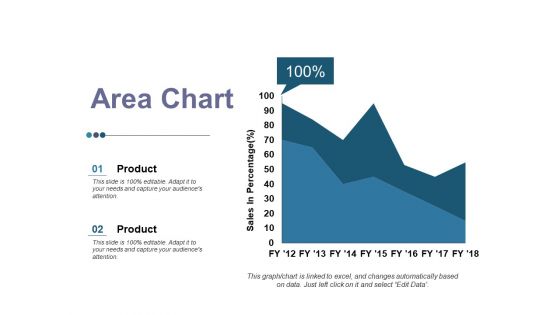
Area Chart Ppt PowerPoint Presentation Inspiration Graphics
This is a area chart ppt powerpoint presentation inspiration graphics. This is a two stage process. The stages in this process are product, area chart, business, growth, sales in percentage.

Our Team Ppt PowerPoint Presentation Pictures Graphics
This is a our team ppt powerpoint presentation pictures graphics. This is a three stages process. The stages in this process are our team, editor, engineer, manager, communication, team work.
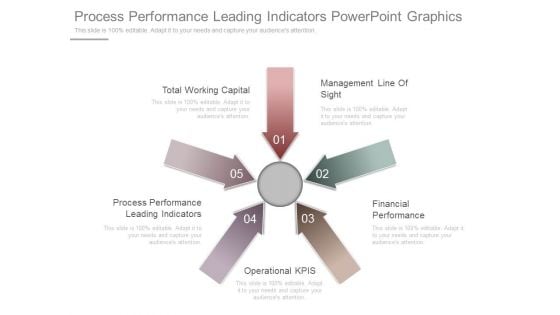
Process Performance Leading Indicators Powerpoint Graphics
This is a process performance leading indicators powerpoint graphics. This is a five stage process. The stages in this process are total working capital, management line of sight, process performance leading indicators, financial performance, operational kpis.
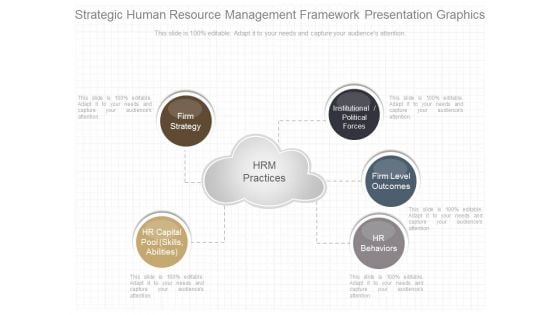
Strategic Human Resource Management Framework Presentation Graphics
This is a strategic human resource management framework presentation graphics. This is a one stage process. The stages in this process are firm strategy, hr capital pool, hr behaviors, firm level outcomes, institutional political forces.
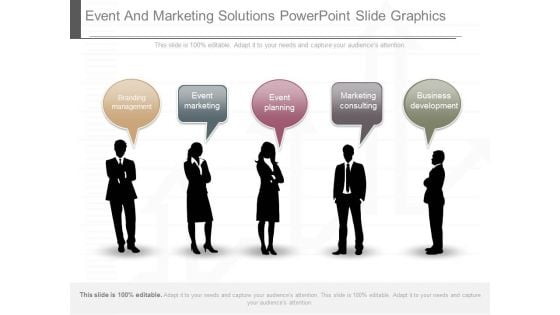
Event And Marketing Solutions Powerpoint Slide Graphics
This is an event and marketing solutions powerpoint slide graphics. This is a five stage process. The stages in this process are branding management, event marketing, event planning, marketing consulting, business development.
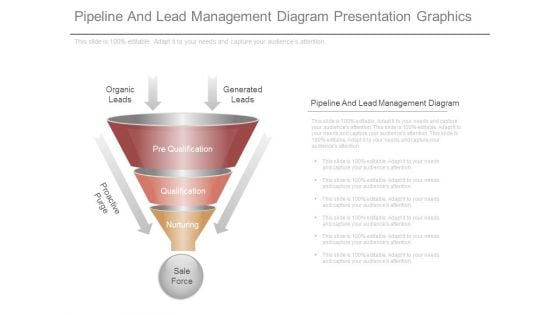
Pipeline And Lead Management Diagram Presentation Graphics
This is a pipeline and lead management diagram presentation graphics. This is a three stage process. The stages in this process are generated leads, leads organic, pre qualification, qualification, nurturing, proactive purge, force sale .
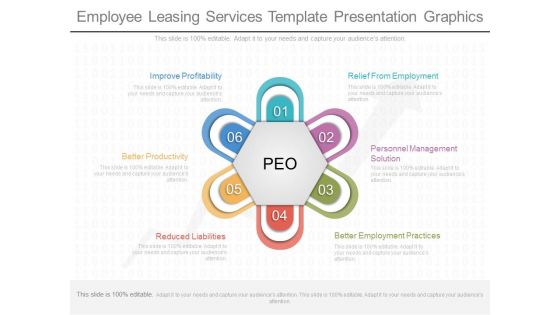
Employee Leasing Services Template Presentation Graphics
This is a employee leasing services template presentation graphics. This is a six stage process. The stages in this process are improve profitability, better productivity, reduced liabilities, relief from employment, personnel management solution, better employment practices.
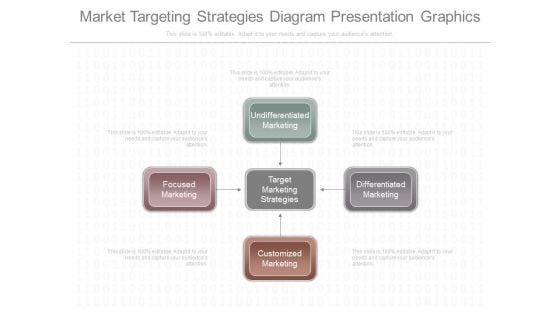
Market Targeting Strategies Diagram Presentation Graphics
This is a market targeting strategies diagram presentation graphics. This is a four stage process. The stages in this process are undifferentiated marketing, target marketing strategies, focused marketing, customized marketing, differentiated marketing.
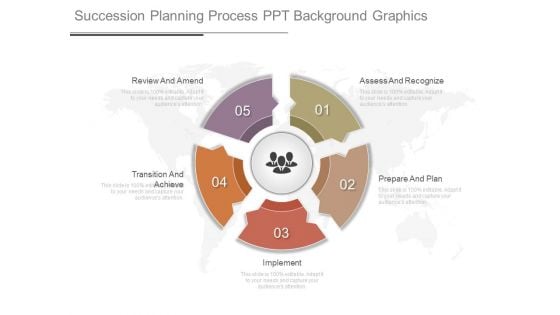
Succession Planning Process Ppt Background Graphics
This is a succession planning process ppt background graphics. This is a five stage process. The stages in this process are review and amend, transition and achieve, assess and recognize, prepare and plan, implement.
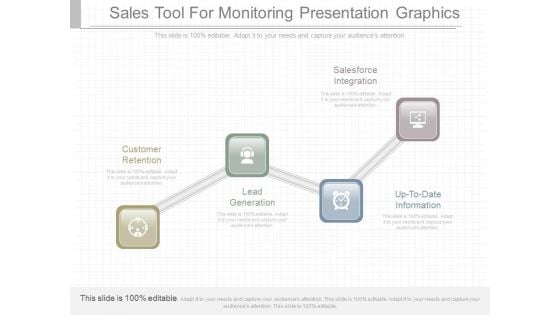
Sales Tool For Monitoring Presentation Graphics
This is a sales tool for monitoring presentation graphics. This is a four stage process. The stages in this process are customer retention, lead generation, up to date information, salesforce integration.
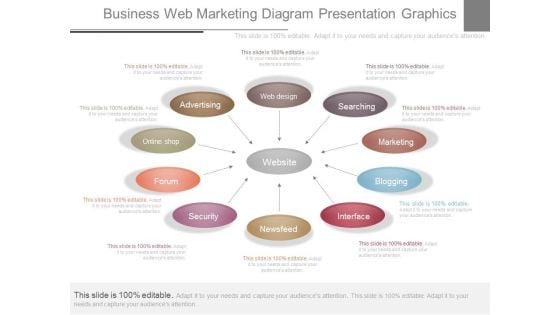
Business Web Marketing Diagram Presentation Graphics
This is a business web marketing diagram presentation graphics. This is a ten stage process. The stages in this process are web design, searching, marketing, blogging, interface, newsfeed, security, forum, online shop, advertising.
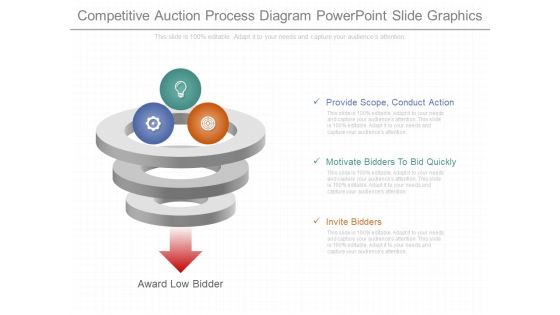
Competitive Auction Process Diagram Powerpoint Slide Graphics
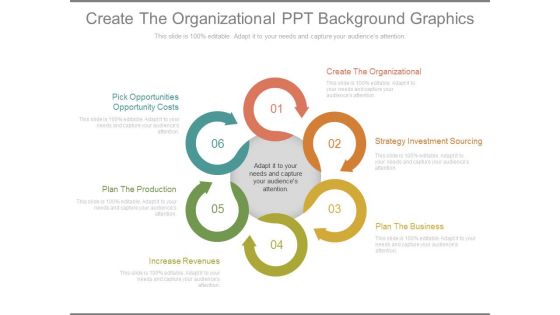
Create The Organizational Ppt Background Graphics
This is a create the organizational ppt background graphics. This is a six stage process. The stages in this process are pick opportunities opportunity costs, plan the production, increase revenues, create the organizational, create the organizational, plan the business.
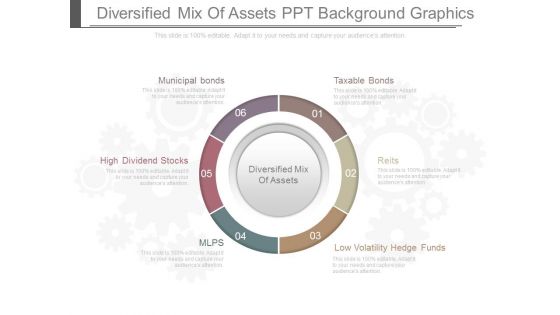
Diversified Mix Of Assets Ppt Background Graphics
This is a diversified mix of assets ppt background graphics. This is a six stage process. The stages in this process are diversified mix of assets, taxable bonds, reits, low volatility hedge funds, mlps, high dividend stocks, municipal bonds.

Go To Market Strategy Channels Powerpoint Graphics
This is a go to market strategy channels powerpoint graphics. This is a one stage process. The stages in this process are growth, social network, quality, our business, idea.
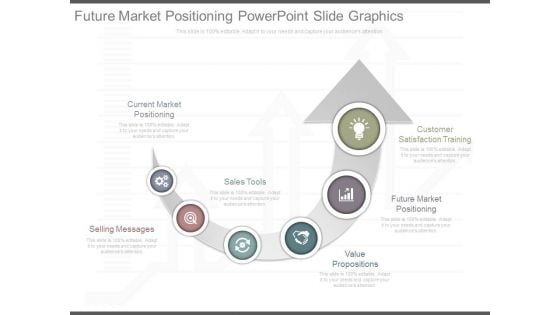
Future Market Positioning Powerpoint Slide Graphics
This is a future market positioning powerpoint slide graphics. This is a one stage process. The stages in this process are current market positioning, selling messages, sales tools, value propositions, future market positioning, customer satisfaction training.\n\n\n\n\n\n
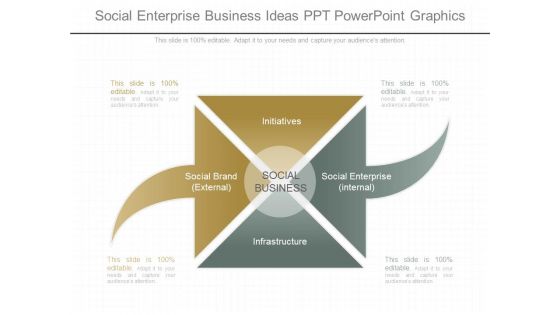
Social Enterprise Business Ideas Ppt Powerpoint Graphics
This is a social enterprise business ideas ppt powerpoint graphics. This is a four stage process. The stages in this process are social brand external, social business, initiatives, social enterprise internal, infrastructure.
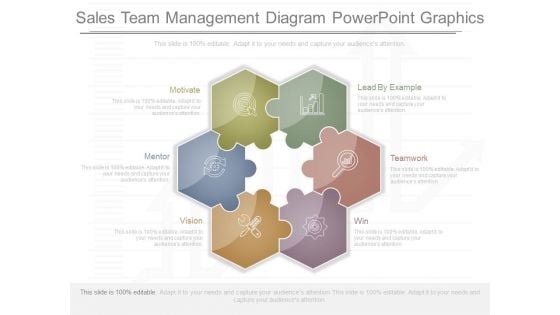
Sales Team Management Diagram Powerpoint Graphics
This is a sales team management diagram powerpoint graphics. This is a six stage process. The stages in this process are lead by example, teamwork, win, vision, mentor, motivate.
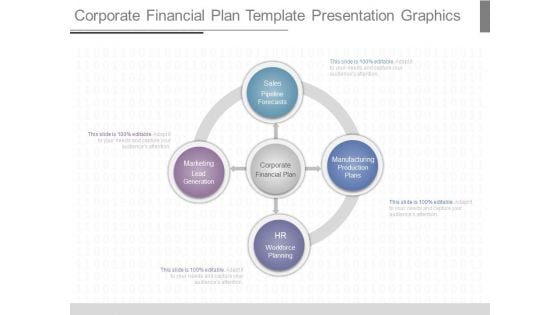
Corporate Financial Plan Template Presentation Graphics
This is a corporate financial plan template presentation graphics. This is a four stage process. The stages in this process are corporate financial plan, sales pipeline forecasts, manufacturing production plans, hr workforce planning, marketing lead generation.
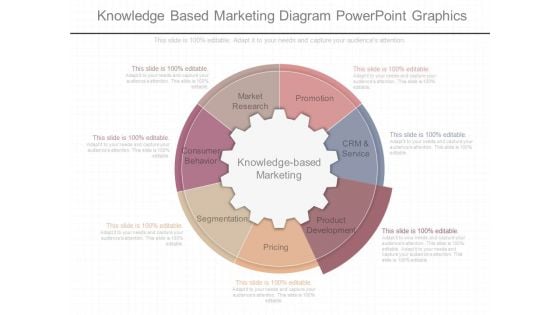
Knowledge Based Marketing Diagram Powerpoint Graphics
This is a knowledge based marketing diagram powerpoint graphics. This is a seven stage process. The stages in this process are market research, promotion, consumer behavior, knowledge based marketing, segmentation, pricing, product development, crm and service.
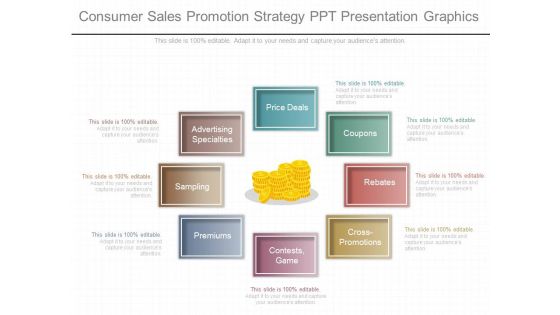
Consumer Sales Promotion Strategy Ppt Presentation Graphics
This is a consumer sales promotion strategy ppt presentation graphics. This is a eight stage process. The stages in this process are advertising specialties, price deals, sampling, premiums, contests, game, cross promotions, rebates, coupons.\n\n\n
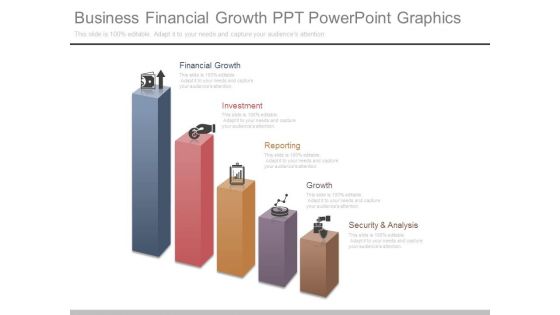
Business Financial Growth Ppt Powerpoint Graphics
This is a business financial growth ppt powerpoint graphics. This is a five stage process. The stages in this process are financial growth, investment, reporting, growth, security and analysis.
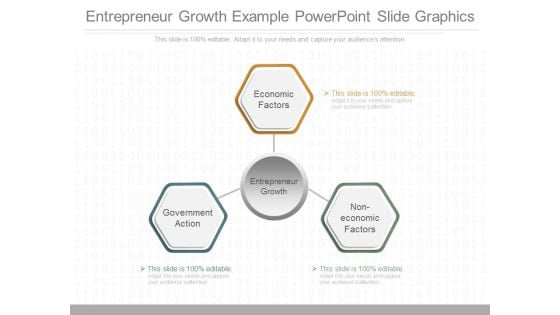
Entrepreneur Growth Example Powerpoint Slide Graphics
This is a entrepreneur growth example powerpoint slide graphics. This is a three stage process. The stages in this process are economic factors, entrepreneur growth, government action, non economic factors.
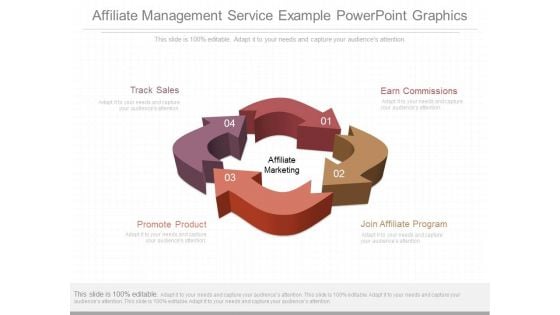
Affiliate Management Service Example Powerpoint Graphics
This is a affiliate management service example powerpoint graphics. This is a four stage process. The stages in this process are earn commissions, join affiliate program, promote product, track sales.
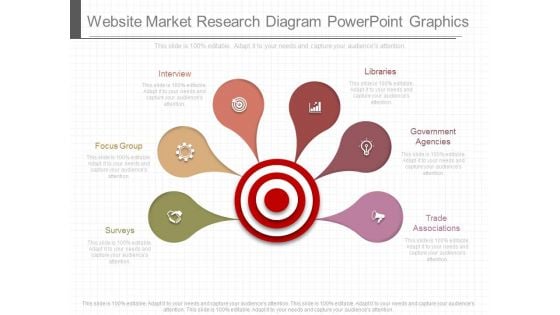
Website Market Research Diagram Powerpoint Graphics
This is a website market research diagram powerpoint graphics. This is a six stage process. The stages in this process are interview, focus group, surveys, libraries, government agencies, trade associations.
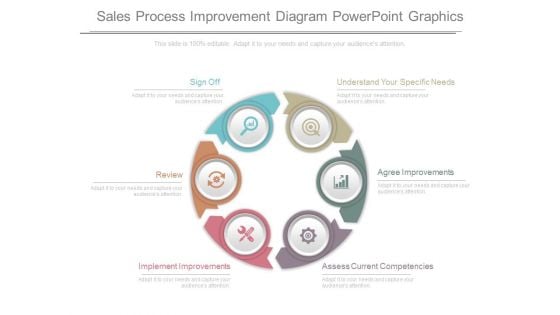
Sales Process Improvement Diagram Powerpoint Graphics
This is a sales process improvement diagram powerpoint graphics. This is a six stage process. The stages in this process are sign off, understand your specific needs, review, agree improvements, implement improvements, assess current competencies.
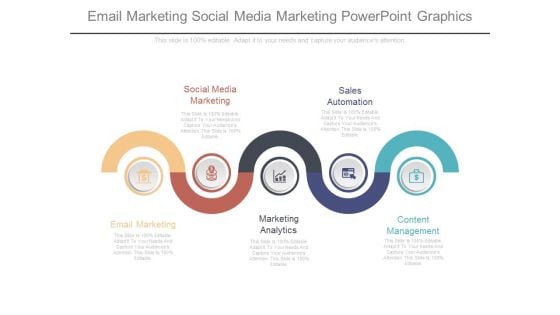
Email Marketing Social Media Marketing Powerpoint Graphics
This is a email marketing social media marketing powerpoint graphics. This is a five stage process. The stages in this process are social media marketing, sales automation, content management, marketing analytics, email marketing.
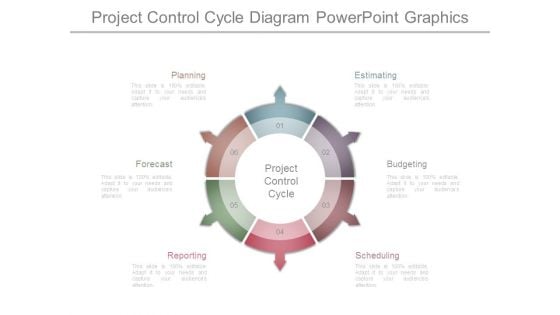
Project Control Cycle Diagram Powerpoint Graphics
This is a project control cycle diagram powerpoint graphics. This is a six stage process. The stages in this process are estimating, budgeting, scheduling, reporting, forecast, planning, project control cycle.
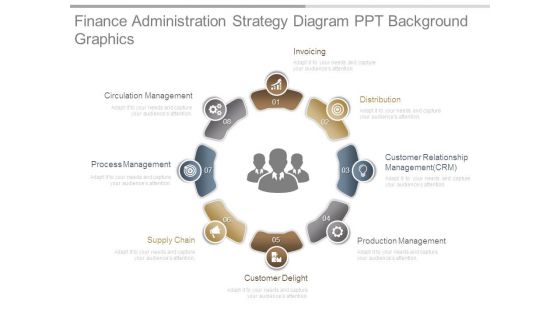
Finance Administration Strategy Diagram Ppt Background Graphics
This is a finance administration strategy diagram ppt background graphics. This is a eight stage process. The stages in this process are invoicing, distribution, customer relationship management crm, production management, customer delight, supply chain, process management, circulation management.
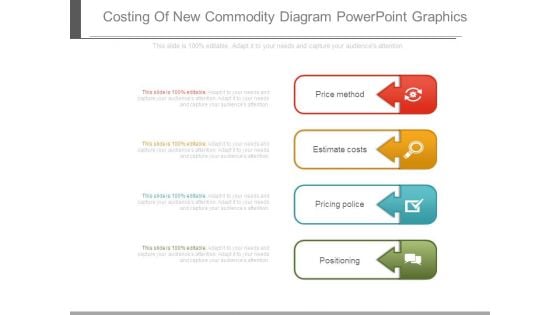
Costing Of New Commodity Diagram Powerpoint Graphics
This is a costing of new commodity diagram powerpoint graphics. This is a four stage process. The stages in this process are price method, estimate costs, pricing police, positioning.
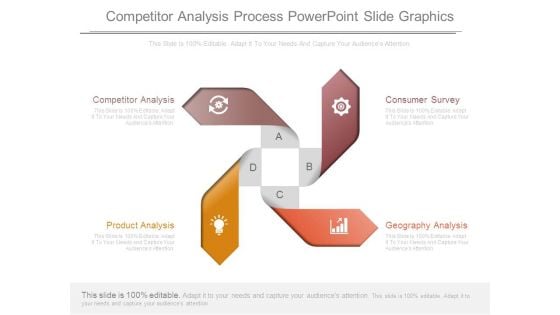
Competitor Analysis Process Powerpoint Slide Graphics
This is a competitor analysis process powerpoint slide graphics. This is a four stage process. The stages in this process are competitor analysis, product analysis, geography analysis, consumer survey.
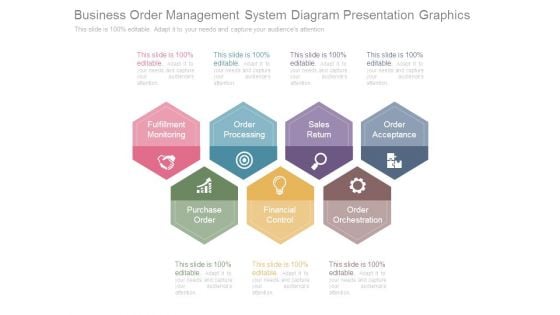
Business Order Management System Diagram Presentation Graphics
This is a business order management system diagram presentation graphics. This is a seven stage process. The stages in this process are fulfillment monitoring, order processing, sales return, order acceptance, purchase order, financial control, order orchestration.
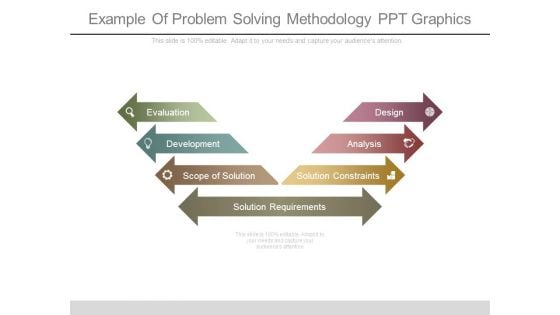
Example Of Problem Solving Methodology Ppt Graphics
This is a example of problem solving methodology ppt graphics. This is a four stage process. The stages in this process are evaluation, development, scope of solution, design, analysis, solution constraints, solution requirements.
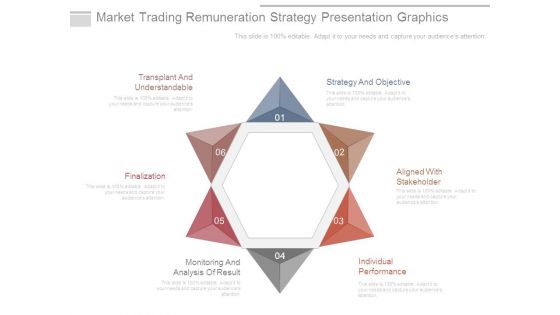
Market Trading Remuneration Strategy Presentation Graphics
This is a market trading remuneration strategy presentation graphics. This is a six stage process. The stages in this process are strategy and objective, aligned with stakeholder, individual performance, monitoring and analysis of result, finalization, transplant and understandable.
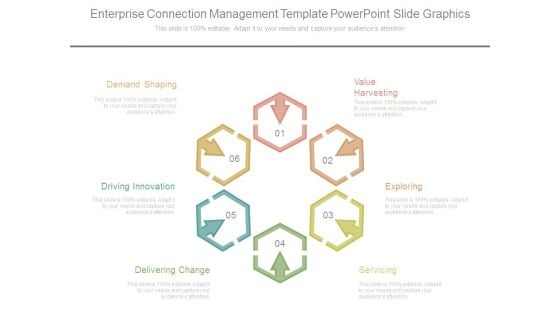
Enterprise Connection Management Template Powerpoint Slide Graphics
This is a enterprise connection management template powerpoint slide graphics. This is a six stage process. The stages in this process are value harvesting, exploring, servicing, delivering change, driving innovation, demand shaping.
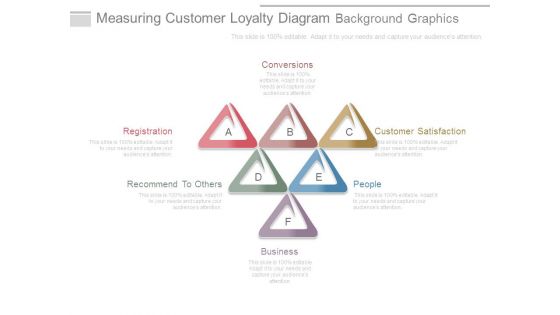
Measuring Customer Loyalty Diagram Background Graphics
This is a measuring customer loyalty diagram background graphics. This is a six stage process. The stages in this process are conversions, registration, recommend to others, people, customer satisfaction, business.
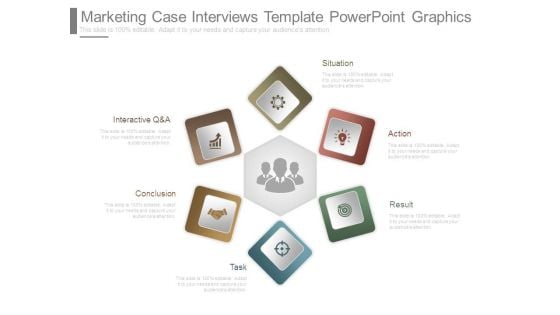
Marketing Case Interviews Template Powerpoint Graphics
This is a marketing case interviews template powerpoint graphics. This is a six stage process. The stages in this process are interactive q and a, conclusion, task, situation, action, result.
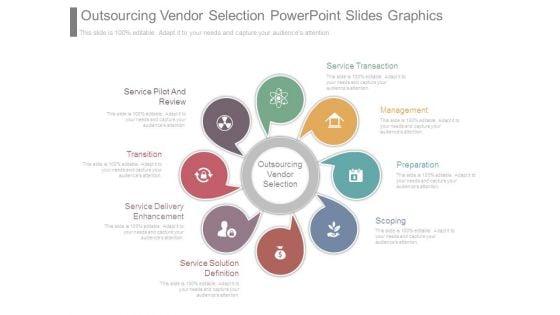
Outsourcing Vendor Selection Powerpoint Slides Graphics
This is a outsourcing vendor selection powerpoint slides graphics. This is a eight stage process. The stages in this process are service pilot and review, transition, service delivery enhancement, service solution definition, scoping, preparation, management, service transaction, outsourcing vendor selection.
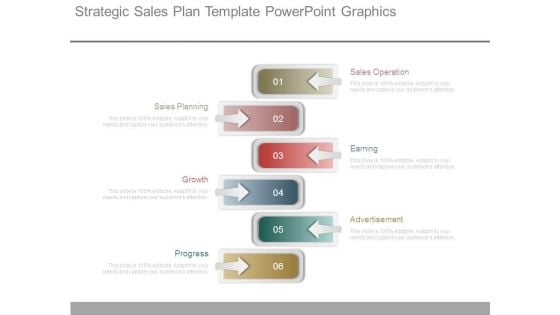
Strategic Sales Plan Template Powerpoint Graphics
This is a strategic sales plan template powerpoint graphics. This is a six stage process. The stages in this process are sales operation, earning, advertisement, progress, growth, sales planning.
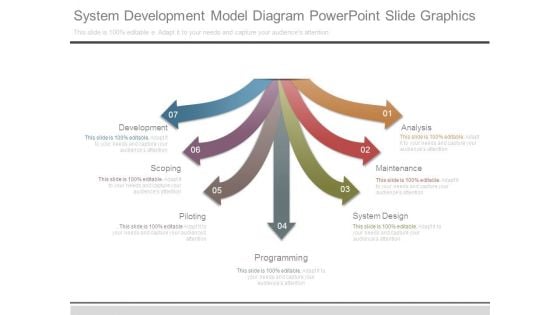
System Development Model Diagram Powerpoint Slide Graphics
This is a system development model diagram powerpoint slide graphics. This is a seven stage process. The stages in this process are development, scoping, piloting, programming, system design, maintenance, analysis.
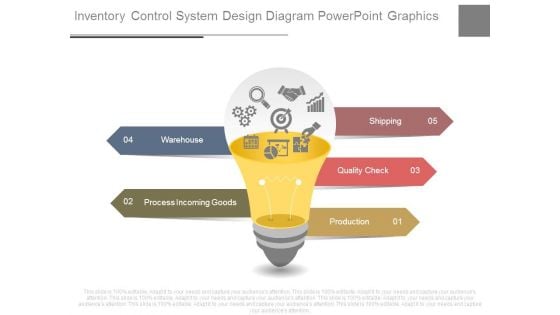
Inventory Control System Design Diagram Powerpoint Graphics
This is a inventory control system design diagram powerpoint graphics. This is a five stage process. The stages in this process are warehouse, process incoming goods, shipping, quality check, production.
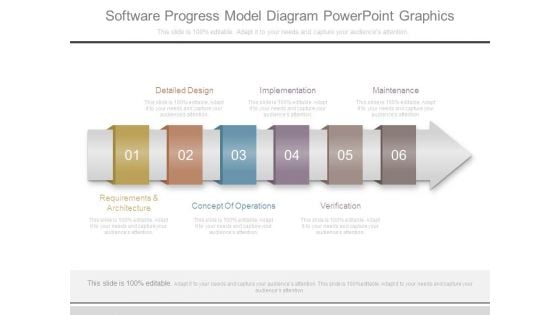
Software Progress Model Diagram Powerpoint Graphics
This is a software progress model diagram powerpoint graphics. This is a six stage process. The stages in this process are detailed design, implementation, maintenance, requirements and architecture, concept of operations, verification.
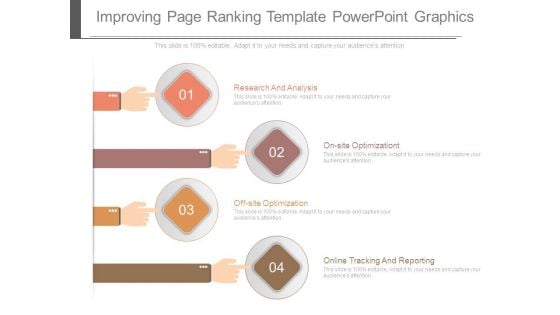
Improving Page Ranking Template Powerpoint Graphics
This is a improving page ranking template powerpoint graphics. This is a four stage process. The stages in this process are research and analysis, on site optimizationt, off site optimization, online tracking and reporting.
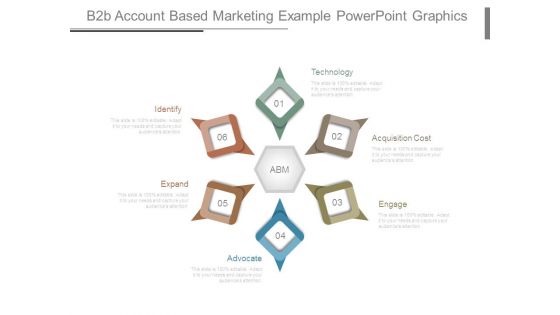
B2b Account Based Marketing Example Powerpoint Graphics
This is a b2b account based marketing example powerpoint graphics. This is a six stage process. The stages in this process are identify, expand, advocate, technology, acquisition cost, engage.
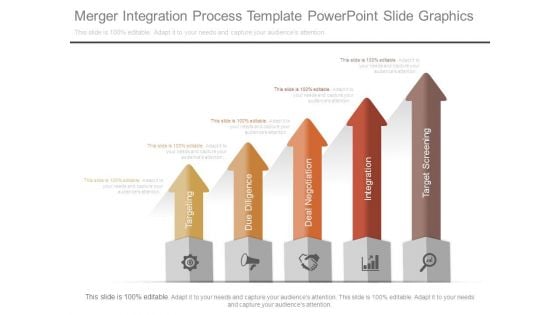
Merger Integration Process Template Powerpoint Slide Graphics
This is a merger integration process template powerpoint slide graphics. This is a five stage process. The stages in this process are targeting, due diligence, deal negotiation, integration, target screening.
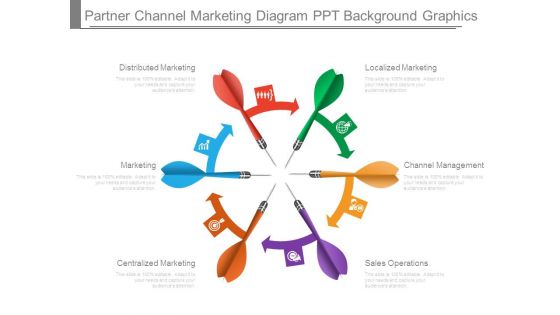
Partner Channel Marketing Diagram Ppt Background Graphics
This is a partner channel marketing diagram ppt background graphics. This is a six stage process. The stages in this process are localized marketing, channel management, sales operations, centralized marketing, marketing, distributed marketing.
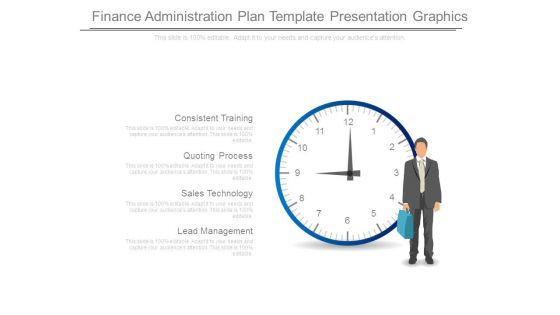
Finance Administration Plan Template Presentation Graphics
This is a finance administration plan template presentation graphics. This is a one stage process. The stages in this process are consistent training, quoting process, sales technology, lead management.
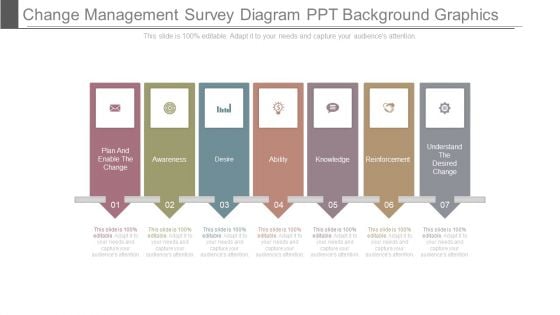
Change Management Survey Diagram Ppt Background Graphics
This is a change management survey diagram ppt background graphics. This is a seven stage process. The stages in this process are plan and enable the change, awareness, desire, ability, knowledge, reinforcement, understand the desired change.
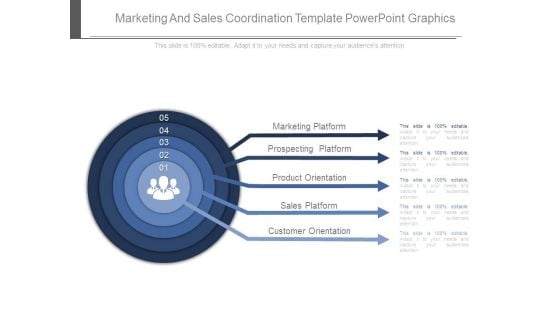
Marketing And Sales Coordination Template Powerpoint Graphics
This is a marketing and sales coordination template powerpoint graphics. This is a five stage process. The stages in this process are marketing platform, prospecting platform, product orientation, sales platform, customer orientation.
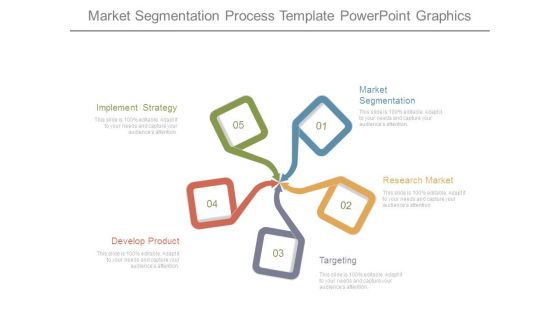
Market Segmentation Process Template Powerpoint Graphics
This is a market segmentation process template powerpoint graphics. This is a five stage process. The stages in this process are implement strategy, develop product, market segmentation, research market, targeting.
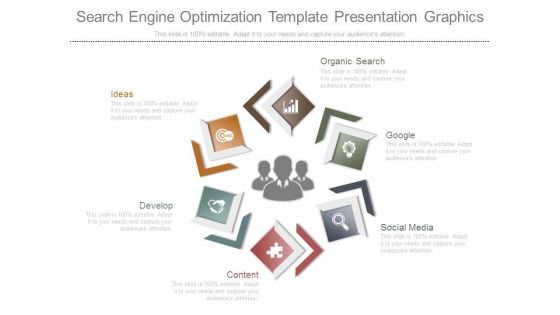
Search Engine Optimization Template Presentation Graphics
This is a search engine optimization template presentation graphics. This is a six stage process. The stages in this process are ideas, develop, content, social media, google, organic search.
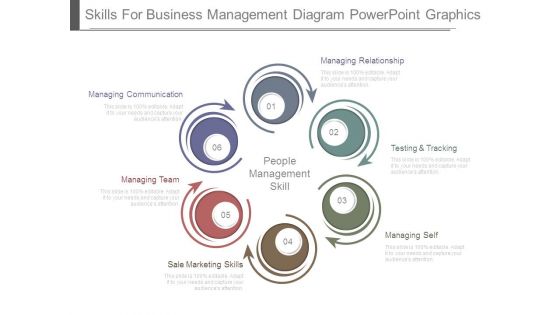
Skills For Business Management Diagram Powerpoint Graphics
This is a skills for business management diagram powerpoint graphics. This is a six stage process. The stages in this process are managing relationship, testing and tracking, managing self, sale marketing skills, managing team, managing communication, people management skill.
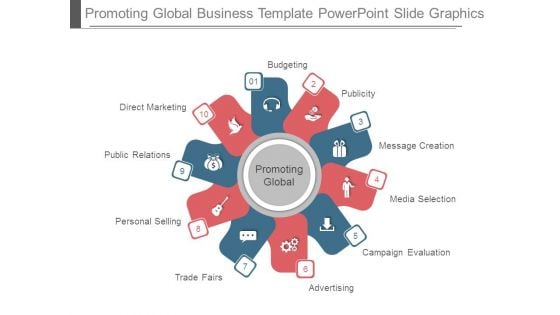
Promoting Global Business Template Powerpoint Slide Graphics
This is a promoting global business template powerpoint slide graphics. This is a ten stage process. The stages in this process are budgeting, publicity, message creation, media selection, campaign evaluation, advertising, trade fairs, personal selling, public relations, direct marketing.
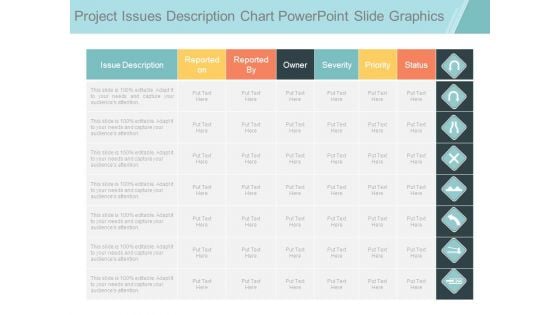
Project Issues Description Chart Powerpoint Slide Graphics
This is a project issues description chart powerpoint slide graphics. This is a seven stage process. The stages in this process are issue description, reported on, reported by, owner, severity, priority, status.

Brainstorming Session Weighted Scoring Model Presentation Graphics
This is a brainstorming session weighted scoring model presentation graphics. This is a three stage process. The stages in this process are ideas, merits, demerits, implications, probable, outcomes, score.
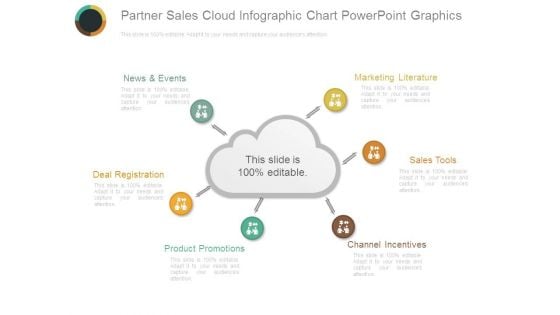
Partner Sales Cloud Infographic Chart Powerpoint Graphics
This is a partner sales cloud infographic chart powerpoint graphics. This is a six stage process. The stages in this process are news and events, marketing literature, sales tools, channel incentives, product promotions, deal registration.
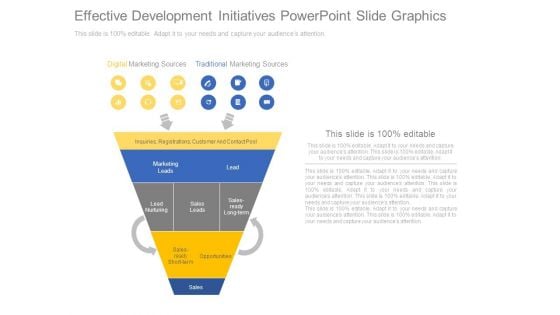
Effective Development Initiatives Powerpoint Slide Graphics
This is a effective development initiatives powerpoint slide graphics. This is a two stage process. The stages in this process are digital marketing sources, traditional marketing sources, marketing leads, sales ready long term, opportunities, sales.
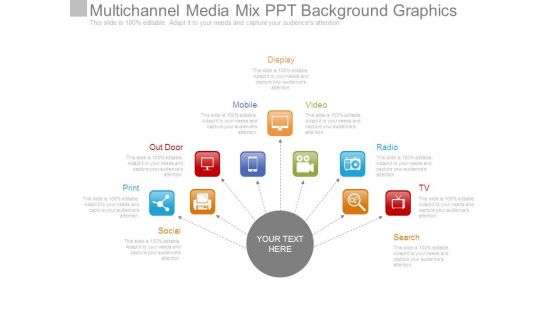
Multichannel Media Mix Ppt Background Graphics
This is a multichannel media mix ppt background graphics. This is a nine stage process. The stages in this process are social, print, out door, mobile, display, video, radio, tv, search.
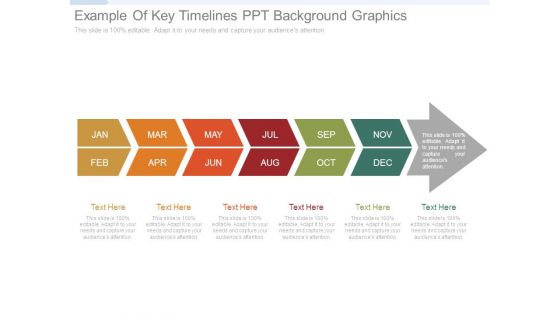
Example Of Key Timelines Ppt Background Graphics
This is a example of key timelines ppt background graphics. This is a six stage process. The stages in this process are jan, feb, mar, apr, may, jun, jul, aug, sep, oct, nov, dec.
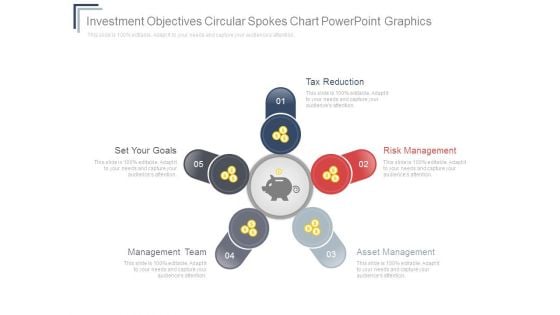
Investment Objectives Circular Spokes Chart Powerpoint Graphics
This is a investment objectives circular spokes chart powerpoint graphics. This is a five stage process. The stages in this process are tax reduction, set your goals, management team, asset management, risk management.


 Continue with Email

 Home
Home


