Graphics
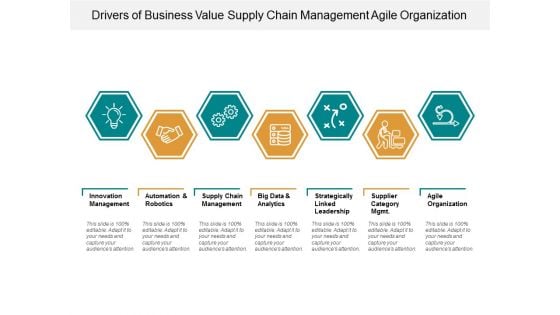
Drivers Of Business Value Supply Chain Management Agile Organization Ppt Powerpoint Presentation Infographic Template Graphics
This is a drivers of business value supply chain management agile organization ppt powerpoint presentation infographic template graphics. This is a seven stage process. The stages in this process are value drivers, utility drivers, worth drivers.
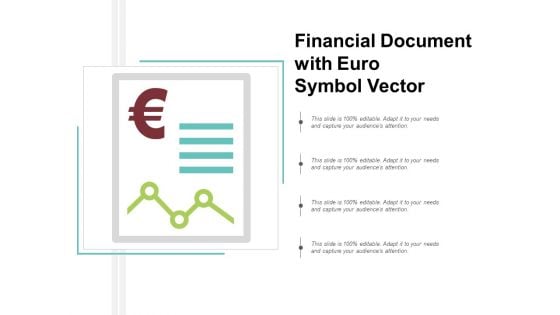
Financial Document With Euro Symbol Vector Ppt Powerpoint Presentation Inspiration Graphics
This is a financial document with euro symbol vector ppt powerpoint presentation inspiration graphics. This is a four stage process. The stages in this process are financial statements icon, accounting ratio icon, balance sheet icon.
Three Steps For Retail Process Implementation With Icons Ppt Powerpoint Presentation File Graphics
This is a three steps for retail process implementation with icons ppt powerpoint presentation file graphics. This is a three stage process. The stages in this process are retail execution, trading steps, merchandising plan.
Data Warehousing And Data Management Icons Ppt PowerPoint Presentation Styles Graphics
This is a data warehousing and data management icons ppt powerpoint presentation styles graphics. This is a two stage process. The stages in this process are data flow, data management, big data.
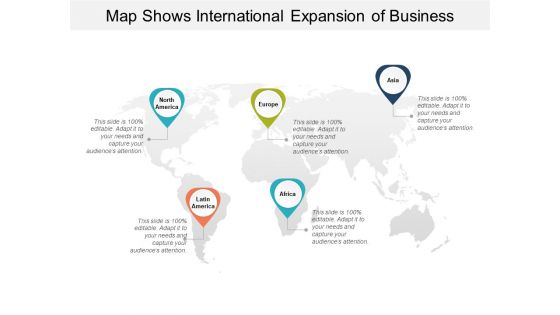
Map Shows International Expansion Of Business Ppt Powerpoint Presentation Portfolio Graphics
This is a map shows international expansion of business ppt powerpoint presentation portfolio graphics. This is a five stage process. The stages in this process are expanding, business development, business expansion.

Policy Structure With Procedure Requirements And Documentation Ppt Powerpoint Presentation Inspiration Graphics
This is a policy structure with procedure requirements and documentation ppt powerpoint presentation inspiration graphics. This is a five stage process. The stages in this process are policy framework, policy model, policy structure.
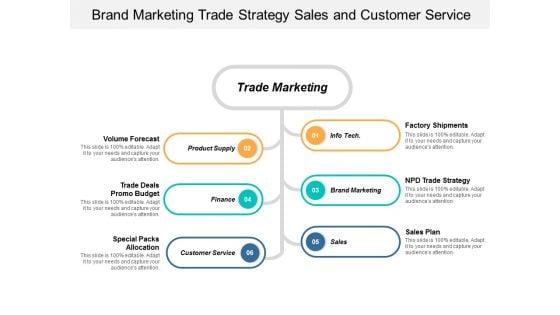
Brand Marketing Trade Strategy Sales And Customer Service Ppt Powerpoint Presentation Outline Graphics
This is a brand marketing trade strategy sales and customer service ppt powerpoint presentation outline graphics. This is a five stage process. The stages in this process are trade marketing strategy, trade promotion strategy, trade sales plan.
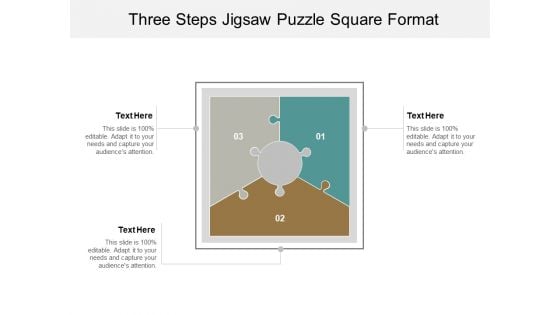
Three Steps Jigsaw Puzzle Square Format Ppt PowerPoint Presentation Slides Graphics
This is a three steps jigsaw puzzle square format ppt powerpoint presentation slides graphics. This is a three stage process. The stages in this process are 5 pieces jigsaw puzzle, 5 parts jigsaw puzzle, 5 segments jigsaw puzzle.

Data Analysis And Interpretation Reviewed And Resolved Ppt PowerPoint Presentation Pictures Graphics
This is a data analysis and interpretation reviewed and resolved ppt powerpoint presentation pictures graphics. This is a four stage process. The stages in this process are data analysis, data review, data evaluation.
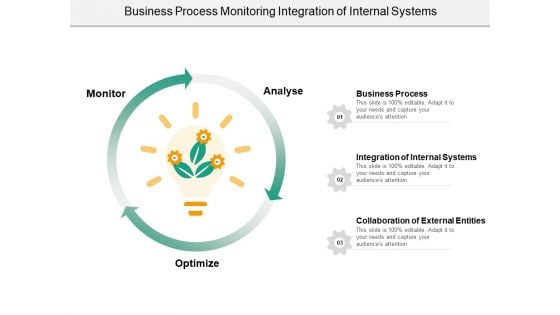
Business Process Monitoring Integration Of Internal Systems Ppt PowerPoint Presentation Ideas Graphics
This is a business process monitoring integration of internal systems ppt powerpoint presentation ideas graphics. This is a three stage process. The stages in this process are software development, business process automation, robotic process automation.
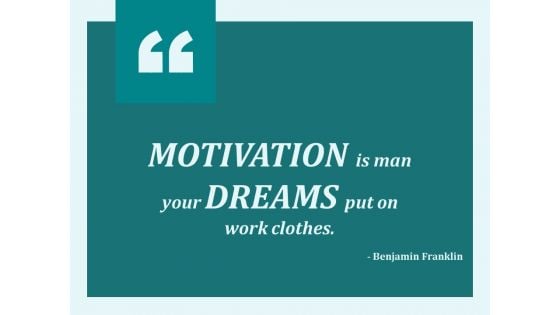
Motivation Is Man Your Dreams Put On Work Clothes Ppt PowerPoint Presentation Summary Graphics
This is a motivation is man your dreams put on work clothes ppt powerpoint presentation summary graphics. This is a one stage process. The stages in this process are business, management, marketing, communication.
Red Heart Shape With White Line And Stethoscope Ppt PowerPoint Presentation Infographics Graphics
This is a red heart shape with white line and stethoscope ppt powerpoint presentation infographics graphics. This is a four stage process. The stages in this process are health, heartbeat, pulse.
Bar Graph With Downward Arrow For Business Failure Ppt PowerPoint Presentation Inspiration Graphics
This is a bar graph with downward arrow for business failure ppt powerpoint presentation inspiration graphics. This is a four stage process. The stages in this process are business failure, unsuccessful business, business non success.
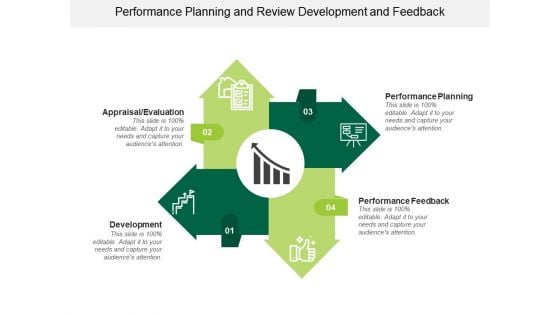
Performance Planning And Review Development And Feedback Ppt PowerPoint Presentation Pictures Graphics
This is a performance planning and review development and feedback ppt powerpoint presentation pictures graphics. This is a four stage process. The stages in this process are employee engagement, employee performance, employee evaluation.
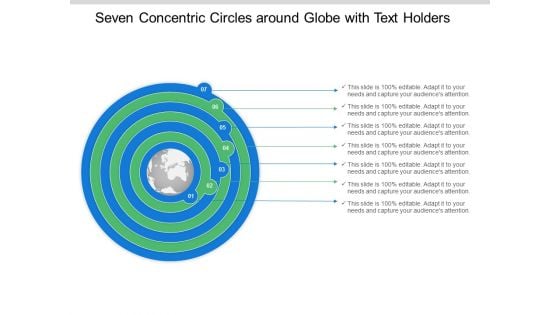
Seven Concentric Circles Around Globe With Text Holders Ppt Powerpoint Presentation Summary Graphics
This is a seven concentric circles around globe with text holders ppt powerpoint presentation summary graphics. This is a seven stage process. The stages in this process are 7 concentric circles, 7 circular cycle, 7 circular diagram.
Eight Concentric Circles For Social Media Audience Analysis Ppt PowerPoint Presentation Icon Graphics
This is a Eight Concentric Circles For Social Media Audience Analysis Ppt PowerPoint Presentation Icon Graphics. This is a stage process. The stages in this process are 7 concentric circles, 7 circular cycle, 7 circular diagram.
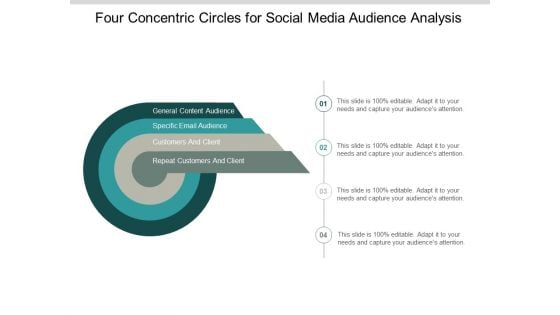
Four Concentric Circles For Social Media Audience Analysis Ppt PowerPoint Presentation Infographic Template Graphics
This is a Four Concentric Circles For Social Media Audience Analysis Ppt PowerPoint Presentation Infographic Template Graphics. This is a stage process. The stages in this process are 7 concentric circles, 7 circular cycle, 7 circular diagram.
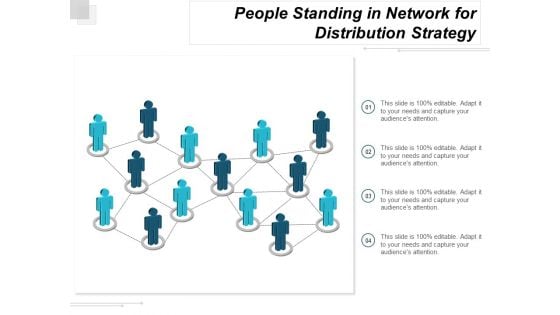
People Standing In Network For Distribution Strategy Ppt Powerpoint Presentation Portfolio Graphics
This is a people standing in network for distribution strategy ppt powerpoint presentation portfolio graphics. This is a four stage process. The stages in this process are retailer, producer, distribution channels, wholesaler, consumer.
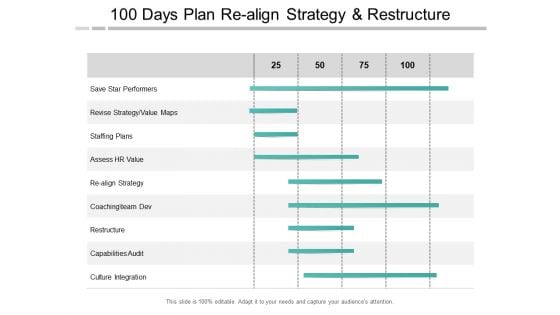
100 Days Strategy For Capabilities Audit And Culture Integration Ppt PowerPoint Presentation Inspiration Graphics
This is a 100 days strategy for capabilities audit and culture integration ppt powerpoint presentation inspiration graphics. This is a six stage process. The stages in this process are 100 day plan, 100 day action plan, 100 day strategy.

First 100 Days Strategy To Shaping The Team Culture Ppt PowerPoint Presentation Show Graphics
This is a first 100 days strategy to shaping the team culture ppt powerpoint presentation show graphics. This is a seven stage process. The stages in this process are 100 day plan, 100 day action plan, 100 day strategy.
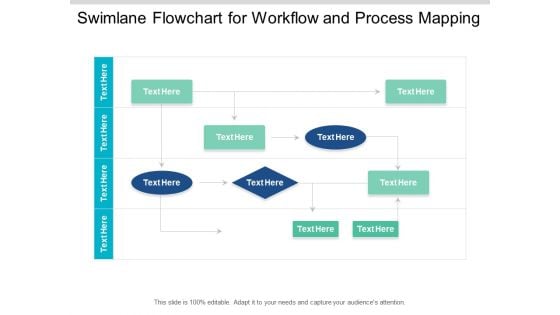
Swimlane Flowchart For Workflow And Process Mapping Ppt PowerPoint Presentation Infographic Template Graphics
This is a swimlane flowchart for workflow and process mapping ppt powerpoint presentation infographic template graphics. This is a four stage process. The stages in this process are swim lane diagram, flowchart, management.
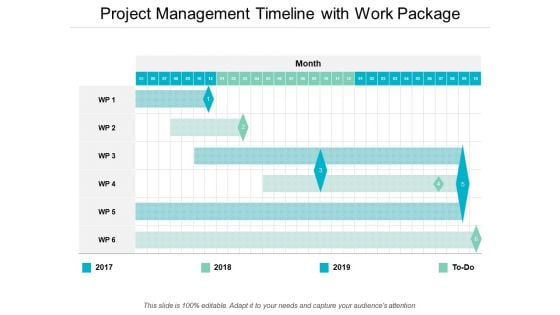
Project Management Timeline With Work Package Ppt PowerPoint Presentation Ideas Graphics
This is a project management timeline with work package ppt powerpoint presentation ideas graphics. This is a four stage process. The stages in this process are work package timeline, work package roadmap, tasks package timelines.
Three Stages 90 Days Action Plan With Icons Ppt PowerPoint Presentation Graphics
This is a three stages 90 days action plan with icons ppt powerpoint presentation graphics. This is a four stage process. The stages in this process are 90 day timeline, timeline, roadmap.
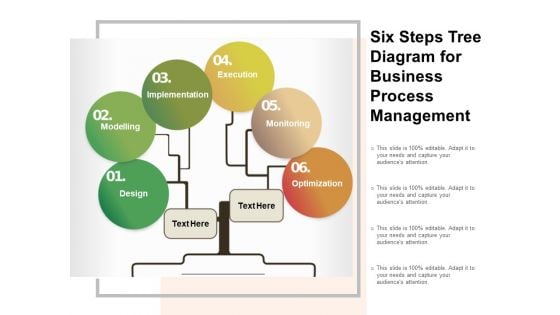
Six Steps Tree Diagram For Business Process Management Ppt PowerPoint Presentation Summary Graphics
This is a six steps tree diagram for business process management ppt powerpoint presentation summary graphics. This is a six stage process. The stages in this process are 6 steps, 6 phases, 6 segments.
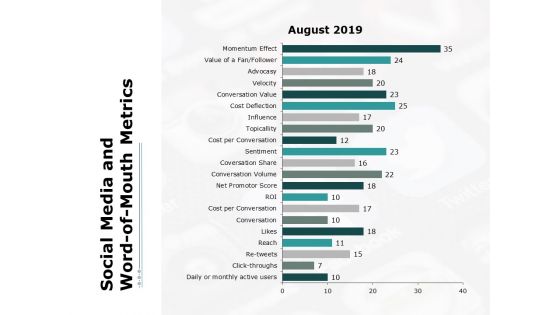
Social Media And Word Of Mouth Metrics Ppt PowerPoint Presentation Layouts Graphics
This is a social media and word of mouth metrics ppt powerpoint presentation layouts graphics. This is a three stage process. The stages in this process are finance, marketing, management, investment, analysis.
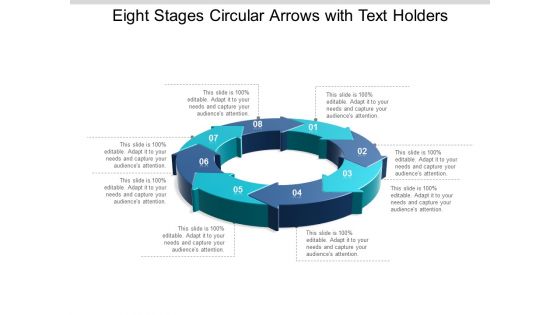
Eight Stages Circular Arrows With Text Holders Ppt Powerpoint Presentation Layouts Graphics
This is a eight stages circular arrows with text holders ppt powerpoint presentation layouts graphics. This is a eight stage process. The stages in this process are 6 circular arrows, 6 cyclic arrows, six circular arrows.
Eight Steps Of Sales Strategy With Icons Ppt Powerpoint Presentation Icon Graphics
This is a eight steps of sales strategy with icons ppt powerpoint presentation icon graphics. This is a eight stage process. The stages in this process are 7 point infographic, 7 steps infographic, 7 stages infographic.
Seven Steps Of Strategic Marketing Plan With Icons Ppt Powerpoint Presentation Model Graphics
This is a seven steps of strategic marketing plan with icons ppt powerpoint presentation model graphics. This is a seven stage process. The stages in this process are 7 point infographic, 7 steps infographic, 7 stages infographic.
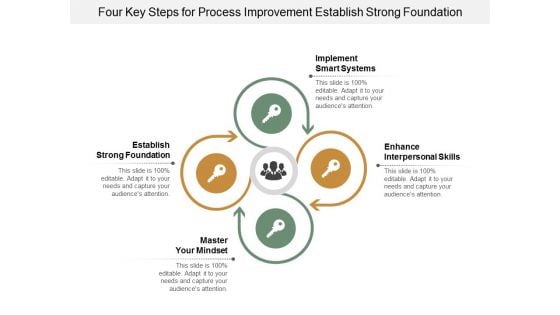
Four Key Steps For Process Improvement Establish Strong Foundation Ppt Powerpoint Presentation Slides Graphics
This is a four key steps for process improvement establish strong foundation ppt powerpoint presentation slides graphics. This is a four stage process. The stages in this process are eys for success, keys for achievement, highlights for success.
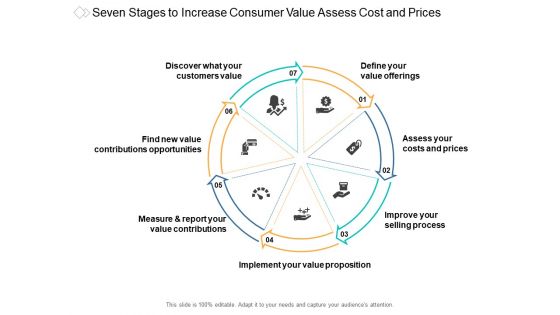
Seven Stages To Increase Consumer Value Assess Cost And Prices Ppt Powerpoint Presentation Summary Graphics
This is a seven stages to increase consumer value assess cost and prices ppt powerpoint presentation summary graphics. This is a seven stage process. The stages in this process are value creation, value lever, strategic lever.
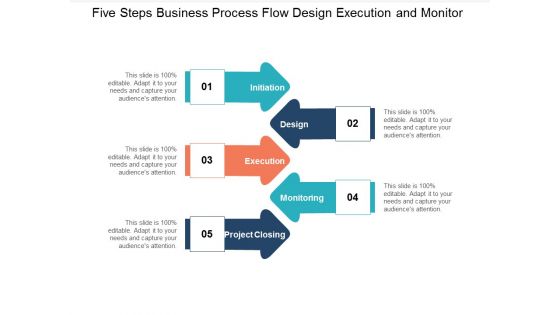
Five Steps Business Process Flow Design Execution And Monitor Ppt Powerpoint Presentation Slides Graphics
This is a five steps business process flow design execution and monitor ppt powerpoint presentation slides graphics. This is a five stage process. The stages in this process are arrow steps, arrow stages, arrow phases.
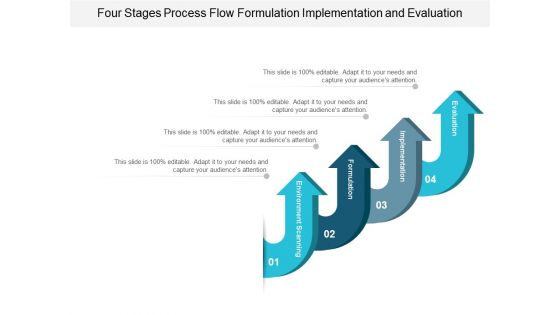
Four Stages Process Flow Formulation Implementation And Evaluation Ppt Powerpoint Presentation Pictures Graphics
This is a four stages process flow formulation implementation and evaluation ppt powerpoint presentation pictures graphics. This is a four stage process. The stages in this process are arrow steps, arrow stages, arrow phases.
Four Quarters Project Timeline With Icons Ppt Powerpoint Presentation Pictures Graphics
This is a four quarters project timeline with icons ppt powerpoint presentation pictures graphics. This is a four stage process. The stages in this process are block timeline, block roadmap, block linear process.
Audit Process Checklist With Magnifying Glass Vector Icon Ppt Powerpoint Presentation Gallery Graphics
This is a audit process checklist with magnifying glass vector icon ppt powerpoint presentation gallery graphics. This is a one stage process. The stages in this process are feedback loop icon, evaluation icon, assessment icon.
Business Infrastructure Management System With Icons Ppt Powerpoint Presentation Gallery Graphics
This is a business infrastructure management system with icons ppt powerpoint presentation gallery graphics. This is a three stage process. The stages in this process are business infrastructure, business building, company infrastructure.
Emoji Neutral Expression Bulb Vector Icon Ppt PowerPoint Presentation Model Graphics
This is a emoji neutral expression bulb vector icon ppt powerpoint presentation model graphics. This is a one stage process. The stages in this process are shapes, smile happy sad, neutral icon.
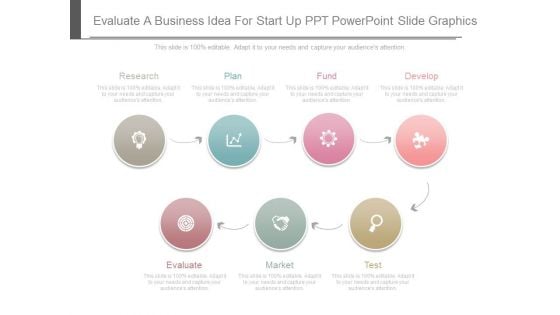
Evaluate A Business Idea For Start Up Ppt Powerpoint Slide Graphics
This is a evaluate a business idea for start up ppt powerpoint slide graphics. This is a seven stage process. The stages in this process are research, plan, fund, develop, evaluate, market, test.
Business People Silhouettes For Growth And Development Process Ppt PowerPoint Presentation Graphics
This is a business people silhouettes for growth and development process ppt powerpoint presentation graphics. This is a four stage process. The stages in this process are business, silhouettes, planning, management, development, process, success.
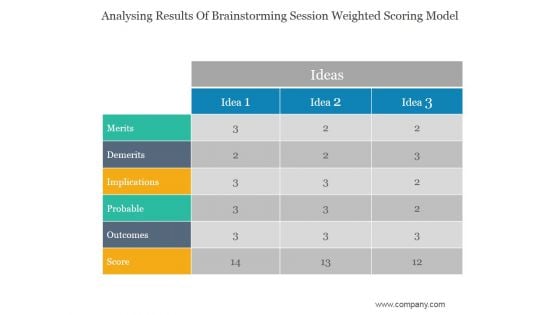
Analysing Results Of Brainstorming Session Weighted Scoring Model Ppt PowerPoint Presentation Graphics
This is a analysing results of brainstorming session weighted scoring model ppt powerpoint presentation graphics. This is a three stage process. The stages in this process are implications, merits, demerits, probable, score.
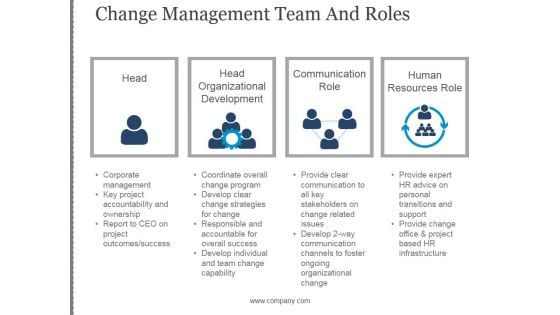
Change Management Team And Roles Template 2 Ppt PowerPoint Presentation Graphics
This is a change management team and roles template 2 ppt powerpoint presentation graphics. This is a four stage process. The stages in this process are head, head organizational development, communication role, human resources role.
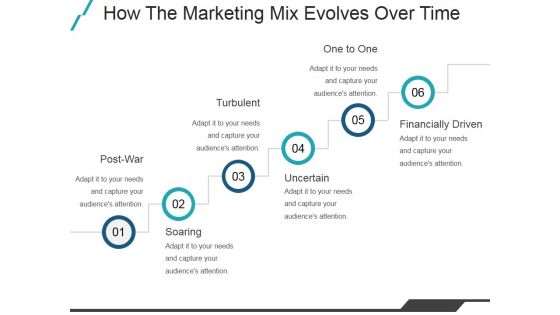
How The Marketing Mix Evolves Over Time Ppt PowerPoint Presentation Graphics
This is a how the marketing mix evolves over time ppt powerpoint presentation graphics. This is a six stage process. The stages in this process are turbulent, one to one, uncertain, financially driven.
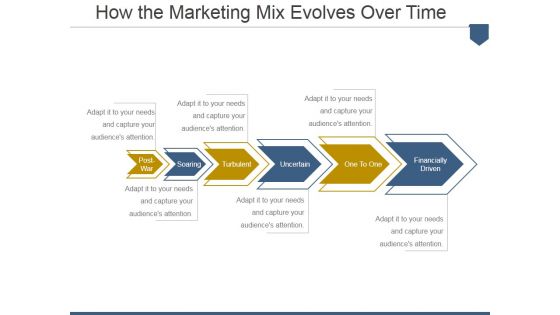
How The Marketing Mix Evolves Over Time Ppt PowerPoint Presentation Show Graphics
This is a how the marketing mix evolves over time ppt powerpoint presentation show graphics. This is a six stage process. The stages in this process are post war, soaring, turbulent, uncertain, one to one, financially driven.
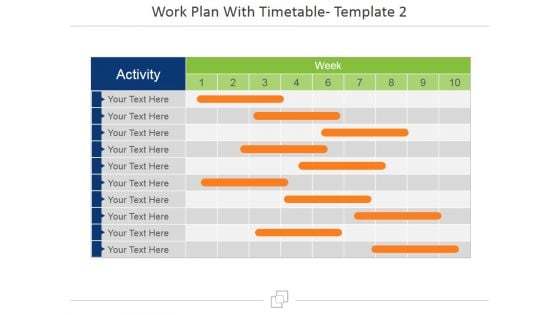
Work Plan With Timetable Template 2 Ppt PowerPoint Presentation Inspiration Graphics
This is a work plan with timetable template 2 ppt powerpoint presentation inspiration graphics. This is a ten stage process. The stages in this process are week, activity, business, marketing, table.
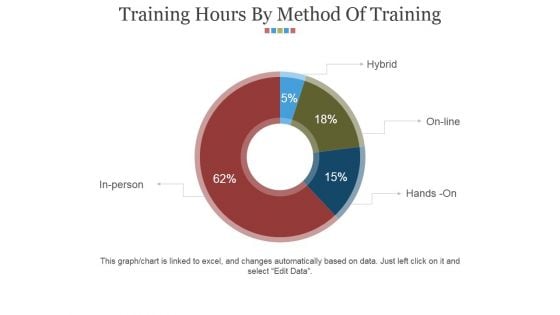
Training Hours By Method Of Training Ppt PowerPoint Presentation File Graphics
This is a training hours by method of training ppt powerpoint presentation file graphics. This is a four stage process. The stages in this process are hybrid, on line, hands on, in person.

Internal Sources Of New Product Ideas Ppt PowerPoint Presentation Outline Graphics
This is a internal sources of new product ideas ppt powerpoint presentation outline graphics. This is a six stage process. The stages in this process are innovation group meetings, salesforce, internal sources.
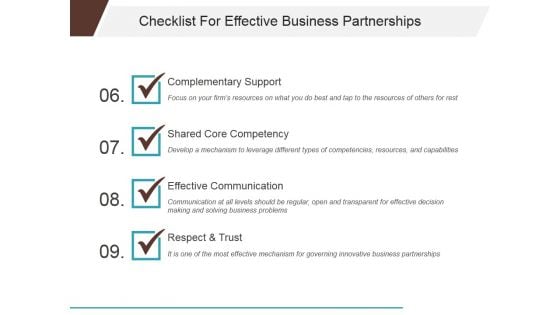
Checklist For Effective Business Partnerships Template 2 Ppt PowerPoint Presentation Infographic Template Graphics
This is a checklist for effective business partnerships template 2 ppt powerpoint presentation infographic template graphics. This is a four stage process. The stages in this process are complementary support, shared core competency, effective communication, respect and trust.

Projected Key Financials Template 1 Ppt PowerPoint Presentation Infographic Template Graphics
This is a projected key financials template 1 ppt powerpoint presentation infographic template graphics. This is a three stage process. The stages in this process are sales, gross profit, net profit.
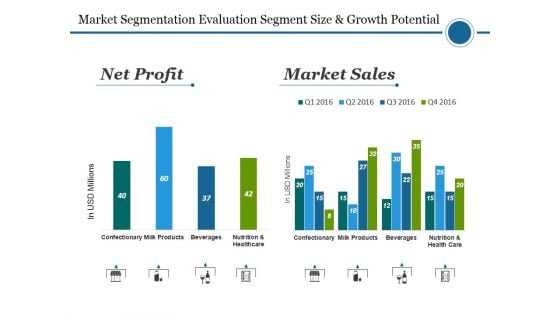
Market Segmentation Evaluation Segment Size And Growth Potential Ppt PowerPoint Presentation Show Graphics
This is a market segmentation evaluation segment size and growth potential ppt powerpoint presentation show graphics. This is a four stage process. The stages in this process are relationships, analytical, management, leadership, competency framework.
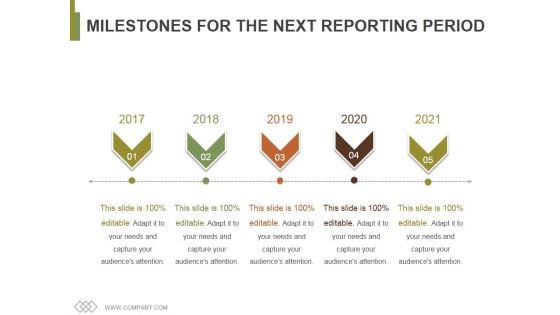
Milestones For The Next Reporting Period Template 1 Ppt PowerPoint Presentation Pictures Graphics
This is a milestones for the next reporting period template 1 ppt powerpoint presentation pictures graphics. This is a five stage process. The stages in this process are year, growth, success, time planning, business.

The Aon Hewitt Employee Engagement Model Ppt PowerPoint Presentation Ideas Graphics
This is a the aon hewitt employee engagement model ppt powerpoint presentation ideas graphics. This is a six stage process. The stages in this process are engagement drivers, engagement outcomes, business outcomes, leadership, performance.
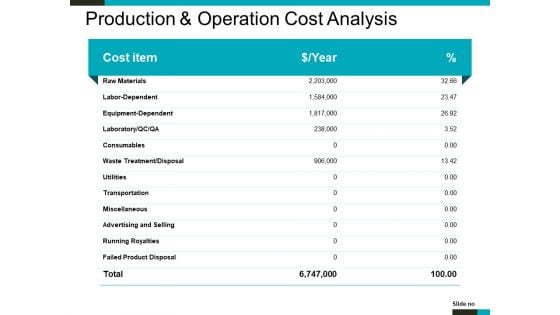
Production And Operation Cost Analysis Ppt PowerPoint Presentation Infographic Template Graphics
This is a production and operation cost analysis ppt powerpoint presentation infographic template graphics. This is a three stage process. The stages in this process are raw materials, consumables, utilities, transportation, miscellaneous.
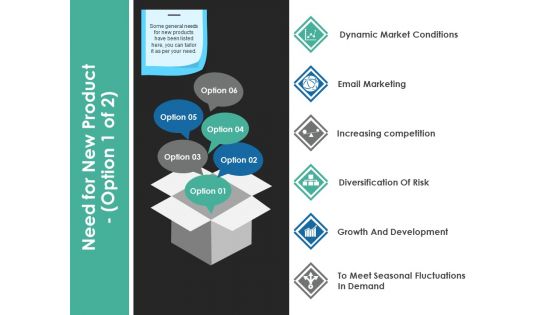
Need For New Product Template 1 Ppt PowerPoint Presentation Show Graphics
This is a need for new product template 1 ppt powerpoint presentation show graphics. This is a six stage process. The stages in this process are dynamic market conditions, email marketing, increasing competition, diversification of risk, growth and development.
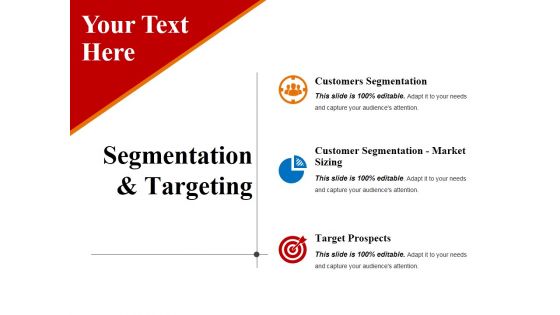
Segmentation And Targeting Template 1 Ppt PowerPoint Presentation Infographic Template Graphics
This is a segmentation and targeting template 1 ppt powerpoint presentation infographic template graphics. This is a three stage process. The stages in this process are customers segmentation, customer segmentation market sizing, target prospects, business, marketing.
Purchase Order Workflow Manage And Negotiate Ppt PowerPoint Presentation Icon Graphics
This is a purchase order workflow manage and negotiate ppt powerpoint presentation icon graphics. This is a eleven stage process. The stages in this process are purchasing, procurement, bidding.
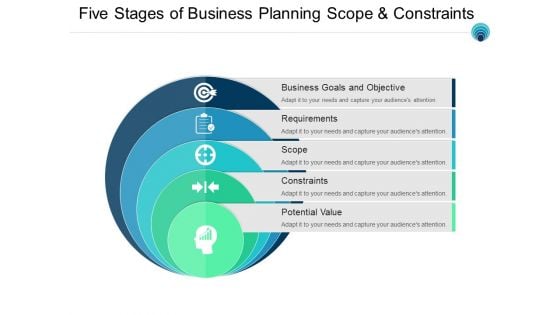
Five Stages Of Business Planning Scope And Constraints Ppt PowerPoint Presentation Gallery Graphics
This is a five stages of business planning scope and constraints ppt powerpoint presentation gallery graphics. This is a five stage process. The stages in this process are past present future, future state, before after.
Five Steps Business Transformation Process With Icons Ppt PowerPoint Presentation Show Graphics
This is a five steps business transformation process with icons ppt powerpoint presentation show graphics. This is a five stage process. The stages in this process are change management, business process, change control.

Improve Job Satisfaction And Employee Engagement Ppt PowerPoint Presentation Gallery Graphics
This is a improve job satisfaction and employee engagement ppt powerpoint presentation gallery graphics. This is a three stage process. The stages in this process are value addition, adding value.
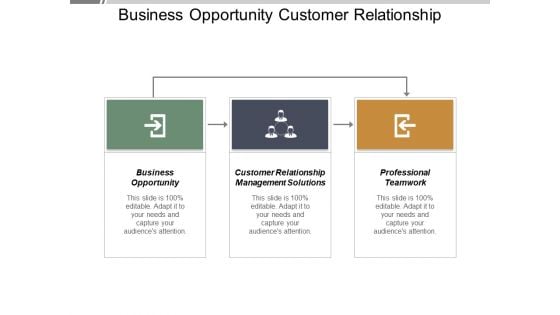
Business Opportunity Customer Relationship Management Solutions Professional Teamwork Ppt PowerPoint Presentation Infographics Graphics
This is a business opportunity customer relationship management solutions professional teamwork ppt powerpoint presentation infographics graphics. This is a three stage process. The stages in this process are business opportunity, customer relationship management solutions, professional teamwork.
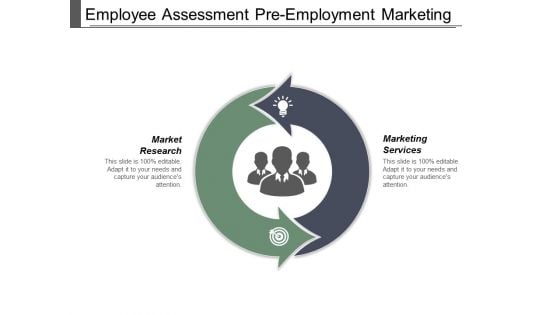
Employee Assessment Pre Employment Marketing Services Market Research Ppt PowerPoint Presentation Summary Graphics
This is a employee assessment pre employment marketing services market research ppt powerpoint presentation summary graphics. This is a two stage process. The stages in this process are employee assessment pre employment, marketing services, market research.
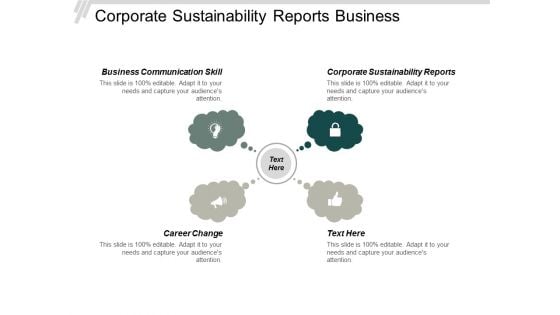
Corporate Sustainability Reports Business Communication Skill Career Change Ppt PowerPoint Presentation Portfolio Graphics
This is a corporate sustainability reports business communication skill career change ppt powerpoint presentation portfolio graphics. This is a four stage process. The stages in this process are corporate sustainability reports, business communication skill, career change.


 Continue with Email

 Home
Home


