Graphics
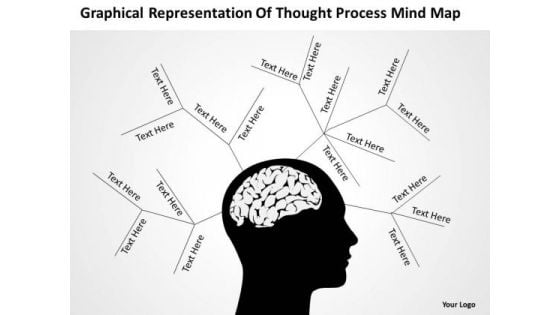
Timeline Graphical Representation Of Thought Process Mind Map
Our Timeline Graphical Representation Of Thought Process Mind Map are the chords of your song. String them along and provide the lilt to your views. Our Timeline Graphical Representation Of Thought Process Mind Map help you pinpoint your timelines. Highlight the reasons for your deadlines with their use.
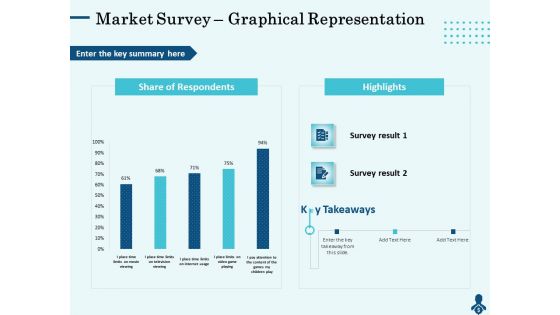
Competitive Intelligence Frameworks Market Survey Graphical Representation Designs PDF
Presenting this set of slides with name competitive intelligence frameworks market survey graphical representation designs pdf. The topics discussed in these slide is market survey graphical representation. This is a completely editable PowerPoint presentation and is available for immediate download. Download now and impress your audience.
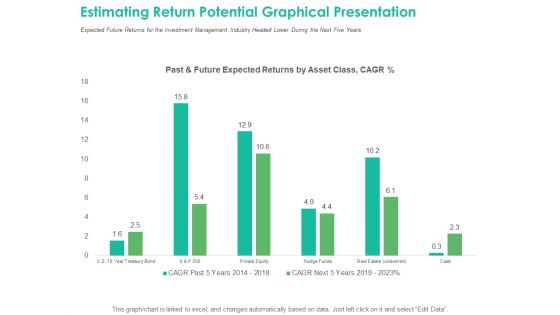
Investment Portfolio Management Estimating Return Potential Graphical Presentation Rules PDF
Presenting this set of slides with name investment portfolio management estimating return potential graphical presentation rules pdf. The topics discussed in these slide is estimating return potential graphical presentation. This is a completely editable PowerPoint presentation and is available for immediate download. Download now and impress your audience.

Product Demand Document Future Work Graphical Representation Inspiration PDF
This slide covers the graphical presentation of the quarterly future updates in Gantt chart format. Deliver an awe-inspiring pitch with this creative product demand document future work graphical representation inspiration pdf bundle. Topics like social media integration, revenue, international expansion can be discussed with this completely editable template. It is available for immediate download depending on the needs and requirements of the user.
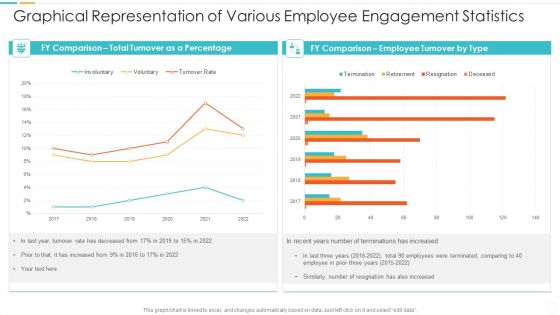
Graphical Representation Of Various Employee Engagement Statistics Microsoft PDF
Showcasing this set of slides titled graphical representation of various employee engagement statistics microsoft pdf. The topics addressed in these templates are graphical representation of various employee engagement statistics. All the content presented in this PPT design is completely editable. Download it and make adjustments in color, background, font etc. as per your unique business setting.
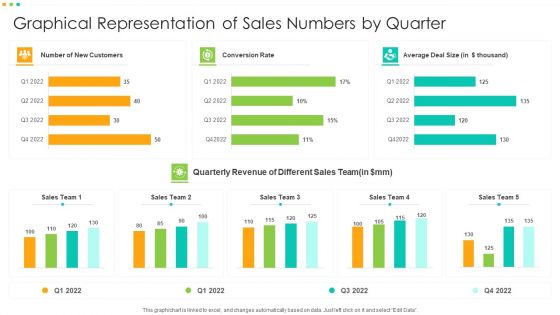
Graphical Representation Of Sales Numbers By Quarter Template PDF
Showcasing this set of slides titled Graphical Representation Of Sales Numbers By Quarter Template PDF. The topics addressed in these templates are Graphical Representation Of Sales Numbers By Quarter. All the content presented in this PPT design is completely editable. Download it and make adjustments in color, background, font etc. as per your unique business setting.
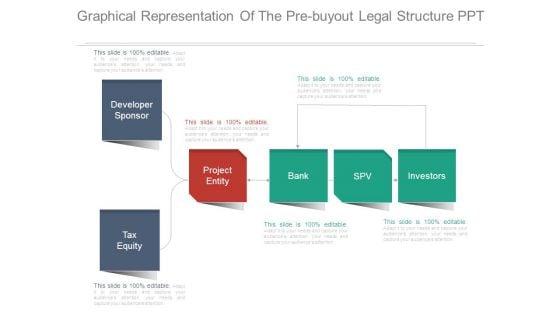
Graphical Representation Of The Pre Buyout Legal Structure Ppt
This is a graphical representation of the pre buyout legal structure ppt. This is a five stage process. The stages in this process are developer sponsor, tax equity, project entity, bank, spv, investors.
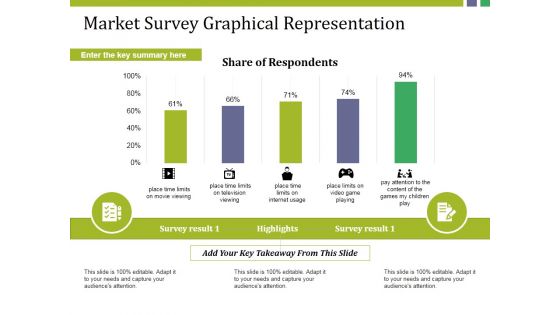
Market Survey Graphical Representation Ppt PowerPoint Presentation Professional Show
This is a market survey graphical representation ppt powerpoint presentation professional show. This is a five stage process. The stages in this process are survey result, highlights, share of respondents.

Income Statement Graphical Representation Ppt PowerPoint Presentation Summary Inspiration
This is a income statement graphical representation ppt powerpoint presentation summary inspiration. This is a four stage process. The stages in this process are revenue, cogs, operating profit, net profit.

Project Graphical Economic Model Ppt PowerPoint Presentation Gallery Portfolio
This is a project graphical economic model ppt powerpoint presentation gallery portfolio. This is a two stage process. The stages in this process are product improvement, product enhancement, product upgradation.
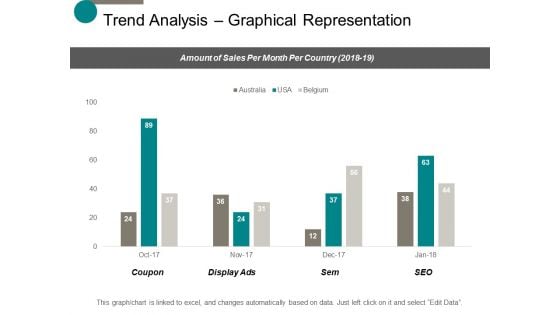
Trend Analysis Graphical Representation Ppt Powerpoint Presentation Slides Deck
This is a trend analysis graphical representation ppt powerpoint presentation slides deck. This is a four stage process. The stages in this process are finance, marketing, management, investment, analysis.
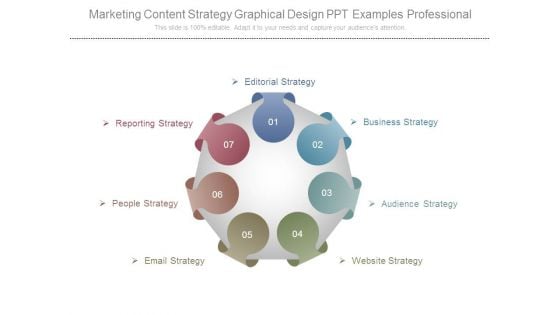
Marketing Content Strategy Graphical Design Ppt Examples Professional
This is a marketing content strategy graphical design ppt examples professional. This is a seven stage process. The stages in this process are editorial strategy, reporting strategy, people strategy, email strategy, business strategy, audience strategy, website strategy.
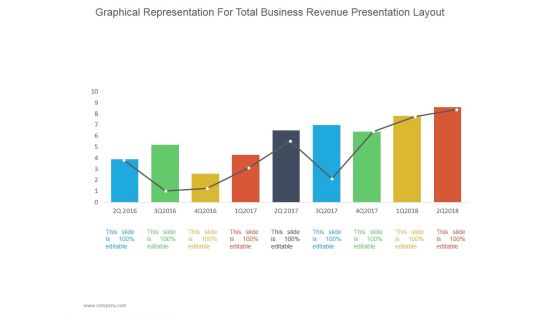
Graphical Representation For Total Business Revenue Ppt PowerPoint Presentation Diagrams
This is a graphical representation for total business revenue ppt powerpoint presentation diagrams. This is a nine stage process. The stages in this process are business, strategy, line chart, bar graph, marketing, management.
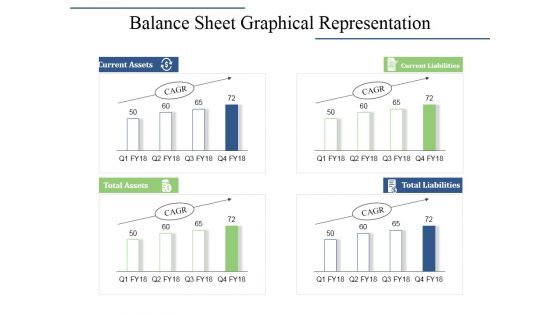
Balance Sheet Graphical Representation Ppt PowerPoint Presentation Inspiration Design Inspiration
This is a balance sheet graphical representation ppt powerpoint presentation inspiration design inspiration. This is a four stage process. The stages in this process are current assets, current liabilities, total assets, total liabilities.
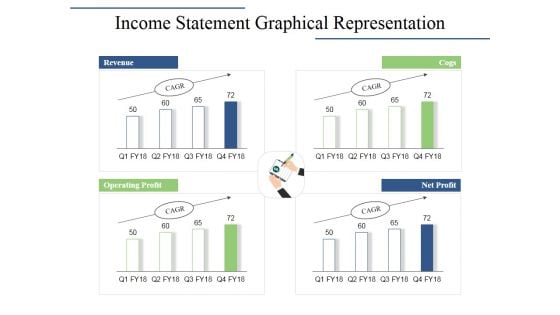
Income Statement Graphical Representation Ppt PowerPoint Presentation Infographics Layouts
This is a income statement graphical representation ppt powerpoint presentation infographics layouts. This is a four stage process. The stages in this process are revenue, cogs, operating profit, net profit.
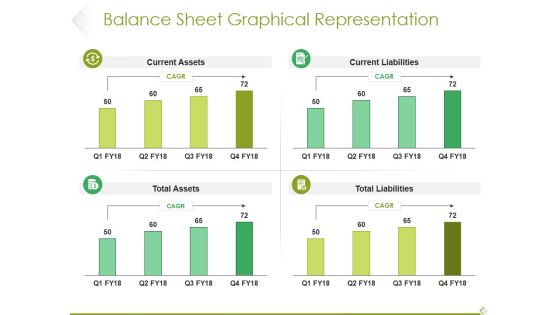
Balance Sheet Graphical Representation Ppt PowerPoint Presentation Outline Microsoft
This is a balance sheet graphical representation ppt powerpoint presentation outline microsoft. This is a four stage process. The stages in this process are current assets, current liabilities, total assets, total liabilities.
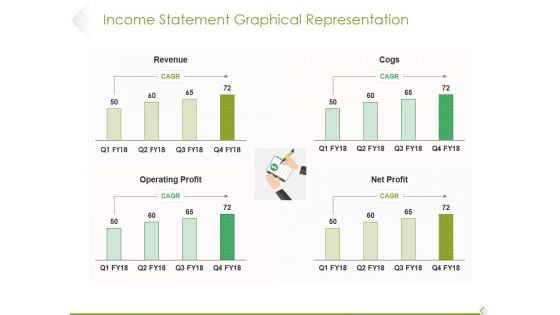
Income Statement Graphical Representation Ppt PowerPoint Presentation Infographic Template Influencers
This is a income statement graphical representation ppt powerpoint presentation infographic template influencers. This is a four stage process. The stages in this process are revenue, cogs, operating profit, profit.
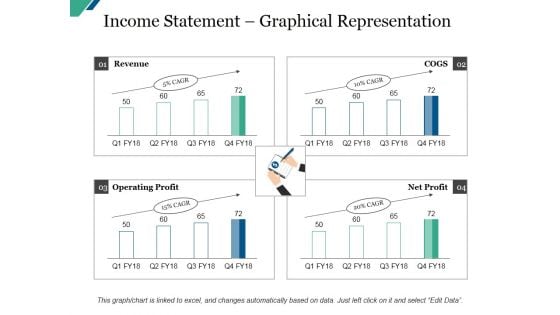
Income Statement Graphical Representation Ppt PowerPoint Presentation Summary Gallery
This is a income statement graphical representation ppt powerpoint presentation summary gallery. This is a four stage process. The stages in this process are current assets, current liabilities, total assets, total liabilities.
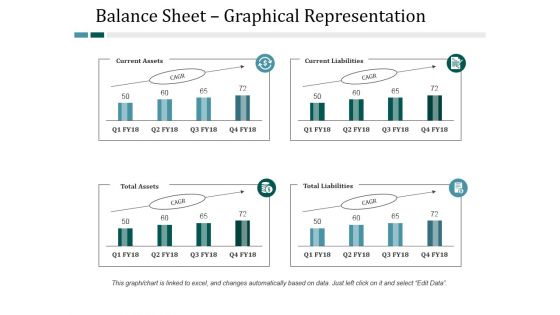
Balance Sheet Graphical Representation Ppt PowerPoint Presentation Inspiration Information
This is a balance sheet graphical representation ppt powerpoint presentation inspiration information. This is a four stage process. The stages in this process are current assets, current liabilities, total assets, total liabilities.

Income Statement Graphical Representation Ppt PowerPoint Presentation Layouts Designs Download
This is a income statement graphical representation ppt powerpoint presentation layouts designs download. This is a four stage process. The stages in this process are revenue, cogs, operating profit, net profit.
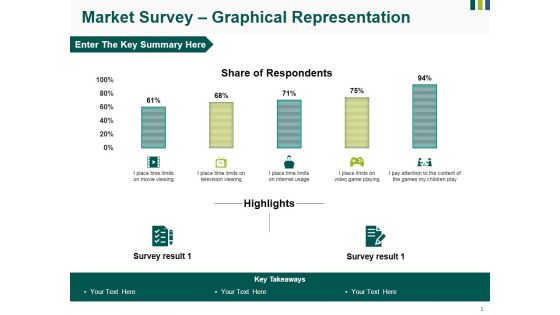
Market Survey Graphical Representation Ppt PowerPoint Presentation Gallery Pictures
This is a market survey graphical representation ppt powerpoint presentation gallery pictures. This is a five stage process. The stages in this process are business, marketing, finance, shares of market, growth strategy.
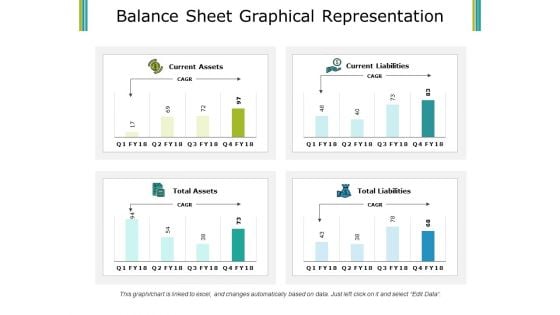
Balance Sheet Graphical Representation Ppt PowerPoint Presentation Gallery Design Templates
This is a balance sheet graphical representation ppt powerpoint presentation gallery design templates. This is a four stage process. The stages in this process are current assets, current liabilities, total assets, total liabilities.
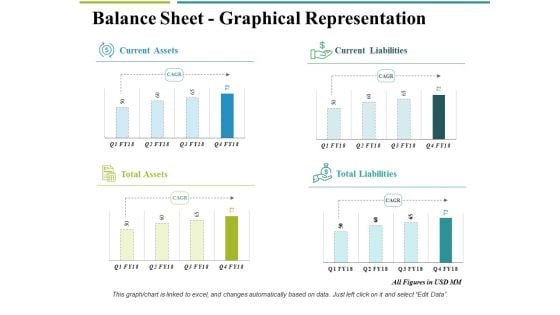
Balance Sheet Graphical Representation Ppt PowerPoint Presentation Inspiration Example
This is a balance sheet graphical representation ppt powerpoint presentation inspiration example. This is a four stage process. The stages in this process are business, current assets, current liabilities, total liabilities, total assets.
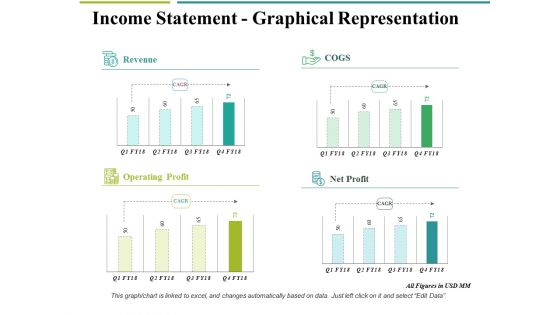
Income Statement Graphical Representation Ppt PowerPoint Presentation Pictures Design Templates
This is a income statement graphical representation ppt powerpoint presentation pictures design templates. This is a four stage process. The stages in this process are revenue, operating profit, net profit, cogs, business.
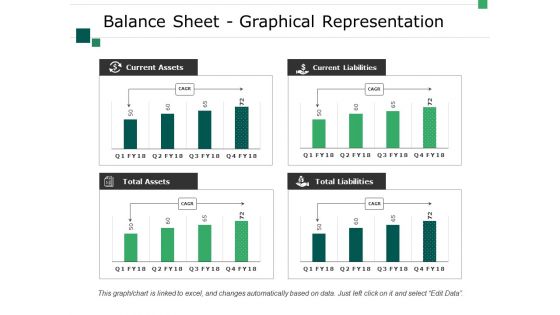
Balance Sheet Graphical Representation Ppt PowerPoint Presentation Infographics Layouts
This is a balance sheet graphical representation ppt powerpoint presentation infographics layouts. This is a four stage process. The stages in this process are business, current assets, total assets, total liabilities, current liabilities.
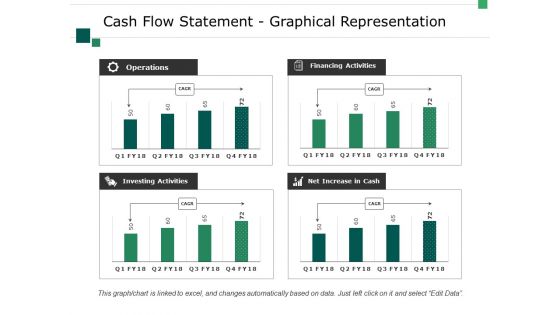
Cash Flow Statement Graphical Representation Ppt PowerPoint Presentation Professional Show
This is a cash flow statement graphical representation ppt powerpoint presentation professional show. This is a four stage process. The stages in this process are business, operations, investing activities, net increase in cash, financing activities.
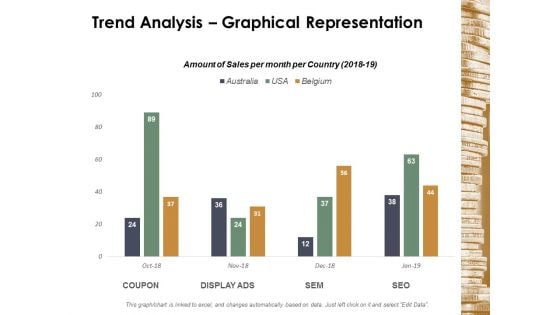
Trend Analysis Graphical Representation Ppt Powerpoint Presentation Pictures Introduction
This is a trend analysis graphical representation ppt powerpoint presentation pictures introduction. This is a three stage process. The stages in this process are finance, marketing, management, investment, analysis.
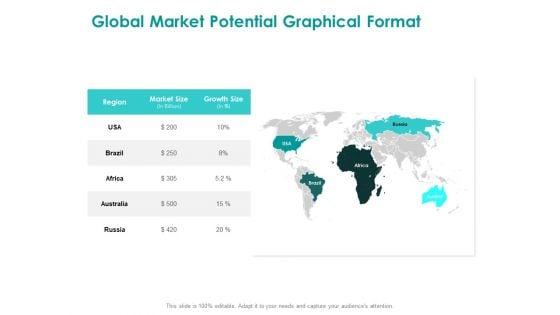
EMM Solution Global Market Potential Graphical Format Summary PDF
This is a emm solution global market potential graphical format summary pdf template with various stages. Focus and dispense information on five stages using this creative set, that comes with editable features. It contains large content boxes to add your information on topics like global market potential graphical format. You can also showcase facts, figures, and other relevant content using this PPT layout. Grab it now.
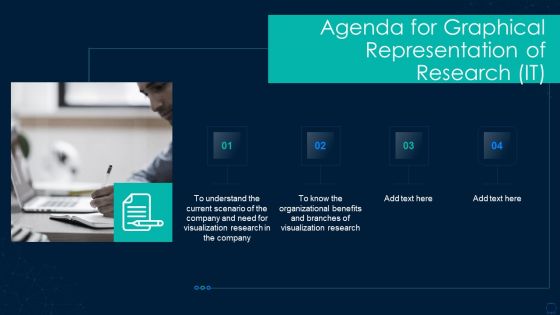
Agenda For Graphical Representation Of Research IT Download PDF
This is a agenda for graphical representation of research it download pdf template with various stages. Focus and dispense information on four stages using this creative set, that comes with editable features. It contains large content boxes to add your information on topics like agenda for graphical representation of research it. You can also showcase facts, figures, and other relevant content using this PPT layout. Grab it now.
Graphical Representation Of Data Using Statistical Data Measures Elements PDF
Persuade your audience using this graphical representation of data using statistical data measures elements pdf. This PPT design covers four stages, thus making it a great tool to use. It also caters to a variety of topics including graphical representation of data using statistical data measures. Download this PPT design now to present a convincing pitch that not only emphasizes the topic but also showcases your presentation skills.
Revenue Generation Procedure And Graphical Analysis Icon Designs PDF
Persuade your audience using this Revenue Generation Procedure And Graphical Analysis Icon Designs PDF. This PPT design covers four stages, thus making it a great tool to use. It also caters to a variety of topics including Revenue Generation Procedure, Graphical Analysis Icon. Download this PPT design now to present a convincing pitch that not only emphasizes the topic but also showcases your presentation skills.

Requirement Gathering Techniques Future Work Graphical Representation Slides PDF
This slide covers the graphical presentation of the quarterly future updates in Gantt chart format. Deliver and pitch your topic in the best possible manner with this requirement gathering techniques future work graphical representation slides pdf. Use them to share invaluable insights on social fitness, international expansion, ecosystem, revenue and impress your audience. This template can be altered and modified as per your expectations. So, grab it now.

Analyzing Requirement Management Process Future Work Graphical Representation Brochure PDF
This slide covers the graphical presentation of the quarterly future updates in Gantt chart format. Deliver and pitch your topic in the best possible manner with this analyzing requirement management process future work graphical representation brochure pdf. Use them to share invaluable insights on social fitness, international expansion, ecosystem, revenue and impress your audience. This template can be altered and modified as per your expectations. So, grab it now.
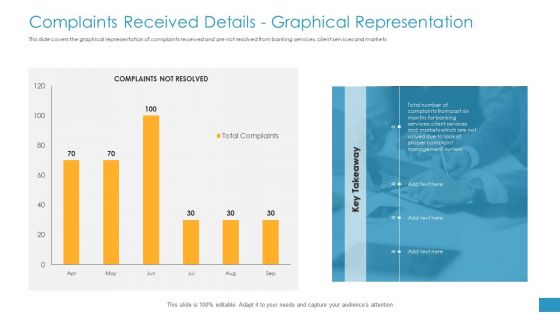
Complaints Received Details Graphical Representation Ppt Summary Mockup PDF
This slide covers the graphical representation of complaints received and are not resolved from banking services, client services and markets. Deliver and pitch your topic in the best possible manner with this complaints received details graphical representation ppt summary mockup pdf. Use them to share invaluable insights on management system, client services, complaints not resolved and impress your audience. This template can be altered and modified as per your expectations. So, grab it now.
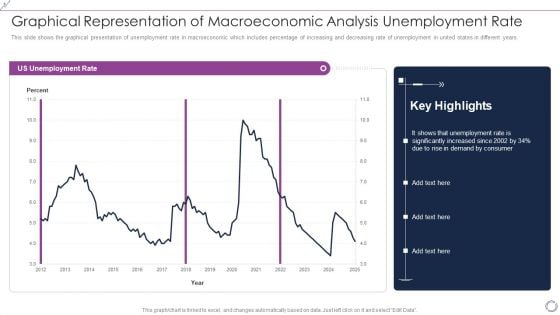
Graphical Representation Of Macroeconomic Analysis Unemployment Rate Slides PDF
This slide shows the graphical presentation of unemployment rate in macroeconomic which includes percentage of increasing and decreasing rate of unemployment in united states in different years. Showcasing this set of slides titled Graphical Representation Of Macroeconomic Analysis Unemployment Rate Slides PDF. The topics addressed in these templates are US Unemployment Rate, Consumer. All the content presented in this PPT design is completely editable. Download it and make adjustments in color, background, font etc. as per your unique business setting.
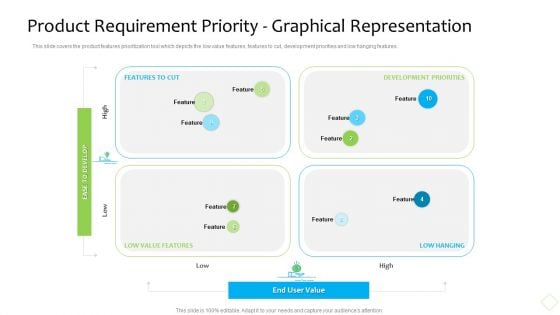
Product Demand Administration Product Requirement Priority Graphical Representation Information PDF
This slide covers the product features prioritization tool which depicts the low value features, features to cut, development priorities and low hanging features. This is a product demand administration product requirement priority graphical representation information pdf template with various stages. Focus and dispense information on four stages using this creative set, that comes with editable features. It contains large content boxes to add your information on topics like product requirement priority graphical representation. You can also showcase facts, figures, and other relevant content using this PPT layout. Grab it now.
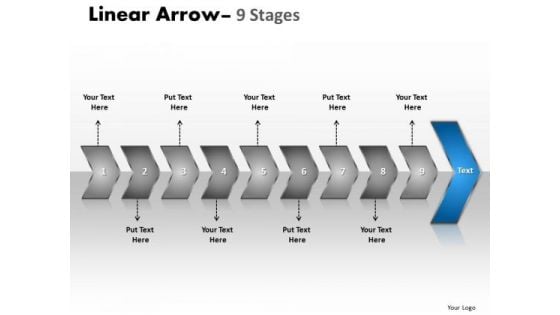
Sales PowerPoint Template Succedent Illustration Graphical Of 9 Concepts
We present our sales PowerPoint template succeeding illustration Graphical of 9 concepts. Use our Arrows PowerPoint Templates because; demonstrate how you think out of the box. Use our Business PowerPoint Templates because, Support groups are an essential element of the ongoing struggle against cancer. Use our Process and flows PowerPoint Templates because, are truly some of the wonders of our life. Use our Metaphor PowerPoint Templates because, determine your targets and sequence them as per your priorities. Use our Symbol PowerPoint Templates because, creating a winner is your passion and dream. Use these PowerPoint slides for presentations relating to Arrow, Background, Business, Chart, Diagram, Financial, Flow, Graphic, Gray, Icon, Illustration, Linear, Management, Orange, Perspective, Process, Reflection, Spheres, Stage, Text. The prominent colors used in the PowerPoint template are Blue, Gray, and Black Add some chutzpah with our Sales PowerPoint Template Succedent Illustration Graphical Of 9 Concepts. They define your elegance and style.
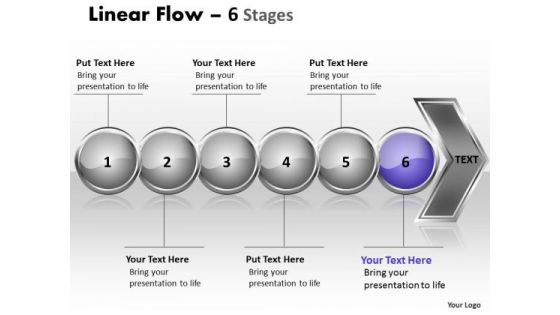
Business Ppt Theme Continual Illustration Graphical Of 6 Issues 7
We present our Business PPT Theme continual illustration Graphical of 6 issues 7.Use our Spheres PowerPoint Templates because, Cycle Template: - Rolling along while gathering profits along the way is the aim. Use our Symbol PowerPoint Templates because, Many a core idea has various enveloping layers. Use our Arrows PowerPoint Templates because, Timelines Template: - Getting it done may not be enough. Use our Metaphor PowerPoint Templates because, But it cannot be gained to desired levels in one go. Use our Business PowerPoint Templates because, Marketing Strategy Business Template:- Maximizing sales of your product is the intended destination. Use these PowerPoint slides for presentations relating to Arrow, Background, Business, Chart, Diagram, Financial, Flow, Graphic, Gray, Icon, Illustration, Linear, Management, Orange, Perspective, Process, Reflection, Spheres, Stage, Text. The prominent colors used in the PowerPoint template are Purple, Gray, and Black Your team will get faithfully behind you. Assume control with our Business Ppt Theme Continual Illustration Graphical Of 6 Issues 7.
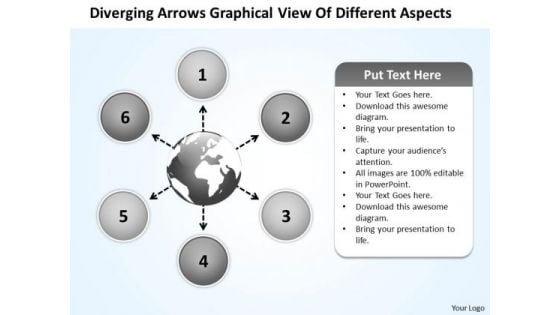
Arrows Graphical View Of Different Aspects Circular Network PowerPoint Templates
We present our arrows graphical view of different aspects Circular Network PowerPoint templates.Download and present our Arrows PowerPoint Templates because there are different paths to gain the necessary knowledge to acheive it. Present our Process and Flows PowerPoint Templates because the lessons have been analyzed, studied and conclusions drawn. Download our Shapes PowerPoint Templates because it helps you to inform your team of your innovative ideas. Download our Business PowerPoint Templates because you have had your share of being a goldfish in a small bowl.you are ready to launch out and spread your wings. Download and present our Ring Charts PowerPoint Templates because you can Show them how to churn out fresh ideas.Use these PowerPoint slides for presentations relating to Business, circle, circular,arrow,process,arrows color,colorful, concept, cycle, eco, ecologic,graphic, green, icon, illustration, light,multicolor, presentation, process,rainbow, recycle, recycling, repeat,repetitive, round, spectrum, symbol. The prominent colors used in the PowerPoint template are Pink, Gray, Black. You can be sure our arrows graphical view of different aspects Circular Network PowerPoint templates are Upbeat. PowerPoint presentation experts tell us our colorful PowerPoint templates and PPT Slides are Fabulous. Professionals tell us our arrows graphical view of different aspects Circular Network PowerPoint templates are Graceful. Presenters tell us our process PowerPoint templates and PPT Slides will make the presenter successul in his career/life. Professionals tell us our arrows graphical view of different aspects Circular Network PowerPoint templates provide you with a vast range of viable options. Select the appropriate ones and just fill in your text. Customers tell us our circular PowerPoint templates and PPT Slides are Second to none. Our Arrows Graphical View Of Different Aspects Circular Network PowerPoint Templates are ever evolving. They absorb new concepts with complete ease.

Online Application Development Product Requirement Priority Graphical Representation Topics PDF
This slide covers the product features prioritization tool which depicts the low value features, features to cut, development priorities and low hanging features. This Online Application Development Product Requirement Priority Graphical Representation Topics PDF is perfect for any presentation, be it in front of clients or colleagues. It is a versatile and stylish solution for organizing your meetings. The Online Application Development Product Requirement Priority Graphical Representation Topics PDF features a modern design for your presentation meetings. The adjustable and customizable slides provide unlimited possibilities for acing up your presentation. Slidegeeks has done all the homework before launching the product for you. So, do not wait, grab the presentation templates today
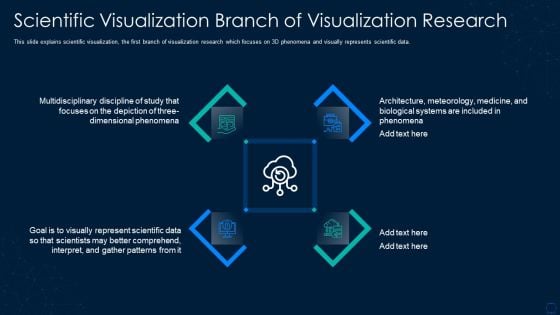
Graphical Representation Of Research IT Scientific Visualization Branch Information PDF
This slide explains scientific visualization, the first branch of visualization research which focuses on 3D phenomena and visually represents scientific data. This is a graphical representation of research it scientific visualization branch information pdf template with various stages. Focus and dispense information on four stages using this creative set, that comes with editable features. It contains large content boxes to add your information on topics like scientific visualization branch of visualization research. You can also showcase facts, figures, and other relevant content using this PPT layout. Grab it now.
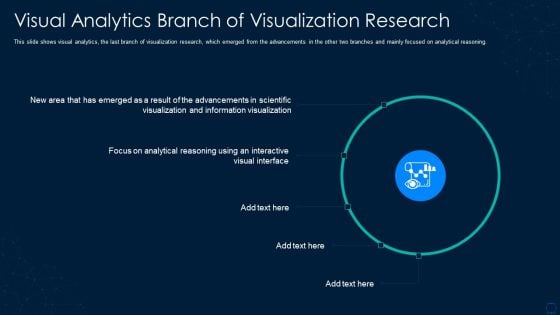
Graphical Representation Of Research IT Visual Analytics Branch Background PDF
This slide shows visual analytics, the last branch of visualization research, which emerged from the advancements in the other two branches and mainly focused on analytical reasoning. This is a graphical representation of research it visual analytics branch background pdf template with various stages. Focus and dispense information on five stages using this creative set, that comes with editable features. It contains large content boxes to add your information on topics like visual analytics branch of visualization research. You can also showcase facts, figures, and other relevant content using this PPT layout. Grab it now.
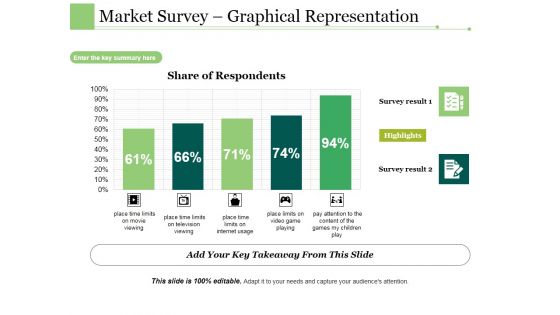
Market Survey Graphical Representation Ppt PowerPoint Presentation Ideas Show
This is a market survey graphical representation ppt powerpoint presentation ideas show. This is a five stage process. The stages in this process are place time limits on movie viewing, place time limits on television viewing, place time limits on internet usage, place limits on video game playing, pay attention to the content of the games my children play.
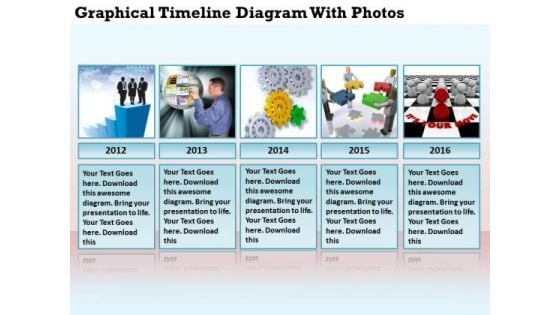
Business Charts Graphical Timeline Diagram With Photos PowerPoint Slides
We present our business charts graphical timeline diagram with photos PowerPoint Slides.Use our Spheres PowerPoint Templates because Our PowerPoint Templates and Slides will let you Hit the target. Go the full distance with ease and elan. Download and present our Business PowerPoint Templates because Our PowerPoint Templates and Slides will embellish your thoughts. See them provide the desired motivation to your team. Download and present our Marketing PowerPoint Templates because Our PowerPoint Templates and Slides will let you meet your Deadlines. Download our Flow Charts PowerPoint Templates because Our PowerPoint Templates and Slides will bullet point your ideas. See them fall into place one by one. Present our Future PowerPoint Templates because Our PowerPoint Templates and Slides will definately Enhance the stature of your presentation. Adorn the beauty of your thoughts with their colourful backgrounds.Use these PowerPoint slides for presentations relating to Agenda, agendum, arrow, art, bar, board, business, button, calendar, chart, data,design, developments, diagram, economics, elements, graph, graphics, growth,icon, illustration, infochart, infographic, infomation, information, life, meeting,modern, month, number, organizer, pointer, presentation, proceedings,report, set, sign, statistic, structure, symbol, tag, time, timeframe, timeline, vector, visualization. The prominent colors used in the PowerPoint template are Blue light, Gray, White. Concentrate on the assignment with our Business Charts Graphical Timeline Diagram With Photos PowerPoint Slides. Don't give a fig about other issues.
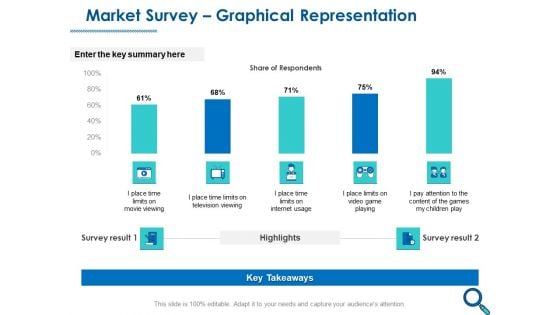
Evaluating Competitive Marketing Effectiveness Market Survey Graphical Representation Guidelines PDF
Presenting this set of slides with name evaluating competitive marketing effectiveness market survey graphical representation guidelines pdf. The topics discussed in these slides are i place time limits on movie viewing, i place time limits on television viewing, i place time limits on internet usage. This is a completely editable PowerPoint presentation and is available for immediate download. Download now and impress your audience.
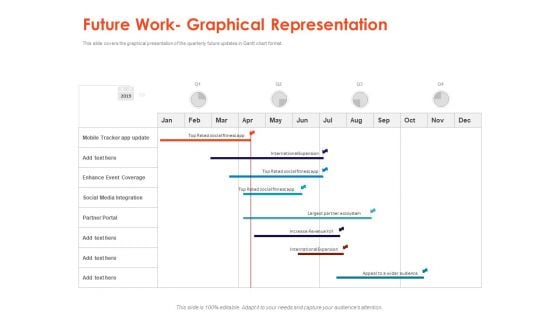
Understanding Business REQM Future Work Graphical Representation Themes PDF
Presenting this set of slides with name understanding business reqm future work graphical representation themes pdf. The topics discussed in these slides are social media integration, revenue, mobile. This is a completely editable PowerPoint presentation and is available for immediate download. Download now and impress your audience.
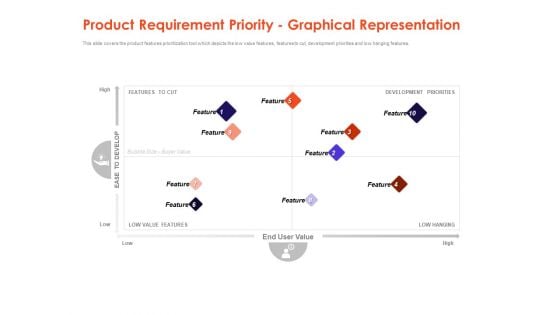
Understanding Business REQM Product Requirement Priority Graphical Representation Elements PDF
Presenting this set of slides with name understanding business reqm product requirement priority graphical representation elements pdf. The topics discussed in these slides are ease to develop, value, development priorities. This is a completely editable PowerPoint presentation and is available for immediate download. Download now and impress your audience.
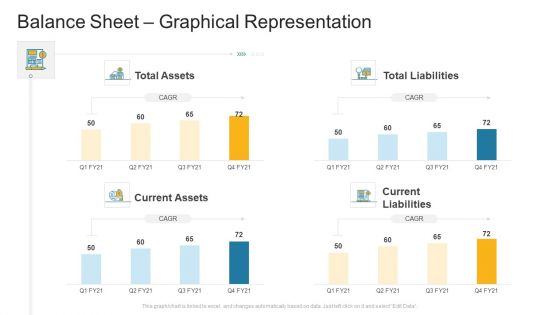
Balance Sheet Graphical Representation Company Profile Ppt Slides Show PDF
Deliver an awe inspiring pitch with this creative balance sheet graphical representation company profile ppt slides show pdf bundle. Topics like total assets, total liabilities, current assets, current liabilities can be discussed with this completely editable template. It is available for immediate download depending on the needs and requirements of the user.
Icons Slide For Graphical Representation Of Research IT Information PDF
Presenting our innovatively structured icons slide for graphical representation of research it information pdf set of slides. The slides contain a hundred percent editable icons. You can replace these icons without any inconvenience. Therefore, pick this set of slides and create a striking presentation.
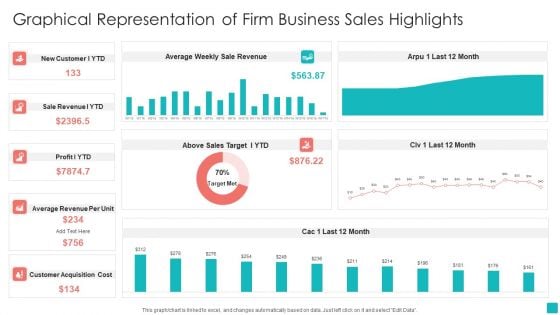
Graphical Representation Of Firm Business Sales Highlights Pictures PDF
Showcasing this set of slides titled Graphical Representation Of Firm Business Sales Highlights Pictures PDF. The topics addressed in these templates are Average Revenue Per Unit, Customer Acquisition Cost, Sale Revenue. All the content presented in this PPT design is completely editable. Download it and make adjustments in color, background, font etc. as per your unique business setting.
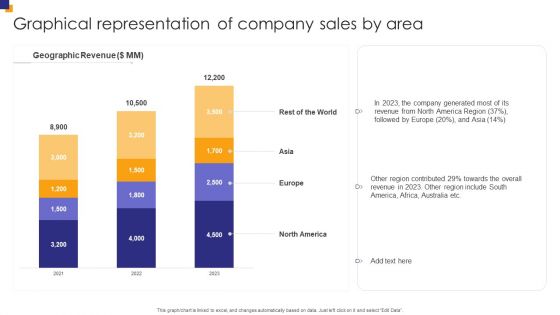
Graphical Representation Of Company Sales By Area Elements PDF
Showcasing this set of slides titled Graphical Representation Of Company Sales By Area Elements PDF. The topics addressed in these templates are Region Contributed, America Region, Include South. All the content presented in this PPT design is completely editable. Download it and make adjustments in color, background, font etc. as per your unique business setting.

3d Graphical Demonstration Process 6 Stages Free Schematic PowerPoint Slides
We present our 3d graphical demonstration process 6 stages free schematic PowerPoint Slides.Download our Arrows PowerPoint Templates because you can Educate your listeners on the means to keep it ticking over. Present our Business PowerPoint Templates because it will demonstrate the strength of character under severe stress. Shine the torch ahead and bring the light to shine on all. Present our Shapes PowerPoint Templates because they will Amplify your views and plans for getting ahead and then the manner in which you intend staying ahead. Download our Leadership PowerPoint Templates because this diagram can be used to illustrate the logical path or system. Download our Marketing PowerPoint Templates because they are the stepping stones of our journey till date.Use these PowerPoint slides for presentations relating to Abstract, Arrow, Arrows, Business, Chart, Design, Development, Diagram, Direction, Element, Flow, Flowchart, Graph, Linear, Management, Model, Motion, Organization, Plan, Process, Program, Section, Segment, Set, Sign, Solution, Strategy, Symbol, Technology. The prominent colors used in the PowerPoint template are Yellow, Green, Blue. Customers tell us our 3d graphical demonstration process 6 stages free schematic PowerPoint Slides are Exuberant. The feedback we get is that our Business PowerPoint templates and PPT Slides will help you be quick off the draw. Just enter your specific text and see your points hit home. Professionals tell us our 3d graphical demonstration process 6 stages free schematic PowerPoint Slides will save the presenter time. People tell us our Direction PowerPoint templates and PPT Slides are Nifty. Customers tell us our 3d graphical demonstration process 6 stages free schematic PowerPoint Slides will help you be quick off the draw. Just enter your specific text and see your points hit home. Professionals tell us our Diagram PowerPoint templates and PPT Slides are designed by professionals Don't drain your energy. Save it with our 3d Graphical Demonstration Process 6 Stages Free Schematic PowerPoint Slides. You will come out on top.
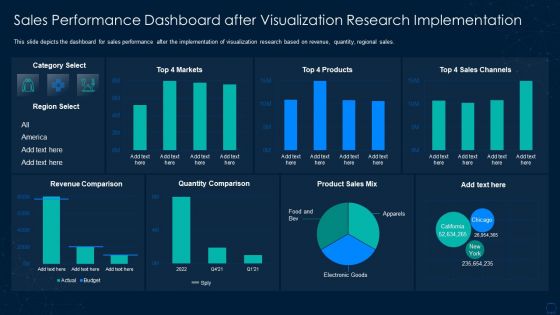
Graphical Representation Of Research IT Sales Performance Dashboard Sample PDF
This slide depicts the dashboard for sales performance after the implementation of visualization research based on revenue, quantity, regional sales. Deliver and pitch your topic in the best possible manner with this graphical representation of research it sales performance dashboard sample pdf. Use them to share invaluable insights on sales performance dashboard after visualization research implementation and impress your audience. This template can be altered and modified as per your expectations. So, grab it now.
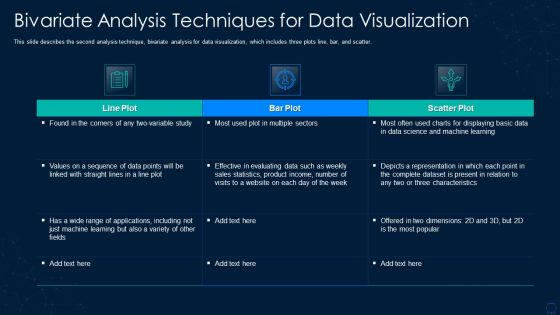
Graphical Representation Of Research IT Bivariate Analysis Techniques Formats PDF
This slide describes the second analysis technique, bivariate analysis for data visualization, which includes three plots line, bar, and scatter. Deliver and pitch your topic in the best possible manner with this graphical representation of research it bivariate analysis techniques formats pdf. Use them to share invaluable insights on bivariate analysis techniques for data visualization and impress your audience. This template can be altered and modified as per your expectations. So, grab it now.
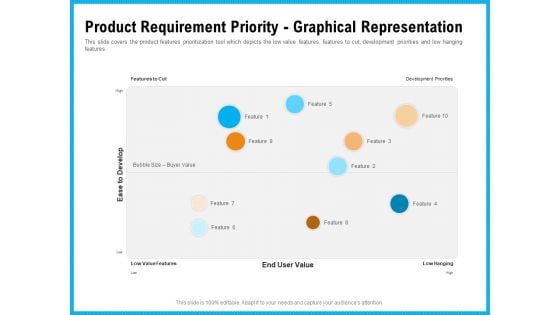
Requirement Gathering Techniques Product Requirement Priority Graphical Representation Inspiration PDF
This slide covers the product features prioritization tool which depicts the low value features, features to cut, development priorities and low hanging features. Deliver and pitch your topic in the best possible manner with this requirement gathering techniques product requirement priority graphical representation inspiration pdf. Use them to share invaluable insights on value, development, priorities and impress your audience. This template can be altered and modified as per your expectations. So, grab it now.
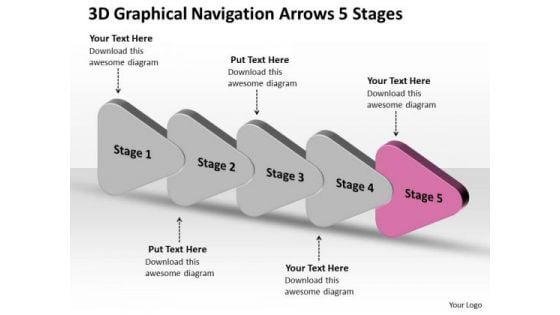
3d Graphical Navigation Arrows 5 Stages Circuit Simulation PowerPoint Slides
We present our 3d graphical navigation arrows 5 stages circuit simulation PowerPoint Slides. Use our Business PowerPoint Templates because, Marketing Strategy Business Template:- Maximizing sales of your product is the intended destination. Use our Design PowerPoint Templates because, Stable ideas are the building blocks of a successful structure. Use our Shapes PowerPoint Templates because, It is also a time to bond with family, friends, colleagues and any other group of your choice. Use our Metaphor PowerPoint Templates because; explain the process by which you intend to right it. Use our Process and Flows PowerPoint Templates because; inform them of the various means they have to achieve them. Use these PowerPoint slides for presentations relating to arrows, badge, balloon, bar, blank, blue, bright, bubbles, buttons, circle, color, cross, design, designs, drop, elements, glossy, glowing, graphic, hexagon, icon, illustration, navigation, round, seals, set, shadow, shapes, shiny, sign, speech, squares, stars, stickers, symbol. The prominent colors used in the PowerPoint template are Pink, Gray, and Black Redesign your organization with our 3d Graphical Navigation Arrows 5 Stages Circuit Simulation PowerPoint Slides. Download without worries with our money back guaranteee.
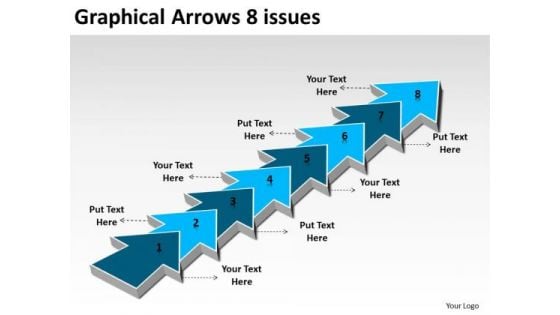
Graphical Arrows 8 Issues Make Flowchart PowerPoint Templates
We present our graphical arrows 8 issues make flowchart PowerPoint templates. Use our Arrows PowerPoint Templates because, Present your views using our innovative slides and be assured of leaving a lasting impression. Use our Symbol PowerPoint Templates because; inform your team of your ideas using our illustrative slides. Use our Business PowerPoint Templates because, Marketing Strategy Business Template: - maximizing sales of your product is the intended destination. Use our Metaphor PowerPoint Templates because, Different people with differing ideas and priorities perform together to score. Use our Process and Flows PowerPoint Templates because; adorn them with your ideas and thoughts. Use these PowerPoint slides for presentations relating to Arrow, Background, Banner, Blue, Bookmark, Card, Choice, Concept, Corporate, Creative, Design, Direction, Flow, Green, Illustration, Info graphic, Instruction, Label, Layout, Manual, Modern, Number, Offer, One, Options, Order, Page, Paper, Pointer, Product, Progress, Promotion, Red, Retro, Sequence, Simple, Special, Step, Symbol, Tab, Tag, Template, Three, Tutorial, Two, Vector, Version. The prominent colors used in the PowerPoint template are Blue, Blue navy, Gray Clear bottlenecks with our Graphical Arrows 8 Issues Make Flowchart PowerPoint Templates. Get past any obstacle in your way.
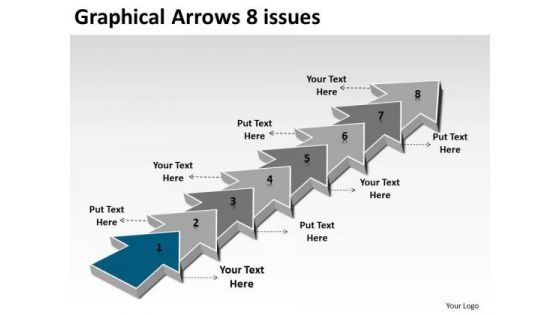
Graphical Arrows 8 Issues Business Process Flowchart PowerPoint Templates
We present our graphical arrows 8 issues business process flowchart PowerPoint templates. Use our Marketing PowerPoint Templates because, illustrate the means to prevent or control them using our imaginative templates. Use our Arrows PowerPoint Templates because, Business 3D Circular Puzzle:- Your business and plans for its growth consist of processes that are highly co-related. Use our Business PowerPoint Templates because, Business Process Design:- The template offers an excellent background to build up the various stages of your business process. Use our Process and Flows PowerPoint Templates because, If making a mark is your obsession,. Use our Leadership PowerPoint Templates because, you have good reasons to back up the strength of your belief. Use these PowerPoint slides for presentations relating to Advertising, arrow, background, banner, bookmark, card, choice, concept, creative, design, direction, flow, idea, illustration, info graphic, instruction, label, layout, marketing, modern, next, options, process, product, promotion, sequence, simple, step, symbol, template, triangle. The prominent colors used in the PowerPoint template are Blue, Gray, and White Coast along with our Graphical Arrows 8 Issues Business Process Flowchart PowerPoint Templates. Your thoughts will begin to flow.
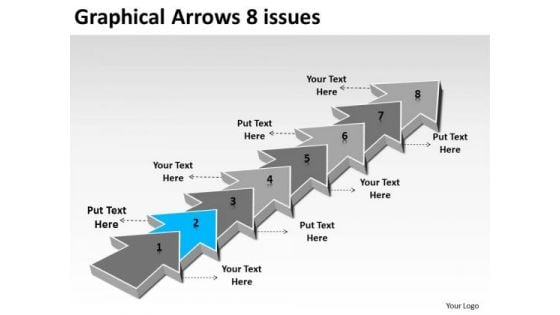
Graphical Arrows 8 Issues Free Flowchart Maker PowerPoint Templates
We present our graphical arrows 8 issues free flowchart maker PowerPoint templates. Use our Marketing PowerPoint Templates because, Targets: - You have a handle on all the targets, a master of the game, the experienced and consummate juggler. Use our Arrows PowerPoint Templates because, now you need to get it all together to form the complete picture and reach the goal. Use our Business PowerPoint Templates because, Ideas roll along in your mind like billiard balls. Use our Process and Flows PowerPoint Templates because; evolve the strategy to take you down the required path with appropriate, efficient and effective marketing along the way. Use our Leadership PowerPoint Templates because, the color coding of our templates are specifically designed to highlight you points. Use these PowerPoint slides for presentations relating to Advertising, arrow, background, banner, bookmark, card, choice, concept, creative, design, direction, flow, idea, illustration, info graphic, instruction, label, layout, marketing, modern, next, options, process, product, promotion, sequence, simple, step, symbol, template, triangle. The prominent colors used in the PowerPoint template are Blue, Gray, and White Balance it out with our Graphical Arrows 8 Issues Free Flowchart Maker PowerPoint Templates. Your suggestions will maintain the equilibrium.
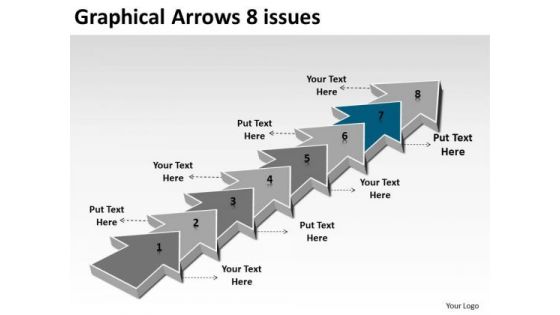
Graphical Arrows 8 Issues Ppt Flowchart Freeware PowerPoint Templates
We present our graphical arrows 8 issues ppt flowchart freeware PowerPoint templates. Use our Marketing PowerPoint Templates because; motivate your team to cross all barriers. Use our Arrows PowerPoint Templates because, you know the path so show the way. Use our Business PowerPoint Templates because, you have the process in your head, our template design showing will illuminate your thoughts. Use our Process and Flows PowerPoint Templates because, your brain is always churning out ideas like cogs in a wheel. Use our Leadership PowerPoint Templates because, Goal Pie Chart Template:- You have a clear vision of the cake you want. Use these PowerPoint slides for presentations relating to Advertising, arrow, background, banner, bookmark, card, choice, concept, creative, design, direction, flow, idea, illustration, info graphic, instruction, label, layout, marketing, modern, next, options, process, product, promotion, sequence, simple, step, symbol, template, triangle. The prominent colors used in the PowerPoint template are Blue, Gray, and White Display your ardor with our Graphical Arrows 8 Issues Ppt Flowchart Freeware PowerPoint Templates. Bowl them over with your enthusiastic approach.


 Continue with Email

 Home
Home


