Graphics
Strategic Marketing Plan Deployment In Fashion Industry Icon Microsoft PDF
Pitch your topic with ease and precision using this Strategic Marketing Plan Deployment In Fashion Industry Icon Microsoft PDF. This layout presents information on Strategic Marketing, Plan Deployment, Fashion Industry Icon. It is also available for immediate download and adjustment. So, changes can be made in the color, design, graphics or any other component to create a unique layout.
RPA Chatbot Icon For Customer Engagement In Telecommunications Designs PDF
Pitch your topic with ease and precision using this RPA Chatbot Icon For Customer Engagement In Telecommunications Designs PDF. This layout presents information on RPA Chatbot Icon, Customer Engagement, Telecommunications. It is also available for immediate download and adjustment. So, changes can be made in the color, design, graphics or any other component to create a unique layout.
RPA In Telecommunications Icon To Improve Customer Experience Microsoft PDF
Pitch your topic with ease and precision using this RPA In Telecommunications Icon To Improve Customer Experience Microsoft PDF. This layout presents information on RPA Telecommunications Icon, Improve Customer Experience. It is also available for immediate download and adjustment. So, changes can be made in the color, design, graphics or any other component to create a unique layout.
Icon For Product Launch Promotional Campaign Pictures PDF
Pitch your topic with ease and precision using this Icon For Product Launch Promotional Campaign Pictures PDF. This layout presents information on Product Launch, Promotional, Campaign. It is also available for immediate download and adjustment. So, changes can be made in the color, design, graphics or any other component to create a unique layout.
Financial Approach For Value Proposition Analysis Icon Demonstration PDF
Pitch your topic with ease and precision using this Financial Approach For Value Proposition Analysis Icon Demonstration PDF. This layout presents information on Financial Approach, Proposition, Analysis. It is also available for immediate download and adjustment. So, changes can be made in the color, design, graphics or any other component to create a unique layout.
Automated Guided Vehicles Services For Warehousing And Distribution Icon Formats PDF
Pitch your topic with ease and precision using this Automated Guided Vehicles Services For Warehousing And Distribution Icon Formats PDF. This layout presents information on Automated Guided Vehicles Services, Warehousing And Distribution Icon. It is also available for immediate download and adjustment. So, changes can be made in the color, design, graphics or any other component to create a unique layout.
Fire Alarm With Red And Yellow Lights Icon Ideas PDF
Pitch your topic with ease and precision using this Fire Alarm With Red And Yellow Lights Icon Ideas PDF. This layout presents information on Fire Alarm With Red, Yellow Lights Icon. It is also available for immediate download and adjustment. So, changes can be made in the color, design, graphics or any other component to create a unique layout.
Hiring Campaign And Talent Search Icon Microsoft PDF
Pitch your topic with ease and precision using this Hiring Campaign And Talent Search Icon Microsoft PDF. This layout presents information on Hiring Campaign, Talent Search Icon. It is also available for immediate download and adjustment. So, changes can be made in the color, design, graphics or any other component to create a unique layout.
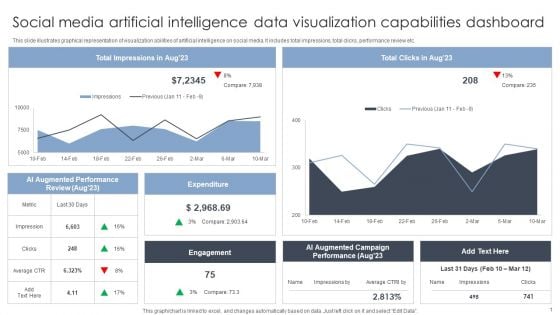
Social Media Artificial Intelligence Data Visualization Capabilities Dashboard Inspiration PDF
This slide illustrates graphical representation of visualization abilities of artificial intelligence on social media. It includes total impressions, total clicks, performance review etc. Pitch your topic with ease and precision using this Social Media Artificial Intelligence Data Visualization Capabilities Dashboard Inspiration PDF. This layout presents information on Artificial Intelligence, Data Visualization Capabilities. It is also available for immediate download and adjustment. So, changes can be made in the color, design, graphics or any other component to create a unique layout.
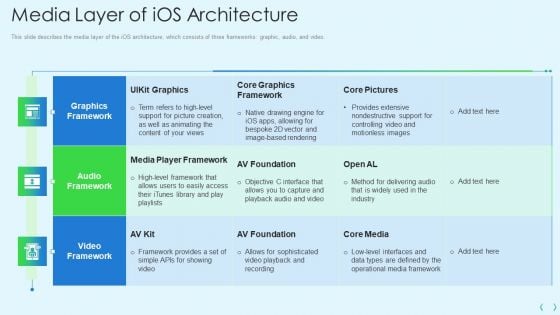
Smartphone Operating System Development IT Media Layer Of Ios Architecture Structure PDF
This slide describes the media layer of the iOS architecture, which consists of three frameworks graphic, audio, and video.Deliver and pitch your topic in the best possible manner with this smartphone operating system development it media layer of ios architecture structure pdf Use them to share invaluable insights on graphics framework, audio framework, media player framework and impress your audience. This template can be altered and modified as per your expectations. So, grab it now.
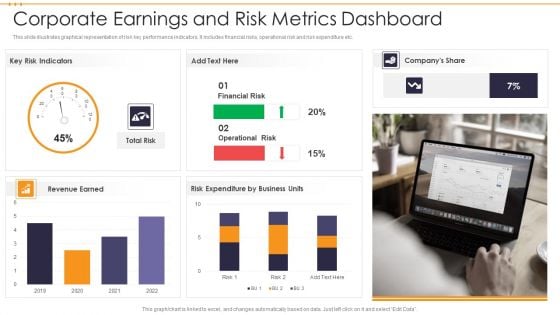
Corporate Earnings And Risk Metrics Dashboard Guidelines PDF
This slide illustrates graphical representation of risk key performance indicators. It includes financial risks, operational risk and risk expenditure etc. Pitch your topic with ease and precision using this Corporate Earnings And Risk Metrics Dashboard Guidelines PDF. This layout presents information on Financial Risk, Operational Risk Expenditure. It is also available for immediate download and adjustment. So, changes can be made in the color, design, graphics or any other component to create a unique layout.
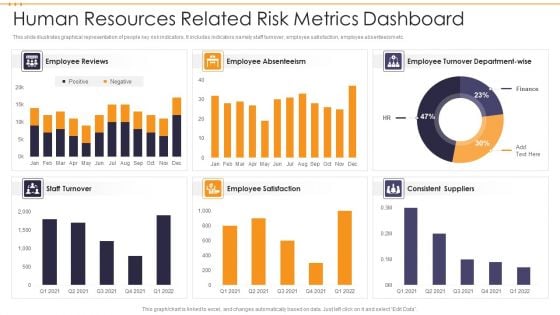
Human Resources Related Risk Metrics Dashboard Information PDF
This slide illustrates graphical representation of people key risk indicators. It includes indicators namely staff turnover, employee satisfaction, employee absenteeism etc. Pitch your topic with ease and precision using this Human Resources Related Risk Metrics Dashboard Information PDF. This layout presents information on Human Resources Related Risk Metrics Dashboard. It is also available for immediate download and adjustment. So, changes can be made in the color, design, graphics or any other component to create a unique layout.
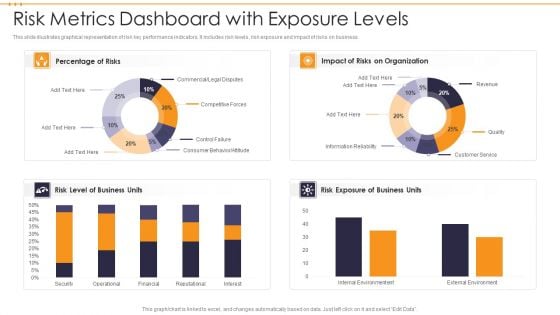
Risk Metrics Dashboard With Exposure Levels Template PDF
This slide illustrates graphical representation of risk key performance indicators. It includes risk levels, risk exposure and impact of risks on business. Pitch your topic with ease and precision using this Risk Metrics Dashboard With Exposure Levels Template PDF. This layout presents information on Risk Metrics Dashboard With Exposure Levels. It is also available for immediate download and adjustment. So, changes can be made in the color, design, graphics or any other component to create a unique layout.
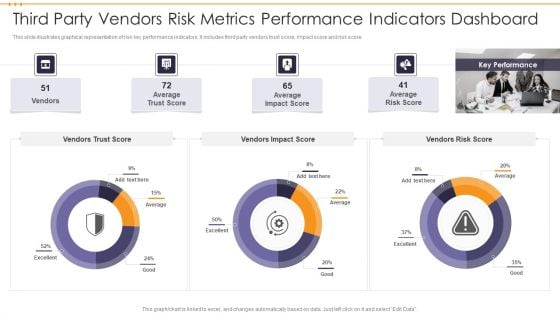
Third Party Vendors Risk Metrics Performance Indicators Dashboard Topics PDF
This slide illustrates graphical representation of risk key performance indicators. It includes third party vendors trust score, impact score and risk score. Pitch your topic with ease and precision using this Third Party Vendors Risk Metrics Performance Indicators Dashboard Topics PDF. This layout presents information on Third Party Vendors Risk Metrics Performance Indicators Dashboard. It is also available for immediate download and adjustment. So, changes can be made in the color, design, graphics or any other component to create a unique layout.
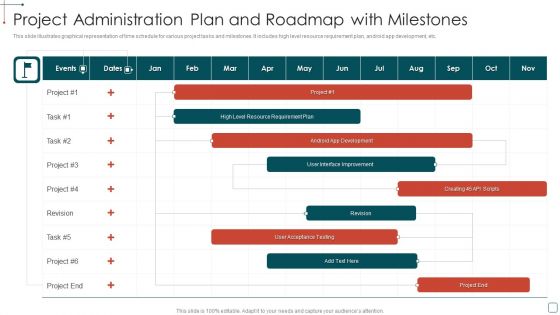
Project Administration Plan And Roadmap With Milestones Diagrams PDF
This slide illustrates graphical representation of time schedule for various project tasks and milestones. It includes high level resource requirement plan, android app development, etc.Pitch your topic with ease and precision using this Project Administration Plan And Roadmap With Milestones Diagrams PDF This layout presents information on Improvement, Acceptance Testing, Revision It is also available for immediate download and adjustment. So, changes can be made in the color, design, graphics or any other component to create a unique layout.
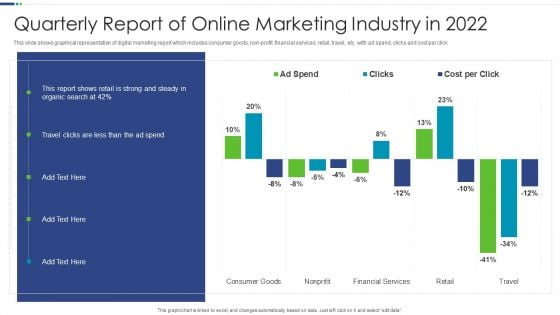
Quarterly Report Of Online Marketing Industry In 2022 Professional PDF
This slide shows graphical representation of digital marketing report which includes consumer goods, non-profit, financial services, retail, travel, etc. with ad spend, clicks and cost per click.Pitch your topic with ease and precision using this Quarterly Report Of Online Marketing Industry In 2022 Professional PDF This layout presents information on Quarterly Report, Online Marketing, Industry It is also available for immediate download and adjustment. So, changes can be made in the color, design, graphics or any other component to create a unique layout.
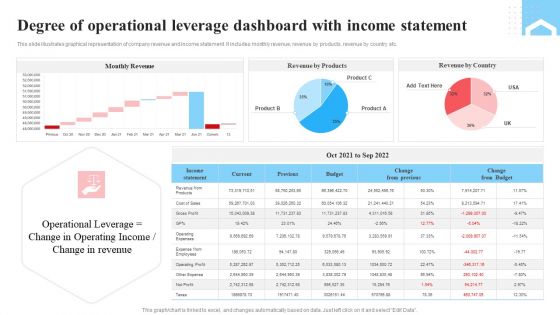
Degree Of Operational Leverage Dashboard With Income Statement Ppt Infographics Layout PDF
This slide illustrates graphical representation of company revenue and income statement. It includes monthly revenue, revenue by products, revenue by country etc. Pitch your topic with ease and precision using this Degree Of Operational Leverage Dashboard With Income Statement Ppt Infographics Layout PDF. This layout presents information on Monthly Revenue, Income Statement, Product. It is also available for immediate download and adjustment. So, changes can be made in the color, design, graphics or any other component to create a unique layout.
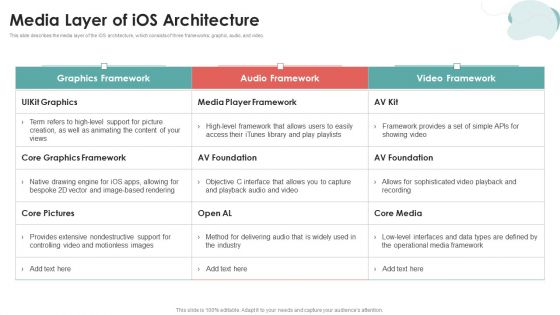
Mobile Application Development Media Layer Of Ios Architecture Diagrams PDF
This slide describes the media layer of the iOS architecture, which consists of three frameworks graphic, audio, and video.Deliver and pitch your topic in the best possible manner with this Mobile Application Development Media Layer Of Ios Architecture Diagrams PDF. Use them to share invaluable insights on Graphics Framework, Provides Extensive, Nondestructive Support and impress your audience. This template can be altered and modified as per your expectations. So, grab it now.
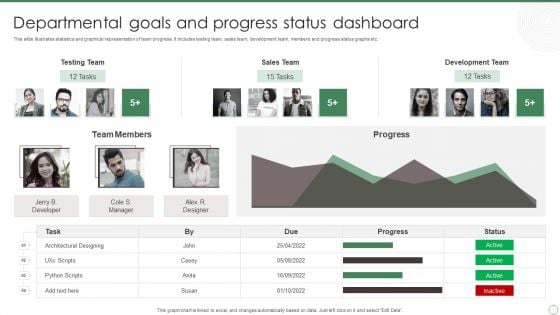
Departmental Goals And Progress Status Dashboard Ppt Portfolio Samples PDF
This slide illustrates statistics and graphical representation of team progress. It includes testing team, sales team, development team, members and progress status graphs etc. Pitch your topic with ease and precision using this Departmental Goals And Progress Status Dashboard Ppt Portfolio Samples PDF. This layout presents information on Testing Team, Sales Team, Development Team. It is also available for immediate download and adjustment. So, changes can be made in the color, design, graphics or any other component to create a unique layout.
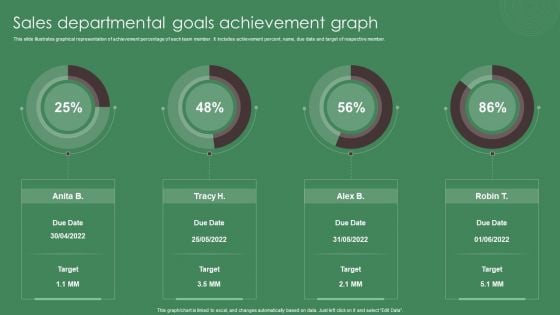
Sales Departmental Goals Achievement Graph Ppt Inspiration Slide Download PDF
This slide illustrates graphical representation of achievement percentage of each team member. It includes achievement percent, name, due date and target of respective member. Pitch your topic with ease and precision using this Sales Departmental Goals Achievement Graph Ppt Inspiration Slide Download PDF. This layout presents information on Sales Departmental, Goals, Achievement Graph. It is also available for immediate download and adjustment. So, changes can be made in the color, design, graphics or any other component to create a unique layout.
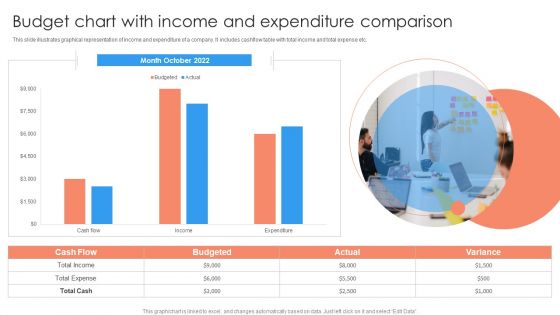
Budget Chart With Income And Expenditure Comparison Ppt PowerPoint Presentation Infographics Designs PDF
This slide illustrates graphical representation of income and expenditure of a company. It includes cashflow table with total income and total expense etc.Pitch your topic with ease and precision using this Budget Chart With Income And Expenditure Comparison Ppt PowerPoint Presentation Infographics Designs PDF. This layout presents information on Total Expense, Total Income, Total Cash. It is also available for immediate download and adjustment. So, changes can be made in the color, design, graphics or any other component to create a unique layout.
Project Tracking And Evaluation Dashboard Portrait PDF
This slide illustrates graphical representation and facts and figures relating to project management data. It includes budget by employee, overdue tasks, workload charts etc. Pitch your topic with ease and precision using this Project Tracking And Evaluation Dashboard Portrait PDF. This layout presents information on Employee Budget, Target, Design, Development. It is also available for immediate download and adjustment. So, changes can be made in the color, design, graphics or any other component to create a unique layout.
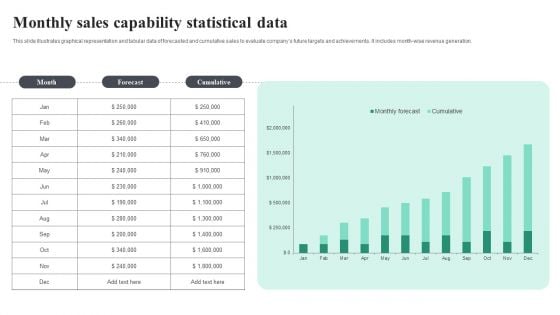
Monthly Sales Capability Statistical Data Background PDF
This slide illustrates graphical representation and tabular data of forecasted and cumulative sales to evaluate companys future targets and achievements. It includes month wise revenue generation. Pitch your topic with ease and precision using this Monthly Sales Capability Statistical Data Background PDF. This layout presents information on Monthly Sales, Capability Statistical Data. It is also available for immediate download and adjustment. So, changes can be made in the color, design, graphics or any other component to create a unique layout.
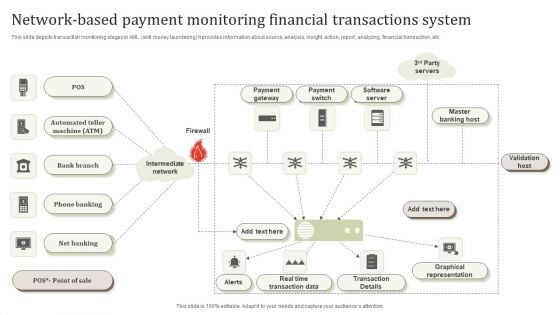
Network Based Payment Monitoring Financial Transactions System Pictures PDF
This slide depicts transaction monitoring stages in AML anti money laundering It provides information about source, analysis, insight, action, report, analyzing, financial transaction, etc.Pitch your topic with ease and precision using this Network Based Payment Monitoring Financial Transactions System Pictures PDF. This layout presents information on Payment Gateway, Transaction Details, Graphical Representation. It is also available for immediate download and adjustment. So, changes can be made in the color, design, graphics or any other component to create a unique layout.
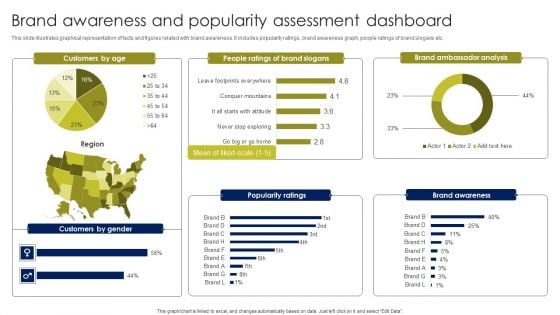
Brand Awareness And Popularity Assessment Dashboard Topics PDF
This slide illustrates graphical representation of facts and figures related with brand awareness. It includes popularity ratings, brand awareness graph, people ratings of brand slogans etc. Pitch your topic with ease and precision using thisBrand Awareness And Popularity Assessment Dashboard Topics PDF. This layout presents information on Customers By Age, Brand Ambassador Analysis, Brand Awareness. It is also available for immediate download and adjustment. So, changes can be made in the color, design, graphics or any other component to create a unique layout.
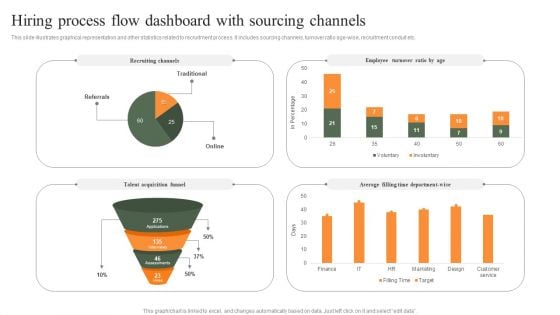
Hiring Process Flow Dashboard With Sourcing Channels Professional PDF
This slide illustrates graphical representation and other statistics related to recruitment process. It includes sourcing channels, turnover ratio age-wise, recruitment conduit etc. Pitch your topic with ease and precision using this Hiring Process Flow Dashboard With Sourcing Channels Professional PDF. This layout presents information on Employee Turnover Ratio, Recruiting Channels, Average. It is also available for immediate download and adjustment. So, changes can be made in the color, design, graphics or any other component to create a unique layout.
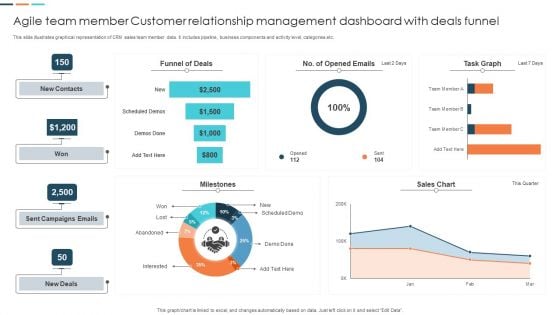
Agile Team Member Customer Relationship Management Dashboard With Deals Funnel Mockup PDF
This slide illustrates graphical representation of CRM sales team member data. It includes pipeline, business components and activity level, categories etc. Pitch your topic with ease and precision using this Agile Team Member Customer Relationship Management Dashboard With Deals Funnel Mockup PDF. This layout presents information on Funnel Of Deals, Sent Campaigns Emails, Sales Chart. It is also available for immediate download and adjustment. So, changes can be made in the color, design, graphics or any other component to create a unique layout.
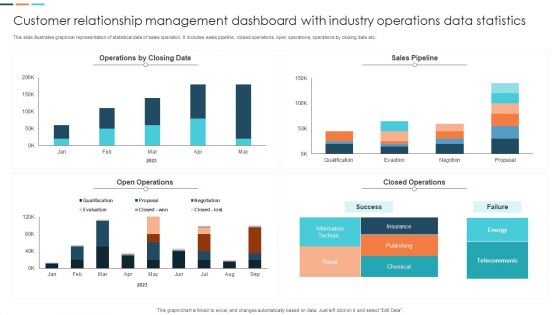
Customer Relationship Management Dashboard With Industry Operations Data Statistics Pictures PDF
This slide illustrates graphical representation of statistical data of sales operation. It includes sales pipeline, closed operations, open operations, operations by closing date etc. Pitch your topic with ease and precision using this Customer Relationship Management Dashboard With Industry Operations Data Statistics Pictures PDF. This layout presents information on Sales Pipeline, Insurance, Telecommunic. It is also available for immediate download and adjustment. So, changes can be made in the color, design, graphics or any other component to create a unique layout.
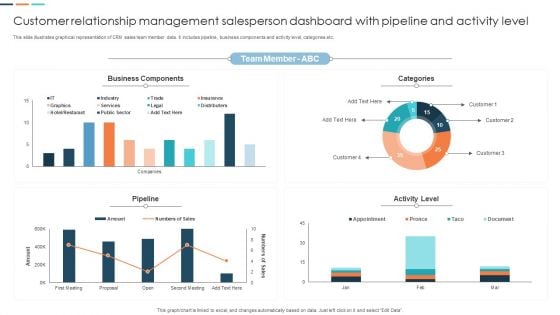
Customer Relationship Management Salesperson Dashboard With Pipeline And Activity Level Designs PDF
This slide illustrates graphical representation of CRM sales team member data. It includes pipeline, business components and activity level, categories etc. Pitch your topic with ease and precision using this Customer Relationship Management Salesperson Dashboard With Pipeline And Activity Level Designs PDF. This layout presents information on Categories, Business Components, Team Member. It is also available for immediate download and adjustment. So, changes can be made in the color, design, graphics or any other component to create a unique layout.
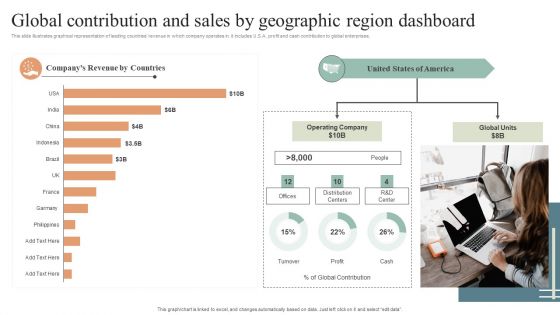
Global Contribution And Sales By Geographic Region Dashboard Diagrams PDF
This slide illustrates graphical representation of leading countries revenue in which company operates in. it includes U.S.A. profit and cash contribution to global enterprises. Pitch your topic with ease and precision using this Global Contribution And Sales By Geographic Region Dashboard Diagrams PDF. This layout presents information on Global Contribution, Sales By Geographic, Region Dashboard. It is also available for immediate download and adjustment. So, changes can be made in the color, design, graphics or any other component to create a unique layout.
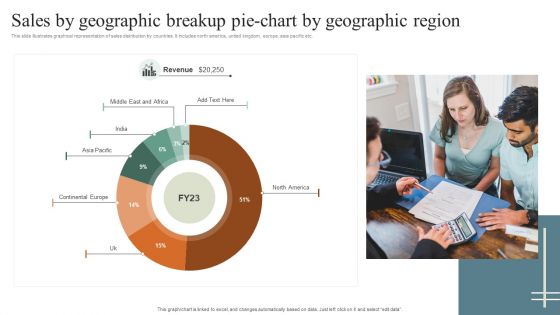
Sales By Geographic Breakup Pie Chart By Geographic Region Rules PDF
This slide illustrates graphical representation of sales distribution by countries. It includes north america, united kingdom, europe, asia pacific etc. Pitch your topic with ease and precision using this Sales By Geographic Breakup Pie Chart By Geographic Region Rules PDF. This layout presents information on Sales By Geographic, Geographic Region. It is also available for immediate download and adjustment. So, changes can be made in the color, design, graphics or any other component to create a unique layout.
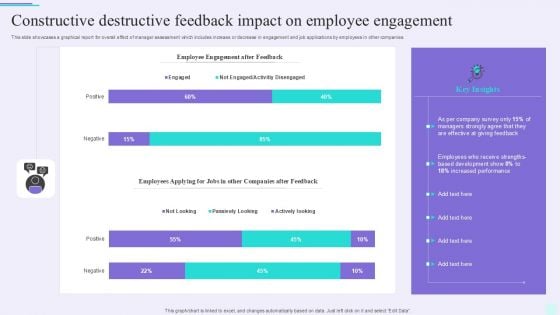
Constructive Destructive Feedback Impact On Employee Engagement Pictures PDF
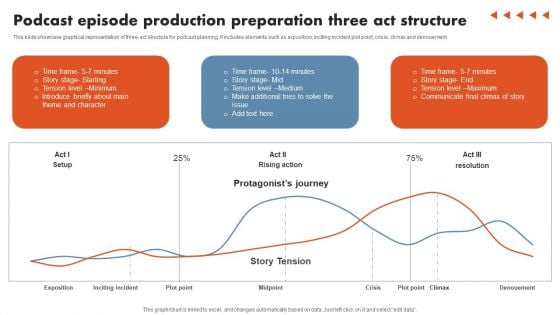
Podcast Episode Production Preparation Three Act Structure Elements PDF
This slide showcase graphical representation of three-act structure for podcast planning. It includes elements such as exposition, inciting incident plot point, crisis, climax and denouement. Pitch your topic with ease and precision using this Podcast Episode Production Preparation Three Act Structure Elements PDF. This layout presents information on Podcast Episode Production, Preparation Three Act Structure. It is also available for immediate download and adjustment. So, changes can be made in the color, design, graphics or any other component to create a unique layout.
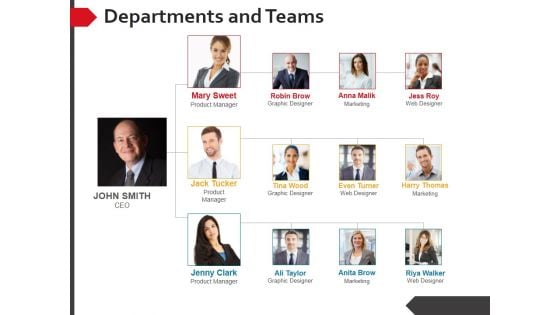
Departments And Teams Ppt PowerPoint Presentation Infographic Template Visual Aids
This is a departments and teams ppt powerpoint presentation infographic template visual aids. This is a four stage process. The stages in this process are ceo, product manager, graphic designer, marketing, product manager, graphic designer, web designer.
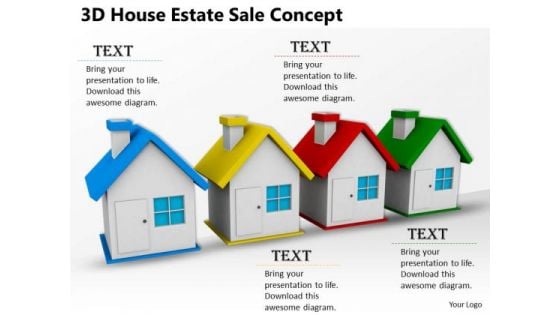
Stock Photo 3d House Home Red Blue Green Yellow Estate Sale Concept PowerPoint Slide
Explain the sale and good marketing strategy concepts with this image. This image has been designed with graphic of 3d houses in red, blue and green colors. Describe sales strategy and business ideas with this unique graphic image.

Stock Photo 3d Irish Hat For Festive Celebration PowerPoint Slide
This beautiful image has been designed with graphic of 3d Irish hat for Patrick's Day. Display the celebration of Patrick's day with this graphic image. Use this image for festival related presentations.

Stock Photo Metal Polished Gears PowerPoint Slide
This unique image is developed with graphic of metal gears. This image shows the concept of process control for business or marketing. Define the importance of process control with this suitable image. Get noticed in crowd with this graphic masterpiece.
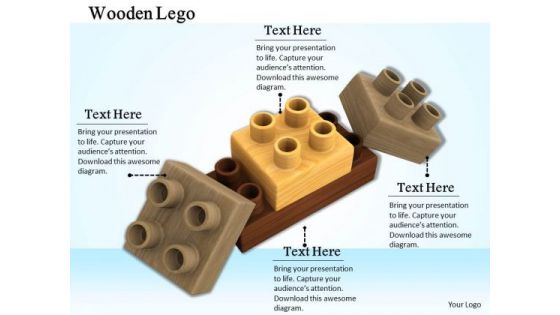
Stock Photo Lego Blocks For Teamwork Concept PowerPoint Slide
This conceptual power point image has been crafted with graphic of Lego blocks. This image displays the concept of teamwork. Use this image in your business presentations if you need to show teamwork in a graphical way.
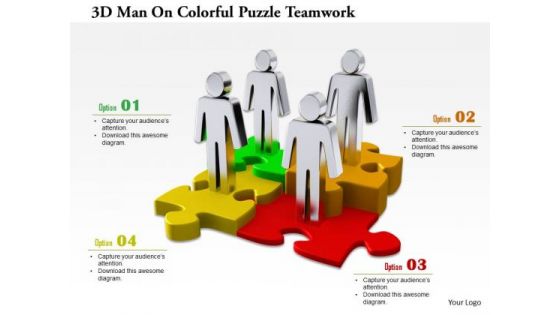
3d Man On Colorful Puzzle Teamwork
This exclusive image slide has been designed with graphic of 3d men on colorful puzzles. This image slide contains graphic of 3d team of puzzles depicting concept of teamwork. Build an innovative presentation using this professional image slide.
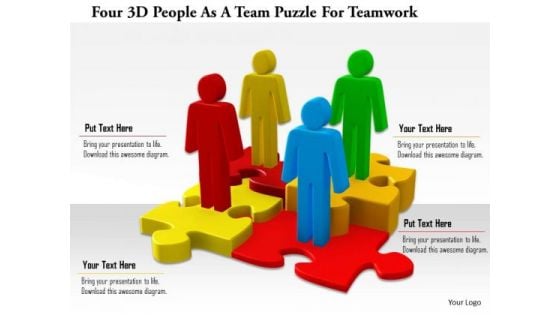
Four 3d People As A Team Puzzle For Teamwork
This exclusive image slide has been designed with graphic of 3d men on colorful puzzles. This image slide contains graphic of 3d team of puzzles depicting concept of teamwork. Build an innovative presentation using this professional image slide.

Stock Photo 24 Hours 7 Days Support Services PowerPoint Slide
This image is designed with 3d graphic of 24 hours 7 days support services concept. Graphic of phone is used in this image to display 24 hour customer support. Accelerate the impact of your ideas with this image slide.
Stock Photo 3d Eggs With Cheeked Texture PowerPoint Slide
This unique image has been designed with graphic of white textured Easter eggs. These Easter eggs are full with surprises. We have designed these eggs to surprise you. Make a beautiful presentation on Easter festival with this cute graphic image.

Stock Photo 3d House With Sale Board PowerPoint Slide
Concept of sale in real-estate is well defined in this graphic image. To display this concept we have used graphic of 3d house with sale board. This image is designed for real-estate and marketing strategy related topics.
Stock Photo 3d Human Icons On World Map For Global Business Relation PowerPoint Slide
Concept of global business relation has been well explained in this graphic image. To explain this concept we have used graphic of 3d human icons and world map. Display market development strategy with this unique image.
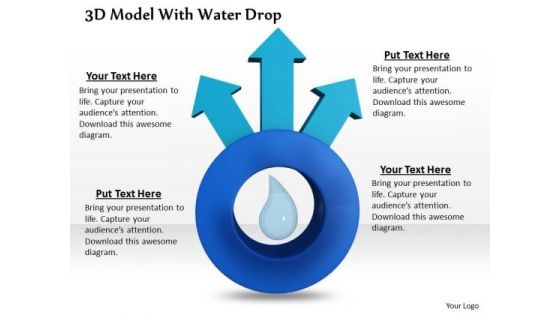
Stock Photo 3d Model With Water Drop PowerPoint Slide
Save the water, this massage has been displayed in this graphic image. To display this massage we have used graphic of water drop and model. Explain the importance of saving water with this exclusive image.
Stock Photo 3d Red Glass Balls In A Circle PowerPoint Slide
This creative graphic image has been crafted with graphic of red colored balls in a circle. These balls are showing the concept of team and unity. Define team management and skills for unity with this unique image.
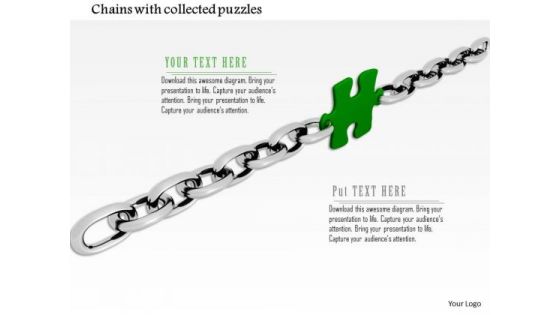
Stock Photo Green Puzzle Link In Silver Chain PowerPoint Slide
This unique image is developed with graphic of green puzzle link in silver chain. This image shows the concept of teamwork. Get noticed in crowd with this graphic masterpiece.
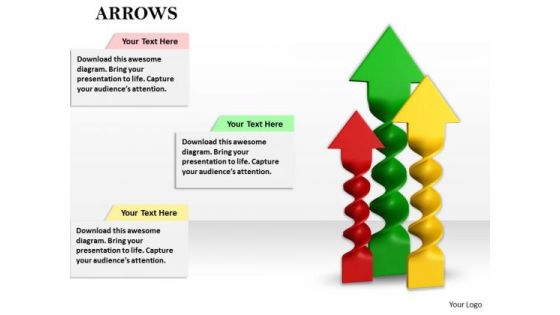
Stock Photo Colorful Arrows In Upward Position PowerPoint Slide
This graphic image slide has been crafted with graphic of colorful twisted arrows. These arrows are in upward direction which shows the concept of profit and growth. Use this image slide in your business and finance related presentations.
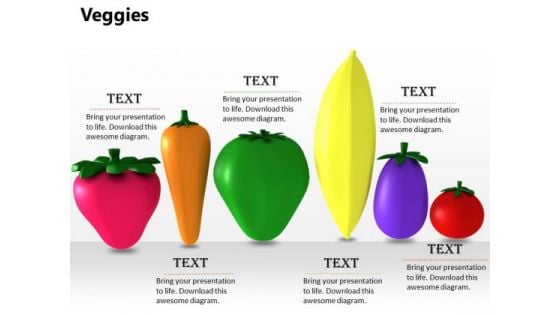
Stock Photo Illustration Of Colorful Vegetables PowerPoint Slide
This power point image slide as been designed with graphic of colorful vegetables. Display the health benefits of vegetables in a graphical way. Use this image for diet and food related presentations.
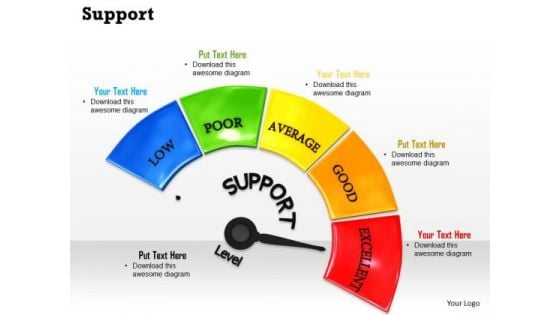
Stock Photo Support Meter With Excellent Level Pwerpoint Slide
This graphic image has been crafted with graphic of meter which have text support. This image shows the excellent level on the meter. Judge the quality of support for any business and display it in your presentation.
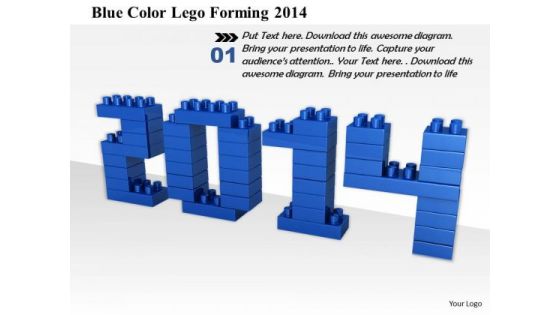
Stock Photo Blue Color Lego Forming 2014 PowerPoint Slide
This power point slide has been designed with graphic of blue colored Lego blocks which are forming 2014 year graphic. Use this image slide for new year related presentations. Build a stunning presentation for your viewers with this unique design.
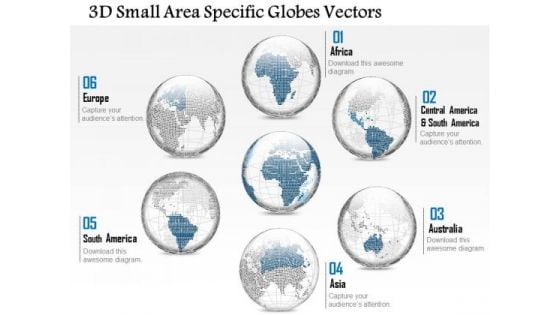
Business Diagram 3d Small Area Specific Globes Vectors Presentation Template
This unique business power point slide has been designed with graphic of multiple globes. Each globe contains the graphic of different highlighted country. Use this image for business presentations based on various countries.

Our Team Ppt PowerPoint Presentation File Picture
This is a our team ppt powerpoint presentation file picture. This is a four stage process. The stages in this process are graphic designer, web developer, sales manager, graphic designer.
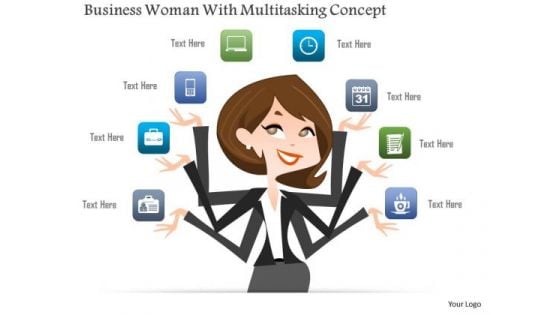
Business Woman With Multitasking Concept PowerPoint Template
This power point template diagram has been crafted with graphic of business woman. This graphic shows the concept of multitasking. Use this PPT for your task related topics in any business or management related presentations.
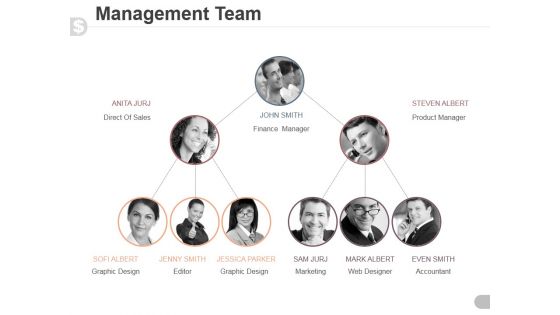
Management Team Template 5 Ppt PowerPoint Presentation Show
This is a management team template 5 ppt powerpoint presentation show. This is a three stage process. The stages in this process are direct of sales, finance manager, product manager, graphic design, editor, graphic design, marketing, web designer, accountant.
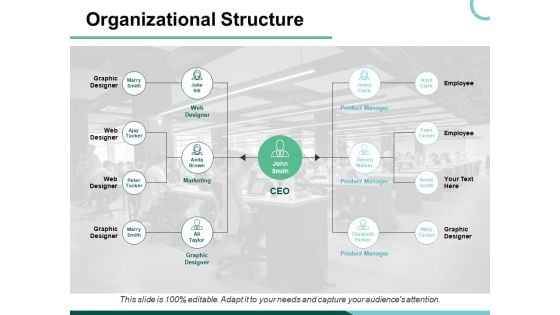
Organizational Structure Ppt PowerPoint Presentation Layouts Backgrounds
This is a organizational structure ppt powerpoint presentation layouts backgrounds. This is a two stage process. The stages in this process are graphic designer, web designer, graphic designer, product manager.
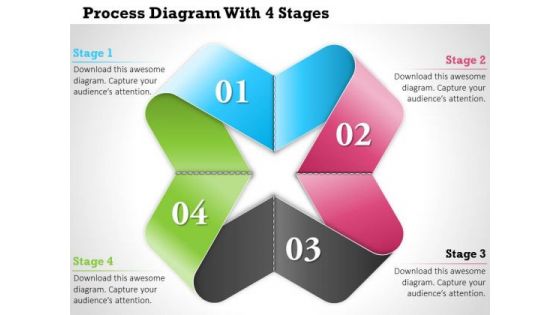
Consulting Slides Business Process Diagram With 4 Stages Business Presentation
Use this graphic to explain your professional ideas that are broad based but combined for specific goal. It is an excellent graphic to attract the attention of your audience. Illustrate your plan of action with this diagram.
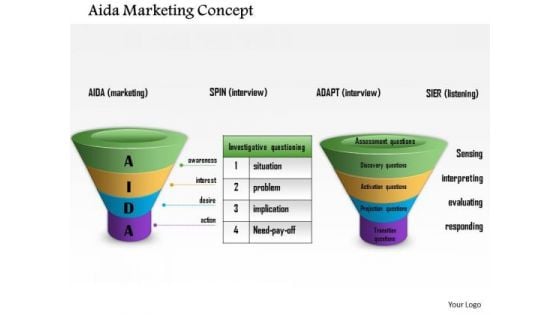
Business Framework Aida Marketing Concept PowerPoint Presentation
Use this graphic to explain Aida marketing concepts. It is an excellent graphic to attract the attention of your audience. Download this AIDA marketing diagram for your business presentations.
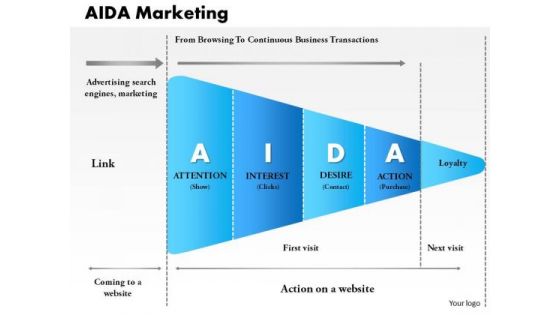
Business Framework Aida Marketing PowerPoint Presentation
Use this graphic to explain AIDA marketing concepts. It is an excellent graphic to attract the attention of your audience. Download this AIDA marketing diagram for your business presentations.
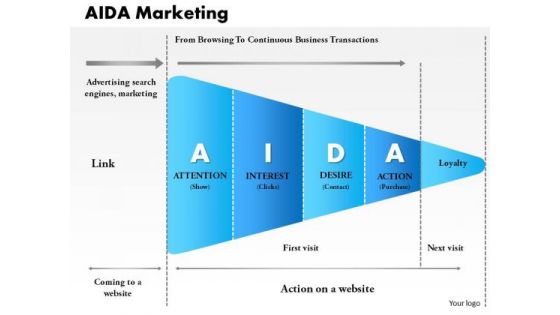
Business Framework Aida Marketing PowerPoint Presentation 2
Use this graphic to explain AIDA marketing concepts. It is an excellent graphic to attract the attention of your audience. Download this AIDA marketing diagram for your business presentations


 Continue with Email

 Home
Home


