Graphics
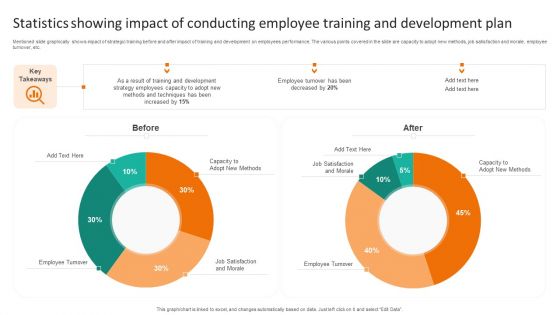
Statistics Showing Impact Of Conducting Employee Training And Development Plan Brochure PDF
Mentioned slide graphically shows impact of strategic training before and after impact of training and development on employees performance. The various points covered in the slide are capacity to adopt new methods, job satisfaction and morale, employee turnover, etc. Pitch your topic with ease and precision using this Statistics Showing Impact Of Conducting Employee Training And Development Plan Brochure PDF. This layout presents information on Strategy Employees, Development, Methods And Techniques. It is also available for immediate download and adjustment. So, changes can be made in the color, design, graphics or any other component to create a unique layout.
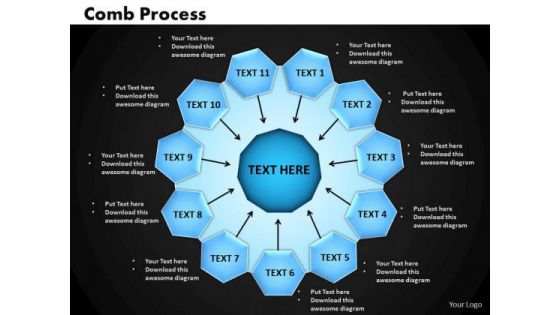
Business Circle Charts PowerPoint Templates Success Comb Process Ppt Slides
Business Circle Charts PowerPoint Templates Success Comb Process PPT Slides-Use this graphics to organize major factors like business methods, relevant inputs, business association and networking, quality services that will ascertain the height of achievement and can lead to success-Business Circle Charts PowerPoint Templates Success Comb Process PPT Slides-This template can be used for presentations relating to Abstract, Backdrop, Background, Biology, Cell, Chemistry, Computer, Connections, Construction, Design, Digital, Futuristic, Geometric, Graphic, Grid, Hexagon, Holes, Honeycomb, Illustration, Mesh, Modern, Network, Organization, Pattern, Rows, Science, Shape, Structure Never fail to impress with our Business Circle Charts PowerPoint Templates Success Comb Process Ppt Slides. You will be at the top of your game.
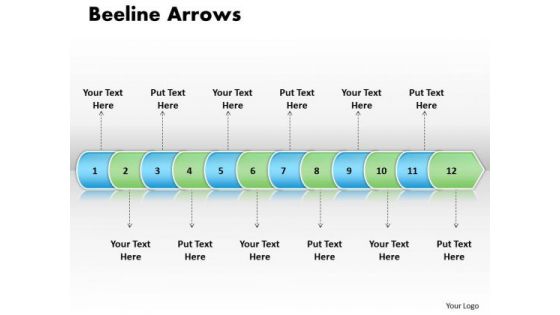
Ppt Linear Arrow 12 Stages PowerPoint Templates
PPT linear arrow 12 stages PowerPoint Templates-This PPT is made of Linear arrows. This graphics is of superlative quality that makes an attractive presentation. This template is quite a remedy to present any process-PPT linear arrow 12 stages PowerPoint Templates-Arrow, Background, Collection, Completed, Concept, Confirmation, Design, Flow, Graph, Graphic, Illustration, Indication, Indicator, Information, Instruction, Interface, Internet, Layout, Measurement, Order, Phase, Pointer, Process, Progress, Reflection, Scale, Shape, Sign Make the event with our Ppt Linear Arrow 12 Stages PowerPoint Templates. Your thoughts will be really happening.
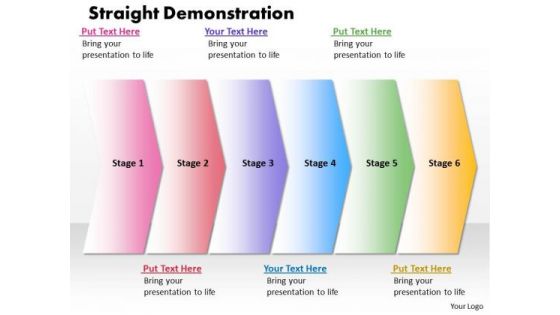
Ppt Straight Demonstration Of 6 State Diagram PowerPoint Templates
PPT straight demonstration of 6 state diagram PowerPoint Templates-An excellent graphics that help you convey your ideas successfully - no matter what they are. Use this Business PowerPoint diagram to show either related or contrasting concepts with some connection.-PPT straight demonstration of 6 state diagram PowerPoint Templates-Linear, Flow, Arrow, Background, Process, Business, Chart, Diagram, Financial, Graphic, Gray, Icon, Illustration, Management, Orange, Perspective, Process, Reflection, Stage, Spheres, Text, Whatever the fare, add on our Ppt Straight Demonstration Of 6 State Diagram PowerPoint Templates. They go down well with everything.
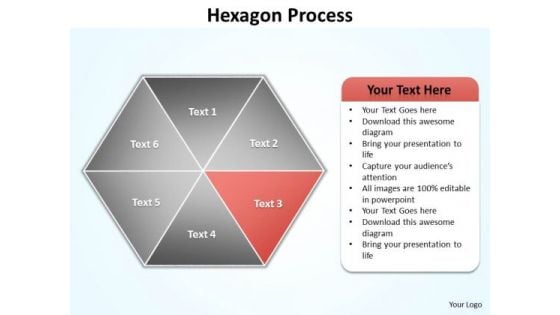
Ppt Orange Factor Regular Hexagon Diagram Editable PowerPoint Templates
PPT orange factor regular hexagon diagram editable PowerPoint templates-Use this graphics to organize major factors like business methods, relevant inputs, business association and networking, quality services that will ascertain the height of achievement and can lead to success.-PPT orange factor regular hexagon diagram editable PowerPoint templates-attached, backgrounds, blue, cell, color, component, connect, connection, diagram, elements, geometric, graphic, group, hexagon, honeycomb, icon, illustration, intricacy, lines, link, map, mesh, model, network, science, shape, shiny, strategy, structure, symbol, teamwork, technology Bring all your acumen to the counselling session. Give actionable advice with our Ppt Orange Factor Regular Hexagon Diagram Editable PowerPoint Templates.
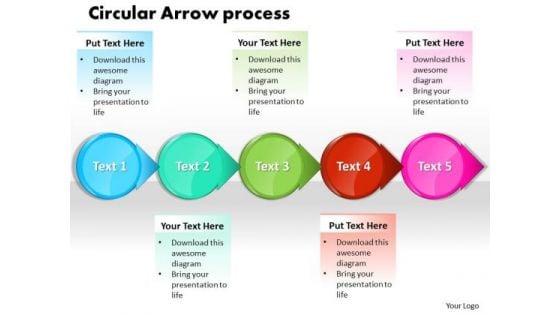
Ppt Circle Arrow Free Business Presentation Process Flow Chart PowerPoint Templates
PPT circle arrow free business presentation process flow chart PowerPoint Templates-This Business Oriented Chart will definitely help you to be more Successful. Use this graphics as key element in streamlining your plans. It consists of Circular Arrows connected together to form a complete Process.-PPT circle arrow free business presentation process flow chart PowerPoint Templates-abstract, access, arrow, background, banner, blue, bright, business, chart, circle, colorful, concept, corporate, creative, cycle, design, different, element, frame, graphic, group, idea, illustration, process, shape, speech, strategy, symbol, template, text, usable, vector Our Ppt Circle Arrow Free Business Presentation Process Flow Chart PowerPoint Templates are up for any experiment. They are ready to establish new benchmarks.
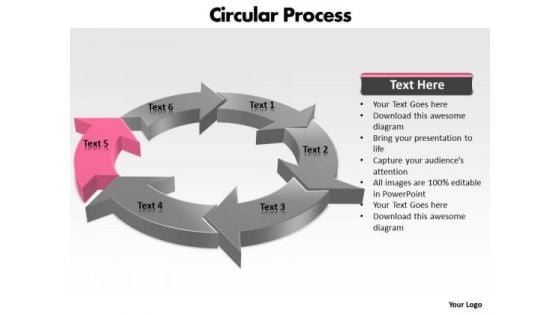
Ppt Components Of Circular Process Layout PowerPoint Templates
PPT components of circular process layout PowerPoint Templates-You can use this circular flow diagram as basic economic model which describes the flow of money and products throughout the economy in a very simplified way. Use this graphics as key element in streamlining your economic plans-PPT components of circular process layout PowerPoint Templates-Arrow, Chart, Circular, Color, Colorful, Connect, Connection, Design, Diagram, Finance, Graphic, Group, Growth, Icon, Illustration, Marketing, Pieces, Process, Recycle, Recycling, Round, Set, Strategy, Symbol, Wheel Take the plunge with our Ppt Components Of Circular Process Layout PowerPoint Templates. Success will surely ensue.
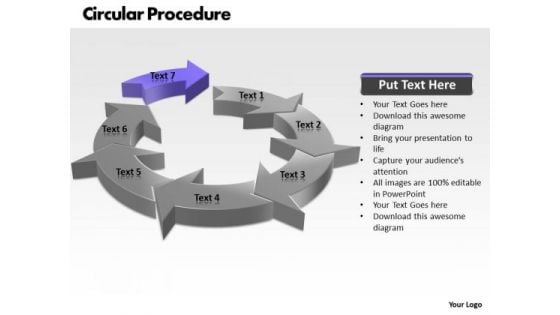
Ppt Concepts Of Circular PowerPoint Menu Template Procedure 7 State Diagram Templates
PPT concepts of circular powerpoint menu template procedure 7 state diagram Templates-Create stunning Microsoft office PPT Presentations with our professional template. Use this graphics to develop detailed sequence diagrams as the core process in systems design-PPT concepts of circular powerpoint menu template procedure 7 state diagram Templates-Arrow, Chart, Circular Procedure, Color, Colorful, Connect, Connection, Design, Diagram, Finance, Graphic, Group, Growth, Icon, Illustration, Marketing, Pieces, Process, Recycle, Recycling, Round, Set, Strategy, Symbol, Wheel Experience the exquisite designs of our Ppt Concepts Of Circular PowerPoint Menu Template Procedure 7 State Diagram Templates. Combine them with your thoughts for a great package.
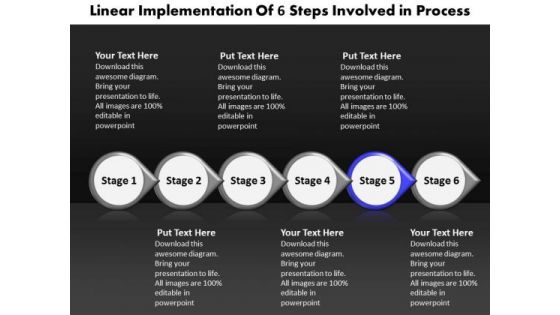
Ppt Linear Implementation Of Six PowerPoint Slide Numbers Involved Process Templates
PPT linear implementation of six powerpoint slide numbers involved process Templates-All elements of the venture are equally critical. This is an excellent graphics to spread the light of knowledge around you, clear the doubts and enlighten the questioning minds with your brilliance and ability.-PPT linear implementation of six powerpoint slide numbers involved process Templates-3d, Abstract, Advertisement, Aim, Arrow, Business, Circular, Cursor, Direction, Down, Environment, Form, Glossy, Graphic, Icon, Illustration, Information, Mark, Motion, Perspective, Point, Sale, Shadow, Shape, Shiny, Sign Deliver growth on a platter with our Ppt Linear Implementation Of Six PowerPoint Slide Numbers Involved Process Templates. You will come out on top.
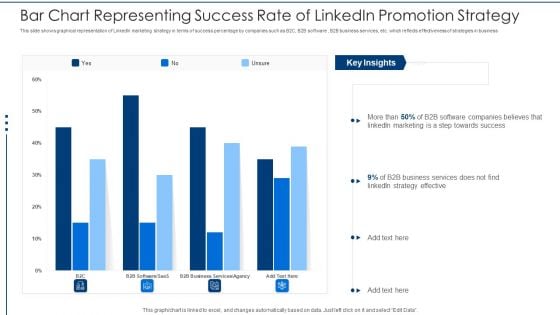
Bar Chart Representing Success Rate Of Linkedin Promotion Strategy Rules PDF
This slide shows graphical representation of LinkedIn marketing strategy in terms of success percentage by companies such as B2C, B2B software , B2B business services, etc. which reflects effectiveness of strategies in business Pitch your topic with ease and precision using this bar chart representing success rate of linkedin promotion strategy rules pdf. This layout presents information on bar chart representing success rate of linkedin promotion strategy. It is also available for immediate download and adjustment. So, changes can be made in the color, design, graphics or any other component to create a unique layout.
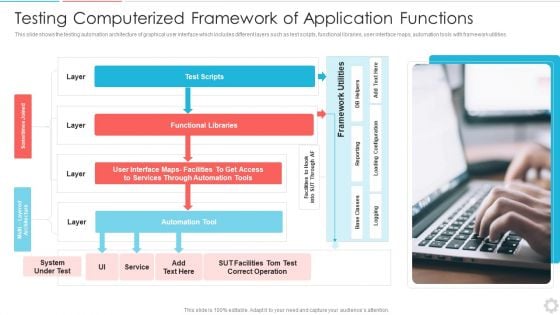
Testing Computerized Framework Of Application Functions Introduction PDF
This slide shows the testing automation architecture of graphical user interface which includes different layers such as test scripts, functional libraries, user interface maps, automation tools with framework utilities. Pitch your topic with ease and precision using this testing computerized framework of application functions introduction pdf. This layout presents information on automation tool, functional libraries, service. It is also available for immediate download and adjustment. So, changes can be made in the color, design, graphics or any other component to create a unique layout.
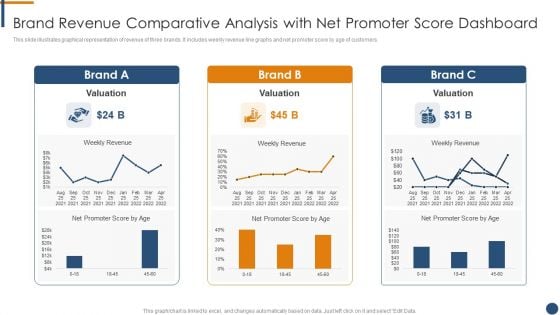
Brand Revenue Comparative Analysis With Net Promoter Score Dashboard Mockup PDF
This slide illustrates graphical representation of revenue of three brands. It includes weekly revenue line graphs and net promoter score by age of customers.Pitch your topic with ease and precision using this Brand Revenue Comparative Analysis With Net Promoter Score Dashboard Mockup PDF. This layout presents information on Brand Revenue Comparative Analysis With Net Promoter Score Dashboard. It is also available for immediate download and adjustment. So, changes can be made in the color, design, graphics or any other component to create a unique layout.
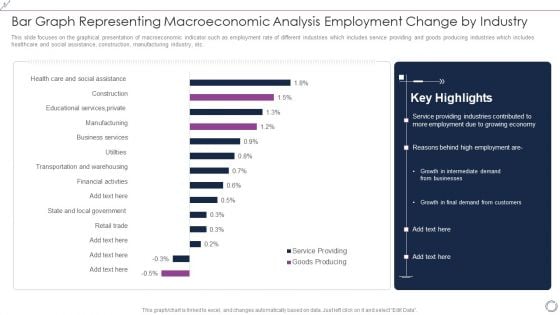
Bar Graph Representing Macroeconomic Analysis Employment Change By Industry Background PDF
This slide focuses on the graphical presentation of macroeconomic indicator such as employment rate of different industries which includes service providing and goods producing industries which includes healthcare and social assistance, construction, manufacturing industry, etc. Pitch your topic with ease and precision using this Bar Graph Representing Macroeconomic Analysis Employment Change By Industry Background PDF. This layout presents information on Goods Producing, Service Providing, Financial, Business. It is also available for immediate download and adjustment. So, changes can be made in the color, design, graphics or any other component to create a unique layout.
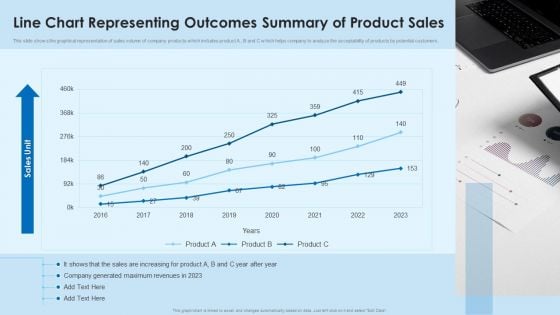
Line Chart Representing Outcomes Summary Of Product Sales Mockup PDF
This slide shows the graphical representation of sales volume of company products which includes product A , B and C which helps company to analyze the acceptability of products by potential customers.Pitch your topic with ease and precision using this Line Chart Representing Outcomes Summary Of Product Sales Mockup PDF This layout presents information on Company Generated, Maximum Revenues, Increasing For Product It is also available for immediate download and adjustment. So, changes can be made in the color, design, graphics or any other component to create a unique layout.
Outcomes Summary Of Company Revenues Using Pie Chart Icons PDF
This slide focuses on graphical representation of revenues earned by company which includes media such as print advertising, electronic-media, events, paid subscriptions , custom publishing, etc.Pitch your topic with ease and precision using this Outcomes Summary Of Company Revenues Using Pie Chart Icons PDF This layout presents information on Custom Publishing, Paid Subscriptions, Revenues Are Generated It is also available for immediate download and adjustment. So, changes can be made in the color, design, graphics or any other component to create a unique layout.
Yearly Outcomes Summary Of Profit And Loss Trends Icons PDF
This slide shows the graphical representation of result summary of profit and loss trends for five consecutive years that shows revenues, cost of goods sold, selling, general and administrative expenses, net income, etc.Pitch your topic with ease and precision using this Yearly Outcomes Summary Of Profit And Loss Trends Icons PDF This layout presents information on Earned Maximum, Selling General, Administrative Expenses It is also available for immediate download and adjustment. So, changes can be made in the color, design, graphics or any other component to create a unique layout.
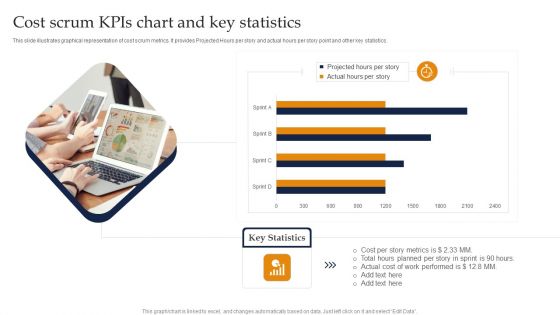
Cost Scrum Kpis Chart And Key Statistics Ppt Layouts Example Introduction PDF
This slide illustrates graphical representation of cost scrum metrics. It provides Projected Hours per story and actual hours per story point and other key statistics. Pitch your topic with ease and precision using this Cost Scrum Kpis Chart And Key Statistics Ppt Layouts Example Introduction PDF. This layout presents information on Projected Hours, Cost Per Story, Metrics, Actual Cost. It is also available for immediate download and adjustment. So, changes can be made in the color, design, graphics or any other component to create a unique layout.
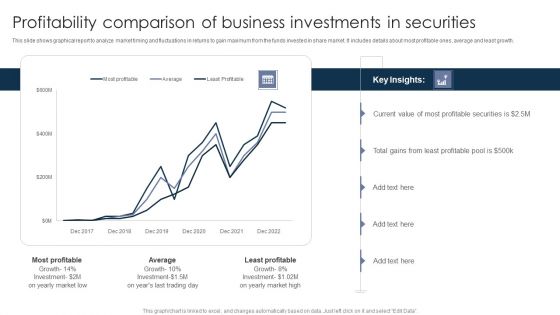
Profitability Comparison Of Business Investments In Securities Ppt PowerPoint Presentation Outline Deck PDF
This slide shows graphical report to analyze market timing and fluctuations in returns to gain maximum from the funds invested in share market. It includes details about most profitable ones, average and least growth. Pitch your topic with ease and precision using this Profitability Comparison Of Business Investments In Securities Ppt PowerPoint Presentation Outline Deck PDF. This layout presents information on Most Profitable, Least Profitable, Least Profitable. It is also available for immediate download and adjustment. So, changes can be made in the color, design, graphics or any other component to create a unique layout.
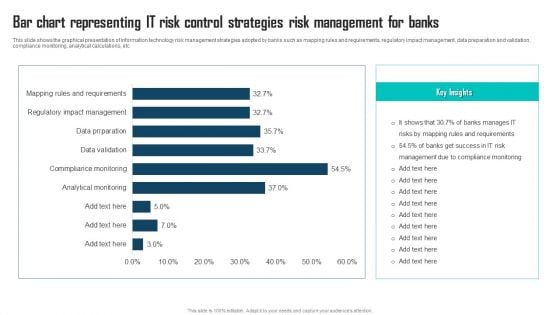
Bar Chart Representing IT Risk Control Strategies Risk Management For Banks Themes PDF
This slide shows the graphical presentation of information technology risk management strategies adopted by banks such as mapping rules and requirements, regulatory impact management, data preparation and validation, compliance monitoring, analytical calculations, etc. Pitch your topic with ease and precision using this Bar Chart Representing IT Risk Control Strategies Risk Management For Banks Themes PDF. This layout presents information on IT Risk Management, Compliance Monitoring, Manages IT Risks. It is also available for immediate download and adjustment. So, changes can be made in the color, design, graphics or any other component to create a unique layout.
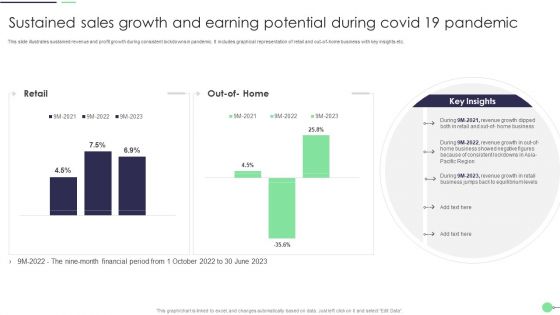
Sustained Sales Growth And Earning Potential During Covid 19 Pandemic Demonstration PDF
This slide illustrates sustained revenue and profit growth during consistent lockdowns in pandemic. It includes graphical representation of retail and out of home business with key insights etc. Pitch your topic with ease and precision using this Sustained Sales Growth And Earning Potential During Covid 19 Pandemic Demonstration PDF. This layout presents information on Revenue Growth, Business, Retail. It is also available for immediate download and adjustment. So, changes can be made in the color, design, graphics or any other component to create a unique layout.
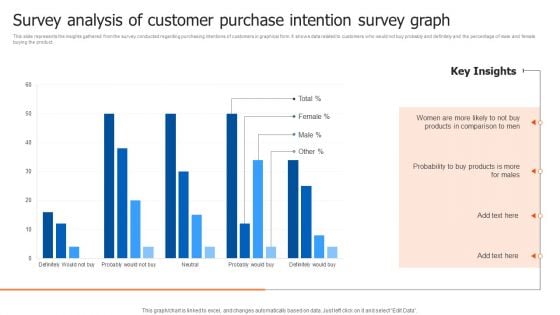
Survey Analysis Of Customer Purchase Intention Survey Graph Structure PDF
This slide represents the insights gathered from the survey conducted regarding purchasing intentions of customers in graphical form. It shows data related to customers who would not buy probably and definitely and the percentage of male and female buying the product. Pitch your topic with ease and precision using this Survey Analysis Of Customer Purchase Intention Survey Graph Structure PDF. This layout presents information on Probability, Products, Key Insights. It is also available for immediate download and adjustment. So, changes can be made in the color, design, graphics or any other component to create a unique layout.
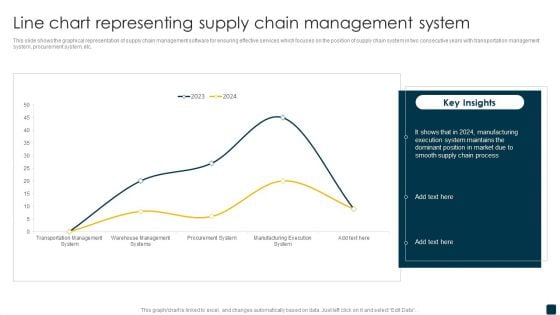
Line Chart Representing Supply Chain Management System Rules PDF
This slide shows the graphical representation of supply chain management software for ensuring effective services which focuses on the position of supply chain system in two consecutive years with transportation management system, procurement system, etc. Pitch your topic with ease and precision using this Line Chart Representing Supply Chain Management System Rules PDF. This layout presents information on Supply Chain Process, Manufacturing, Execution System. It is also available for immediate download and adjustment. So, changes can be made in the color, design, graphics or any other component to create a unique layout.
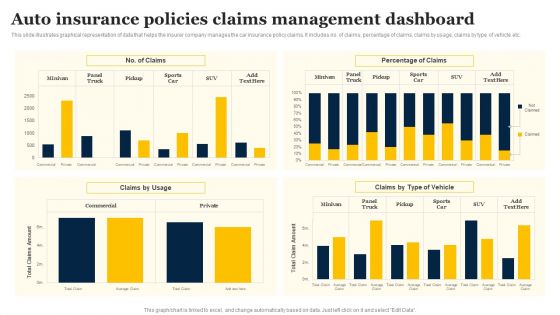
Auto Insurance Policies Claims Management Dashboard Infographics PDF
This slide illustrates graphical representation of data that helps the insurer company manages the car insurance policy claims. It includes no. of claims, percentage of claims, claims by usage, claims by type of vehicle etc. Pitch your topic with ease and precision using this Auto Insurance Policies Claims Management Dashboard Infographics PDF. This layout presents information on Percentage Claims, Claims Usage, Claims Type Vehicle. It is also available for immediate download and adjustment. So, changes can be made in the color, design, graphics or any other component to create a unique layout.
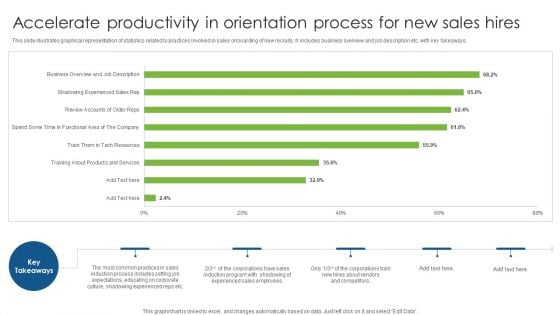
Accelerate Productivity In Orientation Process For New Sales Hires Structure PDF
This slide illustrates graphical representation of statistics related to practices involved in sales onboarding of new recruits. It includes business overview and job description etc. with key takeaways. Pitch your topic with ease and precision using this Accelerate Productivity In Orientation Process For New Sales Hires Structure PDF. This layout presents information on Accelerate Productivity In Orientation, Process For New, Sales Hires. It is also available for immediate download and adjustment. So, changes can be made in the color, design, graphics or any other component to create a unique layout.
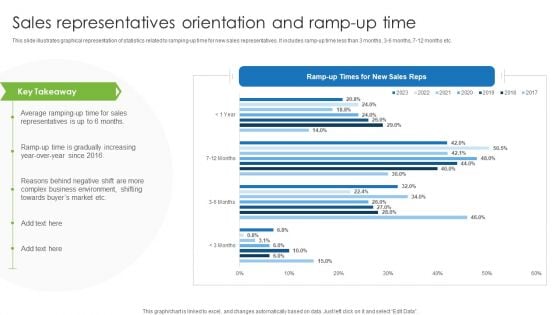
Sales Representatives Orientation And Ramp Up Time Summary PDF
This slide illustrates graphical representation of statistics related to ramping up time for new sales representatives. It includes ramp up time less than 3 months, 3 6 months, 7 12 months etc. Pitch your topic with ease and precision using this Sales Representatives Orientation And Ramp Up Time Summary PDF. This layout presents information on Sales Representatives Orientation, Ramp Up Time. It is also available for immediate download and adjustment. So, changes can be made in the color, design, graphics or any other component to create a unique layout.
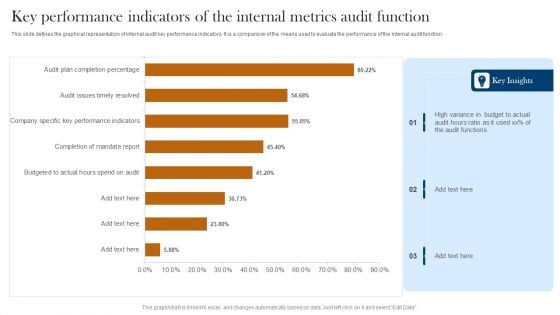
Key Performance Indicators Of The Internal Metrics Audit Function Infographics PDF
This slide defines the graphical representation of internal audit key performance indicators. It is a comparison of the means used to evaluate the performance of the internal audit function. Pitch your topic with ease and precision using this Key Performance Indicators Of The Internal Metrics Audit Function Infographics PDF. This layout presents information on High Variance, Budget To Actual, Audit Functions. It is also available for immediate download and adjustment. So, changes can be made in the color, design, graphics or any other component to create a unique layout.
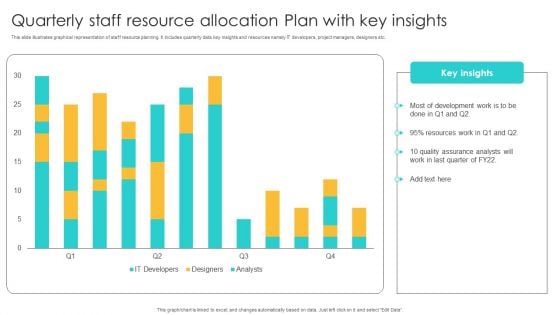
Quarterly Staff Resource Allocation Plan With Key Insights Ppt Rules PDF
This slide illustrates graphical representation of staff resource planning. It includes quarterly data key insights and resources namely IT developers, project managers, designers etc. Pitch your topic with ease and precision using this Quarterly Staff Resource Allocation Plan With Key Insights Ppt Rules PDF. This layout presents information on Development Work, Quality Assurance Analysts, Resources Work. It is also available for immediate download and adjustment. So, changes can be made in the color, design, graphics or any other component to create a unique layout.
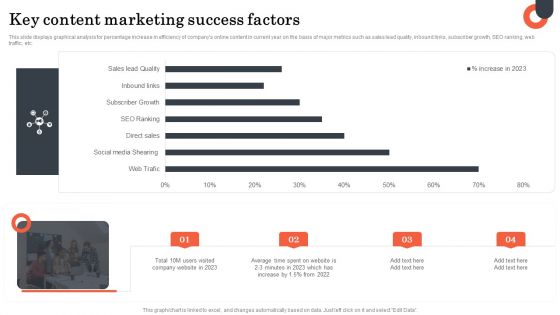
Key Content Marketing Success Factors Microsoft PDF
This slide displays graphical analysis for percentage increase in efficiency of companys online content in current year on the basis of major metrics such as sales lead quality, inbound links, subscriber growth, SEO ranking, web traffic, etc. Pitch your topic with ease and precision using this Key Content Marketing Success Factors Microsoft PDF. This layout presents information on Key Content, Marketing Success Factors. It is also available for immediate download and adjustment. So, changes can be made in the color, design, graphics or any other component to create a unique layout.
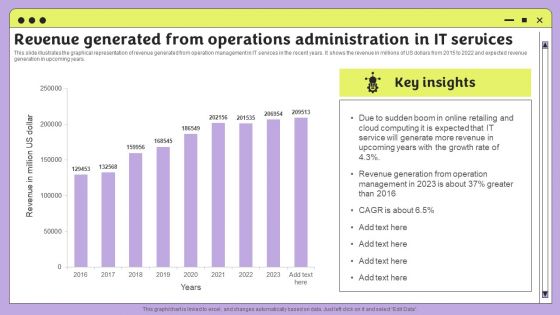
Revenue Generated From Operations Administration In It Services Infographics PDF
This slide illustrates the graphical representation of revenue generated from operation management in IT services in the recent years. It shows the revenue in millions of US dollars from 2015 to 2022 and expected revenue generation in upcoming years. Pitch your topic with ease and precision using this Revenue Generated From Operations Administration In It Services Infographics PDF. This layout presents information on Revenue, Management, Cloud Computing. It is also available for immediate download and adjustment. So, changes can be made in the color, design, graphics or any other component to create a unique layout.
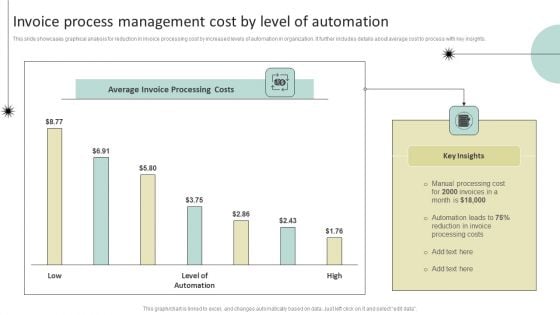
Invoice Process Management Cost By Level Of Automation Demonstration PDF
This slide showcases graphical analysis for reduction in invoice processing cost by increased levels of automation in organization. It further includes details about average cost to process with key insights. Pitch your topic with ease and precision using this Invoice Process Management Cost By Level Of Automation Demonstration PDF. This layout presents information on Average Invoice Processing Costs, Key Insights, Manual Processing Cost. It is also available for immediate download and adjustment. So, changes can be made in the color, design, graphics or any other component to create a unique layout.
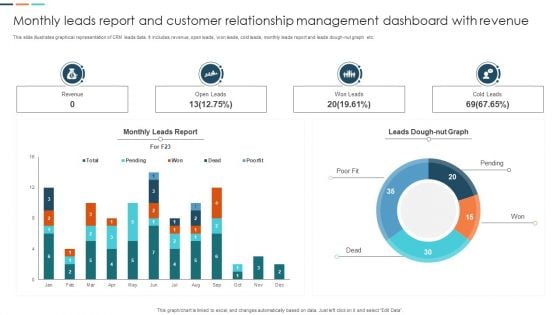
Monthly Leads Report And Customer Relationship Management Dashboard With Revenue Information PDF
This slide illustrates graphical representation of CRM leads data. It includes revenue, open leads, won leads, cold leads, monthly leads report and leads dough nut graph etc. Pitch your topic with ease and precision using this Monthly Leads Report And Customer Relationship Management Dashboard With Revenue Information PDF. This layout presents information on Monthly Leads Report, Customer Relationship Management, Dashboard With Revenue. It is also available for immediate download and adjustment. So, changes can be made in the color, design, graphics or any other component to create a unique layout.
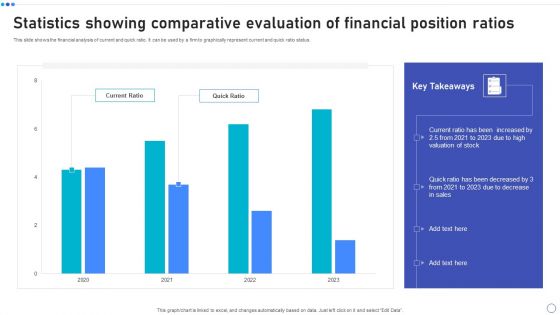
Statistics Showing Comparative Evaluation Of Financial Position Ratios Download PDF
This slide shows the financial analysis of current and quick ratio. It can be used by a firm to graphically represent current and quick ratio status. Pitch your topic with ease and precision using this Statistics Showing Comparative Evaluation Of Financial Position Ratios Download PDF. This layout presents information on Current Ratio, Quick Ratio, 2021 To 2023. It is also available for immediate download and adjustment. So, changes can be made in the color, design, graphics or any other component to create a unique layout.
Comparative Analysis For Manual And Automation Testing Lifecycle Icons PDF
This slide showcases graphical report to compare test expenses from manual and automated testing cycles over the years. It further includes details about benefits that can be derived from test automation cycle. Pitch your topic with ease and precision using this Comparative Analysis For Manual And Automation Testing Lifecycle Icons PDF. This layout presents information on Comparative Analysis For Manual, Automation Testing Lifecycle. It is also available for immediate download and adjustment. So, changes can be made in the color, design, graphics or any other component to create a unique layout.
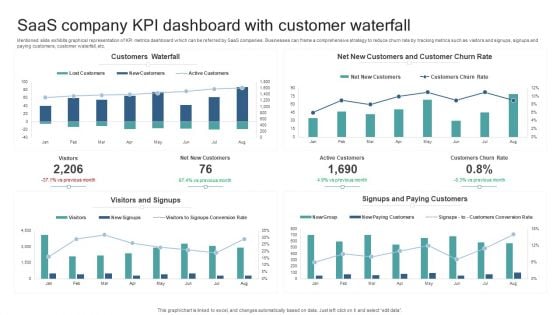
Saas Company KPI Dashboard With Customer Waterfall Slides PDF
Mentioned slide exhibits graphical representation of KPI metrics dashboard which can be referred by SaaS companies. Businesses can frame a comprehensive strategy to reduce churn rate by tracking metrics such as visitors and signups, signups and paying customers, customer waterfall, etc. Pitch your topic with ease and precision using this Saas Company KPI Dashboard With Customer Waterfall Slides PDF. This layout presents information on Customers Waterfall, Visitors And Signups, Signups And Paying Customers. It is also available for immediate download and adjustment. So, changes can be made in the color, design, graphics or any other component to create a unique layout.
IT Checklist For Successful Implementation Of Software Requirement Parameters Icons PDF
This slide signifies the information technology checklist for implementation of application requirement specification. It covers various questions related to the strategies that are either implemented in an organisation for growth. Pitch your topic with ease and precision using this IT Checklist For Successful Implementation Of Software Requirement Parameters Icons PDF. This layout presents information on Performance, Capabilities, Systematic, Graphic. It is also available for immediate download and adjustment. So, changes can be made in the color, design, graphics or any other component to create a unique layout.
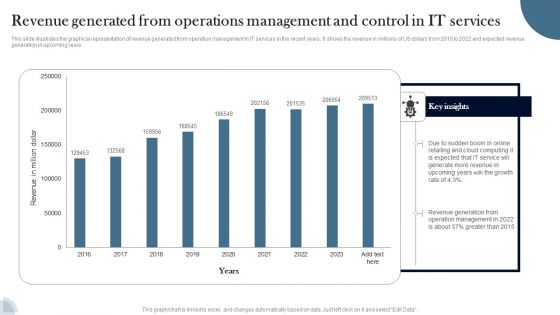
Revenue Generated From Operations Management And Control In IT Services Guidelines PDF
This slide illustrates the graphical representation of revenue generated from operation management in IT services in the recent years. It shows the revenue in millions of US dollars from 2015 to 2022 and expected revenue generation in upcoming years. Pitch your topic with ease and precision using this Revenue Generated From Operations Management And Control In IT Services Guidelines PDF. This layout presents information on Revenue, IT Service, Cloud Computing. It is also available for immediate download and adjustment. So, changes can be made in the color, design, graphics or any other component to create a unique layout.
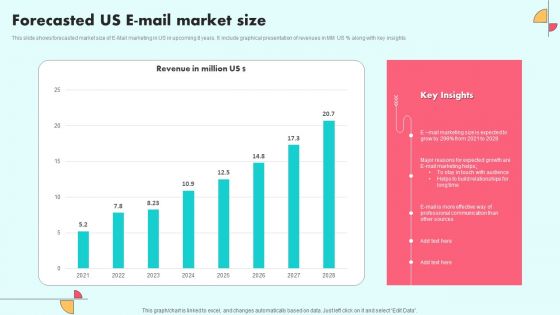
Forecasted Us E Mail Market Size Ideas PDF
This slide shows forecasted market size of E-Mail marketing in US in upcoming 8 years. It include graphical presentation of revenues in MM US percentage along with key insights. Pitch your topic with ease and precision using this Forecasted Us E Mail Market Size Ideas PDF. This layout presents information on E Mail Marketing, Sources, Communication. It is also available for immediate download and adjustment. So, changes can be made in the color, design, graphics or any other component to create a unique layout.

Business Diagram Big Data Written In Brain Made Of Pcb Board Ppt Slide
To define the concept of human intelligence and data technology we have designed an exclusive diagram. This slide contains the graphic of human brain and text of big data with PCB board graphics. Use this slide to build an innovative presentation for your viewers.
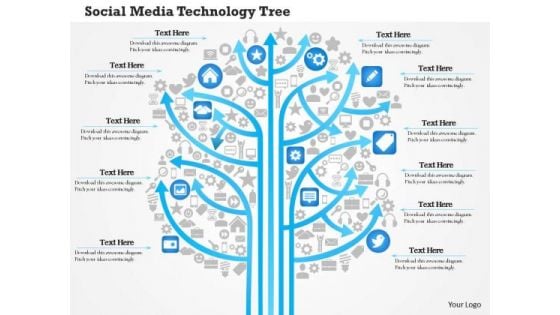
Business Diagram Social Media Technology Tree Showing Various Kinds Of Media Outlets Ppt Slide
Concept of social media application has been displayed in this power point template with suitable graphics. This PPT depicts the graphic of social media tree. This PPT slide displays the various ways to spread and share the information over the social media.
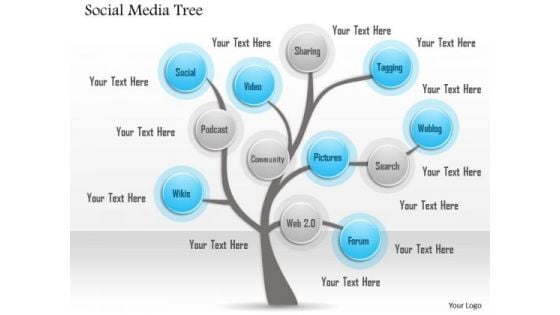
Business Diagram Social Media Tree With Various Ways To Share And Spread Your Word Out Ppt Slide
Concept of social media application has been displayed in this power point template with suitable graphics. This PPT depicts the graphic of social media tree. This PPT slide displays the various ways to spread and share the information over the social media.
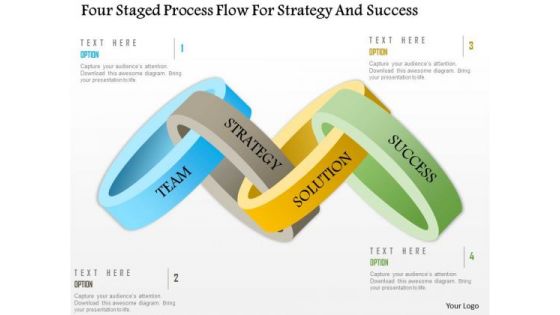
Business Diagram Four Staged Process Flow For Strategy And Success PowerPoint Template
This power point template diagram has been designed with graphic of four staged process flow graphics. This PPT contains the concept of success and strategy. Make your own strategy for your business and marketing topics and display it with this unique PPT.
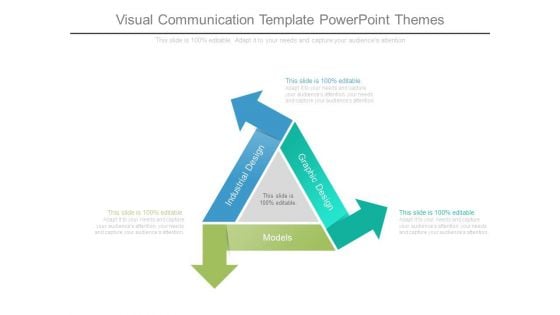
Visual Communication Template Powerpoint Themes
This is a visual communication template powerpoint themes. This is a three stage process. The stages in this process are industrial design, graphic design, models.
Business Diagram Rectangle Showing Four Steps With Icons Presentation Template
This image slide displays 3d colorful graphic of rectangle showing four steps. This image slide has been made with 3d graphic of rectangle with envelope shape on all sides with symbols in center. Use this PowerPoint template, in your presentations to express views on growth, target, management and planning in any business. All text and graphic are editable in this image slide. This image slide will make your presentations colorful.

Customer Testimonials Ppt PowerPoint Presentation Visuals
This is a customer testimonials ppt powerpoint presentation visuals. This is a two stage process. The stages in this process are lily william editor, john finder graphic designer.

Quotes Ppt PowerPoint Presentation Slides Visual Aids
This is a quotes ppt powerpoint presentation slides visual aids. This is a two stage process. The stages in this process are editor, graphic designer.

Stock Photo Conceptual Image Of Target Success Pwerpoint Slide
This image has been crafted with graphic of target dart and arrow. This image contains the concept of target achievement. Use it for business and game related presentations.
Stock Photo Icons Of Innovative Technology PowerPoint Slide
This image displays conceptual image of technology icons. We have used graphic of apple, mobile and globe in this image. Use this innovating image in technology related presentations.

Stock Photo Illustration Of Apartment Mockup PowerPoint Slide
Define the concepts of architecture with this unique image. This image contains the graphic of apartment mockup. Use this image to make presentations on construction, planning etc.
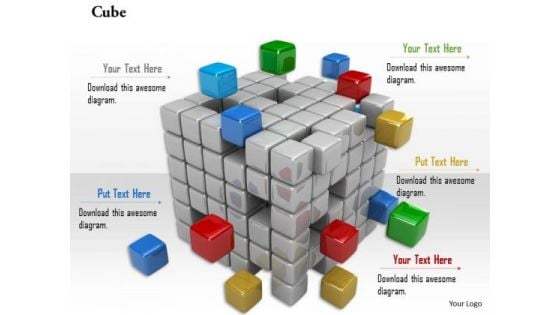
Stock Photo Illustration Of Colorful Cubes PowerPoint Slide
This image is designed with graphic of colorful cubes. In this image cubes representing the team concept. Use this image in your business presentations to display teamwork.
Stock Photo Illustration Yellow Shiny Stars PowerPoint Slide
This image is designed with graphic of yellow shiny stars. This image depicts the concepts of celebration and festivals. Create attractive presentations with this unique image.
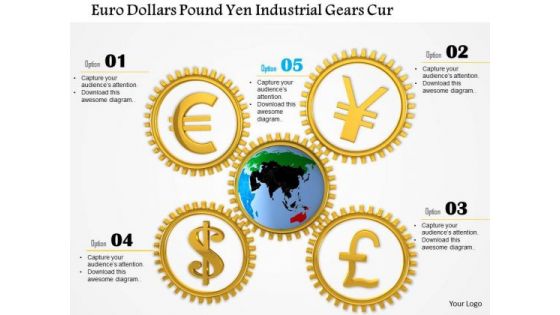
Stock Photo Euro Dollars Pound Yen Around Globe PowerPoint Slide
Our above image is designed with graphic of global currency symbols. Use this image in finance related topics. Above image provides the ideal backdrop to make interactive presentations.
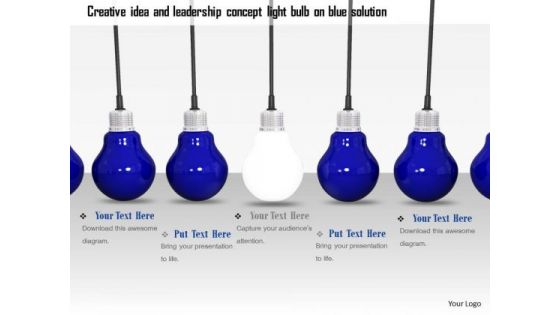
Stock Photo Glowing Bulb In Center Of Blue Bulbs PowerPoint Slide
This image displays graphic of CFL on white background. This image realtes to energy-efficient CFL lightingt. Above image provides the ideal backdrop to make interactive presentations.
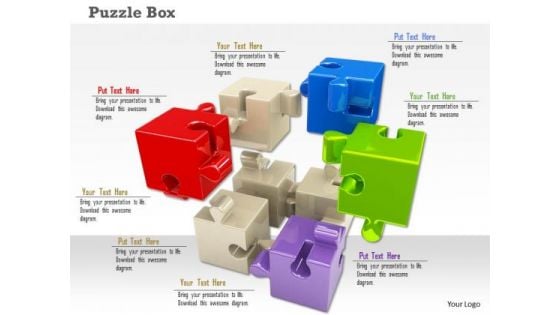
Stock Photo Flying Puzzle Pieces On White Background PowerPoint Slide
This image is designed with graphic of colorful puzzle pieces. In this image puzzles representing the team concept. Use this image in your business presentations to display teamwork.

Stock Photo Electricity Plug In White Socket Pwerpoint Slide
This graphic image is crafted with white plug with socket. This image explains concept of technology electric etc. Enhance the look of your presentations with this image.
Stock Photo White Plug On Socket For Power Supply Pwerpoint Slide
This graphic image is crafted with white plug on socket. This image explains concept of technology electric etc. Enhance the look of your presentations with this image.
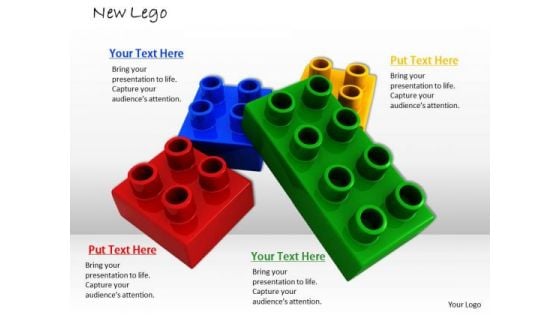
Stock Photo Legos Separated PowerPoint Slide
This image is designed with graphic of colorful lego blocks. In this image blocks representing the team concept. Use this image in your business presentations to display teamwork.
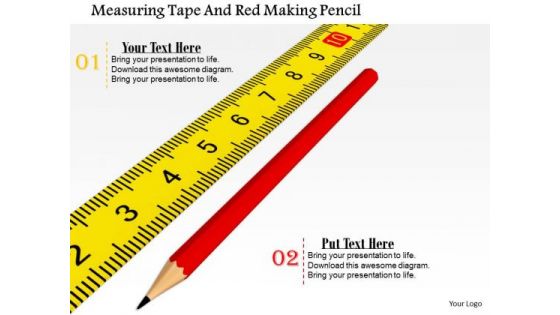
Stock Photo Measuring Tape And Red Pencil PowerPoint Slide
This image displays graphic of Measuring Tape with Red Pencil. Use this image to depict concept of measurement and engineering. Use this image and make an impressive presentation.

Stock Photo Measuring Tape Construction PowerPoint Slide
This image displays graphic of Measuring Tape on white background. Use this image to depict concept of measurement and engineering. Use this image and make an impressive presentation.

Stock Photo Measuring Tape PowerPoint Slide
This image displays graphic of Measuring Tape on white background. Use this image to depict concept of measurement and engineering. Use this image and make an impressive presentation.
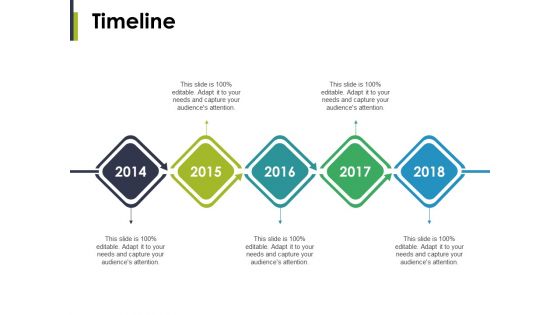
Timeline Ppt PowerPoint Presentation Outline Slides
This is a venn ppt powerpoint presentation summary graphic images. This is a four stage process. The stages in this process are venn, marketing, planning, finance, strategy.


 Continue with Email

 Home
Home


