Graphics
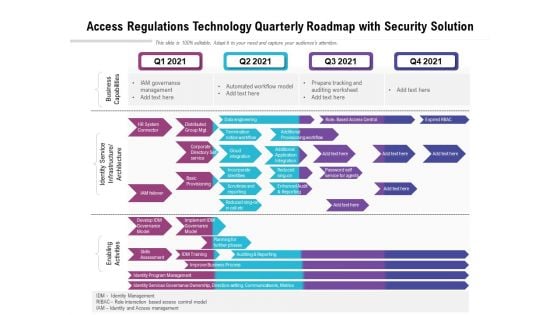
Access Regulations Technology Quarterly Roadmap With Security Solution Graphics
We present our access regulations technology quarterly roadmap with security solution graphics. This PowerPoint layout is easy to edit so you can change the font size, font type, color, and shape conveniently. In addition to this, the PowerPoint layout is Google Slides compatible, so you can share it with your audience and give them access to edit it. Therefore, download and save this well researched access regulations technology quarterly roadmap with security solution graphics in different formats like PDF, PNG, and JPG to smoothly execute your business plan.
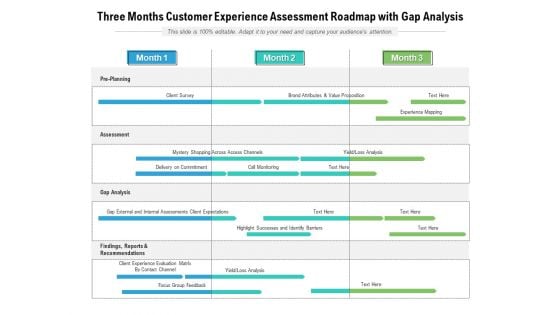
Three Months Customer Experience Assessment Roadmap With Gap Analysis Graphics
We present our three months customer experience assessment roadmap with gap analysis graphics. This PowerPoint layout is easy to edit so you can change the font size, font type, color, and shape conveniently. In addition to this, the PowerPoint layout is Google Slides compatible, so you can share it with your audience and give them access to edit it. Therefore, download and save this well researched three months customer experience assessment roadmap with gap analysis graphics in different formats like PDF, PNG, and JPG to smoothly execute your business plan.

Quarterly Roadmap For Corporate Safety And Access Graphics
We present our quarterly roadmap for corporate safety and access graphics. This PowerPoint layout is easy to edit so you can change the font size, font type, color, and shape conveniently. In addition to this, the PowerPoint layout is Google Slides compatible, so you can share it with your audience and give them access to edit it. Therefore, download and save this well researched quarterly roadmap for corporate safety and access graphics in different formats like PDF, PNG, and JPG to smoothly execute your business plan.
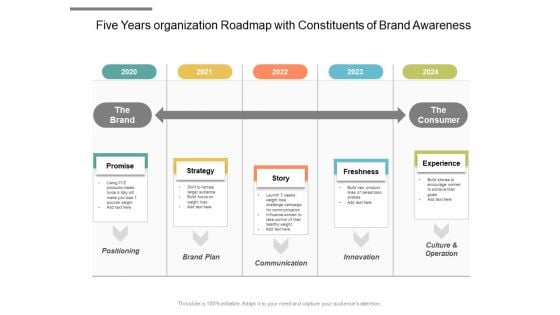
Five Years Organization Roadmap With Constituents Of Brand Awareness Graphics
We present our five years organization roadmap with constituents of brand awareness graphics. This PowerPoint layout is easy-to-edit so you can change the font size, font type, color, and shape conveniently. In addition to this, the PowerPoint layout is Google Slides compatible, so you can share it with your audience and give them access to edit it. Therefore, download and save this well-researched five years organization roadmap with constituents of brand awareness graphics in different formats like PDF, PNG, and JPG to smoothly execute your business plan.
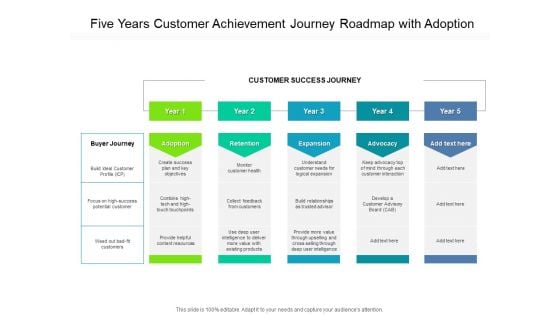
Five Years Customer Achievement Journey Roadmap With Adoption Graphics
We present our five years customer achievement journey roadmap with adoption graphics. This PowerPoint layout is easy-to-edit so you can change the font size, font type, color, and shape conveniently. In addition to this, the PowerPoint layout is Google Slides compatible, so you can share it with your audience and give them access to edit it. Therefore, download and save this well-researched five years customer achievement journey roadmap with adoption graphics in different formats like PDF, PNG, and JPG to smoothly execute your business plan.

Quarterly Business Roadmap For Lean Six Sigma Continuous Enhancement Graphics
We present our quarterly business roadmap for lean six sigma continuous enhancement graphics. This PowerPoint layout is easy-to-edit so you can change the font size, font type, color, and shape conveniently. In addition to this, the PowerPoint layout is Google Slides compatible, so you can share it with your audience and give them access to edit it. Therefore, download and save this well-researched quarterly business roadmap for lean six sigma continuous enhancement graphics in different formats like PDF, PNG, and JPG to smoothly execute your business plan.
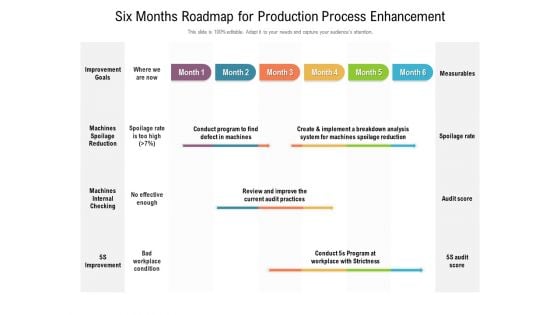
Six Months Roadmap For Production Process Enhancement Graphics
We present our six months roadmap for production process enhancement graphics. This PowerPoint layout is easy to edit so you can change the font size, font type, color, and shape conveniently. In addition to this, the PowerPoint layout is Google Slides compatible, so you can share it with your audience and give them access to edit it. Therefore, download and save this well researched six months roadmap for production process enhancement graphics in different formats like PDF, PNG, and JPG to smoothly execute your business plan.
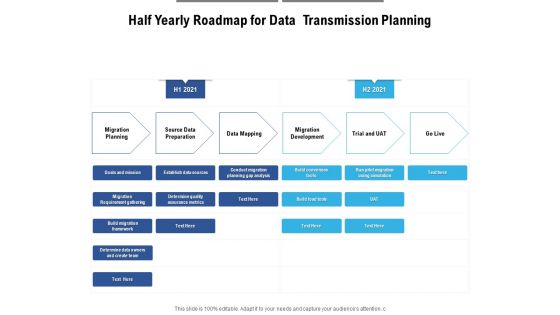
Half Yearly Roadmap For Data Transmission Planning Graphics
We present our half yearly roadmap for data transmission planning graphics. This PowerPoint layout is easy to edit so you can change the font size, font type, color, and shape conveniently. In addition to this, the PowerPoint layout is Google Slides compatible, so you can share it with your audience and give them access to edit it. Therefore, download and save this well researched half yearly roadmap for data transmission planning graphics in different formats like PDF, PNG, and JPG to smoothly execute your business plan.
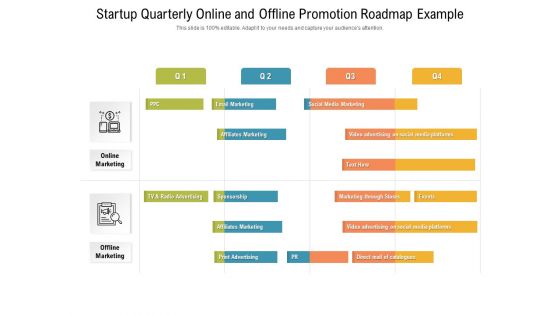
Startup Quarterly Online And Offline Promotion Roadmap Example Graphics
We present our startup quarterly online and offline promotion roadmap example graphics. This PowerPoint layout is easy-to-edit so you can change the font size, font type, color, and shape conveniently. In addition to this, the PowerPoint layout is Google Slides compatible, so you can share it with your audience and give them access to edit it. Therefore, download and save this well-researched startup quarterly online and offline promotion roadmap example graphics in different formats like PDF, PNG, and JPG to smoothly execute your business plan.
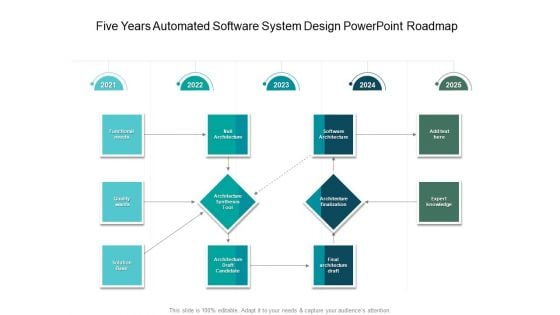
Five Years Automated Software System Design PowerPoint Roadmap Graphics
We present our five years automated software system design powerpoint roadmap graphics. This PowerPoint layout is easy to edit so you can change the font size, font type, color, and shape conveniently. In addition to this, the PowerPoint layout is Google Slides compatible, so you can share it with your audience and give them access to edit it. Therefore, download and save this well researched five years automated software system design powerpoint roadmap graphics in different formats like PDF, PNG, and JPG to smoothly execute your business plan.
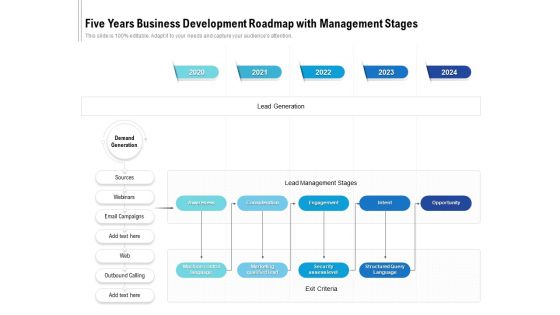
Five Years Business Development Roadmap With Management Stages Graphics
We present our five years business development roadmap with management stages graphics. This PowerPoint layout is easy to edit so you can change the font size, font type, color, and shape conveniently. In addition to this, the PowerPoint layout is Google Slides compatible, so you can share it with your audience and give them access to edit it. Therefore, download and save this well researched five years business development roadmap with management stages graphics in different formats like PDF, PNG, and JPG to smoothly execute your business plan.
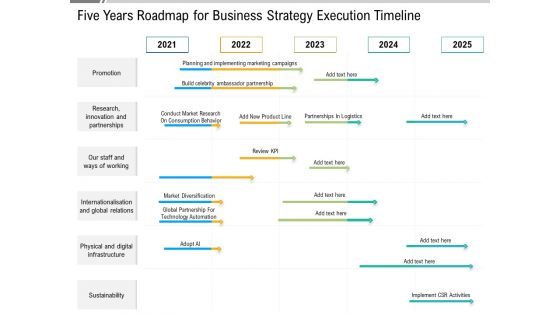
Five Years Roadmap For Business Strategy Execution Timeline Graphics
We present our five years roadmap for business strategy execution timeline graphics. This PowerPoint layout is easy to edit so you can change the font size, font type, color, and shape conveniently. In addition to this, the PowerPoint layout is Google Slides compatible, so you can share it with your audience and give them access to edit it. Therefore, download and save this well researched five years roadmap for business strategy execution timeline graphics in different formats like PDF, PNG, and JPG to smoothly execute your business plan.
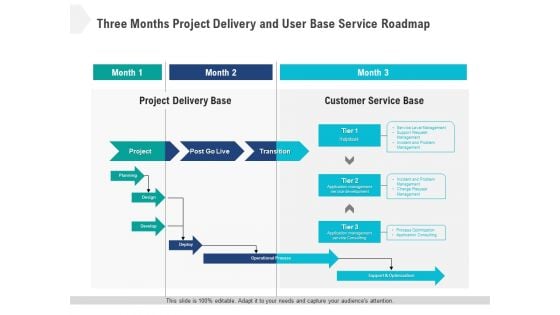
Three Months Project Delivery And User Base Service Roadmap Graphics
We present our three months project delivery and user base service roadmap graphics. This PowerPoint layout is easy to edit so you can change the font size, font type, color, and shape conveniently. In addition to this, the PowerPoint layout is Google Slides compatible, so you can share it with your audience and give them access to edit it. Therefore, download and save this well researched three months project delivery and user base service roadmap graphics in different formats like PDF, PNG, and JPG to smoothly execute your business plan.
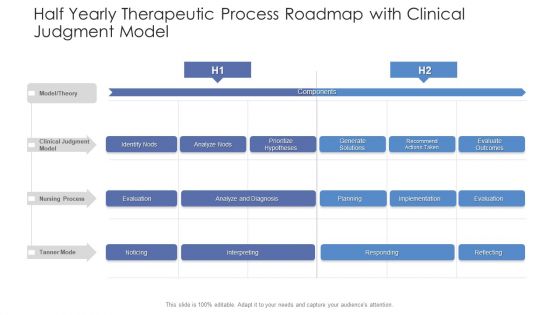
Half Yearly Therapeutic Process Roadmap With Clinical Judgment Model Graphics
We present our half yearly therapeutic process roadmap with clinical judgment model graphics. This PowerPoint layout is easy to edit so you can change the font size, font type, color, and shape conveniently. In addition to this, the PowerPoint layout is Google Slides compatible, so you can share it with your audience and give them access to edit it. Therefore, download and save this well researched half yearly therapeutic process roadmap with clinical judgment model graphics in different formats like PDF, PNG, and JPG to smoothly execute your business plan.

Six Months Roadmap For Online Product Management Graphics PDF
We present our six months roadmap for online product management graphics pdf. This PowerPoint layout is easy-to-edit so you can change the font size, font type, color, and shape conveniently. In addition to this, the PowerPoint layout is Google Slides compatible, so you can share it with your audience and give them access to edit it. Therefore, download and save this well-researched six months roadmap for online product management graphics pdf in different formats like PDF, PNG, and JPG to smoothly execute your business plan.
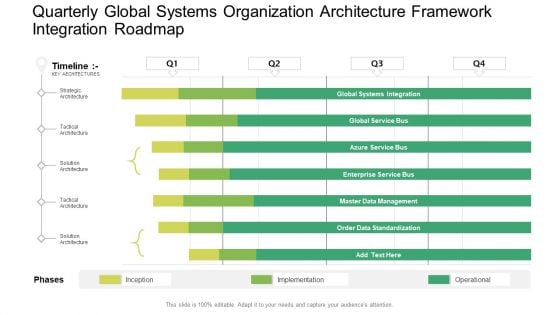
Quarterly Global Systems Organization Architecture Framework Integration Roadmap Graphics PDF
We present our quarterly global systems organization architecture framework integration roadmap graphics pdf. This PowerPoint layout is easy-to-edit so you can change the font size, font type, color, and shape conveniently. In addition to this, the PowerPoint layout is Google Slides compatible, so you can share it with your audience and give them access to edit it. Therefore, download and save this well-researched quarterly global systems organization architecture framework integration roadmap graphics pdf in different formats like PDF, PNG, and JPG to smoothly execute your business plan.
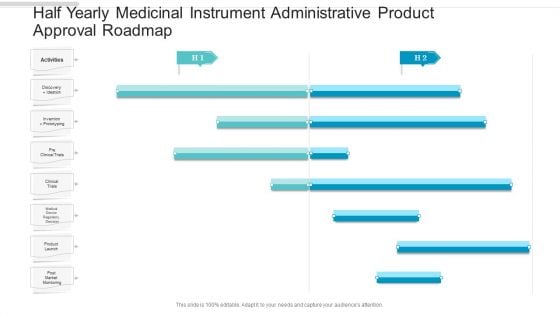
Half Yearly Medicinal Instrument Administrative Product Approval Roadmap Graphics
We present our half yearly medicinal instrument administrative product approval roadmap graphics. This PowerPoint layout is easy to edit so you can change the font size, font type, color, and shape conveniently. In addition to this, the PowerPoint layout is Google Slides compatible, so you can share it with your audience and give them access to edit it. Therefore, download and save this well researched half yearly medicinal instrument administrative product approval roadmap graphics in different formats like PDF, PNG, and JPG to smoothly execute your business plan.
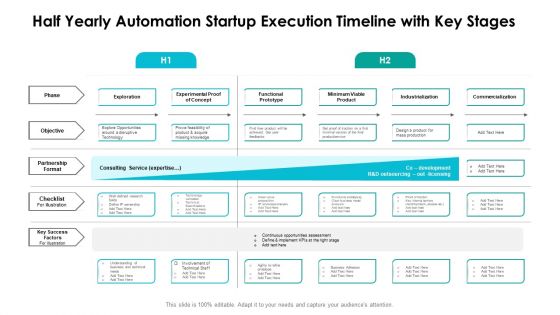
Half Yearly Automation Startup Execution Timeline With Key Stages Graphics
We present our half yearly automation startup execution timeline with key stages graphics. This PowerPoint layout is easy to edit so you can change the font size, font type, color, and shape conveniently. In addition to this, the PowerPoint layout is Google Slides compatible, so you can share it with your audience and give them access to edit it. Therefore, download and save this well researched half yearly automation startup execution timeline with key stages graphics in different formats like PDF, PNG, and JPG to smoothly execute your business plan.
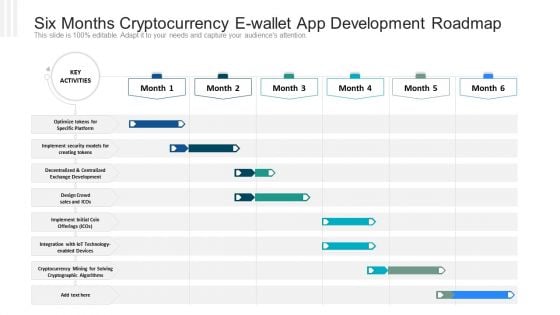
Six Months Cryptocurrency E Wallet App Development Roadmap Graphics PDF
We present our six months cryptocurrency e wallet app development roadmap graphics pdf. This PowerPoint layout is easy-to-edit so you can change the font size, font type, color, and shape conveniently. In addition to this, the PowerPoint layout is Google Slides compatible, so you can share it with your audience and give them access to edit it. Therefore, download and save this well-researched six months cryptocurrency e wallet app development roadmap graphics pdf in different formats like PDF, PNG, and JPG to smoothly execute your business plan.
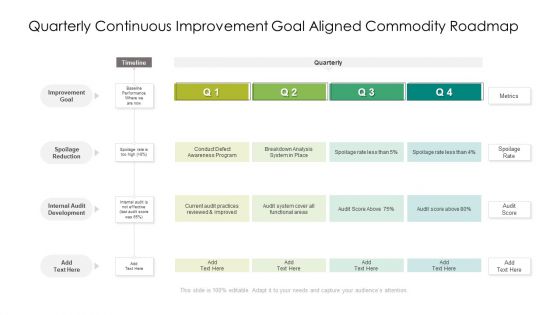
Quarterly Continuous Improvement Goal Aligned Commodity Roadmap Graphics
We present our quarterly continuous improvement goal aligned commodity roadmap graphics. This PowerPoint layout is easy to edit so you can change the font size, font type, color, and shape conveniently. In addition to this, the PowerPoint layout is Google Slides compatible, so you can share it with your audience and give them access to edit it. Therefore, download and save this well researched quarterly continuous improvement goal aligned commodity roadmap graphics in different formats like PDF, PNG, and JPG to smoothly execute your business plan.
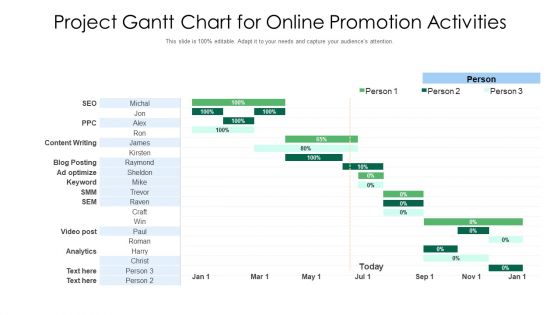
Project Gantt Chart For Online Promotion Activities Graphics PDF
Introducing our project gantt chart for online promotion activities graphics pdf that is designed to showcase some of the vital components that will help you create timelines, roadmaps, and project plans. In addition, also communicate your project durations, milestones, tasks, subtasks, dependencies, and other attributes using this well structured project gantt chart for online promotion activities graphics pdf template. You can also exhibit preeminence against time by deploying this easily adaptable slide to your business presentation. Our experts have designed this template in such a way that it is sure to impress your audience. Thus, download it and steer your project meetings, meetups, and conferences.
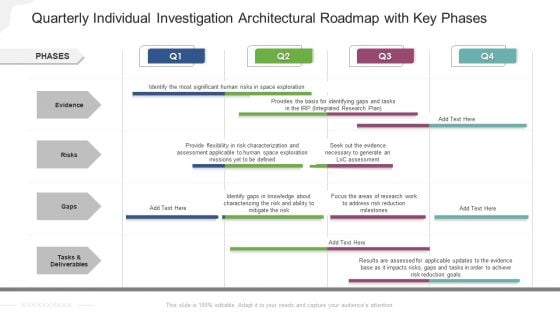
Quarterly Individual Investigation Architectural Roadmap With Key Phases Graphics
We present our quarterly individual investigation architectural roadmap with key phases graphics. This PowerPoint layout is easy to edit so you can change the font size, font type, color, and shape conveniently. In addition to this, the PowerPoint layout is Google Slides compatible, so you can share it with your audience and give them access to edit it. Therefore, download and save this well researched quarterly individual investigation architectural roadmap with key phases graphics in different formats like PDF, PNG, and JPG to smoothly execute your business plan.
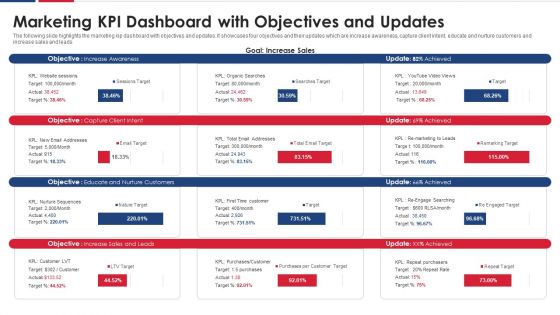
Marketing KPI Dashboard With Objectives And Updates Graphics PDF
The following slide highlights the marketing kip dashboard with objectives and updates. It showcases four objectives and their updates which are increase awareness, capture client intent, educate and nurture customers and increase sales and leads. Pitch your topic with ease and precision using this marketing kpi dashboard with objectives and updates graphics pdf. This layout presents information on sales, customers, target. It is also available for immediate download and adjustment. So, changes can be made in the color, design, graphics or any other component to create a unique layout.
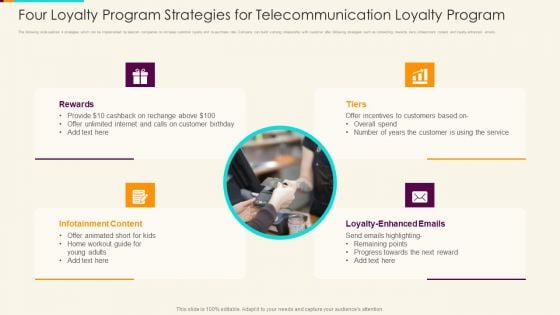
Four Loyalty Program Strategies For Telecommunication Loyalty Program Graphics PDF
The following slide outlines 4 strategies which can be implemented by telecom companies to increase customer loyalty and re-purchase rate. Company can build a strong relationship with customer after following strategies such as connecting rewards, tiers, infotainment content and loyalty-enhanced emails. Pitch your topic with ease and precision using this four loyalty program strategies for telecommunication loyalty program graphics pdf. This layout presents information on rewards, tiers, infotainment content, loyalty enhanced emails. It is also available for immediate download and adjustment. So, changes can be made in the color, design, graphics or any other component to create a unique layout.
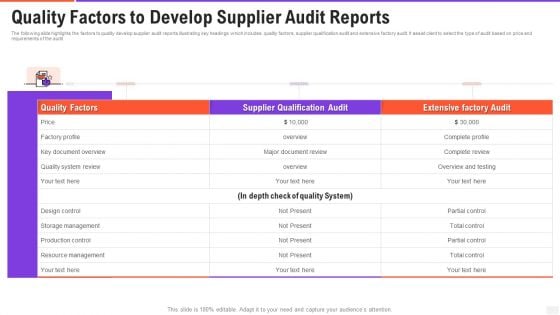
Quality Factors To Develop Supplier Audit Reports Graphics PDF
The following slide highlights the factors to quality develop supplier audit reports illustrating key headings which includes quality factors, supplier qualification audit and extensive factory audit. It assist client to select the type of audit based on price and requirements of the audit. Pitch your topic with ease and precision using this quality factors to develop supplier audit reports graphics pdf. This layout presents information on key document overview, quality system review, resource management. It is also available for immediate download and adjustment. So, changes can be made in the color, design, graphics or any other component to create a unique layout.
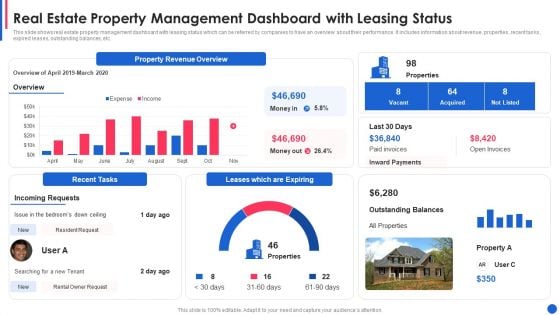
Real Estate Property Management Dashboard With Leasing Status Graphics PDF
This slide shows real estate property management dashboard with leasing status which can be referred by companies to have an overview about their performance. It includes information about revenue, properties, recent tasks, expired leases, outstanding balances, etc.Pitch your topic with ease and precision using this real estate property management dashboard with leasing status graphics pdf This layout presents information on property revenue overview, leases which are expiring, recent tasks It is also available for immediate download and adjustment. So, changes can be made in the color, design, graphics or any other component to create a unique layout.
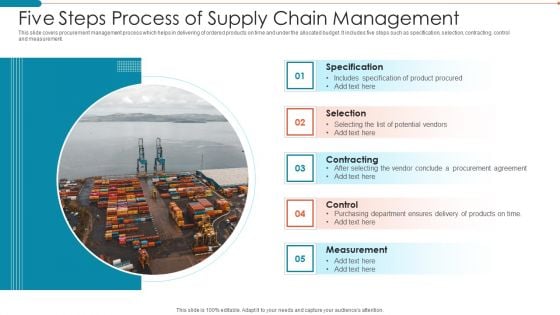
Five Steps Process Of Supply Chain Management Graphics PDF
This slide covers procurement management process which helps in delivering of ordered products on time and under the allocated budget. It includes five steps such as specification, selection, contracting, control and measurement.Pitch your topic with ease and precision using this Five Steps Process Of Supply Chain Management Graphics PDF. This layout presents information on Measurement, Specification, Contracting It is also available for immediate download and adjustment. So, changes can be made in the color, design, graphics or any other component to create a unique layout
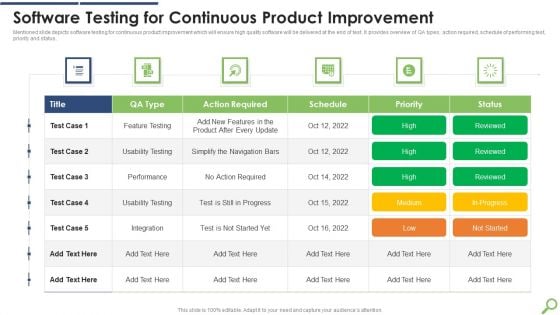
Software Testing For Continuous Product Improvement Graphics PDF
Mentioned slide depicts software testing for continuous product improvement which will ensure high quality software will be delivered at the end of test. It provides overview of QA types, action required, schedule of performing test, priority and status.Pitch your topic with ease and precision using this Software Testing For Continuous Product Improvement Graphics PDF This layout presents information on Action Required, Usability Testing, Simplify Navigation It is also available for immediate download and adjustment. So, changes can be made in the color, design, graphics or any other component to create a unique layout.
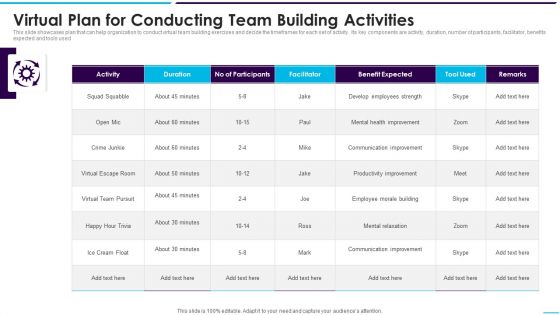
Virtual Plan For Conducting Team Building Activities Graphics PDF
This slide showcases plan that can help organization to conduct virtual team building exercises and decide the timeframes for each set of activity. Its key components are activity, duration, number of participants, facilitator, benefits expected and tools used.Pitch your topic with ease and precision using this Virtual Plan For Conducting Team Building Activities Graphics PDF This layout presents information on Employees Strength, Communication, Improvement It is also available for immediate download and adjustment. So, changes can be made in the color, design, graphics or any other component to create a unique layout.
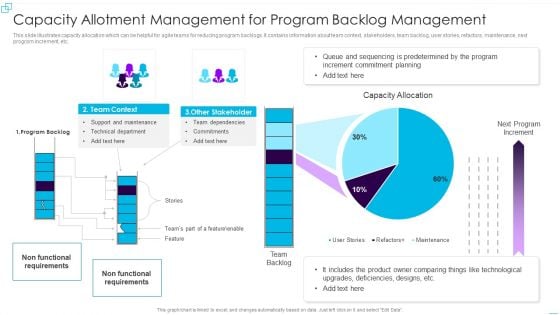
Capacity Allotment Management For Program Backlog Management Graphics PDF
This slide illustrates capacity allocation which can be helpful for agile teams for reducing program backlogs. It contains information about team context, stakeholders, team backlog, user stories, refactors, maintenance, next program increment, etc. Pitch your topic with ease and precision using this Capacity Allotment Management For Program Backlog Management Graphics PDF. This layout presents information on Increment Commitment Planning, Designs, Technological. It is also available for immediate download and adjustment. So, changes can be made in the color, design, graphics or any other component to create a unique layout.
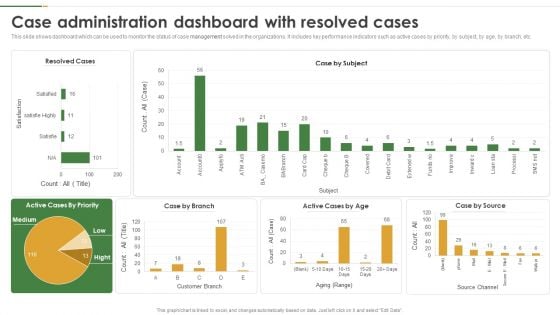
Case Administration Dashboard With Resolved Cases Graphics PDF
This slide shows dashboard which can be used to monitor the status of case management solved in the organizations. It includes key performance indicators such as active cases by priority, by subject, by age, by branch, etc. Pitch your topic with ease and precision using this Case Administration Dashboard With Resolved Cases Graphics PDF. This layout presents information on Case Administration Dashboard, Resolved Cases. It is also available for immediate download and adjustment. So, changes can be made in the color, design, graphics or any other component to create a unique layout.
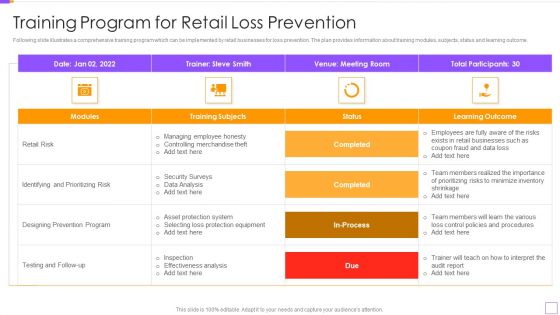
Training Program For Retail Loss Prevention Graphics PDF
Following slide illustrates a comprehensive training program which can be implemented by retail businesses for loss prevention. The plan provides information about training modules, subjects, status and learning outcome. Pitch your topic with ease and precision using this Training Program For Retail Loss Prevention Graphics PDF. This layout presents information on Retail Risk, Designing Prevention Program, Identifying And Prioritizing Risk. It is also available for immediate download and adjustment. So, changes can be made in the color, design, graphics or any other component to create a unique layout.
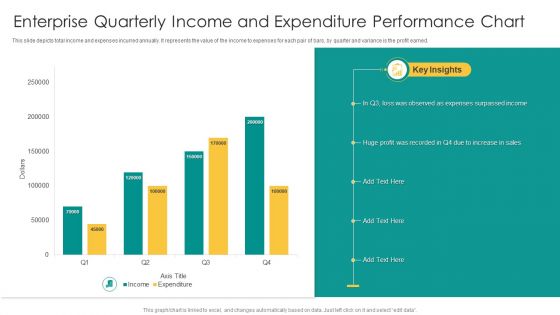
Enterprise Quarterly Income And Expenditure Performance Chart Graphics PDF
This slide depicts total income and expenses incurred annually. It represents the value of the income to expenses for each pair of bars, by quarter and variance is the profit earned. Pitch your topic with ease and precision using this Enterprise Quarterly Income And Expenditure Performance Chart Graphics PDF. This layout presents information on Expenses Surpassed Income, Sales, Huge Profit. It is also available for immediate download and adjustment. So, changes can be made in the color, design, graphics or any other component to create a unique layout.
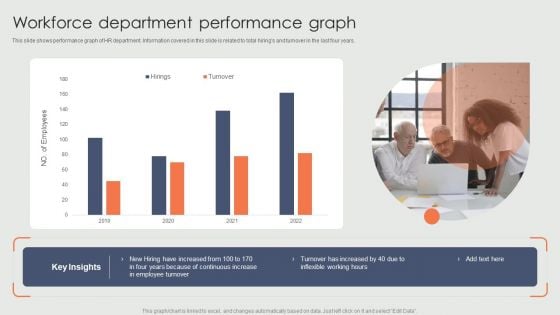
Workforce Department Performance Graph Ppt Model Graphics Pictures PDF
This slide shows performance graph of HR department. Information covered in this slide is related to total hirings and turnover in the last four years. Pitch your topic with ease and precision using this Workforce Department Performance Graph Ppt Model Graphics Pictures PDF. This layout presents information on New Hiring, Continuous Increase, Employee Turnover, 2019 To 2022. It is also available for immediate download and adjustment. So, changes can be made in the color, design, graphics or any other component to create a unique layout.
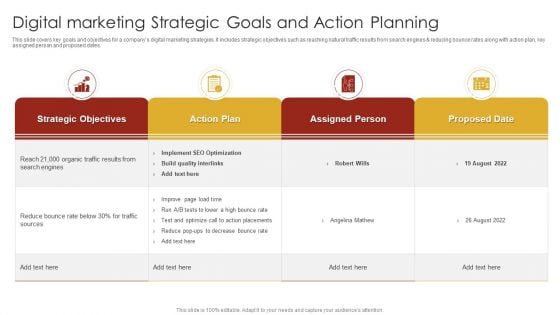
Digital Marketing Strategic Goals And Action Planning Graphics PDF
This slide covers key goals and objectives for a companys digital marketing strategies. It includes strategic objectives such as reaching natural traffic results from search engines and reducing bounce rates along with action plan, key assigned person and proposed dates. Pitch your topic with ease and precision using this Digital Marketing Strategic Goals And Action Planning Graphics PDF. This layout presents information on Strategic Objectives, Action Plan, Quality Interlinks. It is also available for immediate download and adjustment. So, changes can be made in the color, design, graphics or any other component to create a unique layout.
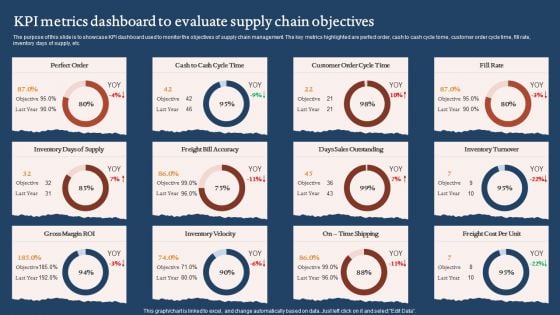
KPI Metrics Dashboard To Evaluate Supply Chain Objectives Graphics PDF
The purpose of this slide is to showcase KPI dashboard used to monitor the objectives of supply chain management. The key metrics highlighted are perfect order, cash to cash cycle tome, customer order cycle time, fill rate, inventory days of supply, etc. Pitch your topic with ease and precision using this KPI Metrics Dashboard To Evaluate Supply Chain Objectives Graphics PDF. This layout presents information on Days Sales Outstanding, Inventory Velocity, Gross Margin Roi. It is also available for immediate download and adjustment. So, changes can be made in the color, design, graphics or any other component to create a unique layout.
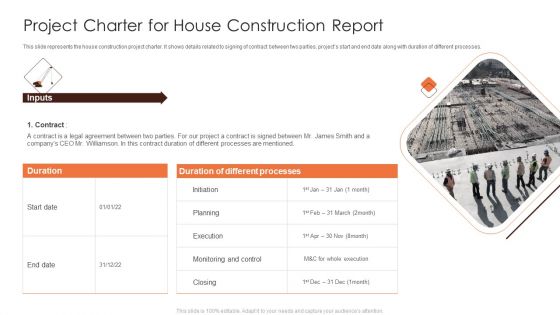
Project Charter For House Construction Report Graphics PDF
This slide represents the house construction project charter. It shows details related to signing of contract between two parties, projects start and end date along with duration of different processes. Pitch your topic with ease and precision using this Project Charter For House Construction Report Graphics PDF. This layout presents information on Planning, Execution, Project Charter. It is also available for immediate download and adjustment. So, changes can be made in the color, design, graphics or any other component to create a unique layout.
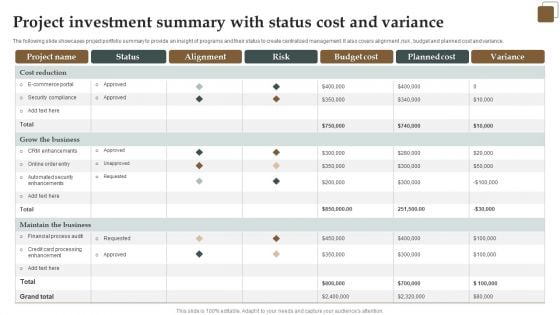
Project Investment Summary With Status Cost And Variance Graphics PDF
The following slide showcases project portfolio summary to provide an insight of programs and their status to create centralized management. It also covers alignment ,risk , budget and planned cost and variance. Pitch your topic with ease and precision using this Project Investment Summary With Status Cost And Variance Graphics PDF. This layout presents information on Risk, Budget Cost, Planned Cost. It is also available for immediate download and adjustment. So, changes can be made in the color, design, graphics or any other component to create a unique layout.
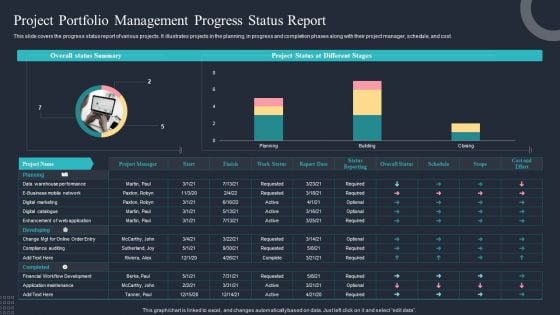
Project Portfolio Management Progress Status Report Ppt Styles Graphics PDF
This slide covers the progress status report of various projects. It illustrates projects in the planning, in progress and completion phases along with their project manager, schedule, and cost. Pitch your topic with ease and precision using this Project Portfolio Management Progress Status Report Ppt Styles Graphics PDF. This layout presents information on Developing, Planning, Financial Workflow Development. It is also available for immediate download and adjustment. So, changes can be made in the color, design, graphics or any other component to create a unique layout.
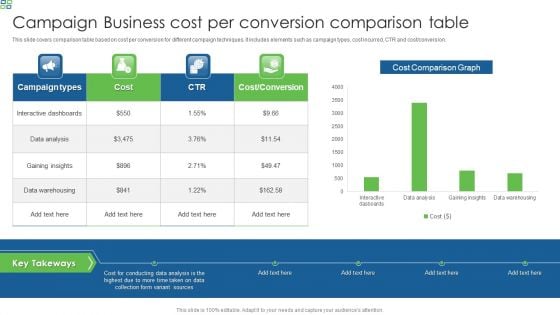
Campaign Business Cost Per Conversion Comparison Table Graphics PDF
This slide covers comparison table based on cost per conversion for different campaign techniques. It includes elements such as campaign types, cost incurred, CTR and cost or conversion. Pitch your topic with ease and precision using this Campaign Business Cost Per Conversion Comparison Table Graphics PDF. This layout presents information on Data Analysis, Data Warehousing, Interactive Dashboards. It is also available for immediate download and adjustment. So, changes can be made in the color, design, graphics or any other component to create a unique layout.
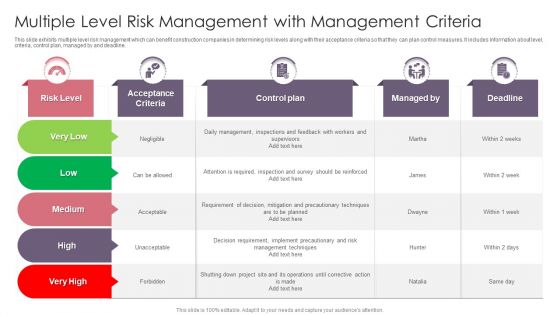
Multiple Level Risk Management With Management Criteria Graphics PDF
This slide exhibits multiple level risk management which can benefit construction companies in determining risk levels along with their acceptance criteria so that they can plan control measures. It includes information about level, criteria, control plan, managed by and deadline. Pitch your topic with ease and precision using this Multiple Level Risk Management With Management Criteria Graphics PDF. This layout presents information on Control Plan, Management, Implement. It is also available for immediate download and adjustment. So, changes can be made in the color, design, graphics or any other component to create a unique layout.
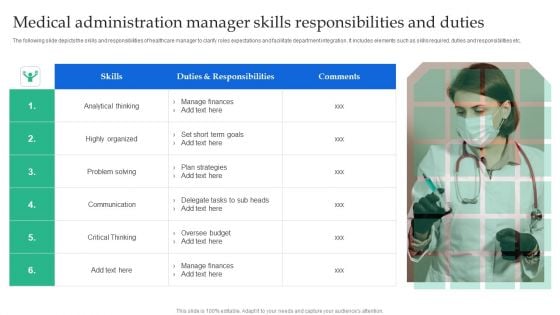
Medical Administration Manager Skills Responsibilities And Duties Graphics PDF
The following slide depicts the skills and responsibilities of healthcare manager to clarify roles expectations and facilitate department integration. It includes elements such as skills required, duties and responsibilities etc.Pitch your topic with ease and precision using this Medical Administration Manager Skills Responsibilities And Duties Graphics PDF. This layout presents information on Analytical Thinking, Communication, Critical Thinking. It is also available for immediate download and adjustment. So, changes can be made in the color, design, graphics or any other component to create a unique layout.
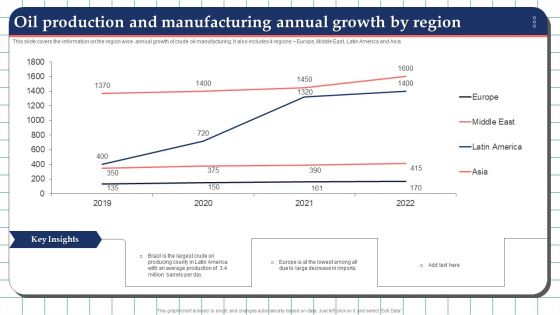
Oil Production And Manufacturing Annual Growth By Region Graphics PDF
This slide covers the information on the region wise. annual growth of crude oil manufacturing. It also includes 4 regions Europe, Middle East, Latin America and Asia. Pitch your topic with ease and precision using this Oil Production And Manufacturing Annual Growth By Region Graphics PDF. This layout presents information on Average Production, Manufacturing Annual Growth. It is also available for immediate download and adjustment. So, changes can be made in the color, design, graphics or any other component to create a unique layout.
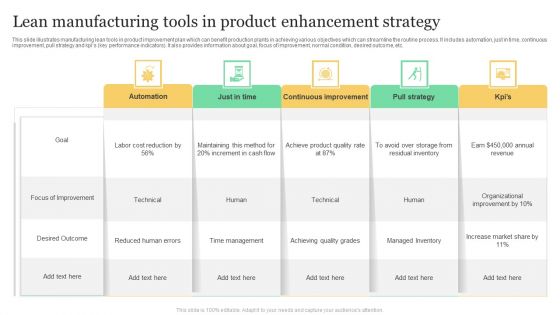
Lean Manufacturing Tools In Product Enhancement Strategy Graphics PDF
This slide illustrates manufacturing lean tools in product improvement plan which can benefit production plants in achieving various objectives which can streamline the routine process. It includes automation, just in time, continuous improvement, pull strategy and kpis key performance indicators. It also provides information about goal, focus of improvement, normal condition, desired outcome, etc. Pitch your topic with ease and precision using this Lean Manufacturing Tools In Product Enhancement Strategy Graphics PDF. This layout presents information on Automation, Desired Outcome, Time Management. It is also available for immediate download and adjustment. So, changes can be made in the color, design, graphics or any other component to create a unique layout.
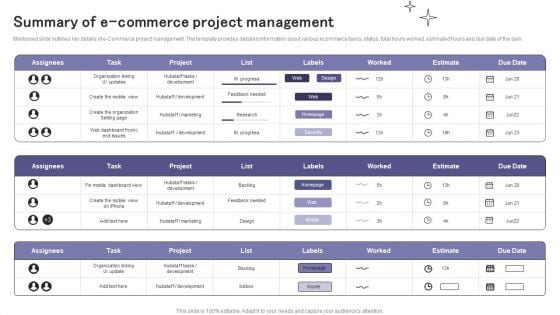
Summary Of E Commerce Project Management Ppt Show Graphics PDF
Mentioned slide outlines key details of e-Commerce project management. The template provides detailed information about various ecommerce tasks, status, total hours worked, estimated hours and due date of the task. Pitch your topic with ease and precision using this Summary Of E Commerce Project Management Ppt Show Graphics PDF. This layout presents information on Project, List, Estimate. It is also available for immediate download and adjustment. So, changes can be made in the color, design, graphics or any other component to create a unique layout.
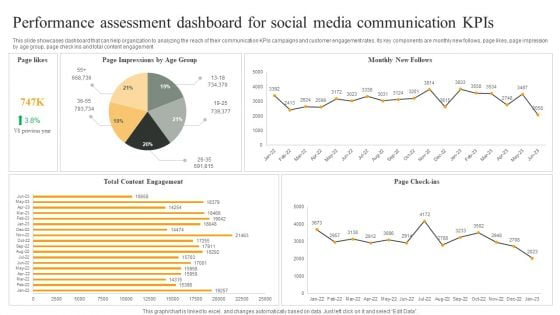
Performance Assessment Dashboard For Social Media Communication Kpis Graphics PDF
This slide showcases dashboard that can help organization to analyzing the reach of their communication KPIs campaigns and customer engagement rates. Its key components are monthly new follows, page likes, page impression by age group, page check ins and total content engagement. Pitch your topic with ease and precision using this Performance Assessment Dashboard For Social Media Communication Kpis Graphics PDF. This layout presents information on Monthly New Follows, Page Check ins, Total Content Engagement. It is also available for immediate download and adjustment. So, changes can be made in the color, design, graphics or any other component to create a unique layout.
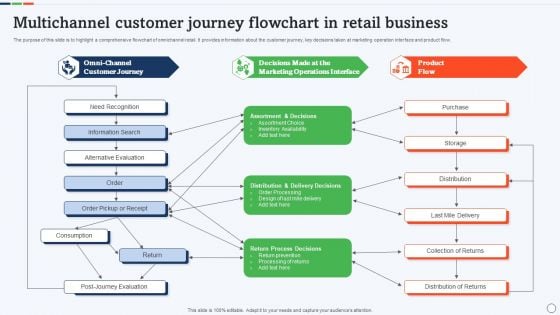
Multichannel Customer Journey Flowchart In Retail Business Graphics PDF
The purpose of this slide is to highlight a comprehensive flowchart of omnichannel retail. It provides information about the customer journey, key decisions taken at marketing operation interface and product flow. Pitch your topic with ease and precision using this Multichannel Customer Journey Flowchart In Retail Business Graphics PDF. This layout presents information on Alternative Evaluation, Need Recognition, Information Search. It is also available for immediate download and adjustment. So, changes can be made in the color, design, graphics or any other component to create a unique layout.
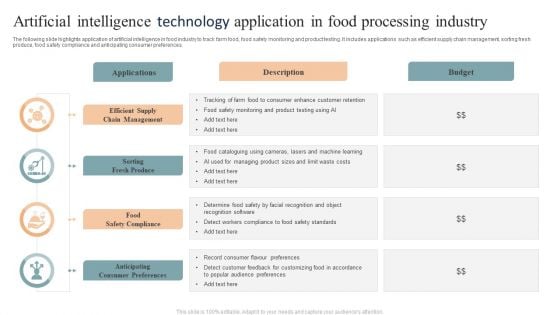
Artificial Intelligence Technology Application In Food Processing Industry Graphics PDF
The following slide highlights application of artificial intelligence in food industry to track farm food, food safety monitoring and product testing. It includes applications such as efficient supply chain management, sorting fresh produce, food safety compliance and anticipating consumer preferences. Pitch your topic with ease and precision using this Artificial Intelligence Technology Application In Food Processing Industry Graphics PDF. This layout presents information on Applications, Sorting Fresh Produce, Food Safety Compliance . It is also available for immediate download and adjustment. So, changes can be made in the color, design, graphics or any other component to create a unique layout.
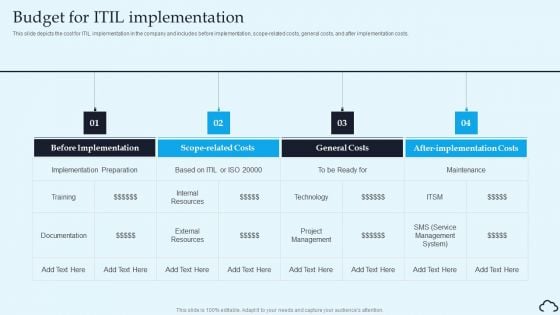
Budget For ITIL Implementation IT Service Management Framework Graphics PDF
This slide depicts the cost for ITIL implementation in the company and includes before implementation, scope-related costs, general costs, and after implementation costs.Explore a selection of the finest Budget For ITIL Implementation IT Service Management Framework Graphics PDF here. With a plethora of professionally designed and pre-made slide templates, you can quickly and easily find the right one for your upcoming presentation. You can use our Budget For ITIL Implementation IT Service Management Framework Graphics PDF to effectively convey your message to a wider audience. Slidegeeks has done a lot of research before preparing these presentation templates. The content can be personalized and the slides are highly editable. Grab templates today from Slidegeeks.
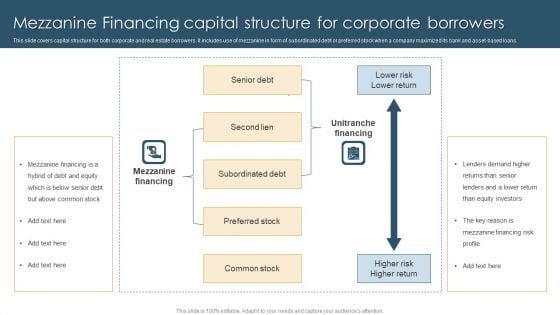
Mezzanine Financing Capital Structure For Corporate Borrowers Graphics PDF
This slide covers capital structure for both corporate and real estate borrowers. It includes use of mezzanine in form of subordinated debt or preferred stock when a company maximized its bank and asset based loans. Pitch your topic with ease and precision using this Mezzanine Financing Capital Structure For Corporate Borrowers Graphics PDF. This layout presents information on Senior Debt, Second Lien, Subordinated Debt. It is also available for immediate download and adjustment. So, changes can be made in the color, design, graphics or any other component to create a unique layout.
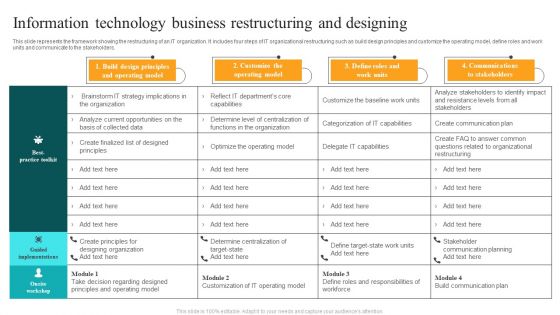
Information Technology Business Restructuring And Designing Graphics PDF
This slide represents the framework showing the restructuring of an IT organization. It includes four steps of IT organizational restructuring such as build design principles and customize the operating model, define roles and work units and communicate to the stakeholders. Pitch your topic with ease and precision using this Information Technology Business Restructuring And Designing Graphics PDF. This layout presents information on Brainstorm It Strategy, Implications In Organization, Analyze Current Opportunities. It is also available for immediate download and adjustment. So, changes can be made in the color, design, graphics or any other component to create a unique layout.
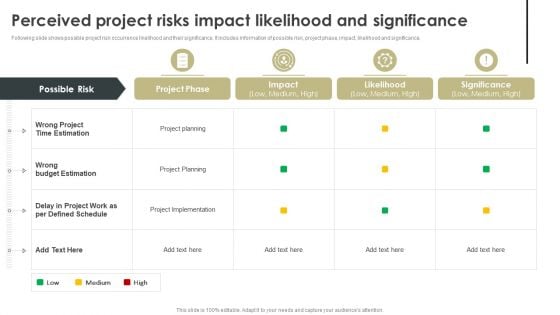
Perceived Project Risks Impact Likelihood And Significance Graphics PDF
Following slide shows possible project risk occurrence likelihood and their significance. It includes information of possible risk, project phase, impact, likelihood and significance. This Perceived Project Risks Impact Likelihood And Significance Graphics PDF is perfect for any presentation, be it in front of clients or colleagues. It is a versatile and stylish solution for organizing your meetings. The Perceived Project Risks Impact Likelihood And Significance Graphics PDF features a modern design for your presentation meetings. The adjustable and customizable slides provide unlimited possibilities for acing up your presentation. Slidegeeks has done all the homework before launching the product for you. So, do not wait, grab the presentation templates today.
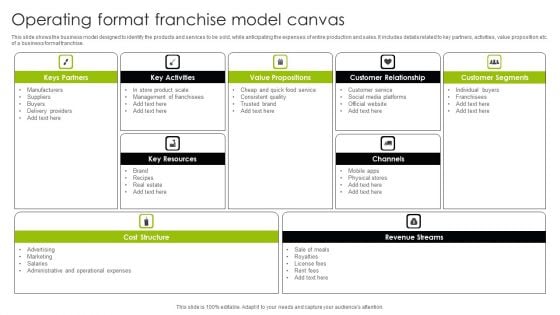
Operating Format Franchise Model Canvas Ppt Outline Graphics Design PDF
This slide shows the business model designed to identify the products and services to be sold, while anticipating the expenses of entire production and sales. It includes details related to key partners, activities, value proposition etc. of a business format franchise. Pitch your topic with ease and precision using this Operating Format Franchise Model Canvas Ppt Outline Graphics Design PDF. This layout presents information on Key Partners, Key Activities, Value Propositions, Customer Relationships. It is also available for immediate download and adjustment. So, changes can be made in the color, design, graphics or any other component to create a unique layout.
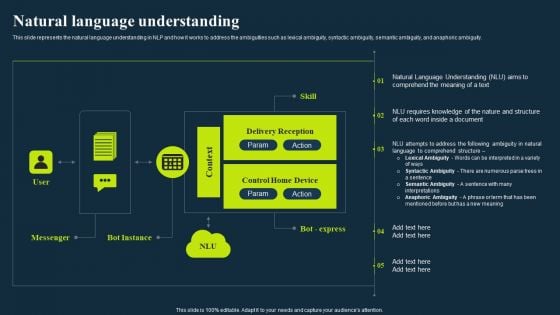
Integrating Nlp To Enhance Processes Natural Language Understanding Graphics PDF
This slide represents the natural language understanding in NLP and how it works to address the ambiguities such as lexical ambiguity, syntactic ambiguity, semantic ambiguity, and anaphoric ambiguity.Get a simple yet stunning designed Integrating Nlp To Enhance Processes Natural Language Understanding Graphics PDF. It is the best one to establish the tone in your meetings. It is an excellent way to make your presentations highly effective. So, download this PPT today from Slidegeeks and see the positive impacts. Our easy-to-edit Integrating Nlp To Enhance Processes Natural Language Understanding Graphics PDF can be your go-to option for all upcoming conferences and meetings. So, what are you waiting for Grab this template today.
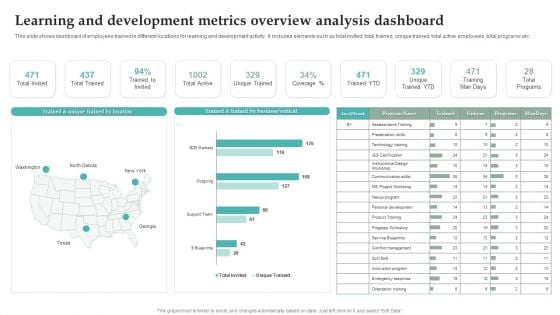
Learning And Development Metrics Overview Analysis Dashboard Graphics PDF
This slide shows dashboard of employees trained in different locations for learning and development activity. It includes elements such as total invited, total trained, unique trained, total active employees, total programs etc. Pitch your topic with ease and precision using this Learning And Development Metrics Overview Analysis Dashboard Graphics PDF. This layout presents information on Unique Trained YTD, Training Man Days, Total Programs. It is also available for immediate download and adjustment. So, changes can be made in the color, design, graphics or any other component to create a unique layout.
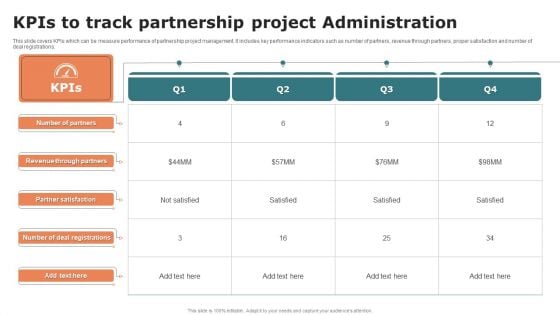
Kpis To Track Partnership Project Administration Graphics PDF
This slide covers KPIs which can be measure performance of partnership project management. It includes key performance indicators such as number of partners, revenue through partners, proper satisfaction and number of deal registrations. Pitch your topic with ease and precision using this Kpis To Track Partnership Project Administration Graphics PDF. This layout presents information on Partner Satisfaction, Revenue Through Partners, Number Of Partners. It is also available for immediate download and adjustment. So, changes can be made in the color, design, graphics or any other component to create a unique layout.
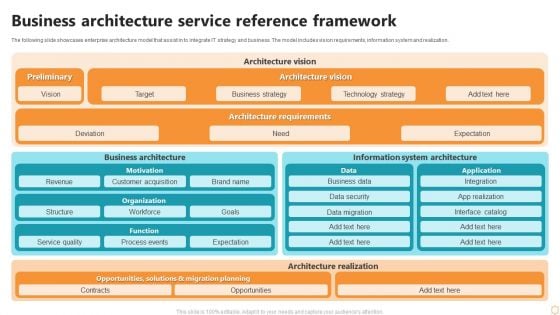
Business Architecture Service Reference Framework Ppt Styles Graphics Pictures PDF
The following slide showcases enterprise architecture model that assist in to integrate IT strategy and business. The model includes vision requirements, information system and realization. Pitch your topic with ease and precision using this Business Architecture Service Reference Framework Ppt Styles Graphics Pictures PDF. This layout presents information on Architecture Vision, Preliminary, Architecture Vision, Architecture Requirements. It is also available for immediate download and adjustment. So, changes can be made in the color, design, graphics or any other component to create a unique layout.
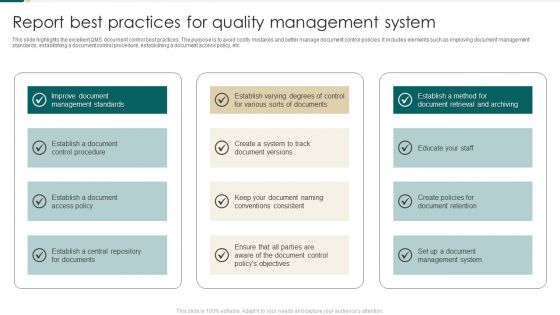
Report Best Practices For Quality Management System Graphics PDF
This slide highlights the excellent QMS document control best practices. The purpose is to avoid costly mistakes and better manage document control policies. It includes elements such as improving document management standards, establishing a document control procedure, establishing a document access policy, etc. Pitch your topic with ease and precision using this Report Best Practices For Quality Management System Graphics PDF. This layout presents information on Improve Document Management Standards, Educate Your Staff, Document Access Policy. It is also available for immediate download and adjustment. So, changes can be made in the color, design, graphics or any other component to create a unique layout.
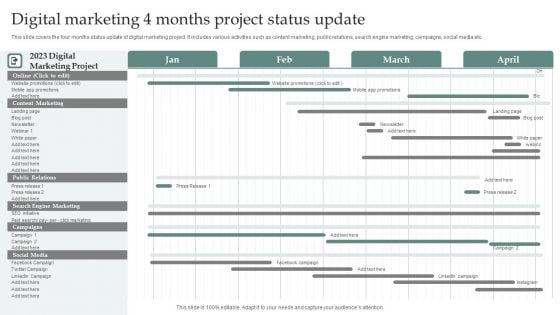
Digital Marketing 4 Months Project Status Update Graphics PDF
This slide covers the four months status update of digital marketing project. It includes various activities such as content marketing, public relations, search engine marketing, campaigns, social media etc.Pitch your topic with ease and precision using this Digital Marketing 4 Months Project Status Update Graphics PDF. This layout presents information on Public Relations, Engine Marketing, Content Marketing . It is also available for immediate download and adjustment. So, changes can be made in the color, design, graphics or any other component to create a unique layout.
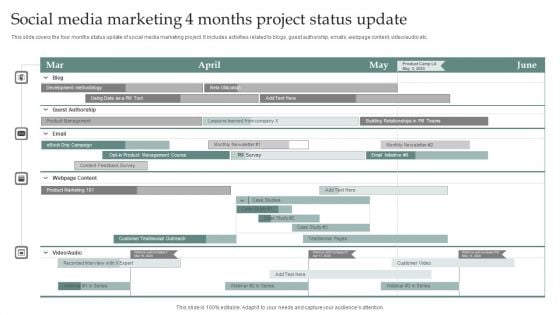
Social Media Marketing 4 Months Project Status Update Graphics PDF
This slide covers the four months status update of social media marketing project. It includes activities related to blogs, guest authorship, emails, webpage content, video or audio etc.Pitch your topic with ease and precision using this Social Media Marketing 4 Months Project Status Update Graphics PDF. This layout presents information on Customer Testimonial Outreach, Recorded Interview, Building Relationships. It is also available for immediate download and adjustment. So, changes can be made in the color, design, graphics or any other component to create a unique layout.


 Continue with Email

 Home
Home


