Growth Icon

Bubble Chart Ppt PowerPoint Presentation Infographics Images
This is a bubble chart ppt powerpoint presentation infographics images. This is a two stage process. The stages in this process are product, bubble chart, business, growth, success.
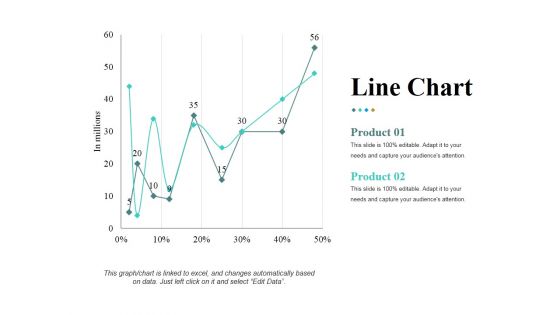
Line Chart Ppt PowerPoint Presentation Pictures Ideas
This is a line chart ppt powerpoint presentation pictures ideas. This is a two stage process. The stages in this process are in millions, percentage, finance, product, growth.
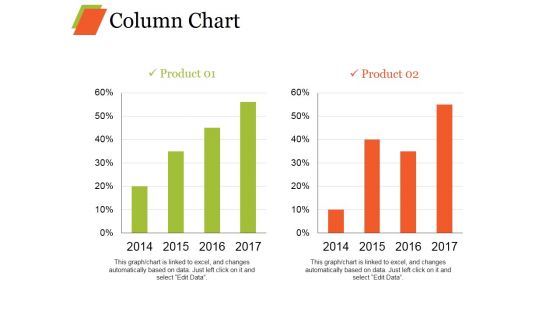
Column Chart Ppt PowerPoint Presentation Infographics Model
This is a column chart ppt powerpoint presentation infographics model. This is a two stage process. The stages in this process are bar graph, growth, product, percentage, year.
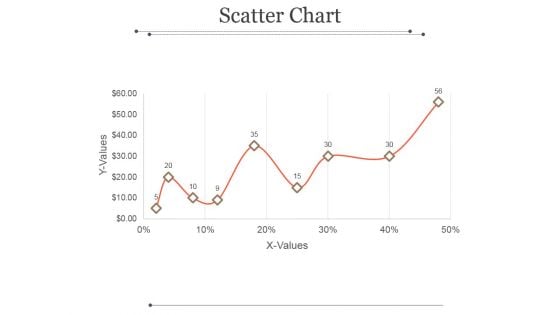
Scatter Chart Ppt PowerPoint Presentation Example
This is a scatter chart ppt powerpoint presentation example. This is a nine stage process. The stages in this process are x values, y values, business, growth, success.
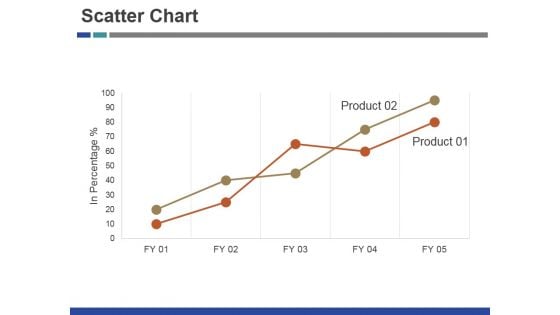
Scatter Chart Ppt PowerPoint Presentation Inspiration Brochure
This is a scatter chart ppt powerpoint presentation inspiration brochure. This is a two stage process. The stages in this process are product, growth, success, business.
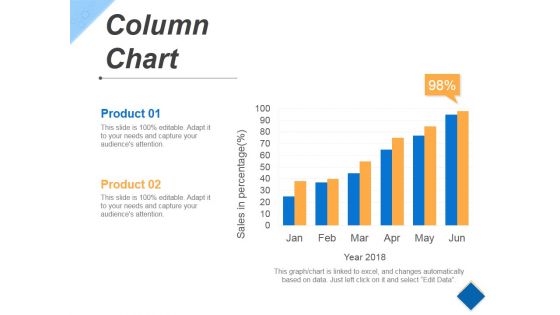
Column Chart Ppt PowerPoint Presentation Styles Vector
This is a column chart ppt powerpoint presentation styles vector. This is a six stage process. The stages in this process are growth, success, business, marketing, product.
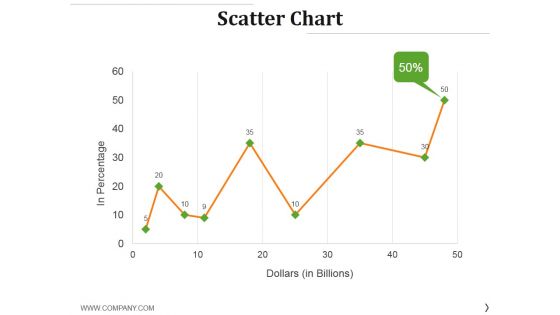
Scatter Chart Ppt PowerPoint Presentation Layouts Gridlines
This is a scatter chart ppt powerpoint presentation layouts gridlines. This is a nine stage process. The stages in this process are in percentage, dollars, growth, success, finance.

Line Chart Ppt PowerPoint Presentation Pictures Maker
This is a line chart ppt powerpoint presentation pictures maker. This is a two stage process. The stages in this process are financial years, product, growth, success.
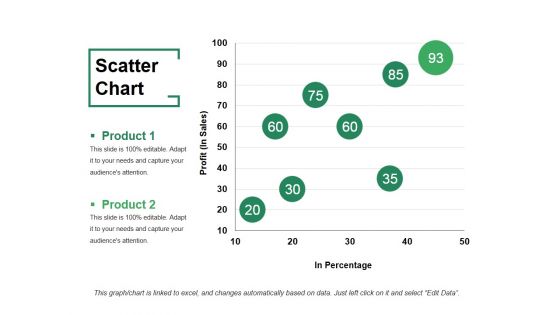
Scatter Chart Ppt PowerPoint Presentation File Visuals
This is a scatter chart ppt powerpoint presentation file visuals. This is a two stage process. The stages in this process are product, profit, in percentage, growth, success.
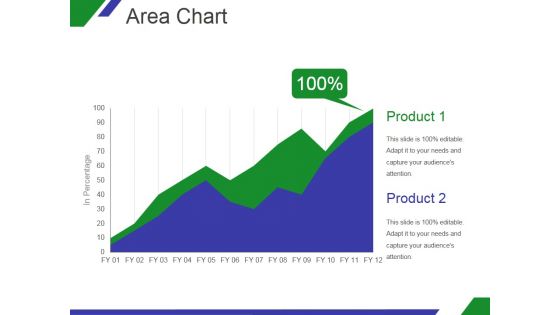
Area Chart Ppt PowerPoint Presentation Designs
This is a area chart ppt powerpoint presentation designs. This is a two stage process. The stages in this process are product, graph, in percentage, growth, business.
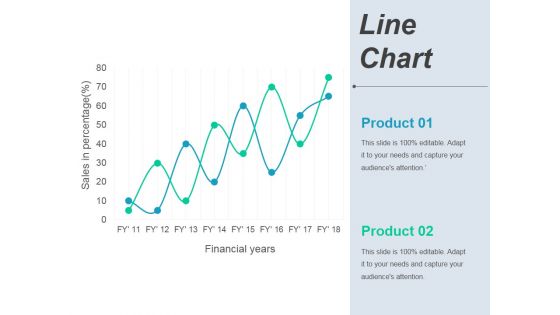
Line Chart Ppt PowerPoint Presentation Ideas Deck
This is a line chart ppt powerpoint presentation ideas deck. This is a two stage process. The stages in this process are business, marketing, finance, growth.
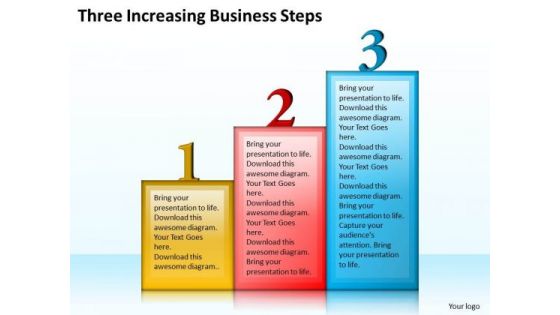
Business Strategy Concepts Three Increasing Steps Strategic Planning Ppt Slide
Our Timeline Ppt Template Three Increasing Business Steps help in a duel of wits. They get your ideas to come out on top. Our Business PowerPoint Templates play a dual role. They aid and abet you in your endeavour. Win any duel with our Finance PowerPoint Templates. Your thoughts will be faster on the draw.
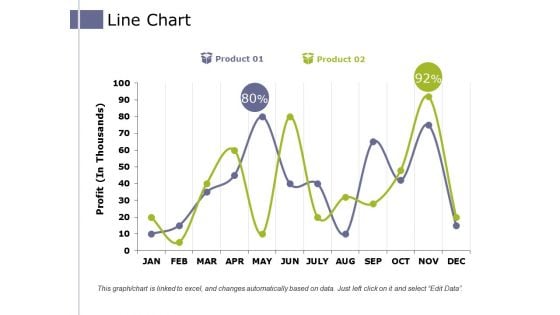
Line Chart Ppt PowerPoint Presentation Pictures Example Introduction
This is a line chart ppt powerpoint presentation pictures example introduction. This is a two stage process. The stages in this process are product, profit, business, growth, success.

Scatter Chart Ppt PowerPoint Presentation Infographic Template Objects
This is a scatter chart ppt powerpoint presentation infographic template objects. This is a nine stage process. The stages in this process are product, growth, success, graph.

Scatter Chart Ppt PowerPoint Presentation Portfolio Design Inspiration
This is a scatter chart ppt powerpoint presentation portfolio design inspiration. This is a twelve stage process. The stages in this process are graph, growth, success, business.
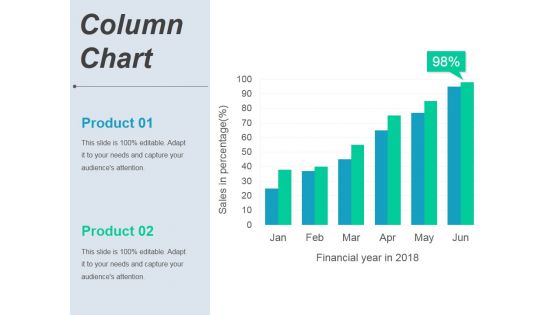
Column Chart Ppt PowerPoint Presentation Portfolio Graphics Template
This is a column chart ppt powerpoint presentation portfolio graphics template. This is a six stage process. The stages in this process are product, finance, growth, success, business.

Combo Chart Ppt PowerPoint Presentation Professional Graphics Example
This is a combo chart ppt powerpoint presentation professional graphics example. This is a eight stage process. The stages in this process are product, finance, growth, success, business.
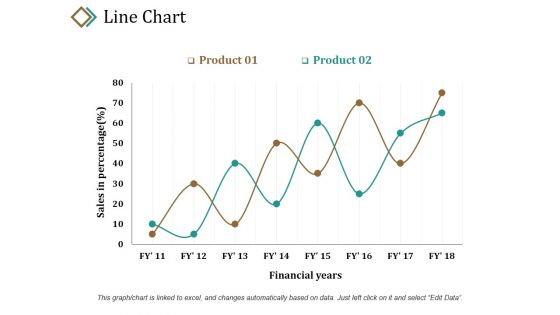
Line Chart Ppt PowerPoint Presentation Layouts Example
This is a line chart ppt powerpoint presentation layouts example. This is a two stage process. The stages in this process are sales in percentage, product, financial years, growth, success.

Line Chart Ppt PowerPoint Presentation Show Guide
This is a line chart ppt powerpoint presentation show guide. This is a two stage process. The stages in this process are product, sales in percentage, financial years, growth, success.
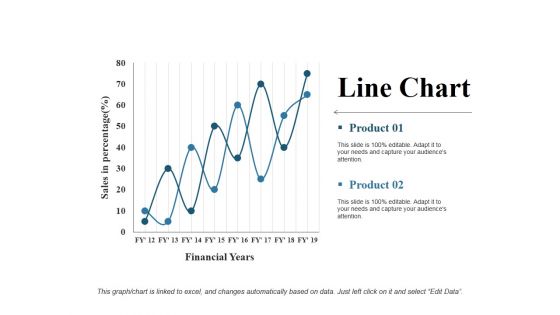
Line Chart Ppt PowerPoint Presentation Gallery Rules
This is a line chart ppt powerpoint presentation gallery rules. This is a two stage process. The stages in this process are financial years, product, sales in percentage, line chart, growth.
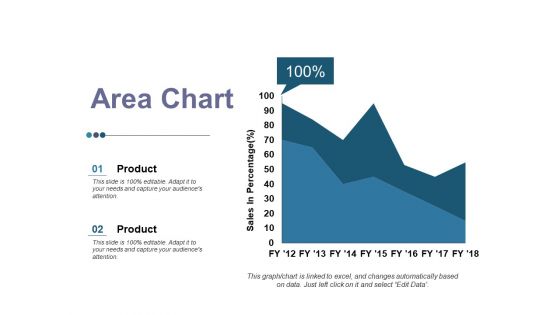
Area Chart Ppt PowerPoint Presentation Inspiration Graphics
This is a area chart ppt powerpoint presentation inspiration graphics. This is a two stage process. The stages in this process are product, area chart, business, growth, sales in percentage.
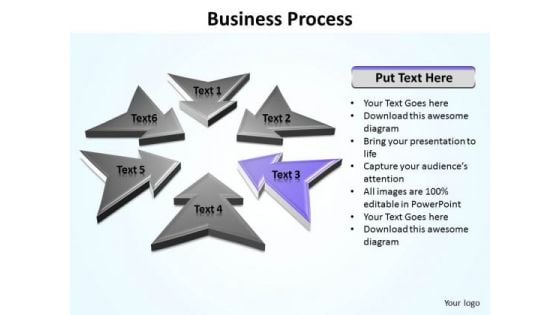
Ppt Direction Arrows Of Layout Editable PowerPoint World Map Templates
PPT direction arrows of layout editable powerpoint world map Templates-The above template contains a graphic of arrows pointing towards the center. Clarity of thought has been the key to your growth. Use our templates to illustrate your ability.-PPT direction arrows of layout editable powerpoint world map Templates-Abstract, Achievement, Aim, Arrow, Background, Business, Chart, Communication, Competition, Concept, Design, Direction, Development, Diagram, Direction, Finance, Financial, Forecast, Forward, Goal, Graph, Graphic, Growth, Icon, Illustration, Increase, Investment, Leader, Leadership, Design, Marketing, Price, Process, Profit, Progress, Progress, Shape, Sign, Success, Symbol, Target, Team, Teamwork Augment your assets with our Ppt Direction Arrows Of Layout Editable PowerPoint World Map Templates. They have many desirable attributes.
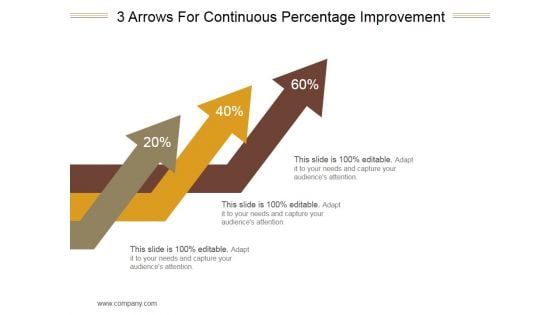
3 Arrows For Continuous Percentage Improvement Ppt PowerPoint Presentation Images
This is a 3 arrows for continuous percentage improvement ppt powerpoint presentation images. This is a three stage process. The stages in this process are arrows, marketing, strategy, management, business.
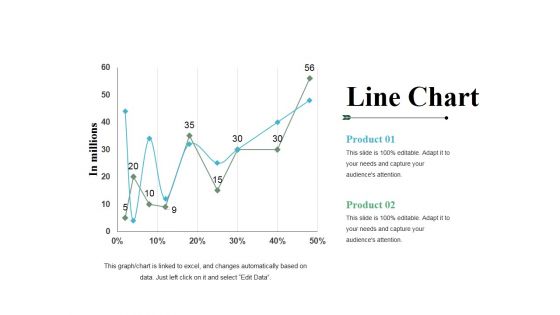
Line Chart Ppt PowerPoint Presentation File Templates
This is a line chart ppt powerpoint presentation file templates. This is a two stage process. The stages in this process are product, line chart, growth, percentage, in millions.
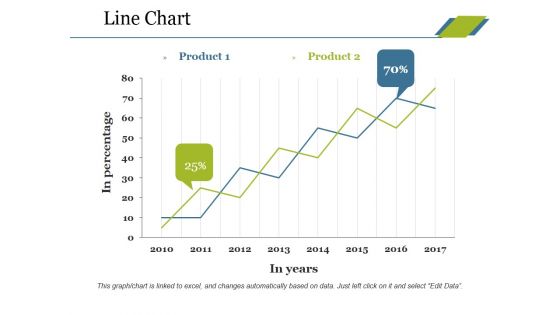
Line Chart Ppt PowerPoint Presentation Professional Tips
This is a line chart ppt powerpoint presentation professional tips. This is a two stage process. The stages in this process are product, in percentage, in years, growth, success.
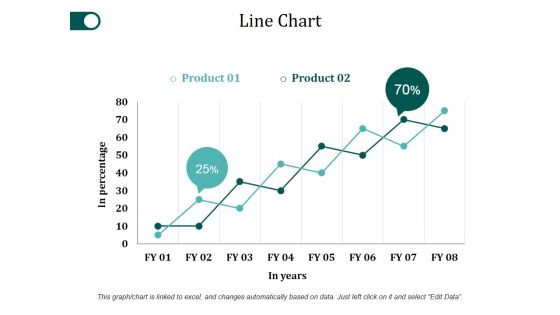
Line Chart Ppt PowerPoint Presentation Slides Ideas
This is a line chart ppt powerpoint presentation slides ideas. This is a two stage process. The stages in this process are product, in percentage, in years, growth, success.
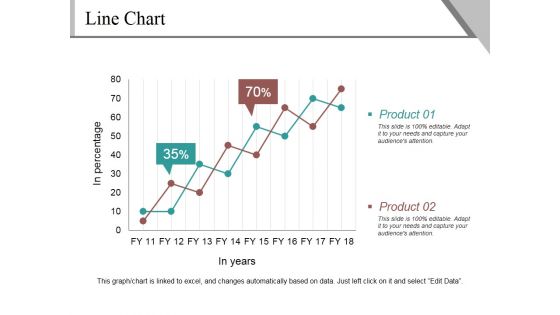
Line Chart Ppt PowerPoint Presentation Infographics Example
This is a line chart ppt powerpoint presentation infographics example. This is a two stage process. The stages in this process are product, in percentage, in years, finance, growth.
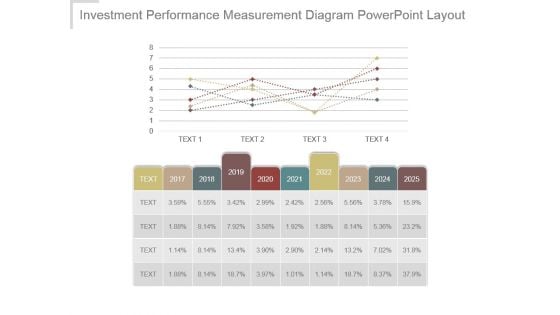
Investment Performance Measurement Diagram Powerpoint Layout
This is a investment performance measurement diagram powerpoint layout. This is a five stage process. The stages in this process are bar graph, growth, success, business, marketing.
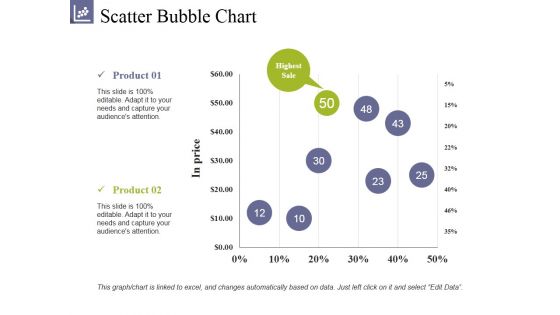
Scatter Bubble Chart Ppt PowerPoint Presentation Summary Clipart
This is a scatter bubble chart ppt powerpoint presentation summary clipart. This is a two stage process. The stages in this process are product, highest sale, in prices, growth, success.
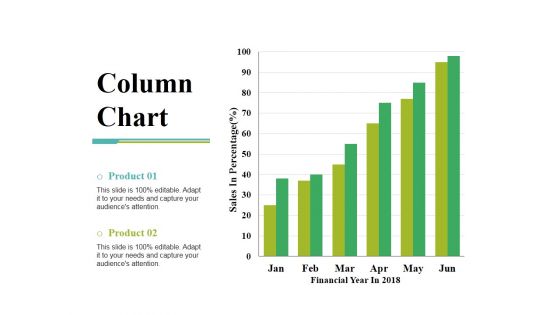
Column Chart Ppt PowerPoint Presentation Gallery Slide Portrait
This is a column chart ppt powerpoint presentation gallery slide portrait. This is a two stage process. The stages in this process are sales in percentage, financial year, product, bar graph, growth.
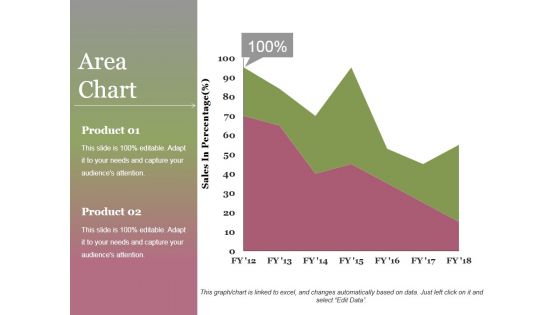
Area Chart Ppt PowerPoint Presentation Infographics File Formats
This is a area chart ppt powerpoint presentation infographics file formats. This is a two stage process. The stages in this process are area chart, product, sales in percentage, growth, success.
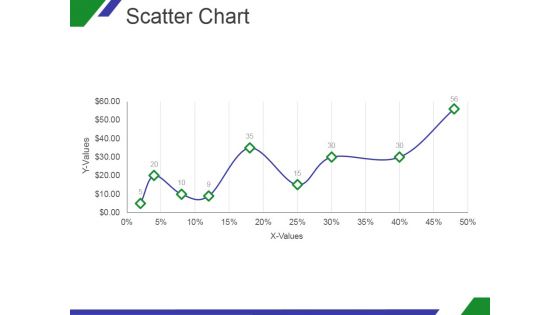
Scatter Chart Ppt PowerPoint Presentation Designs Download
This is a scatter chart ppt powerpoint presentation designs download. This is a nine stage process. The stages in this process are x values, y values, graph, growth, success.

Scatter Chart Ppt PowerPoint Presentation Model Template
This is a scatter chart ppt powerpoint presentation model template. This is a nine stage process. The stages in this process are x values, y values, graph, growth, success.
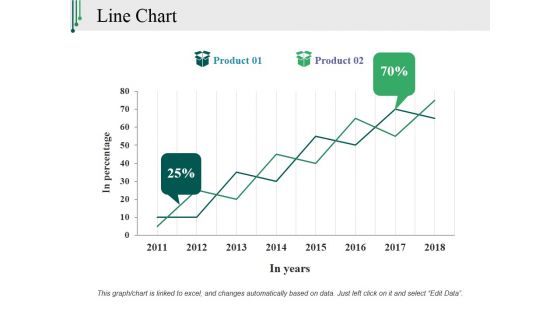
Line Chart Ppt PowerPoint Presentation Slides Mockup
This is a line chart ppt powerpoint presentation slides mockup. This is a two stage process. The stages in this process are in percentage, in years, product, growth, success.
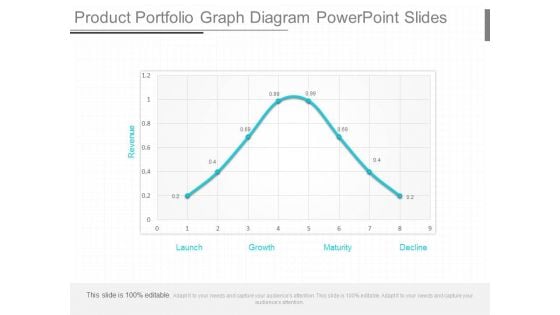
Product Portfolio Graph Diagram Powerpoint Slides
This is a product portfolio graph diagram powerpoint slides. This is a eight stage process. The stages in this process are revenue, launch, growth, maturity, decline.

Curve Chart For Product Life Cycle Presentation Outline
This is a curve chart for product life cycle presentation outline. This is a five stage process. The stages in this process are sales over time, product extension, introduction, growth, maturity, decline, time.
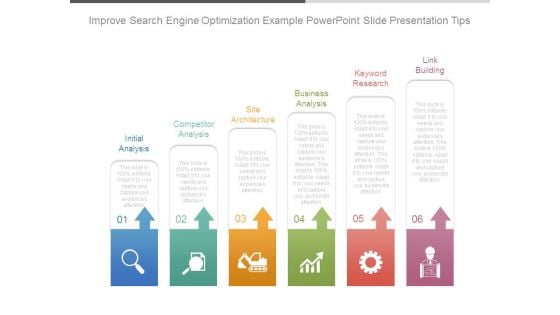
Improve Search Engine Optimization Example Powerpoint Slide Presentation Tips
This is a improve search engine optimization example powerpoint slide presentation tips. This is a six stage process. The stages in this process are initial analysis, competitor analysis, site architecture, business analysis, keyword research, link building.
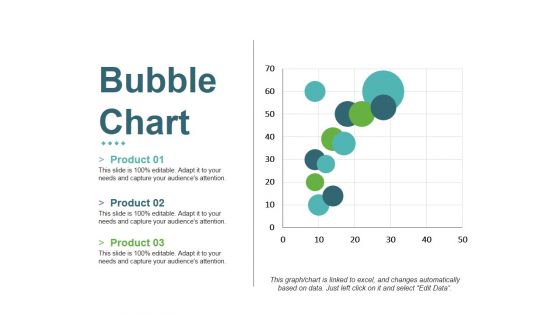
Bubble Chart Ppt PowerPoint Presentation Inspiration Graphics Download
This is a bubble chart ppt powerpoint presentation inspiration graphics download. This is a three stage process. The stages in this process are product, growth, success, bubble chart, business.
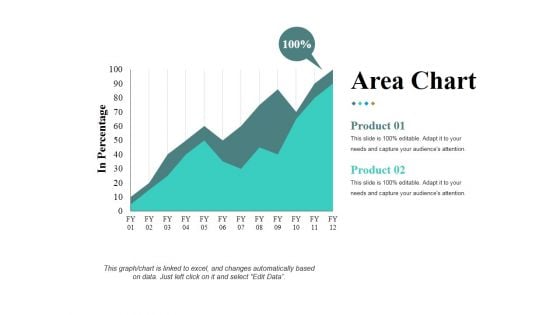
Area Chart Ppt PowerPoint Presentation Infographic Template Samples
This is a area chart ppt powerpoint presentation infographic template samples. This is a two stage process. The stages in this process are in percentage product, business, marketing, growth.
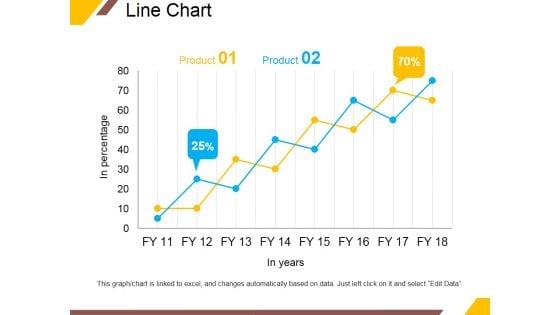
Line Chart Ppt PowerPoint Presentation Portfolio Infographic Template
This is a line chart ppt powerpoint presentation portfolio infographic template. This is a two stage process. The stages in this process are product, in years, business, percentage, growth.
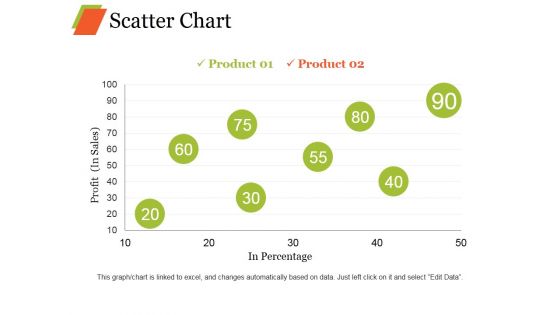
Scatter Chart Ppt PowerPoint Presentation Professional Graphic Images
This is a scatter chart ppt powerpoint presentation professional graphic images. This is a eight stage process. The stages in this process are product, profit, in percentage growth, business.
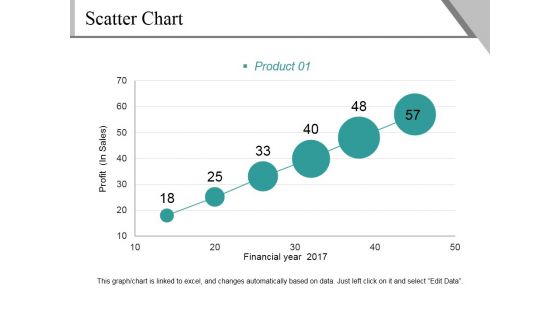
Scatter Chart Ppt PowerPoint Presentation File Background Image
This is a scatter chart ppt powerpoint presentation file background image. This is a six stage process. The stages in this process are profit, financial year, product, growth, success.
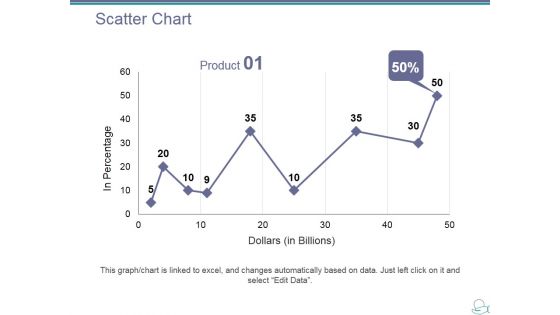
Scatter Chart Ppt PowerPoint Presentation Ideas Designs Download
This is a scatter chart ppt powerpoint presentation ideas designs download. This is a one stage process. The stages in this process are product, dollar, in percentage, growth, success.
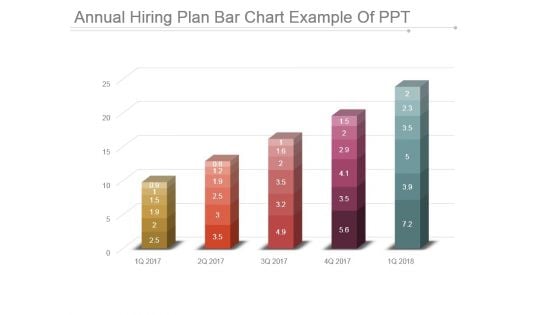
Annual Hiring Plan Bar Chart Example Of Ppt
This is a annual hiring plan bar chart example of ppt. This is a five stage process. The stages in this process are bar graph, business, marketing, growth, success.
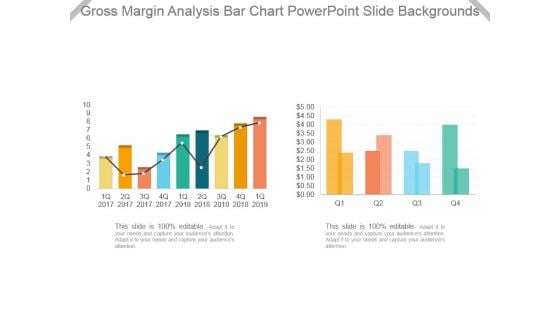
Gross Margin Analysis Bar Chart Powerpoint Slide Backgrounds
This is a gross margin analysis bar chart powerpoint slide backgrounds. This is a two stage process. The stages in this process are bar graph, business, marketing, growth, success.
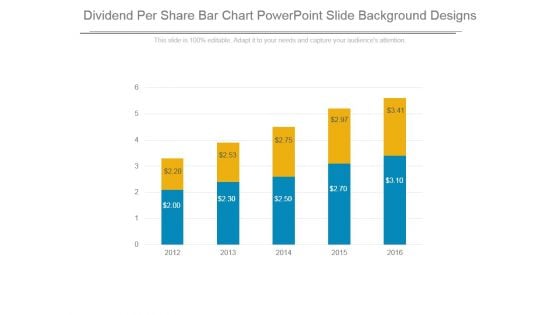
Dividend Per Share Bar Chart Powerpoint Slide Background Designs
This is a dividend per share bar chart powerpoint slide background designs. This is a five stage process. The stages in this process are business, marketing, success, growth, bar graph.
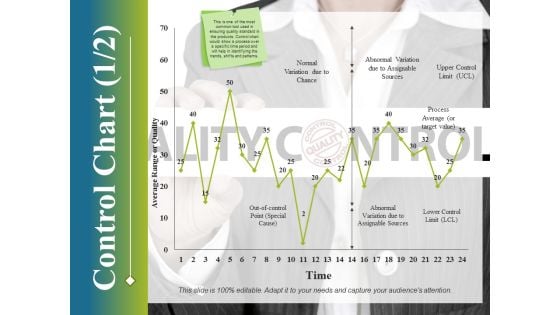
Control Chart Template 1 Ppt PowerPoint Presentation Infographic Template Deck
This is a control chart template 1 ppt powerpoint presentation infographic template deck. This is a one stage process. The stages in this process are control chart, growth, finance, marketing, strategy, business.

Xbar And R Chart Ppt PowerPoint Presentation Inspiration Styles
This is a xbar and r chart ppt powerpoint presentation inspiration styles. This is a two stage process. The stages in this process are subtitle, lcl, ucl, growth, graph.
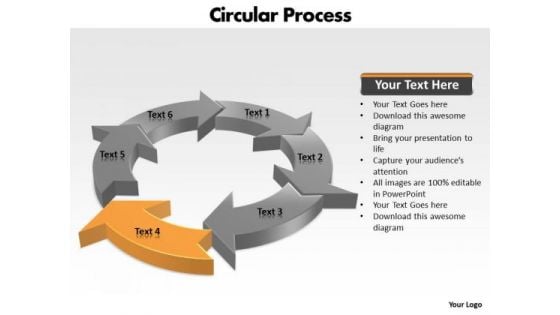
Ppt Components Of Circular PowerPoint Menu Template Process Chart Templates
PPT components of circular powerpoint menu template process chart Templates-This circular flow diagram can helps to illustrate the economic exchange that takes place in the building of wealth. Clarity of thought has been the key to your growth. Use our template to illustrate your ability.-PPT components of circular powerpoint menu template process chart Templates-Arrow, Chart, Circular, Color, Colorful, Connect, Connection, Design, Diagram, Finance, Graphic, Group, Growth, Icon, Illustration, Marketing, Pieces, Process, Recycle, Recycling, Round, Set, Strategy, Symbol, Wheel Consult experts with our Ppt Components Of Circular PowerPoint Menu Template Process Chart Templates. Download without worries with our money back guaranteee.
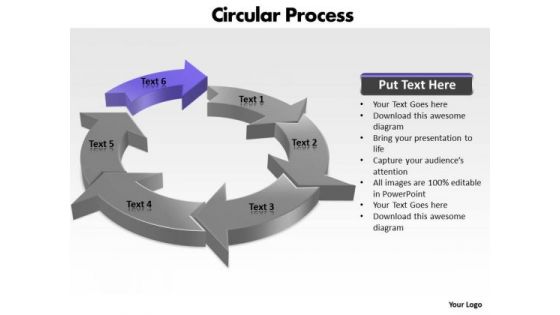
Ppt Components Of Circular Process PowerPoint Design Download 2010 Templates
PPT components of circular process powerpoint design download 2010 Templates-Use the circular flow diagram as a basis for your explanation. Present your views using our innovative slide and be assured of leaving a lasting impression.-PPT components of circular process powerpoint design download 2010 Templates-Arrow, Chart, Circular, Color, Colorful, Connect, Connection, Design, Diagram, Finance, Graphic, Group, Growth, Icon, Illustration, Marketing, Pieces, Process, Recycle, Recycling, Round, Set, Strategy, Symbol, Wheel Achieve high-growth with our Ppt Components Of Circular Process PowerPoint Design Download 2010 Templates. They will make you look good.
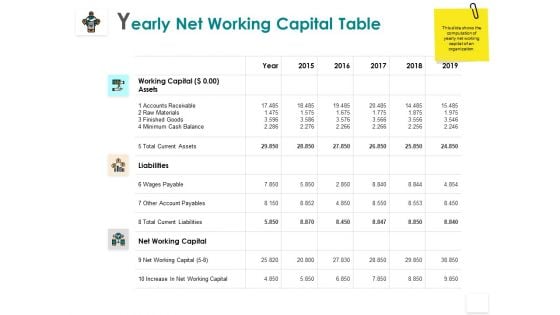
Yearly Net Working Capital Table Liabilities Minimum Ppt PowerPoint Presentation Infographic Template Diagrams
Presenting this set of slides with name yearly net working capital table liabilities minimum ppt powerpoint presentation infographic template diagrams. The topics discussed in these slides are liabilities, increase, business, planning, strategy. This is a completely editable PowerPoint presentation and is available for immediate download. Download now and impress your audience.
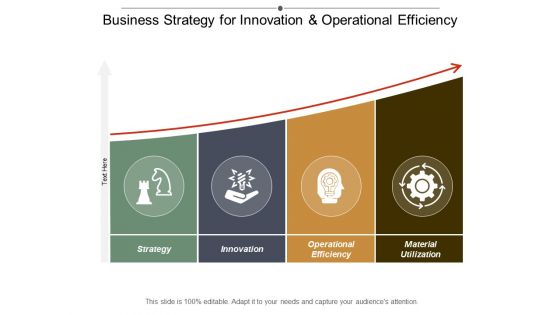
Business Strategy For Innovation And Operational Efficiency Ppt Powerpoint Presentation Slides Picture
This is a business strategy for innovation and operational efficiency ppt powerpoint presentation slides picture. This is a four stage process. The stages in this process are productivity improvement, output improvement, productivity enhancement.
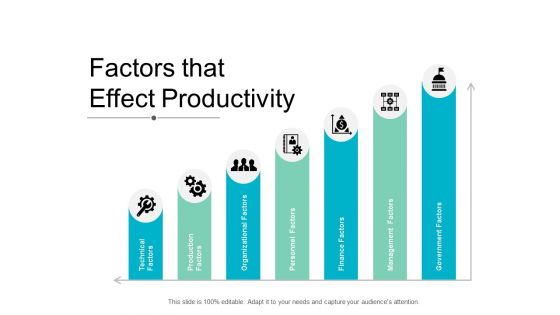
Factors That Effect Productivity Ppt Powerpoint Presentation Pictures Images
This is a factors that effect productivity ppt powerpoint presentation pictures images. This is a seven stage process. The stages in this process are productivity improvement, output improvement, productivity enhancement.
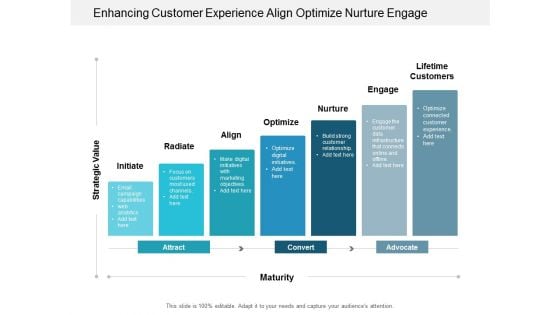
Enhancing Customer Experience Align Optimize Nurture Engage Ppt Powerpoint Presentation Infographic Template Graphics Design
This is a enhancing customer experience align optimize nurture engage ppt powerpoint presentation infographic template graphics design. This is a seven stage process. The stages in this process are customer satisfaction, customer services, customer engagement model.

Enable Engage Enhance Employees At Workplace Ppt PowerPoint Presentation Summary Elements
Presenting this set of slides with name enable engage enhance employees at workplace ppt powerpoint presentation summary elements. This is a four stage process. The stages in this process are empower, employee engagement, human projection. This is a completely editable PowerPoint presentation and is available for immediate download. Download now and impress your audience.
Air Balloon Graphic With Text Space Powerpoint Templates
This business slide has been designed with graphics of air balloon. Download this diagram to portray concepts like growth, finance, marketing, and communication. This slide is innovatively designed to highlight your worthy view.
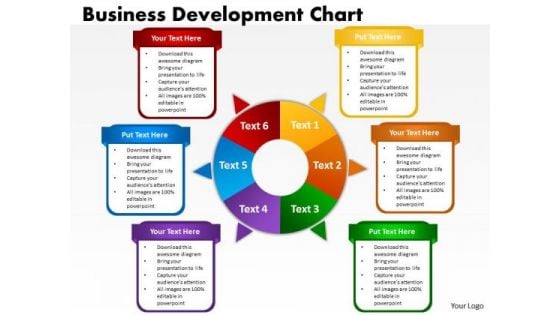
Consulting Diagram Business Development Chart Strategic Management
Document Your Views On Our Consulting Diagram Business Development Chart Strategic Management Powerpoint Templates. They Will Create A Strong Impression.
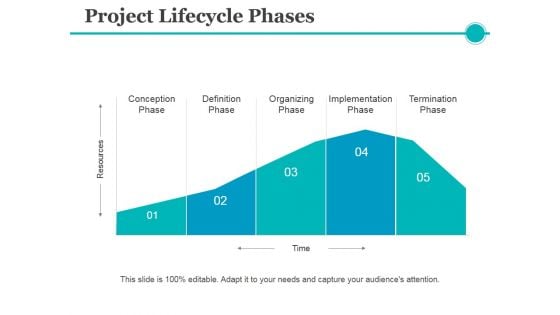
Project Lifecycle Phases Template 1 Ppt PowerPoint Presentation Layouts Layout
This is a project lifecycle phases template 1 ppt powerpoint presentation layouts layout. This is a five stage process. The stages in this process are definition phase, organizing phase, termination phase, implementation phase.
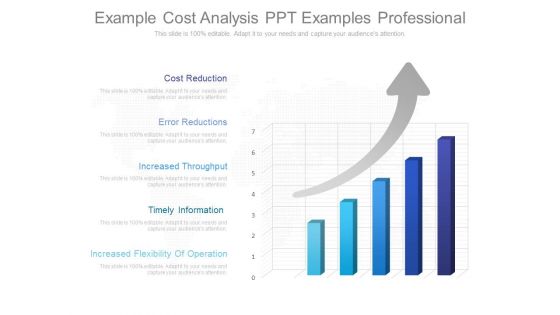
Example Cost Analysis Ppt Examples Professional
This is a example cost analysis ppt examples professional. This is a five stage process. The stages in this process are cost reduction, error reductions, increased throughput, timely information, increased flexibility of operation.
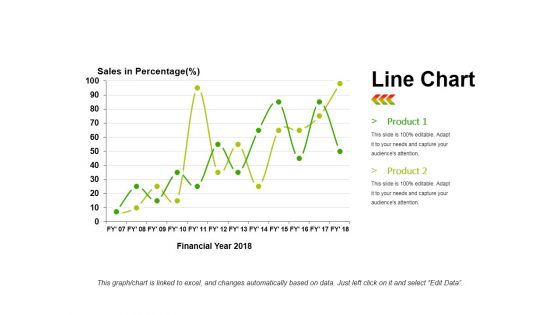
Line Chart Ppt PowerPoint Presentation Infographics Infographics
This is a line chart ppt powerpoint presentation infographics infographics. This is a two stage process. The stages in this process are product, sales in percentage, financial year, line chart, finance.


 Continue with Email

 Home
Home


