Growth
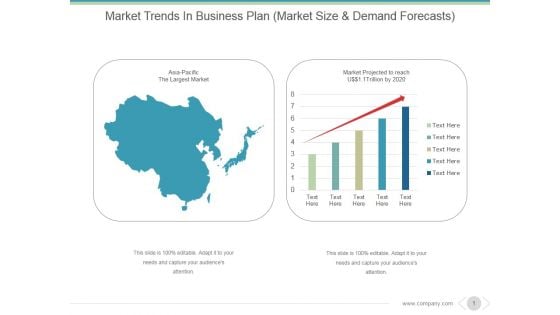
Market Trends In Business Plan Ppt PowerPoint Presentation Show
This is a market trends in business plan ppt powerpoint presentation show. This is a two stage process. The stages in this process are graph, business, marketing, growth, graph.
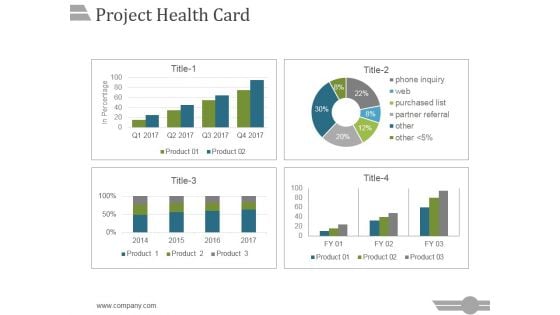
Project Health Card Template 1 Ppt PowerPoint Presentation Clipart
This is a project health card template 1 ppt powerpoint presentation clipart. This is a four stage process. The stages in this process are business, strategy, marketing, analysis, success, growth, chart and graph.

Big Data Market Forecast Ppt PowerPoint Presentation Information
This is a big data market forecast ppt powerpoint presentation information. This is a five stage process. The stages in this process are business, growth, strategy, timeline, planning, success.
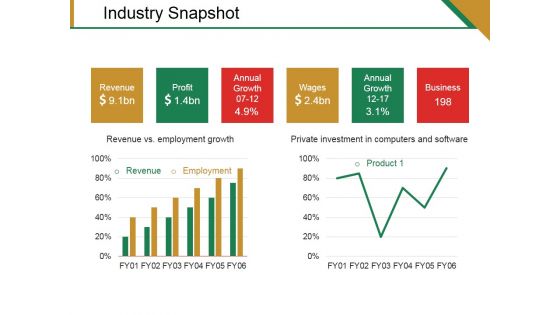
Industry Snapshot Template 1 Ppt PowerPoint Presentation Gallery Design Ideas
This is a industry snapshot template 1 ppt powerpoint presentation gallery design ideas. This is a three stage process. The stages in this process are revenue, profit, annual growth, wages, business.
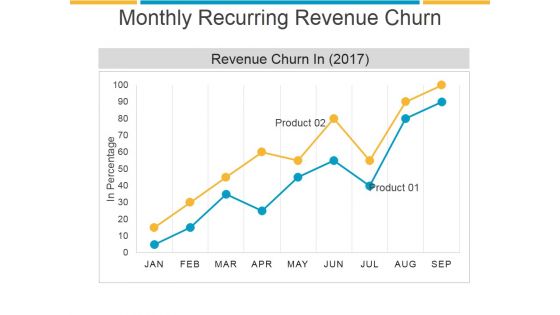
Monthly Recurring Revenue Churn Template 2 Ppt PowerPoint Presentation Gallery
This is a monthly recurring revenue churn template 2 ppt powerpoint presentation gallery. This is a two stage process. The stages in this process are growth, business, process, finance, success.
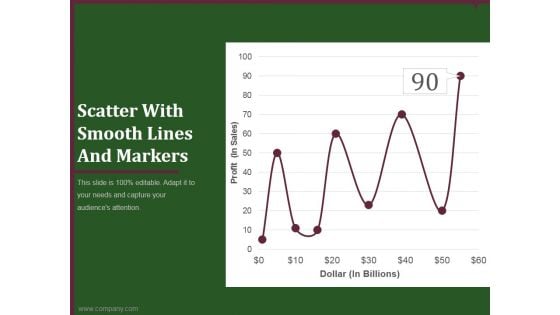
Scatter With Smooth Lines And Markers Ppt PowerPoint Presentation Example
This is a scatter with smooth lines and markers ppt powerpoint presentation example. This is a seven stage process. The stages in this process are business, marketing, success, growth, finance.
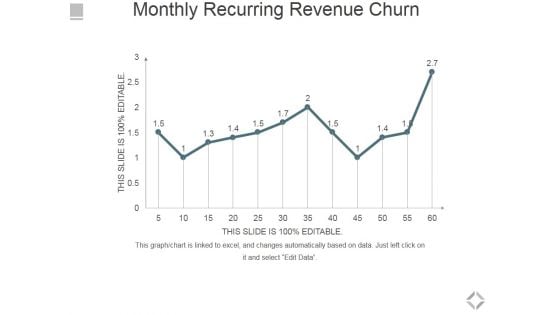
Monthly Recurring Revenue Churn Ppt PowerPoint Presentation Infographics Microsoft
This is a monthly recurring revenue churn ppt powerpoint presentation infographics microsoft. This is a one stage process. The stages in this process are bar graph, business, marketing, success, growth.
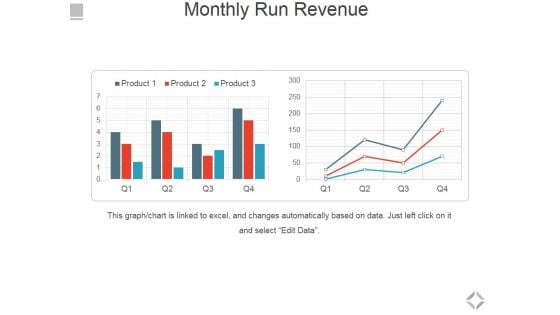
Monthly Run Revenue Ppt PowerPoint Presentation Show Styles
This is a monthly run revenue ppt powerpoint presentation show styles. This is a two stage process. The stages in this process are bar graph, business, marketing, success, growth.
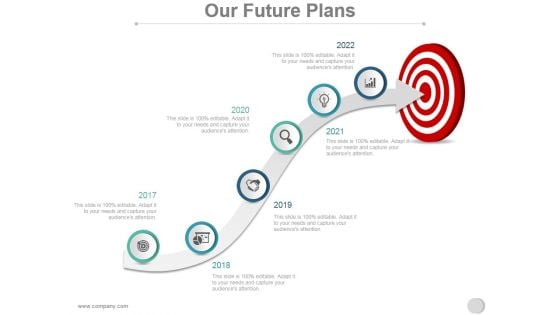
Our Future Plans Ppt PowerPoint Presentation Introduction
This is a our future plans ppt powerpoint presentation introduction. This is a six stage process. The stages in this process are our goal, growth, icons, marketing, strategy, business.

Proprietary Technology Expertise Template 1 Ppt PowerPoint Presentation Design Templates
This is a proprietary technology expertise template 1 ppt powerpoint presentation design templates. This is a three stage process. The stages in this process are business, marketing, management, growth, strategy.
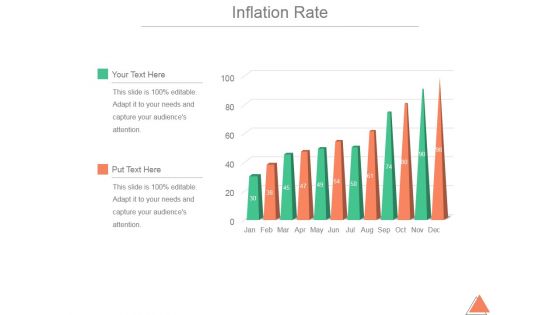
Inflation Rate Template 1 Ppt PowerPoint Presentation Influencers
This is a inflation rate template 1 ppt powerpoint presentation influencers. This is a twelve stage process. The stages in this process are business, marketing, growth, management, inflation rate.
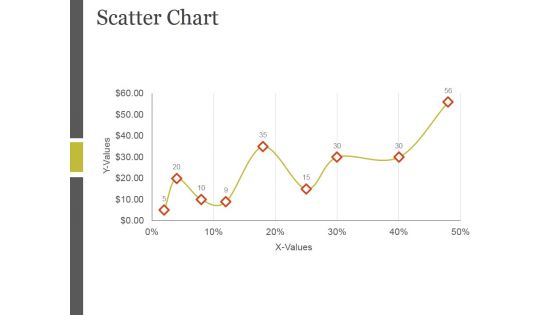
Scatter Chart Ppt PowerPoint Presentation Microsoft
This is a scatter chart ppt powerpoint presentation microsoft. This is a one stage process. The stages in this process are x values, scatter chart, bar graph, growth, business.
Crm Dashboard Deals By Expected Close Date Ppt PowerPoint Presentation Icon
This is a crm dashboard deals by expected close date ppt powerpoint presentation icon. This is a three stage process. The stages in this process are deals by expected close date, years, planning, business, growth.
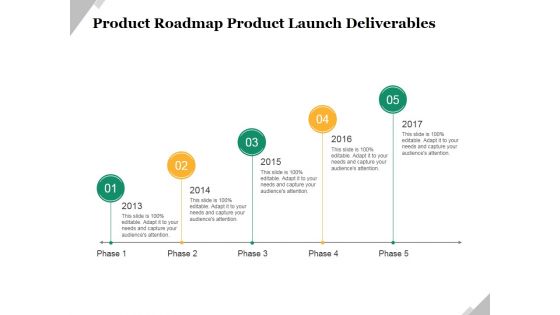
Product Roadmap Product Launch Deliverables Template 2 Ppt PowerPoint Presentation Infographics Pictures
This is a product roadmap product launch deliverables template 2 ppt powerpoint presentation infographics pictures. This is a five stage process. The stages in this process are timeline, business, planning, growth, management.
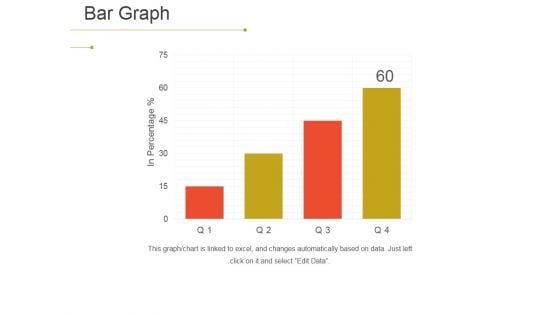
Bar Graph Ppt PowerPoint Presentation File Vector
This is a bar graph ppt powerpoint presentation file vector. This is a four stage process. The stages in this process are in percentage, bar graph, growth, business, process.
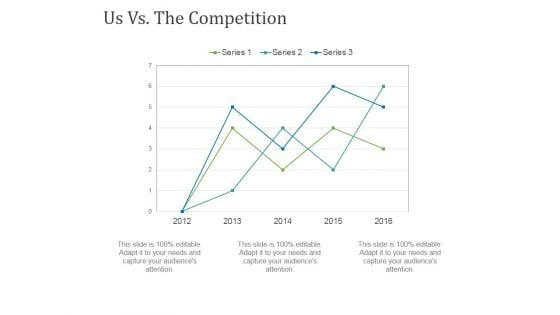
Us Vs The Competition Template 2 Ppt PowerPoint Presentation Summary Background Designs
This is a us vs the competition template 2 ppt powerpoint presentation summary background designs. This is a three stage process. The stages in this process are competition, business, marketing, growth, presentation.
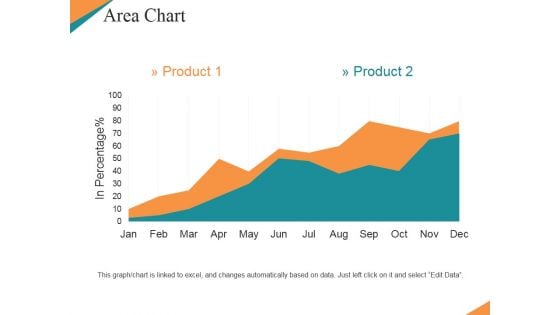
Area Chart Ppt PowerPoint Presentation Summary Templates
This is a area chart ppt powerpoint presentation summary templates. This is a two stage process. The stages in this process are product, in percentage, bar graph, growth, business.
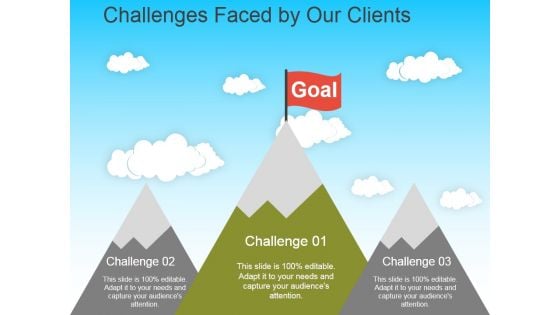
Challenges Faced By Our Clients Template 2 Ppt PowerPoint Presentation Infographic Template Gridlines
This is a challenges faced by our clients template 2 ppt powerpoint presentation infographic template gridlines. This is a three stage process. The stages in this process are goal, challenge, business, marketing, growth.

Area Chart Ppt PowerPoint Presentation Visual Aids Show
This is a area chart ppt powerpoint presentation visual aids show. This is a two stage process. The stages in this process are area chart, growth, strategy, finance, business.
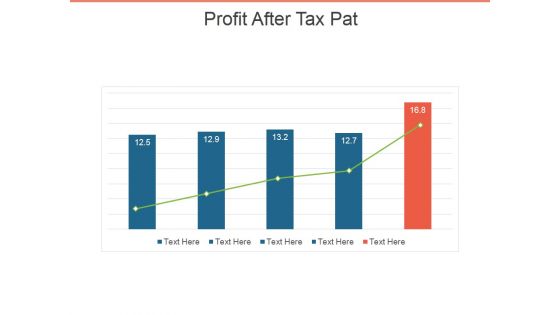
Profit After Tax Pat Ppt PowerPoint Presentation Inspiration Slide
This is a profit after tax pat ppt powerpoint presentation inspiration slide. This is a five stage process. The stages in this process are bar graph, business, marketing, growth, management.
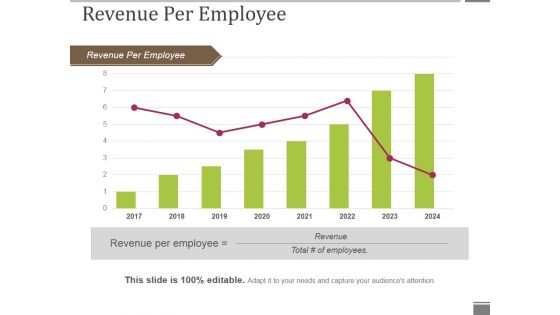
Revenue Per Employee Ppt PowerPoint Presentation Inspiration Objects
This is a revenue per employee ppt powerpoint presentation inspiration objects. This is a eight stage process. The stages in this process are revenue per employee, growth, marketing, business, planning.
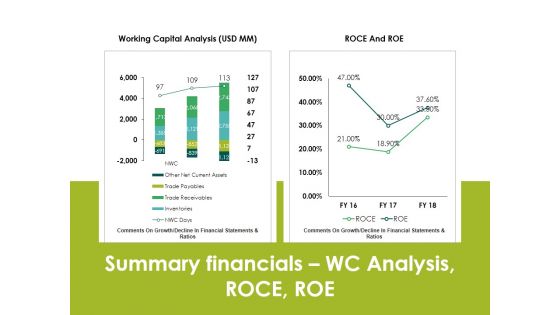
Summary Financials Wc Analysis Roce Roe Ppt PowerPoint Presentation Pictures Outfit
This is a summary financials wc analysis roce roe ppt powerpoint presentation pictures outfit. This is a two stage process. The stages in this process are business, finance, analysis, marketing, strategy, growth.
Profitability Ratios Template 1 Ppt PowerPoint Presentation Icon Example File
This is a profitability ratios template 1 ppt powerpoint presentation icon example file. This is a two stage process. The stages in this process are gross profit ratio, net profit ratio.

Market Trends Ppt PowerPoint Presentation Themes
This is a market trends ppt powerpoint presentation themes. This is a two stage process. The stages in this process are montana, texas, sales in texas, product.
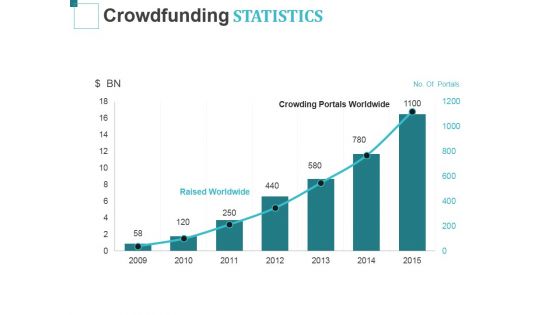
Crowdfunding Statistics Template 1 Ppt PowerPoint Presentation Outline Shapes
This is a crowdfunding statistics template 1 ppt powerpoint presentation outline shapes. This is a seven stage process. The stages in this process are business, strategy, analysis, marketing, crowding portals worldwide.
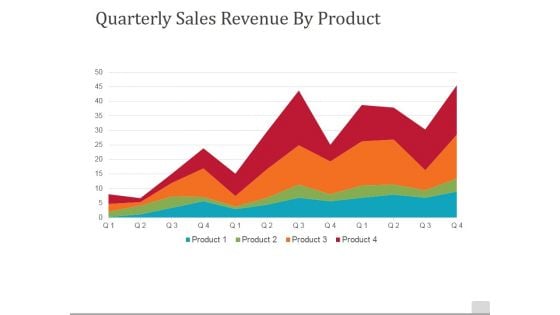
Quarterly Sales Revenue By Product Ppt PowerPoint Presentation File Background
This is a quarterly sales revenue by product ppt powerpoint presentation file background. This is a four stage process. The stages in this process are quarterly, sales revenue by product, business, marketing, success.
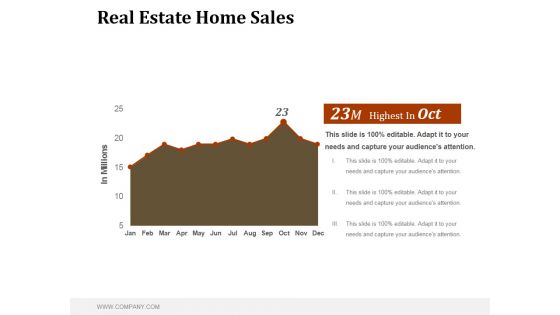
Real Estate Home Sales Ppt PowerPoint Presentation Model
This is a real estate home sales ppt powerpoint presentation model. This is a one stage process. The stages in this process are in millions, business, marketing, success, management.
Profitability Ratios Template 2 Ppt PowerPoint Presentation Infographics Layouts
This is a profitability ratios template 2 ppt powerpoint presentation infographics layouts. This is a two stage process. The stages in this process are price to earning ratio, earning per share, market value price per share.

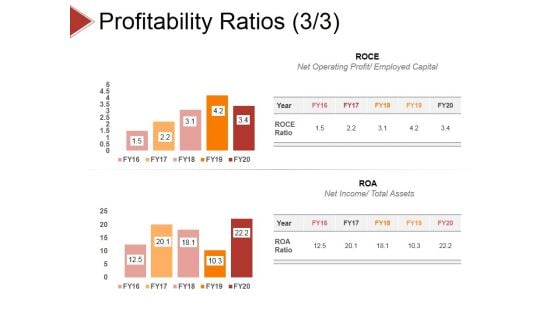
Profitability Ratios Template 3 Ppt PowerPoint Presentation Styles Slide Download
This is a profitability ratios template 3 ppt powerpoint presentation styles slide download. This is a two stage process. The stages in this process are roce, roa, net operating profit, net income.
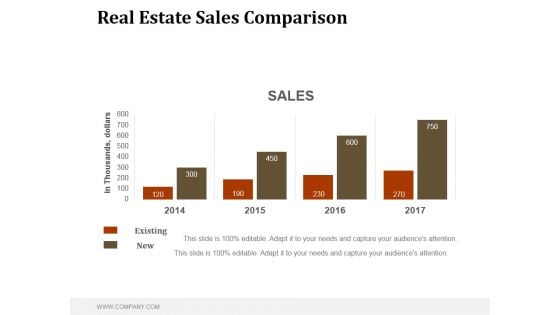
Real Estate Sales Comparison Ppt PowerPoint Presentation Good
This is a real estate sales comparison ppt powerpoint presentation good. This is a four stage process. The stages in this process are business, marketing, management, sales, comparison.
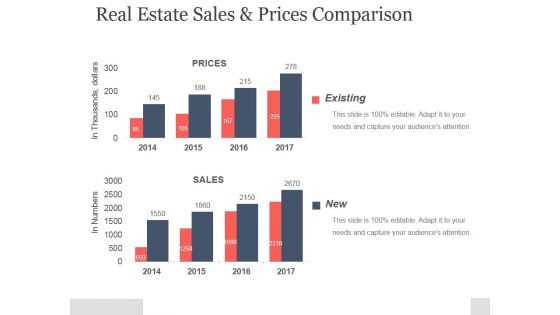
Real Estate Sales And Prices Comparison Ppt PowerPoint Presentation Example
This is a real estate sales and prices comparison ppt powerpoint presentation example. This is a two stage process. The stages in this process are existing, prices, sales, in thousands, dollars.
Financial Projection Graph Template 1 Ppt PowerPoint Presentation Icon Summary
This is a financial projection graph template 1 ppt powerpoint presentation icon summary. This is a three stage process. The stages in this process are annual sales forecast, years, business, marketing, management.
Area Chart Ppt PowerPoint Presentation Icon Layout Ideas
This is a area chart ppt powerpoint presentation icon layout ideas. This is a two stage process. The stages in this process are area chart, sales in percentage, years, planning, business.

Opportunity Score Ppt PowerPoint Presentation Summary
This is a opportunity score ppt powerpoint presentation summary. This is a five stage process. The stages in this process are high propensity to purchase, ideal target, sales ready, nurture, starburst.

Improving Business Revenue Bar Graph Ppt PowerPoint Presentation Infographic Template
This is a improving business revenue bar graph ppt powerpoint presentation infographic template. This is a six stage process. The stages in this process are graph, arrow, finance, percentage, success.
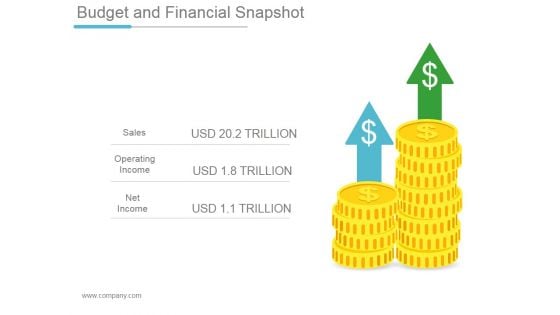
Budget And Financial Snapshot Ppt PowerPoint Presentation Example
This is a budget and financial snapshot ppt powerpoint presentation example. This is a two stage process. The stages in this process are sales, operating income, net income.
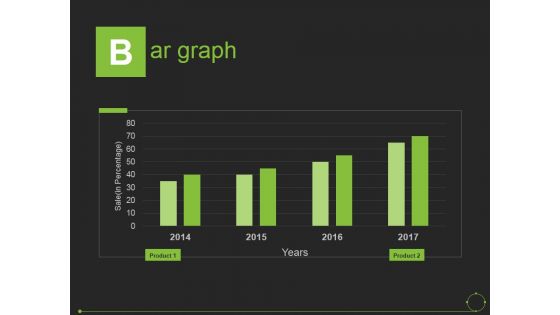
Bar Graph Ppt PowerPoint Presentation Portfolio Background
This is a bar graph ppt powerpoint presentation portfolio background. This is a four stage process. The stages in this process are sale, years, product.
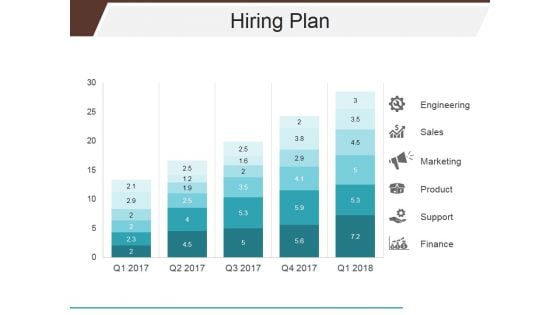
Hiring Plan Ppt PowerPoint Presentation Slide
This is a hiring plan ppt powerpoint presentation slide. This is a five stage process. The stages in this process are engineering, sales, marketing, product, support, finance.
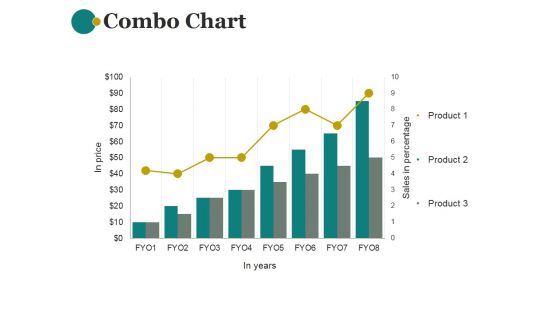
Combo Chart Ppt PowerPoint Presentation Shapes
This is a combo chart ppt powerpoint presentation shapes. This is a eight stage process. The stages in this process are combo chart, business, marketing, sales in percentage, bar graph.
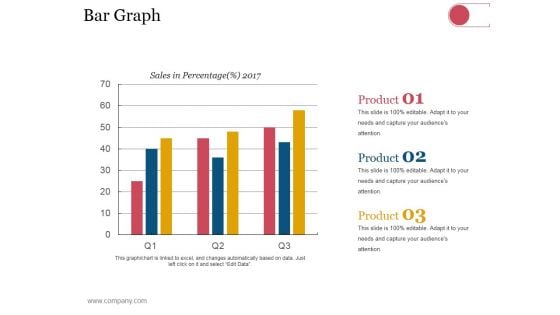
Bar Graph Ppt PowerPoint Presentation Visual Aids Model
This is a bar graph ppt powerpoint presentation visual aids model. This is a three stage process. The stages in this process are business, strategy, analysis, planning, sales in percentage.
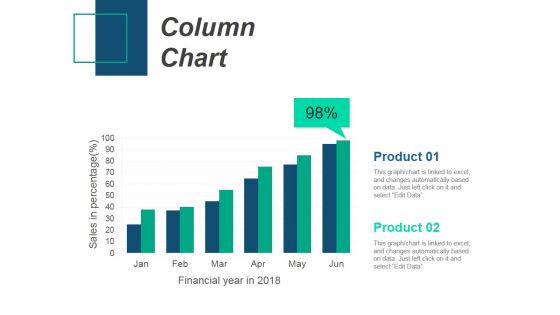
Column Chart Ppt PowerPoint Presentation Gallery Design Inspiration
This is a column chart ppt powerpoint presentation gallery design inspiration. This is a two stage process. The stages in this process are column chart, product, sales in percentage, financial years.
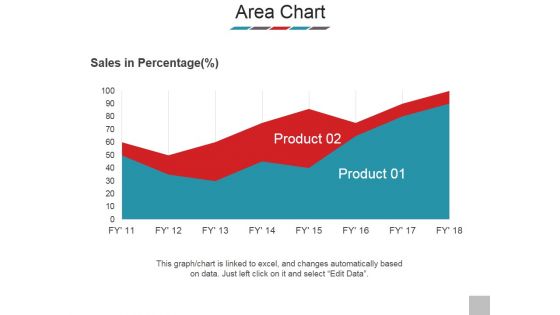
Area Chart Ppt PowerPoint Presentation Styles Images
This is a area chart ppt powerpoint presentation styles images. This is a two stage process. The stages in this process are sales in percentage, product, graph, business, marketing.
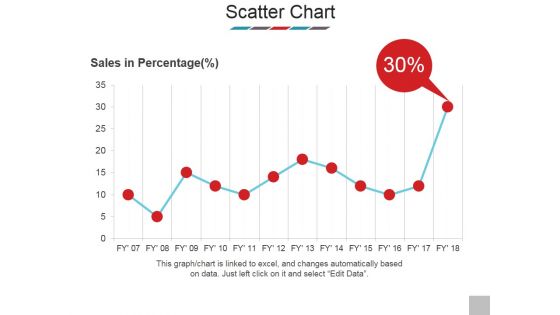
Scatter Chart Ppt PowerPoint Presentation Model Show
This is a scatter chart ppt powerpoint presentation model show. This is a one stage process. The stages in this process are sales in percentage, scatter chart, business, bar graph, marketing.
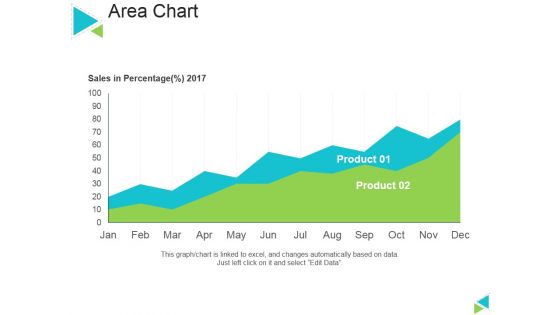
Area Chart Ppt PowerPoint Presentation Inspiration Themes
This is a area chart ppt powerpoint presentation inspiration themes. This is a two stage process. The stages in this process are sales in percentage, product, area chart, business, marketing.
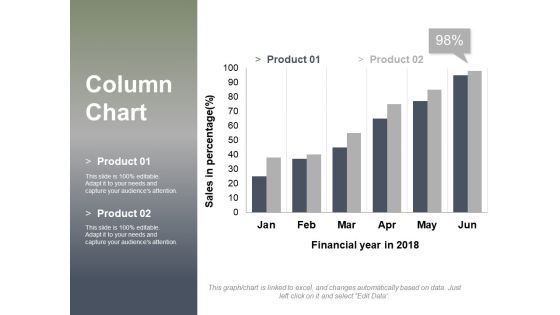
Column Chart Ppt PowerPoint Presentation Layouts Design Inspiration
This is a column chart ppt powerpoint presentation layouts design inspiration. This is a two stage process. The stages in this process are sales in percentage, financial year in, graph, business, finance, marketing.
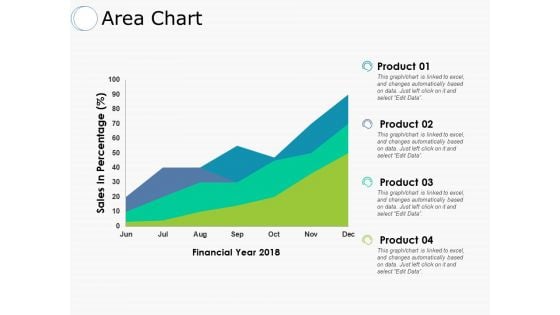
Area Chart Financial Ppt PowerPoint Presentation Outline Professional
This is a area chart financial ppt powerpoint presentation outline professional. This is a four stage process. The stages in this process are product, sales in percentage, financial year.
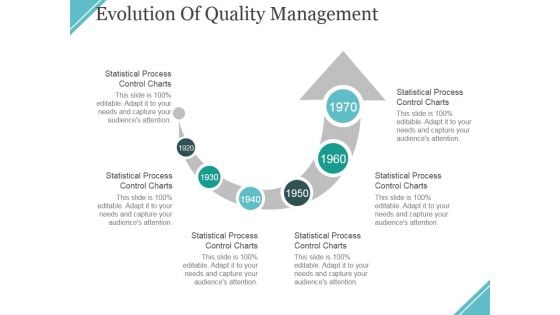
Evolution Of Quality Management Ppt PowerPoint Presentation Inspiration Demonstration
This is a evolution of quality management ppt powerpoint presentation inspiration demonstration. This is a six stage process. The stages in this process are statistical process control charts, arrows, business, marketing, management.
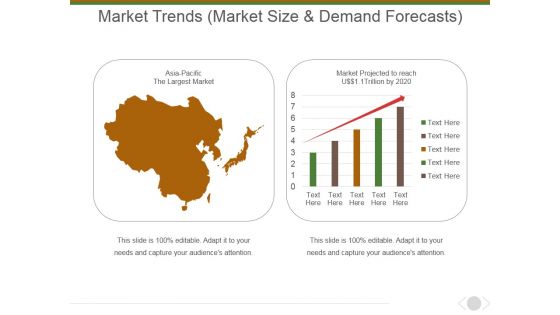
Market Trends Market Size And Demand Forecasts Ppt PowerPoint Presentation Inspiration Elements
This is a market trends market size and demand forecasts ppt powerpoint presentation inspiration elements. This is a two stage process. The stages in this process are asia pacific, the largest market, market projected to reach.
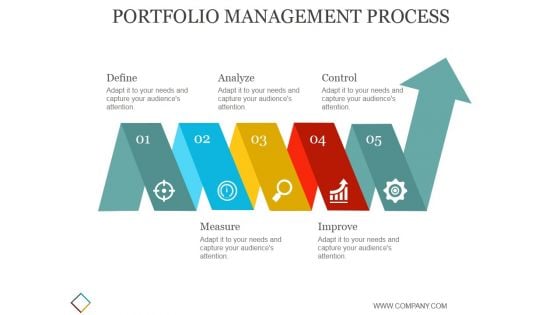
Portfolio Management Process Ppt PowerPoint Presentation Layout
This is a portfolio management process ppt powerpoint presentation layout. This is a five stage process. The stages in this process are define, analyze, control, measure, improve.
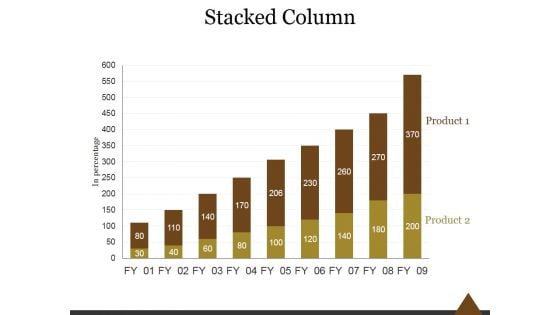
Stacked Column Ppt PowerPoint Presentation Rules
This is a stacked column ppt powerpoint presentation rules. This is a nine stage process. The stages in this process are stacked, column, business, marketing, success.
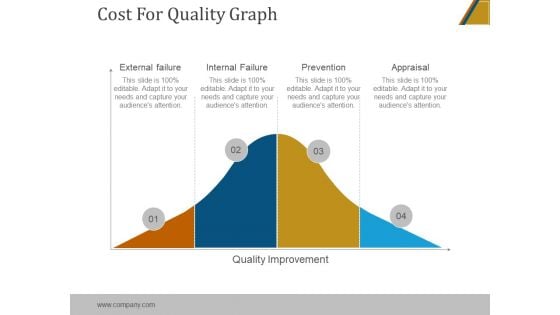
Cost For Quality Graph Ppt PowerPoint Presentation Graphics
This is a cost for quality graph ppt powerpoint presentation graphics. This is a four stage process. The stages in this process are external failure, internal failure, prevention, appraisal, quality improvement.
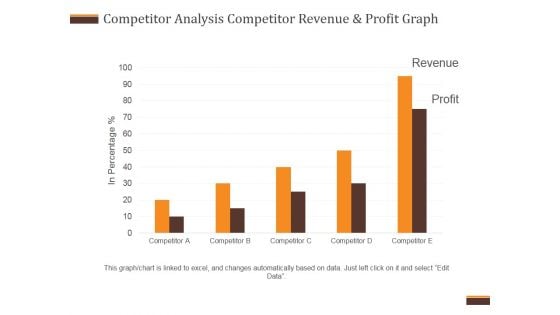
Competitor Analysis Competitor Revenue And Profit Graph Ppt PowerPoint Presentation Inspiration
This is a competitor analysis competitor revenue and profit graph ppt powerpoint presentation inspiration. This is a five stage process. The stages in this process are business, marketing, management, profit, revenue.
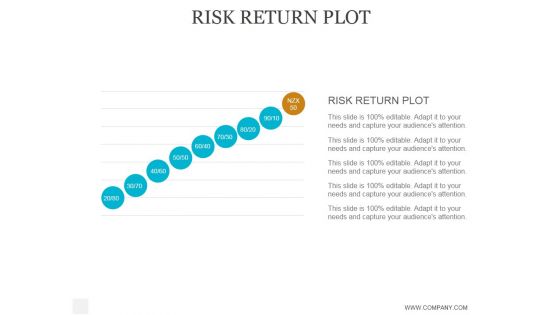
Risk Return Plot Ppt PowerPoint Presentation Pictures
This is a risk return plot ppt powerpoint presentation pictures. This is a nine stage process. The stages in this process are business, strategy, marketing, analysis, risk return plot.
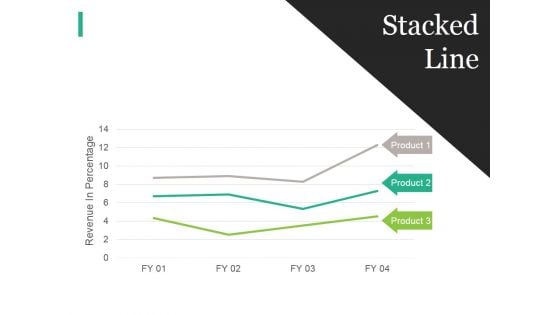
Stacked Line Ppt PowerPoint Presentation File Display
This is a stacked line ppt powerpoint presentation file display. This is a three stage process. The stages in this process are business, strategy, marketing, analysis, revenue in percentage, stacked line.
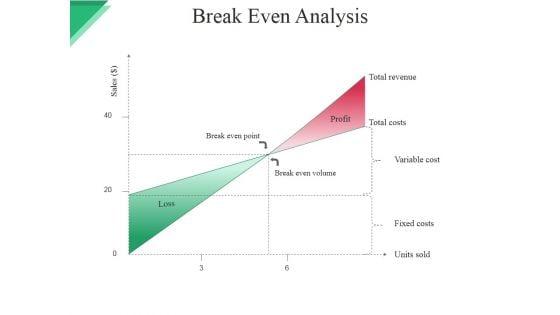
Break Even Analysis Ppt PowerPoint Presentation Styles Samples
This is a break even analysis ppt powerpoint presentation styles samples. This is a two stage process. The stages in this process are break even point, break even volume, profit, total revenue, total costs, variable cost.
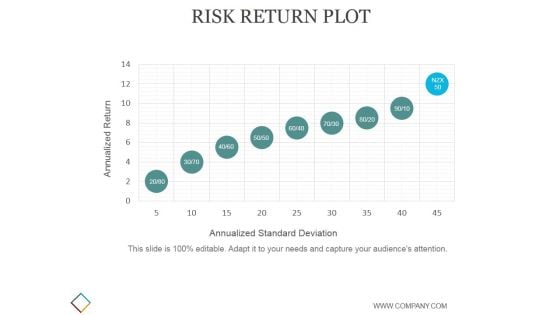
Risk Return Plot Ppt PowerPoint Presentation Background Images
This is a risk return plot ppt powerpoint presentation background images. This is a nine stage process. The stages in this process are annualized return, annualized standard deviation.
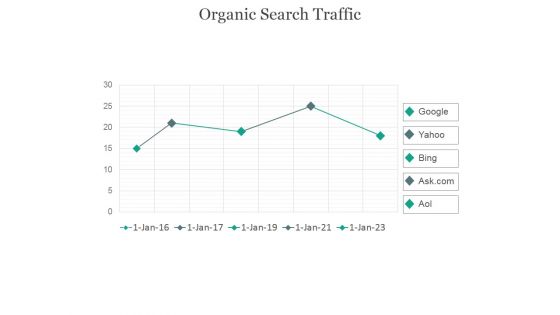
Organic Search Traffic Ppt PowerPoint Presentation Visuals
This is a organic search traffic ppt powerpoint presentation visuals. This is a five stage process. The stages in this process are google, yahoo, bing, aol, ask com.
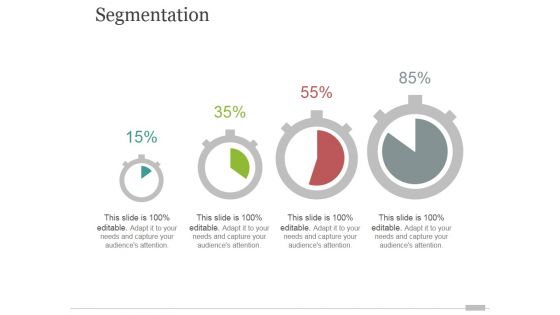
Segmentation Ppt PowerPoint Presentation Slides
This is a segmentation ppt powerpoint presentation slides. This is a four stage process. The stages in this process are business, marketing, strategy, success, process.
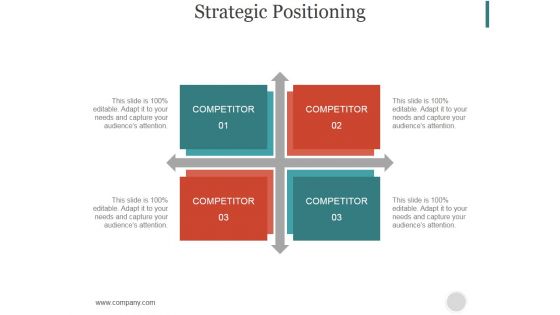
Strategic Positioning Ppt PowerPoint Presentation Designs
This is a strategic positioning ppt powerpoint presentation designs. This is a four stage process. The stages in this process are competitor, business, marketing, success, strategy.
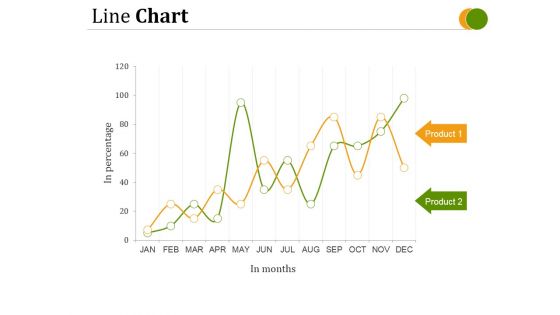
Line Chart Ppt PowerPoint Presentation Microsoft
This is a line chart ppt powerpoint presentation microsoft. This is a two stage process. The stages in this process are line chart, business, marketing, success, management.


 Continue with Email

 Home
Home


