Health Data
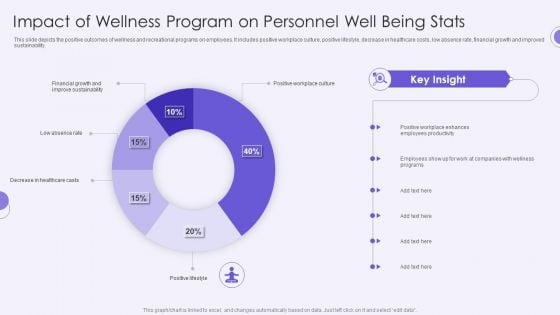
Impact Of Wellness Program On Personnel Well Being Stats Information PDF
This slide depicts the positive outcomes of wellness and recreational programs on employees. It includes positive workplace culture, positive lifestyle, decrease in healthcare costs, low absence rate, financial growth and improved sustainability.Showcasing this set of slides titled Impact Of Wellness Program On Personnel Well Being Stats Information PDF. The topics addressed in these templates are Improve Sustainability, Financial Growth, Low Absence. All the content presented in this PPT design is completely editable. Download it and make adjustments in color, background, font etc. as per your unique business setting.
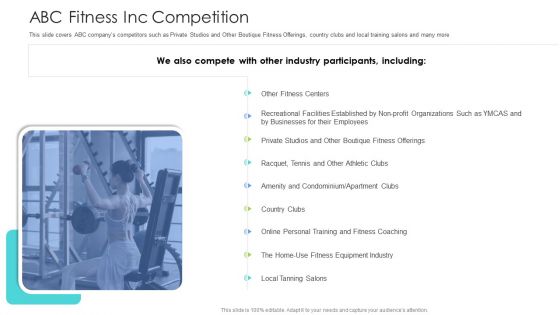
Well Being Gymnasium Sector ABC Fitness Inc Competition Template PDF
This slide covers ABC companys competitors such as Private Studios and Other Boutique Fitness Offerings, country clubs and local training salons and many more. Deliver an awe-inspiring pitch with this creative well being gymnasium sector abc fitness inc competition template pdf bundle. Topics like fitness inc competition can be discussed with this completely editable template. It is available for immediate download depending on the needs and requirements of the user.
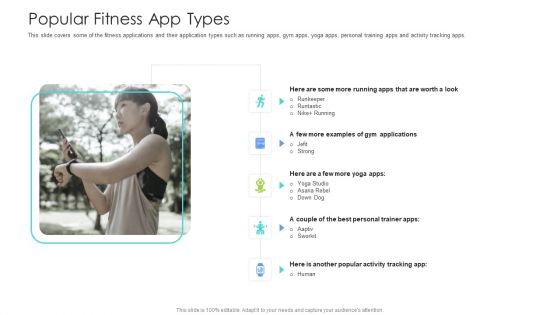
Well Being Gymnasium Sector Popular Fitness App Types Ideas PDF
This slide covers some of the fitness applications and their application types such as running apps, gym apps, yoga apps, personal training apps and activity tracking apps. Deliver an awe-inspiring pitch with this creative well being gymnasium sector popular fitness app types ideas pdf bundle. Topics like popular fitness app types can be discussed with this completely editable template. It is available for immediate download depending on the needs and requirements of the user.

Statistical Process Control In Powerpoint And Google Slides Cpb
Introducing our well designed Statistical Process Control In Powerpoint And Google Slides Cpb This PowerPoint design presents information on topics like Statistical Process Control As it is predesigned it helps boost your confidence level. It also makes you a better presenter because of its high quality content and graphics. This PPT layout can be downloaded and used in different formats like PDF, PNG, and JPG. Not only this, it is available in both Standard Screen and Widescreen aspect ratios for your convenience. Therefore, click on the download button now to persuade and impress your audience. Our Statistical Process Control In Powerpoint And Google Slides Cpb are topically designed to provide an attractive backdrop to any subject. Use them to look like a presentation pro.
Randomization Statistics Chart In Powerpoint And Google Slides Cpb
Introducing our well designed Randomization Statistics Chart In Powerpoint And Google Slides Cpb. This PowerPoint design presents information on topics like Randomization Statistics Chart. As it is predesigned it helps boost your confidence level. It also makes you a better presenter because of its high-quality content and graphics. This PPT layout can be downloaded and used in different formats like PDF, PNG, and JPG. Not only this, it is available in both Standard Screen and Widescreen aspect ratios for your convenience. Therefore, click on the download button now to persuade and impress your audience. Our Randomization Statistics Chart In Powerpoint And Google Slides Cpb are topically designed to provide an attractive backdrop to any subject. Use them to look like a presentation pro.
Statistics Branches In Powerpoint And Google Slides Cpb
Introducing our well designed Statistics Branches In Powerpoint And Google Slides Cpb. This PowerPoint design presents information on topics like Statistics Branches. As it is predesigned it helps boost your confidence level. It also makes you a better presenter because of its high-quality content and graphics. This PPT layout can be downloaded and used in different formats like PDF, PNG, and JPG. Not only this, it is available in both Standard Screen and Widescreen aspect ratios for your convenience. Therefore, click on the download button now to persuade and impress your audience. Our Statistics Branches In Powerpoint And Google Slides Cpb are topically designed to provide an attractive backdrop to any subject. Use them to look like a presentation pro.
Monitor Statistical Growth In Powerpoint And Google Slides Cpb
Introducing our well designed Monitor Statistical Growth In Powerpoint And Google Slides Cpb. This PowerPoint design presents information on topics like Monitor Statistical Growth. As it is predesigned it helps boost your confidence level. It also makes you a better presenter because of its high-quality content and graphics. This PPT layout can be downloaded and used in different formats like PDF, PNG, and JPG. Not only this, it is available in both Standard Screen and Widescreen aspect ratios for your convenience. Therefore, click on the download button now to persuade and impress your audience. Our Monitor Statistical Growth In Powerpoint And Google Slides Cpb are topically designed to provide an attractive backdrop to any subject. Use them to look like a presentation pro.
Explanatory Variable Statistics In Powerpoint And Google Slides Cpb
Introducing our well-designed Explanatory Variable Statistics In Powerpoint And Google Slides Cpb This PowerPoint design presents information on topics like Explanatory Variable Statistics As it is predesigned it helps boost your confidence level. It also makes you a better presenter because of its high-quality content and graphics. This PPT layout can be downloaded and used in different formats like PDF, PNG, and JPG. Not only this, it is available in both Standard Screen and Widescreen aspect ratios for your convenience. Therefore, click on the download button now to persuade and impress your audience. Our Explanatory Variable Statistics In Powerpoint And Google Slides Cpb are topically designed to provide an attractive backdrop to any subject. Use them to look like a presentation pro.
Block Design Statistics In Powerpoint And Google Slides Cpb
Introducing our well-designed Block Design Statistics In Powerpoint And Google Slides Cpb. This PowerPoint design presents information on topics like Block Design Statistics. As it is predesigned it helps boost your confidence level. It also makes you a better presenter because of its high-quality content and graphics. This PPT layout can be downloaded and used in different formats like PDF, PNG, and JPG. Not only this, it is available in both Standard Screen and Widescreen aspect ratios for your convenience. Therefore, click on the download button now to persuade and impress your audience. Our Block Design Statistics In Powerpoint And Google Slides Cpb are topically designed to provide an attractive backdrop to any subject. Use them to look like a presentation pro.
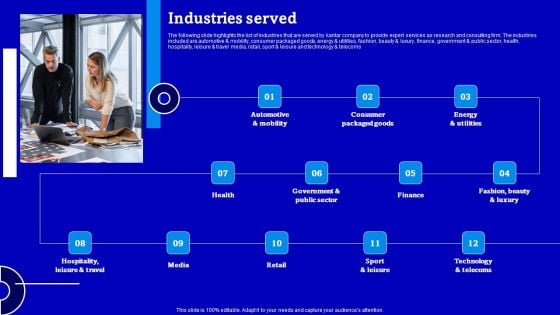
Consulting Firm Business Profile Industries Served Infographics PDF
The following slide highlights the list of industries that are served by kantar company to provide expert services as research and consulting firm. The industries included are automotive and mobility, consumer packaged goods, energy and utilities, fashion, beauty and luxury, finance, government and public sector, health, hospitality, leisure and travel media, retail, sport and leisure and technology and telecoms Explore a selection of the finest Consulting Firm Business Profile Industries Served Infographics PDF here. With a plethora of professionally designed and pre made slide templates, you can quickly and easily find the right one for your upcoming presentation. You can use our Consulting Firm Business Profile Industries Served Infographics PDF to effectively convey your message to a wider audience. Slidegeeks has done a lot of research before preparing these presentation templates. The content can be personalized and the slides are highly editable. Grab templates today from Slidegeeks.
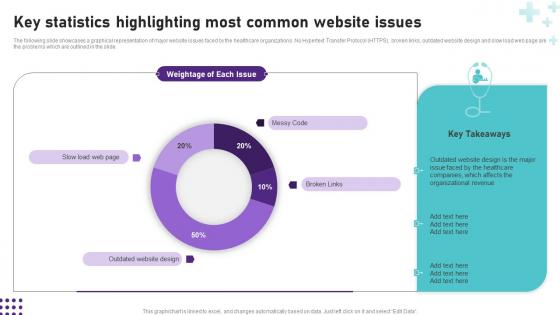
Key Statistics Highlighting Most Common Website Issues Operational Areas Healthcare Background PDF
The best PPT templates are a great way to save time, energy, and resources. Slidegeeks have 100 percent editable powerpoint slides making them incredibly versatile. With these quality presentation templates, you can create a captivating and memorable presentation by combining visually appealing slides and effectively communicating your message. Download Key Statistics Highlighting Most Common Website Issues Operational Areas Healthcare Background PDF from Slidegeeks and deliver a wonderful presentation. The following slide showcases a graphical representation of major website issues faced by the healthcare organizations. No Hypertext Transfer Protocol HTTPS, broken links, outdated website design and slow load web page are the problems which are outlined in the slide.
Software Implementation Project Progress Tracking Dashboard Summary PDF
This slide represents the dashboard to track the progress of software implementation project. It includes details related to health, tasks, project, time, cost and workload of software implementation project. If you are looking for a format to display your unique thoughts, then the professionally designed Software Implementation Project Progress Tracking Dashboard Summary PDF is the one for you. You can use it as a Google Slides template or a PowerPoint template. Incorporate impressive visuals, symbols, images, and other charts. Modify or reorganize the text boxes as you desire. Experiment with shade schemes and font pairings. Alter, share or cooperate with other people on your work. Download Software Implementation Project Progress Tracking Dashboard Summary PDFSoftware Implementation Project Progress Tracking Dashboard Summary PDF and find out how to give a successful presentation. Present a perfect display to your team and make your presentation unforgettable.

Recommender System Implementation Statistical Measures To Evaluate Accuracy Download Pdf
This slide talks about the various methods of evaluating the performance of a recommender systems. The purpose of this slide is to illustrate the ways to check if a recommendation system is good enough or not. These methods include K fold cross validation, MAE and RMSD. Are you in need of a template that can accommodate all of your creative concepts This one is crafted professionally and can be altered to fit any style. Use it with Google Slides or PowerPoint. Include striking photographs, symbols, depictions, and other visuals. Fill, move around, or remove text boxes as desired. Test out color palettes and font mixtures. Edit and save your work, or work with colleagues. Download Recommender System Implementation Statistical Measures To Evaluate Accuracy Download Pdf and observe how to make your presentation outstanding. Give an impeccable presentation to your group and make your presentation unforgettable. This slide talks about the various methods of evaluating the performance of a recommender systems. The purpose of this slide is to illustrate the ways to check if a recommendation system is good enough or not. These methods include K fold cross validation, MAE and RMSD.

Effective Brand Reputation Management Brand Asset Valuator Power Grid To Assess Brochure PDF
This slide provides information regarding brand asset valuator power grid to analyze overall brand health. It caters details about new, unfocused, eroding, power, declining or niche brands.Slidegeeks is here to make your presentations a breeze with Effective Brand Reputation Management Brand Asset Valuator Power Grid To Assess Brochure PDF With our easy-to-use and customizable templates, you can focus on delivering your ideas rather than worrying about formatting. With a variety of designs to choose from, your are sure to find one that suits your needs. And with animations and unique photos, illustrations, and fonts, you can make your presentation pop. So whether your are giving a sales pitch or presenting to the board, make sure to check out Slidegeeks first.

Statistical Methods In Powerpoint And Google Slides Cpb
Presenting our innovatively-designed set of slides titled Statistical Methods In Powerpoint And Google Slides Cpb This completely editable PowerPoint graphic exhibits Statistical Methods that will help you convey the message impactfully. It can be accessed with Google Slides and is available in both standard screen and widescreen aspect ratios. Apart from this, you can download this well-structured PowerPoint template design in different formats like PDF, JPG, and PNG. So, click the download button now to gain full access to this PPT design. Our Statistical Methods In Powerpoint And Google Slides Cpb are topically designed to provide an attractive backdrop to any subject. Use them to look like a presentation pro.
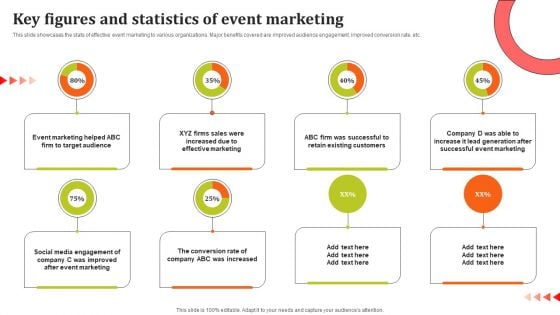
Key Figures And Statistics Of Event Marketing Ppt Summary Graphics Example PDF
This slide showcases the stats of effective event marketing to various organizations. Major benefits covered are improved audience engagement, improved conversion rate, etc. Are you in need of a template that can accommodate all of your creative concepts This one is crafted professionally and can be altered to fit any style. Use it with Google Slides or PowerPoint. Include striking photographs, symbols, depictions, and other visuals. Fill, move around, or remove text boxes as desired. Test out color palettes and font mixtures. Edit and save your work, or work with colleagues. Download Key Figures And Statistics Of Event Marketing Ppt Summary Graphics Example PDF and observe how to make your presentation outstanding. Give an impeccable presentation to your group and make your presentation unforgettable.
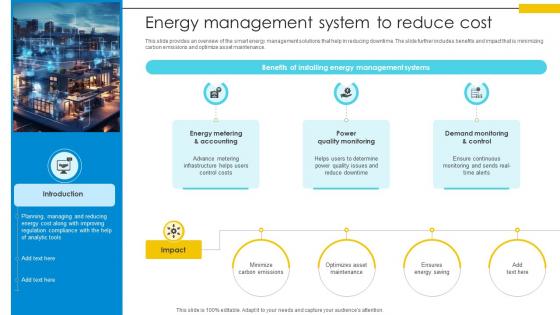
Energy Management System To Reduce Cost Optimizing Inventory Management IoT SS V
This slide provides an overview of the smart energy management solutions that help in reducing downtime. The slide further includes benefits and impact that is minimizing carbon emissions and optimize asset maintenance. The Energy Management System To Reduce Cost Optimizing Inventory Management IoT SS V is a compilation of the most recent design trends as a series of slides. It is suitable for any subject or industry presentation, containing attractive visuals and photo spots for businesses to clearly express their messages. This template contains a variety of slides for the user to input data, such as structures to contrast two elements, bullet points, and slides for written information. Slidegeeks is prepared to create an impression. This slide provides an overview of the smart energy management solutions that help in reducing downtime. The slide further includes benefits and impact that is minimizing carbon emissions and optimize asset maintenance.
Folder Icon Computer PowerPoint Templates Ppt Backgrounds For Slides 1112
We present our Folder Icon Computer PowerPoint Templates PPT Backgrounds for Slides 1112.Use our Shapes PowerPoint Templates because, Use our to enthuse your colleagues. Use our Signs PowerPoint Templates because, explore the minutest detail of each concept and follow the trail to its conclusion. Use our Technology PowerPoint Templates because; enlighten them with your brilliant understanding of mental health. Use our Business PowerPoint Templates because, Marketing Strategy Business Template: - Maximizing sales of your product is the intended destination. Use our Finance PowerPoint Templates because; adorn them with your ideas and thoughts. Use these PowerPoint slides for presentations relating to Full files folder icon, business, finance, signs, technology, and shapes. The prominent colors used in the PowerPoint template are Blue, Black, and White Illustrate goals with our Folder Icon Computer PowerPoint Templates Ppt Backgrounds For Slides 1112. Download without worries with our money back guaranteee.
Laptop And Falling Dollar Coins Finace PowerPoint Templates Ppt Background For Slides 1112
We present our Laptop And Falling Dollar Coins Finace PowerPoint Templates PPT Background For Slides 1112.Use our Technology PowerPoint Templates because,your findings are here to help arrive at an accurate diagnosis. Use our Computer PowerPoint Templates because,You can Enlighten them with your brilliant understanding of mental health. Use our Money PowerPoint Templates because, This PPT Enlighten others on your team with your views. Use our Finance PowerPoint Templates because, The lessons have been analyzed, studied and conclusions drawn. Use our Success PowerPoint Templates because, The success of your venture depends on the performance of every team member.Use these PowerPoint slides for presentations relating to Laptop and falling coins, technology, computer, money, finance, success. The prominent colors used in the PowerPoint template are Yellow, White, Black Our Laptop And Falling Dollar Coins Finace PowerPoint Templates Ppt Background For Slides 1112 have more than what meets the eye. They contain additional dimensions.
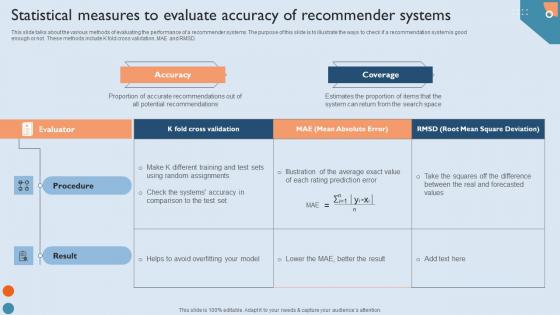
Recommendation Techniques Statistical Measures To Evaluate Accuracy Of Recommender Systems Mockup PDF
This slide talks about the various methods of evaluating the performance of a recommender systems. The purpose of this slide is to illustrate the ways to check if a recommendation system is good enough or not. These methods include K fold cross validation, MAE and RMSD. Are you in need of a template that can accommodate all of your creative concepts This one is crafted professionally and can be altered to fit any style. Use it with Google Slides or PowerPoint. Include striking photographs, symbols, depictions, and other visuals. Fill, move around, or remove text boxes as desired. Test out color palettes and font mixtures. Edit and save your work, or work with colleagues. Download Recommendation Techniques Statistical Measures To Evaluate Accuracy Of Recommender Systems Mockup PDF and observe how to make your presentation outstanding. Give an impeccable presentation to your group and make your presentation unforgettable. This slide talks about the various methods of evaluating the performance of a recommender systems. The purpose of this slide is to illustrate the ways to check if a recommendation system is good enough or not. These methods include K fold cross validation, MAE and RMSD.
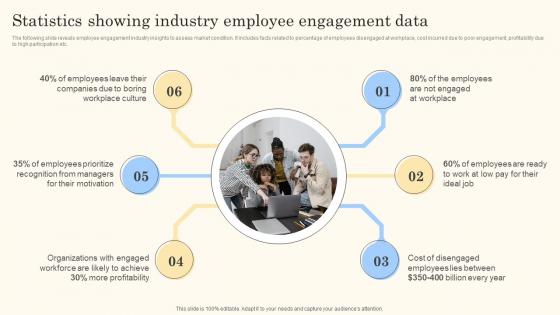
Statistics Showing Industry Employee Action Steps For Employee Engagement Demonstration Pdf
The following slide reveals employee engagement industry insights to assess market condition. It includes facts related to percentage of employees disengaged at workplace, cost incurred due to poor engagement, profitability due to high participation etc.Are you in need of a template that can accommodate all of your creative concepts This one is crafted professionally and can be altered to fit any style. Use it with Google Slides or PowerPoint. Include striking photographs, symbols, depictions, and other visuals. Fill, move around, or remove text boxes as desired. Test out color palettes and font mixtures. Edit and save your work, or work with colleagues. Download Statistics Showing Industry Employee Action Steps For Employee Engagement Demonstration Pdf and observe how to make your presentation outstanding. Give an impeccable presentation to your group and make your presentation unforgettable. The following slide reveals employee engagement industry insights to assess market condition. It includes facts related to percentage of employees disengaged at workplace, cost incurred due to poor engagement, profitability due to high participation etc.
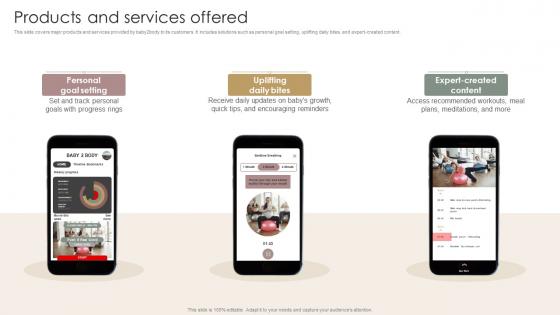
Products And Services Offered Women Wellness Coaching Platform Pitch Deck
This slide covers major products and services provided by baby2body to its customers. It includes solutions such as personal goal setting, uplifting daily bites, and expert-created content. Formulating a presentation can take up a lot of effort and time, so the content and message should always be the primary focus. The visuals of the PowerPoint can enhance the presenters message, so our Products And Services Offered Women Wellness Coaching Platform Pitch Deck was created to help save time. Instead of worrying about the design, the presenter can concentrate on the message while our designers work on creating the ideal templates for whatever situation is needed. Slidegeeks has experts for everything from amazing designs to valuable content, we have put everything into Products And Services Offered Women Wellness Coaching Platform Pitch Deck This slide covers major products and services provided by baby2body to its customers. It includes solutions such as personal goal setting, uplifting daily bites, and expert-created content.
Statistical Analysis In Powerpoint And Google Slides Cpb
Presenting our innovatively designed set of slides titled Statistical Analysis In Powerpoint And Google Slides Cpb. This completely editable PowerPoint graphic exhibits Statistical Analysis that will help you convey the message impactfully. It can be accessed with Google Slides and is available in both standard screen and widescreen aspect ratios. Apart from this, you can download this well structured PowerPoint template design in different formats like PDF, JPG, and PNG. So, click the download button now to gain full access to this PPT design. Our Statistical Analysis In Powerpoint And Google Slides Cpb are topically designed to provide an attractive backdrop to any subject. Use them to look like a presentation pro.

Bioelectronics And Solar Energy Ppt Guidelines ACP
Use this Bioelectronics And Solar Energy Ppt Guidelines ACP to ensure the business world gets to know you as a presentation expert with tremendous recall value. With its focus on providing the worlds best designs to highlight business ideas that have the potential to change the world, this PPT Template is sure to win you clients. The complete deck in Bioelectronics And Solar Power, Bioelectronics In Renewable Energy, Solar Energy Bioelectronics Integration, Bioelectronics For Solar Systems, Solar Energy And Bioelectronics Applications slides is a compendium of information, structured in a manner that provides the best framework for a presentation. Use this completely editable and customizable presentation to make an impact and improve your order book. Download now. Enhance your presentations with our detailed PPT deck on Bioelectronics and Solar Energy. This thoughtfully designed template features clear guidelines, captivating visuals, and valuable data, making it ideal for professionals aiming to present complex concepts with ease. Perfect for conferences, workshops, and academic environments. Unlock your presentations full potential today.
Statistical Modeling Project Ppt Powerpoint Presentation Complete Deck With Slides
This Statistical Modeling Project Ppt Powerpoint Presentation Complete Deck With Slides acts as backup support for your ideas, vision, thoughts, etc. Use it to present a thorough understanding of the topic. This PPT slideshow can be utilized for both in-house and outside presentations depending upon your needs and business demands. Entailing eighteen slides with a consistent design and theme, this template will make a solid use case. As it is intuitively designed, it suits every business vertical and industry. All you have to do is make a few tweaks in the content or any other component to design unique presentations. The biggest advantage of this complete deck is that it can be personalized multiple times once downloaded. The color, design, shapes, and other elements are free to modify to add personal touches. You can also insert your logo design in this PPT layout. Therefore a well-thought and crafted presentation can be delivered with ease and precision by downloading this Statistical Modeling Project Ppt Powerpoint Presentation Complete Deck With Slides PPT slideshow. Our Statistical Modeling Project Ppt Powerpoint Presentation Complete Deck With Slides are topically designed to provide an attractive backdrop to any subject. Use them to look like a presentation pro.
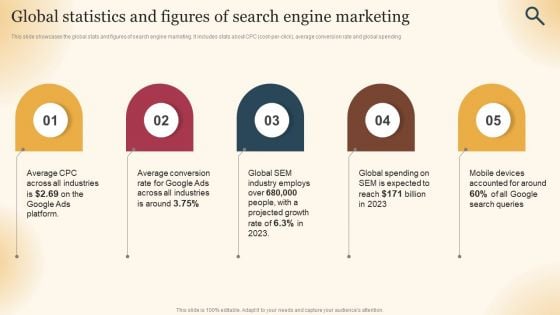
Qualified Traffic Generation Through Search Engines Global Statistics And Figures Search Ideas PDF
This slide showcases the global stats and figures of search engine marketing. It includes stats about CPC cost per click, average conversion rate and global spending This modern and well arranged Qualified Traffic Generation Through Search Engines Global Statistics And Figures Search Ideas PDF provides lots of creative possibilities. It is very simple to customize and edit with the Powerpoint Software. Just drag and drop your pictures into the shapes. All facets of this template can be edited with Powerpoint no extra software is necessary. Add your own material, put your images in the places assigned for them, adjust the colors, and then you can show your slides to the world, with an animated slide included.

Business Finance Security PowerPoint Templates And PowerPoint Themes 1112
We present our Business Finance Security PowerPoint Templates And PowerPoint Themes 1112.Use our Security PowerPoint Templates because,Explain the process by which you intend to right it. Use our Chains PowerPoint Templates because, Enlighten them with your brilliant understanding of mental health. Use our Money PowerPoint Templates because, Business Process Design:- The template offers an excellent background to build up the various stages of your business process. Use our Finance PowerPoint Templates because, They are logical, accurate and to the point. Use our Business PowerPoint Templates because, Brilliant ideas popping up all over the place.Use these PowerPoint slides for presentations relating to Dollars chained and locked, money, finance, business, security, chains . The prominent colors used in the PowerPoint template are Yellow, Black, White Make your brainstorming effective with our Business Finance Security PowerPoint Templates And PowerPoint Themes 1112. Churn out ideas to act upon.
Uterine Fibroids Statistics In Powerpoint And Google Slides Cpb
Presenting our innovatively designed set of slides titled Uterine Fibroids Statistics In Powerpoint And Google Slides Cpb This completely editable PowerPoint graphic exhibits Uterine Fibroids Statistics that will help you convey the message impactfully. It can be accessed with Google Slides and is available in both standard screen and widescreen aspect ratios. Apart from this, you can download this well structured PowerPoint template design in different formats like PDF, JPG, and PNG. So, click the download button now to gain full access to this PPT design. Our Uterine Fibroids Statistics In Powerpoint And Google Slides Cpb are topically designed to provide an attractive backdrop to any subject. Use them to look like a presentation pro.
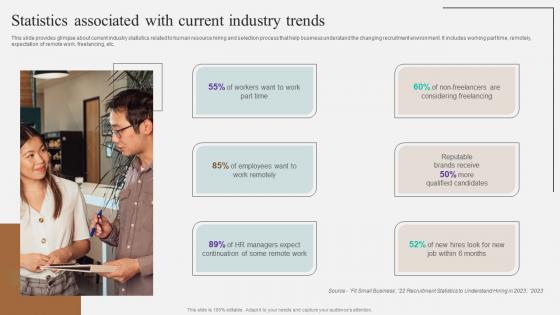
Statistics Associated With Current Industry Complete Guidelines For Streamlined Demonstration Pdf
This slide provides glimpse about current industry statistics related to human resource hiring and selection process that help business understand the changing recruitment environment. It includes working part time, remotely, expectation of remote work, freelancing, etc.This modern and well-arranged Statistics Associated With Current Industry Complete Guidelines For Streamlined Demonstration Pdf provides lots of creative possibilities. It is very simple to customize and edit with the Powerpoint Software. Just drag and drop your pictures into the shapes. All facets of this template can be edited with Powerpoint no extra software is necessary. Add your own material, put your images in the places assigned for them, adjust the colors, and then you can show your slides to the world, with an animated slide included. This slide provides glimpse about current industry statistics related to human resource hiring and selection process that help business understand the changing recruitment environment. It includes working part time, remotely, expectation of remote work, freelancing, etc.
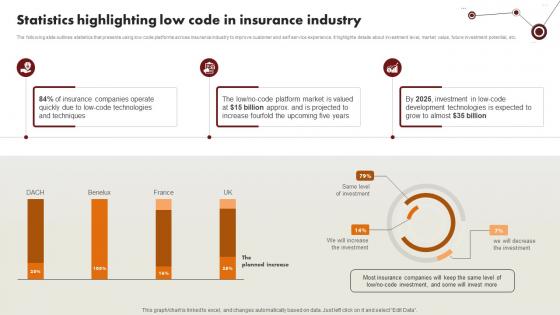
Technology Trends In Online Insurance Statistics Highlighting Low Code In Insurance Industry
The following slide outlines statistics that presents using low code platforms across insurance industry to improve customer and self service experience. It highlights details about investment level, market value, future investment potential, etc. Are you in need of a template that can accommodate all of your creative concepts This one is crafted professionally and can be altered to fit any style. Use it with Google Slides or PowerPoint. Include striking photographs, symbols, depictions, and other visuals. Fill, move around, or remove text boxes as desired. Test out color palettes and font mixtures. Edit and save your work, or work with colleagues. Download Technology Trends In Online Insurance Statistics Highlighting Low Code In Insurance Industry and observe how to make your presentation outstanding. Give an impeccable presentation to your group and make your presentation unforgettable. The following slide outlines statistics that presents using low code platforms across insurance industry to improve customer and self service experience. It highlights details about investment level, market value, future investment potential, etc.
Wellness Check In Powerpoint And Google Slides Cpb
Introducing our well designed Wellness Check In Powerpoint And Google Slides Cpb. This PowerPoint design presents information on topics like Wellness Check. As it is predesigned it helps boost your confidence level. It also makes you a better presenter because of its high quality content and graphics. This PPT layout can be downloaded and used in different formats like PDF, PNG, and JPG. Not only this, it is available in both Standard Screen and Widescreen aspect ratios for your convenience. Therefore, click on the download button now to persuade and impress your audience. Our Wellness Check In Powerpoint And Google Slides Cpb are topically designed to provide an attractive backdrop to any subject. Use them to look like a presentation pro.
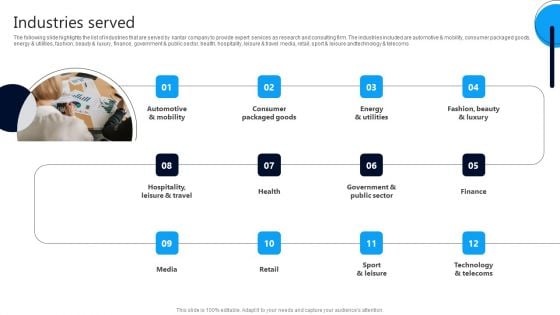
Market Research Evaluation Company Outline Industries Served Guidelines PDF
The following slide highlights the list of industries that are served by kantar company to provide expert services as research and consulting firm. The industries included are automotive and mobility, consumer packaged goods, energy and utilities, fashion, beauty and luxury, finance, government and public sector, health, hospitality, leisure and travel media, retail, sport and leisure andtechnology and telecoms. Slidegeeks is here to make your presentations a breeze with Market Research Evaluation Company Outline Industries Served Guidelines PDF With our easy to use and customizable templates, you can focus on delivering your ideas rather than worrying about formatting. With a variety of designs to choose from, you are sure to find one that suits your needs. And with animations and unique photos, illustrations, and fonts, you can make your presentation pop. So whether you are giving a sales pitch or presenting to the board, make sure to check out Slidegeeks first.
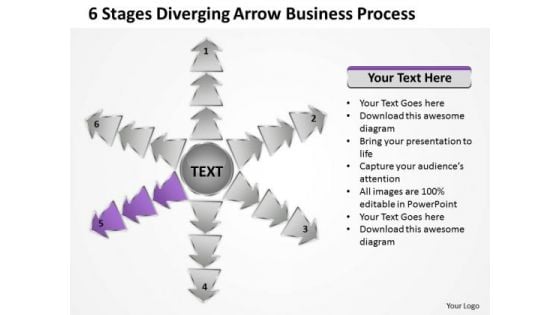
6 Stages Diverging Arrow Business Process Ppt Circular Spoke Network PowerPoint Templates
We present our 6 stages diverging arrow business process ppt Circular Spoke Network PowerPoint templates.Download and present our Marketing PowerPoint Templates because Our PowerPoint Templates and Slides ensures Effective communication. They help you put across your views with precision and clarity. Present our Shapes PowerPoint Templates because you can Enlighten them with your brilliant understanding of mental health. Download our Arrows PowerPoint Templates because you can Break through with our PowerPoint Templates and Slides. Bring down the mental barriers of your audience. Use our Business PowerPoint Templates because you can Flutter your wings and enchant the world. Impress them with the innate attractiveness of your thoughts and words. Download and present our Process and Flows PowerPoint Templates because Our PowerPoint Templates and Slides are created with admirable insight. Use them and give your group a sense of your logical mind.Use these PowerPoint slides for presentations relating to Arrows, Business, Chart, Cyclic, Data, Diagram, Financial, Goal, Graph, Illustration, Info, Information, Marketing, Model, Option, Part, Pie, Presentation, Process, Result, Sphere, Statistics. The prominent colors used in the PowerPoint template are Purple, Gray, Black. The feedback we get is that our 6 stages diverging arrow business process ppt Circular Spoke Network PowerPoint templates are Royal. People tell us our Cyclic PowerPoint templates and PPT Slides will impress their bosses and teams. Presenters tell us our 6 stages diverging arrow business process ppt Circular Spoke Network PowerPoint templates are Stunning. Use our Goal PowerPoint templates and PPT Slides will get their audience's attention. Use our 6 stages diverging arrow business process ppt Circular Spoke Network PowerPoint templates are Handsome. Use our Chart PowerPoint templates and PPT Slides will help them to explain complicated concepts. Excite your audience with our 6 Stages Diverging Arrow Business Process Ppt Circular Spoke Network PowerPoint Templates. You will come out on top.

Inferential Statistic In Powerpoint And Google Slides Cpb
Presenting our innovatively designed set of slides titled Inferential Statistic In Powerpoint And Google Slides Cpb. This completely editable PowerPoint graphic exhibits Inferential Statistic that will help you convey the message impactfully. It can be accessed with Google Slides and is available in both standard screen and widescreen aspect ratios. Apart from this, you can download this well structured PowerPoint template design in different formats like PDF, JPG, and PNG. So, click the download button now to gain full access to this PPT design. Our Inferential Statistic In Powerpoint And Google Slides Cpb are topically designed to provide an attractive backdrop to any subject. Use them to look like a presentation pro.
Descriptive Statistics In Powerpoint And Google Slides Cpb
Presenting our innovatively designed set of slides titled Descriptive Statistics In Powerpoint And Google Slides Cpb. This completely editable PowerPoint graphic exhibits Descriptive Statistics that will help you convey the message impactfully. It can be accessed with Google Slides and is available in both standard screen and widescreen aspect ratios. Apart from this, you can download this well structured PowerPoint template design in different formats like PDF, JPG, and PNG. So, click the download button now to gain full access to this PPT design. Our Descriptive Statistics In Powerpoint And Google Slides Cpb are topically designed to provide an attractive backdrop to any subject. Use them to look like a presentation pro.
Ovarian Cancer Statistics In Powerpoint And Google Slides Cpb
Introducing our well designed Ovarian Cancer Statistics In Powerpoint And Google Slides Cpb. This PowerPoint design presents information on topics like Ovarian Cancer Statistics. As it is predesigned it helps boost your confidence level. It also makes you a better presenter because of its high quality content and graphics. This PPT layout can be downloaded and used in different formats like PDF, PNG, and JPG. Not only this, it is available in both Standard Screen and Widescreen aspect ratios for your convenience. Therefore, click on the download button now to persuade and impress your audience. Our Ovarian Cancer Statistics In Powerpoint And Google Slides Cpb are topically designed to provide an attractive backdrop to any subject. Use them to look like a presentation pro.

Statistical Process Control Reports In Powerpoint And Google Slides Cpb
Introducing our well designed Statistical Process Control Reports In Powerpoint And Google Slides Cpb. This PowerPoint design presents information on topics like Statistical Process Control Reports. As it is predesigned it helps boost your confidence level. It also makes you a better presenter because of its high quality content and graphics. This PPT layout can be downloaded and used in different formats like PDF, PNG, and JPG. Not only this, it is available in both Standard Screen and Widescreen aspect ratios for your convenience. Therefore, click on the download button now to persuade and impress your audience. Our Statistical Process Control Reports In Powerpoint And Google Slides Cpb are topically designed to provide an attractive backdrop to any subject. Use them to look like a presentation pro.
Best Calculators Statistics In Powerpoint And Google Slides Cpb
Introducing our well-designed Best Calculators Statistics In Powerpoint And Google Slides Cpb. This PowerPoint design presents information on topics like Best Calculators Statistics. As it is predesigned it helps boost your confidence level. It also makes you a better presenter because of its high-quality content and graphics. This PPT layout can be downloaded and used in different formats like PDF, PNG, and JPG. Not only this, it is available in both Standard Screen and Widescreen aspect ratios for your convenience. Therefore, click on the download button now to persuade and impress your audience. Our Best Calculators Statistics In Powerpoint And Google Slides Cpb are topically designed to provide an attractive backdrop to any subject. Use them to look like a presentation pro.
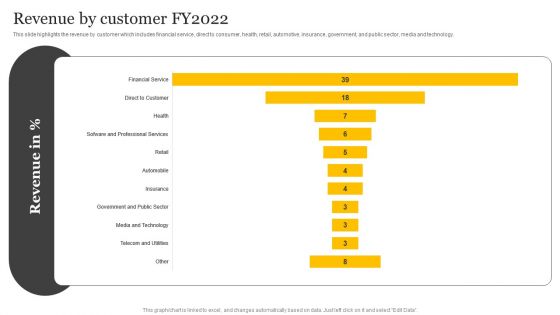
Customer Credit Reporting Company Outline Revenue By Customer FY2022 Elements PDF
This slide highlights the revenue by customer which includes financial service, direct to consumer, health, retail, automotive, insurance, government, and public sector, media and technology. Explore a selection of the finest Customer Credit Reporting Company Outline Revenue By Customer FY2022 Elements PDF here. With a plethora of professionally designed and pre made slide templates, you can quickly and easily find the right one for your upcoming presentation. You can use our Customer Credit Reporting Company Outline Revenue By Customer FY2022 Elements PDF to effectively convey your message to a wider audience. Slidegeeks has done a lot of research before preparing these presentation templates. The content can be personalized and the slides are highly editable. Grab templates today from Slidegeeks.
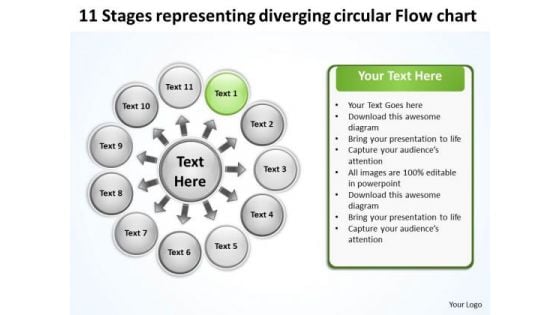
11 Stages Representing Diverging Circular Flow Chart Target Network PowerPoint Templates
We present our 11 stages representing diverging circular flow chart Target Network PowerPoint templates.Download our Arrows PowerPoint Templates because you can Enlighten them with your brilliant understanding of mental health. Use our Flow charts PowerPoint Templates because this an appropriate template to get your ideas across to your target audience. Download our Business PowerPoint Templates because this is Aesthetically designed to make a great first impression this template highlights . Use our Process and Flows PowerPoint Templates because you know the path so show the way. Present our Circle charts PowerPoint Templates because watching them will strengthen your companys sinews.Use these PowerPoint slides for presentations relating to Assess, assessment, background, benefit, business, chart, circle, company, concept, control, cost, crisis, data, diagram, drawing, explanation, finance, financial, flow, flowchart, graph, graphic, idea, identify, illustration, information, invest, investment, manage, management, model, office, organization, organization, plan, presentation, process, profit, reduce, schema, sketch, strategy, success. The prominent colors used in the PowerPoint template are Blue, Gray, White. You can be sure our 11 stages representing diverging circular flow chart Target Network PowerPoint templates are Delightful. Presenters tell us our business PowerPoint templates and PPT Slides are Wistful. We assure you our 11 stages representing diverging circular flow chart Target Network PowerPoint templates effectively help you save your valuable time. Customers tell us our business PowerPoint templates and PPT Slides are Gorgeous. Presenters tell us our 11 stages representing diverging circular flow chart Target Network PowerPoint templates are Glamorous. You can be sure our circle PowerPoint templates and PPT Slides will make the presenter successul in his career/life. Our 11 Stages Representing Diverging Circular Flow Chart Target Network PowerPoint Templates give expression to your drive. They emit the essence of your determination.
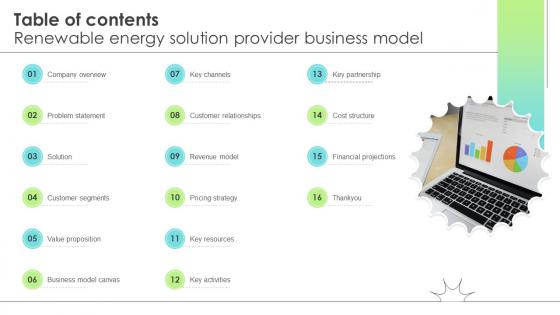
Table Of Contents Renewable Energy Solution Provider Business Model BMC SS V
If you are looking for a format to display your unique thoughts, then the professionally designed Table Of Contents Renewable Energy Solution Provider Business Model BMC SS V is the one for you. You can use it as a Google Slides template or a PowerPoint template. Incorporate impressive visuals, symbols, images, and other charts. Modify or reorganize the text boxes as you desire. Experiment with shade schemes and font pairings. Alter, share or cooperate with other people on your work. Download Table Of Contents Renewable Energy Solution Provider Business Model BMC SS V and find out how to give a successful presentation. Present a perfect display to your team and make your presentation unforgettable. Our Table Of Contents Renewable Energy Solution Provider Business Model BMC SS V are topically designed to provide an attractive backdrop to any subject. Use them to look like a presentation pro.
Pulmonary Embolism Age Statistics In Powerpoint And Google Slides Cpb
Presenting our innovatively designed set of slides titled Pulmonary Embolism Age Statistics In Powerpoint And Google Slides Cpb. This completely editable PowerPoint graphic exhibits Pulmonary Embolism Age Statistics that will help you convey the message impactfully. It can be accessed with Google Slides and is available in both standard screen and widescreen aspect ratios. Apart from this, you can download this well-structured PowerPoint template design in different formats like PDF, JPG, and PNG. So, click the download button now to gain full access to this PPT design. Our Pulmonary Embolism Age Statistics In Powerpoint And Google Slides Cpb are topically designed to provide an attractive backdrop to any subject. Use them to look like a presentation pro.
Cloud Dashboard For Tracking Project Sprints Ppt PowerPoint Presentation File Layouts PDF
The following slide depicts cloud dashboard for monitoring project sprints. It provides information about sprint blockers, resolved issues, under performers, sprint health, releases, sprint burndown, etc. If you are looking for a format to display your unique thoughts, then the professionally designed Cloud Dashboard For Tracking Project Sprints Ppt PowerPoint Presentation File Layouts PDF is the one for you. You can use it as a Google Slides template or a PowerPoint template. Incorporate impressive visuals, symbols, images, and other charts. Modify or reorganize the text boxes as you desire. Experiment with shade schemes and font pairings. Alter, share or cooperate with other people on your work. Download Cloud Dashboard For Tracking Project Sprints Ppt PowerPoint Presentation File Layouts PDF and find out how to give a successful presentation. Present a perfect display to your team and make your presentation unforgettable.
Marketing Insights Company Profile Industries Served Guidelines PDF
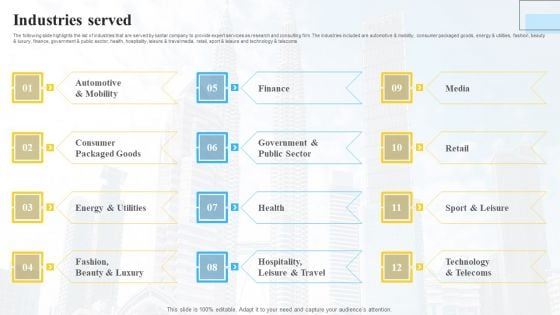
The following slide highlights the list of industries that are served by kantar company to provide expert services as research and consulting firm. The industries included are automotive and mobility, consumer packaged goods, energy and utilities, fashion, beauty and luxury, finance, government and public sector, health, hospitality, leisure and travel media, retail, sport and leisure and technology and telecoms Present like a pro with Marketing Insights Company Profile Industries Served Guidelines PDF Create beautiful presentations together with your team, using our easy to use presentation slides. Share your ideas in real time and make changes on the fly by downloading our templates. So whether you are in the office, on the go, or in a remote location, you can stay in sync with your team and present your ideas with confidence. With Slidegeeks presentation got a whole lot easier. Grab these presentations today.
Key Statistics Associated With Everything About Bitcoin PPT Presentation Fin SS V
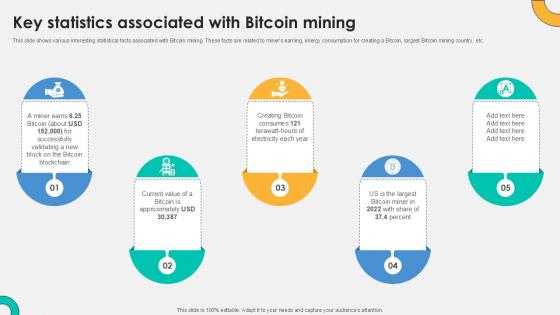
This slide shows various interesting statistical facts associated with Bitcoin mining. These facts are related to miners earning, energy consumption for creating a Bitcoin, largest Bitcoin mining country, etc. Are you in need of a template that can accommodate all of your creative concepts This one is crafted professionally and can be altered to fit any style. Use it with Google Slides or PowerPoint. Include striking photographs, symbols, depictions, and other visuals. Fill, move around, or remove text boxes as desired. Test out color palettes and font mixtures. Edit and save your work, or work with colleagues. Download Key Statistics Associated With Everything About Bitcoin PPT Presentation Fin SS V and observe how to make your presentation outstanding. Give an impeccable presentation to your group and make your presentation unforgettable. This slide shows various interesting statistical facts associated with Bitcoin mining. These facts are related to miners earning, energy consumption for creating a Bitcoin, largest Bitcoin mining country, etc.
Beginners Guide To Commercial Case Study 2 Wells Fargos Risk Diversification Strategy Fin SS V
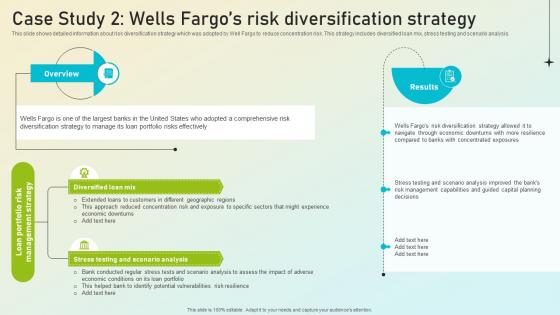
This slide shows detailed information about risk diversification strategy which was adopted by Well Fargo to reduce concentration risk. This strategy includes diversified loan mix, stress testing and scenario analysis. Are you in need of a template that can accommodate all of your creative concepts This one is crafted professionally and can be altered to fit any style. Use it with Google Slides or PowerPoint. Include striking photographs, symbols, depictions, and other visuals. Fill, move around, or remove text boxes as desired. Test out color palettes and font mixtures. Edit and save your work, or work with colleagues. Download Beginners Guide To Commercial Case Study 2 Wells Fargos Risk Diversification Strategy Fin SS V and observe how to make your presentation outstanding. Give an impeccable presentation to your group and make your presentation unforgettable. This slide shows detailed information about risk diversification strategy which was adopted by Well Fargo to reduce concentration risk. This strategy includes diversified loan mix, stress testing and scenario analysis.

Empowering The Future Statistical Graph Showcasing Smart Meter Market Growth IoT SS V
This slide showcases information about the global market size of smart meters. It includes key reasons such as government initiatives to promote energy conversation, smart city initiatives, accurate billing process, etc. The Empowering The Future Statistical Graph Showcasing Smart Meter Market Growth IoT SS V is a compilation of the most recent design trends as a series of slides. It is suitable for any subject or industry presentation, containing attractive visuals and photo spots for businesses to clearly express their messages. This template contains a variety of slides for the user to input data, such as structures to contrast two elements, bullet points, and slides for written information. Slidegeeks is prepared to create an impression. This slide showcases information about the global market size of smart meters. It includes key reasons such as government initiatives to promote energy conversation, smart city initiatives, accurate billing process, etc.
Ppt Four Colorful PowerPoint Background Puzzles Forming Circle Showing Yellow Templates
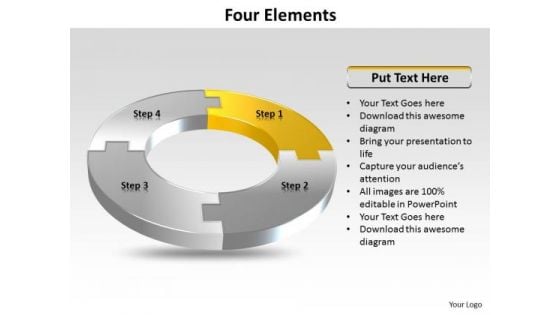
PPT four colorful powerpoint background puzzles forming circle showing yellow Templates-This PowerPoint Diagram shows the text highlighted in Yellow segment explaining the concept in circular manner. It Indicates annular, circulate, circling, dislike, indirect, oblique, orbicular, ring-shaped, round, rounded, spheroid etc.-Can be used for presentations on action, active, art, artwork, backdrop, background, beauty, body, cartoon, color, curve, dance, decoration, design, drawing, element, emotion, enjoy, enjoyment, erotic, exaltation, expression, female, girl, gladness, graphic, health, human, illustration, isolated, joy, jump, leap, life, lifestyle, love, naked, nude, ornament, people, play, sensual, sexy, shape, silhouette, slender, slim, vector, woman, young-PPT four colorful powerpoint background puzzles forming circle showing yellow Templates Show off your chops in all areas. Brandish them on our Ppt Four Colorful PowerPoint Background Puzzles Forming Circle Showing Yellow Templates.
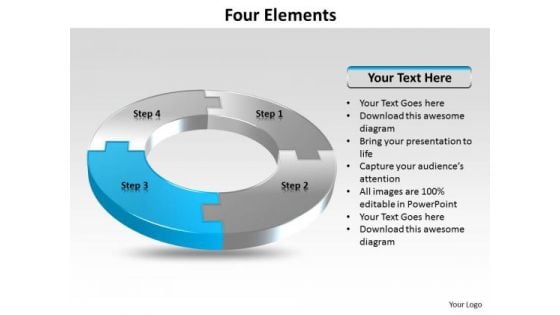
Ppt Four Colorful PowerPoint Presentations Puzzles Forming Circle Showing Blue Templates
PPT four colorful powerpoint presentations puzzles forming circle showing blue Templates-This PowerPoint Diagram shows the text highlighted in blue segment explaining the concept in circular manner. It Indicates articulation, bit, compartment, cut, division, member, moiety, parcel, piece, portion, section, sector, slice, subdivision, wedge etc.-Can be used for presentations on action, active, art, artwork, backdrop, background, beauty, body, cartoon, color, curve, dance, decoration, design, drawing, element, emotion, enjoy, enjoyment, erotic, exaltation, expression, female, girl, gladness, graphic, health, human, illustration, isolated, joy, jump, leap, life, lifestyle, love, naked, nude, ornament, people, play, sensual, sexy, shape, silhouette, slender, slim, vector, woman, young-PPT four colorful powerpoint presentations puzzles forming circle showing blue Templates Encourage creativity with our Ppt Four Colorful PowerPoint Presentations Puzzles Forming Circle Showing Blue Templates. You will come out on top.
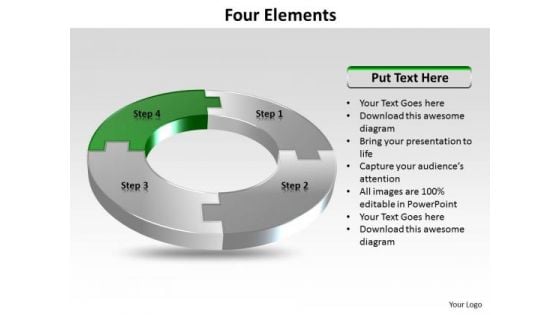
Ppt Four Colorful Puzzles Forming Circle Showing Green PowerPoint Slide Templates
PPT four colorful puzzles forming circle showing green powerpoint slide Templates-This PowerPoint Diagram shows the text highlighted in Green segment explaining the concept in circular manner. It Indicates articulation, bit, compartment, cut, division, member, moiety, indirect, oblique, orbicular, ring-shaped, round, rounded, spheroid etc. -Can be used for presentations on action, active, art, artwork, backdrop, background, beauty, body, cartoon, color, curve, dance, decoration, design, drawing, element, emotion, enjoy, enjoyment, erotic, exaltation, expression, female, girl, gladness, graphic, health, human, illustration, isolated, joy, jump, leap, life, lifestyle, love, naked, nude, ornament, people, play, sensual, sexy, shape, silhouette, slender, slim, vector, woman, young-PPT four colorful puzzles forming circle showing green powerpoint slide Templates Your exceptional thoughts need our Ppt Four Colorful Puzzles Forming Circle Showing Green PowerPoint Slide Templates. With their support you will always excel.
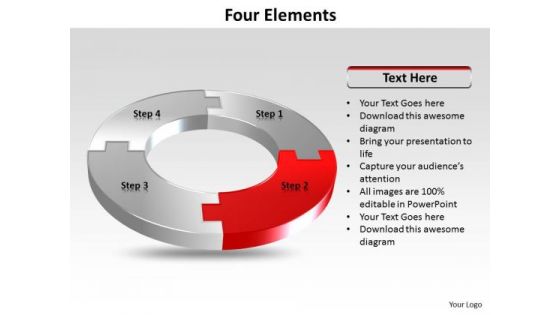
Ppt Four Colorful Puzzles Forming Circle Showing Red PowerPoint Templates
PPT four colorful puzzles forming circle showing red powerpoint templates-This PowerPoint Diagram shows the text highlighted in Red segment explaining the concept in circular manner. It Indicates articulation, bit, compartment, cut, division, member, moiety, indirect, oblique, orbicular, ring-shaped, round, rounded, spheroid etc. -Can be used for presentations on action, active, art, artwork, backdrop, background, beauty, body, cartoon, color, curve, dance, decoration, design, drawing, element, emotion, enjoy, enjoyment, erotic, exaltation, expression, female, girl, gladness, graphic, health, human, illustration, isolated, joy, jump, leap, life, lifestyle, love, naked, nude, ornament, people, play, sensual, sexy, shape, silhouette, slender, slim, vector, woman, young-PPT four colorful puzzles forming circle showing red powerpoint templates Capitalise on the benefits our Ppt Four Colorful Puzzles Forming Circle Showing Red PowerPoint Templates offer. They make the entire process a simpler one.
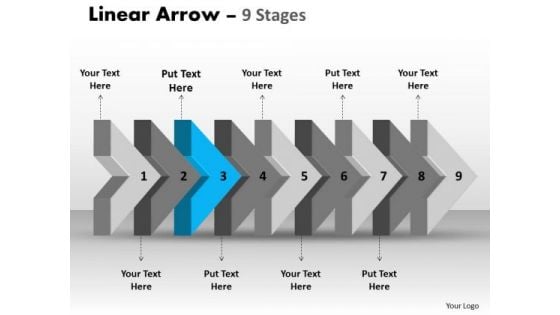
Ppt Template Beeline Flow Arrow Free Fishbone Diagram PowerPoint 4 Image
We present our PPT template beeline flow arrow free fishbone diagram PowerPoint 4 Image. Use our Symbol PowerPoint Templates because; enlighten them with your brilliant understanding of mental health. Use our Shapes PowerPoint Templates because, designed to attract the attention of your audience. Use our Signs PowerPoint Templates because, the lessons have been analyzed, studied and conclusions drawn. Use our Arrows PowerPoint Templates because, an occasion for gifting and giving. Use our Process and Flows PowerPoint Templates because, you have the moves to sway the market. Use these PowerPoint slides for presentations relating to Abstract, Age, Ancient, Antique, Arrows, Art, Artistic, Background, Colors, Decoration, Design, Dynamic, Elegant, Element, Future, Illustration, Index, Linear, Lines, Modern, Old, Paper, Pattern, Scratch, Text, Texture, Up, Vintage. The prominent colors used in the PowerPoint template are Blue, Gray, and Black Amaze yourself with our Ppt Template Beeline Flow Arrow Free Fishbone Diagram PowerPoint 4 Image. You will be astounded by what is on offer.
Procurement Automation Strategy End To End Process Tracking Dashboard On Cloud Icons PDF
This slide covers tool for analysing end to end procurement process. It includes features such as tracking real- time overall business health, checking quotation to order conversion, automated notifications and payments reminders, etc. If you are looking for a format to display your unique thoughts, then the professionally designed Procurement Automation Strategy End To End Process Tracking Dashboard On Cloud Icons PDF is the one for you. You can use it as a Google Slides template or a PowerPoint template. Incorporate impressive visuals, symbols, images, and other charts. Modify or reorganize the text boxes as you desire. Experiment with shade schemes and font pairings. Alter, share or cooperate with other people on your work. Download Procurement Automation Strategy End To End Process Tracking Dashboard On Cloud Icons PDF and find out how to give a successful presentation. Present a perfect display to your team and make your presentation unforgettable.
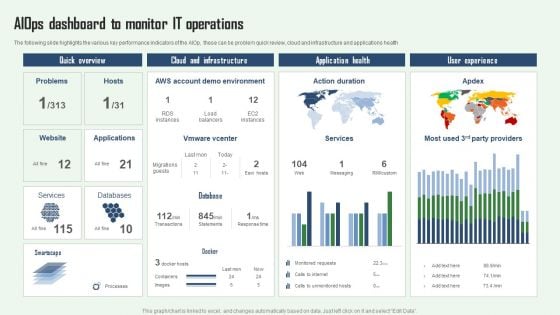
Aiops Dashboard To Monitor IT Operations Aiops Integration Summary Report Clipart PDF
The following slide highlights the various key performance indicators of the AIOp, these can be problem quick review, cloud and infrastructure and applications health. If you are looking for a format to display your unique thoughts, then the professionally designed Aiops Dashboard To Monitor IT Operations Aiops Integration Summary Report Clipart PDF is the one for you. You can use it as a Google Slides template or a PowerPoint template. Incorporate impressive visuals, symbols, images, and other charts. Modify or reorganize the text boxes as you desire. Experiment with shade schemes and font pairings. Alter, share or cooperate with other people on your work. Download Aiops Dashboard To Monitor IT Operations Aiops Integration Summary Report Clipart PDF and find out how to give a successful presentation. Present a perfect display to your team and make your presentation unforgettable.
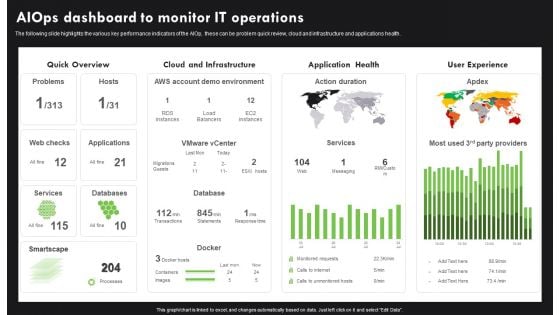
AI Deployment In IT Process Aiops Dashboard To Monitor IT Operations Infographics PDF
The following slide highlights the various key performance indicators of the AIOp, these can be problem quick review, cloud and infrastructure and applications health. If you are looking for a format to display your unique thoughts, then the professionally designed AI Deployment In IT Process Aiops Dashboard To Monitor IT Operations Infographics PDF is the one for you. You can use it as a Google Slides template or a PowerPoint template. Incorporate impressive visuals, symbols, images, and other charts. Modify or reorganize the text boxes as you desire. Experiment with shade schemes and font pairings. Alter, share or cooperate with other people on your work. Download AI Deployment In IT Process Aiops Dashboard To Monitor IT Operations Infographics PDF and find out how to give a successful presentation. Present a perfect display to your team and make your presentation unforgettable.
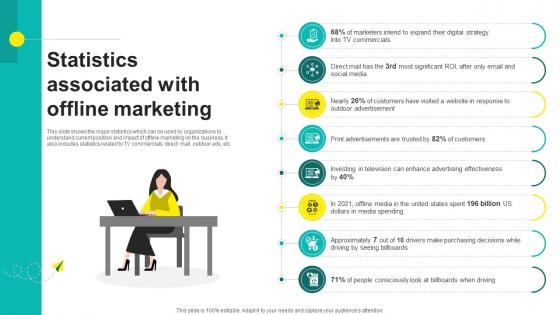
One On One Advertising Statistics Associated With Offline Marketing Strategy SS V
This slide shows the major statistics which can be used by organizations to understand current position and impact of offline marketing on the business. It also includes statistics related to TV commercials, direct mail, outdoor ads, etc. Whether you have daily or monthly meetings, a brilliant presentation is necessary. One On One Advertising Statistics Associated With Offline Marketing Strategy SS V can be your best option for delivering a presentation. Represent everything in detail using One On One Advertising Statistics Associated With Offline Marketing Strategy SS V and make yourself stand out in meetings. The template is versatile and follows a structure that will cater to your requirements. All the templates prepared by Slidegeeks are easy to download and edit. Our research experts have taken care of the corporate themes as well. So, give it a try and see the results. This slide shows the major statistics which can be used by organizations to understand current position and impact of offline marketing on the business. It also includes statistics related to TV commercials, direct mail, outdoor ads, etc.
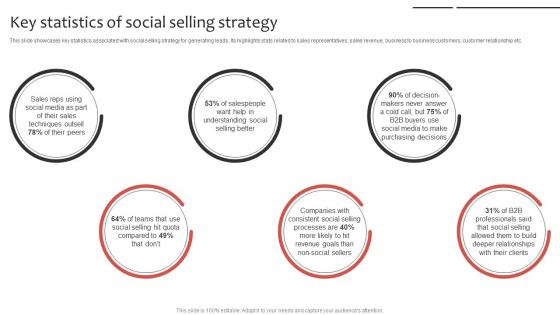
Phone Sales Strategy To Drive Key Statistics Of Social Selling Strategy SS V
This slide showcases key statistics associated with social selling strategy for generating leads. Its highlights stats related to sales representatives, sales revenue, business to business customers, customer relationship etc. This modern and well-arranged Phone Sales Strategy To Drive Key Statistics Of Social Selling Strategy SS V provides lots of creative possibilities. It is very simple to customize and edit with the Powerpoint Software. Just drag and drop your pictures into the shapes. All facets of this template can be edited with Powerpoint, no extra software is necessary. Add your own material, put your images in the places assigned for them, adjust the colors, and then you can show your slides to the world, with an animated slide included. This slide showcases key statistics associated with social selling strategy for generating leads. Its highlights stats related to sales representatives, sales revenue, business to business customers, customer relationship etc.
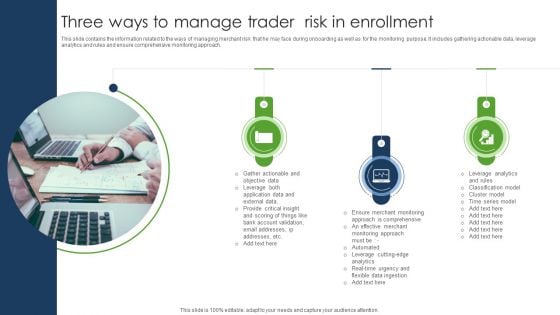
Three Ways To Manage Trader Risk In Enrollment Summary PDF
This slide contains the information related to the ways of managing merchant risk that he may face during onboarding as well as for the monitoring purpose. It includes gathering actionable data, leverage analytics and rules and ensure comprehensive monitoring approach. Presenting Three Ways To Manage Trader Risk In Enrollment Summary PDF to dispense important information. This template comprises three stages. It also presents valuable insights into the topics including Leverage Analytics, Application Data, External Data. This is a completely customizable PowerPoint theme that can be put to use immediately. So, download it and address the topic impactfully.
Energy Tracking Device Track And Monitor Baseline Ppt PowerPoint Presentation Slides Information PDF
Deliver an awe-inspiring pitch with this creative energy tracking device track and monitor baseline ppt powerpoint presentation slides information pdf bundle. Topics like measured data, baseline, control chart, production can be discussed with this completely editable template. It is available for immediate download depending on the needs and requirements of the user.
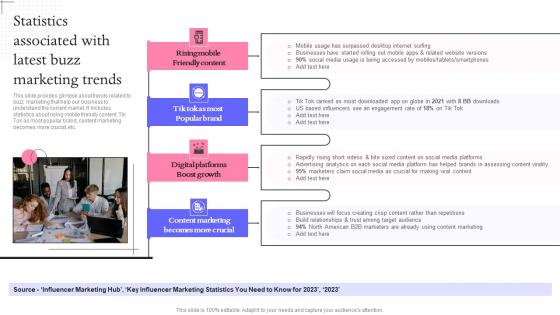
Statistics Associated With Latest Buzz Marketing Techniques For Engaging Elements Pdf
This slide provides glimpse about trends related to buzz marketing that help our business to understand the current market. It includes statistics about rising mobile friendly content, Tik Tok as most popular brand, content marketing becomes more crucial, etc. Whether you have daily or monthly meetings, a brilliant presentation is necessary. Statistics Associated With Latest Buzz Marketing Techniques For Engaging Elements Pdf can be your best option for delivering a presentation. Represent everything in detail using Statistics Associated With Latest Buzz Marketing Techniques For Engaging Elements Pdf and make yourself stand out in meetings. The template is versatile and follows a structure that will cater to your requirements. All the templates prepared by Slidegeeks are easy to download and edit. Our research experts have taken care of the corporate themes as well. So, give it a try and see the results. This slide provides glimpse about trends related to buzz marketing that help our business to understand the current market. It includes statistics about rising mobile friendly content, Tik Tok as most popular brand, content marketing becomes more crucial, etc.


 Continue with Email

 Home
Home


