Heatmap
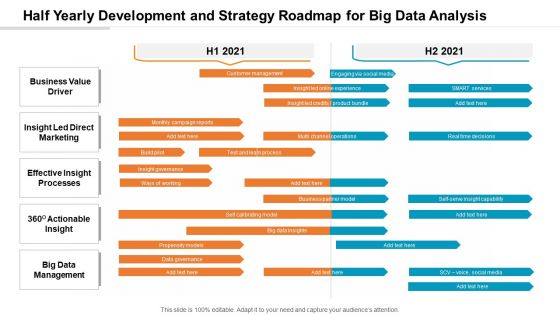
Half Yearly Development And Strategy Roadmap For Big Data Analysis Ideas
Presenting our innovatively-structured half yearly development and strategy roadmap for big data analysis ideas Template. Showcase your roadmap process in different formats like PDF, PNG, and JPG by clicking the download button below. This PPT design is available in both Standard Screen and Widescreen aspect ratios. It can also be easily personalized and presented with modified font size, font type, color, and shapes to measure your progress in a clear way.
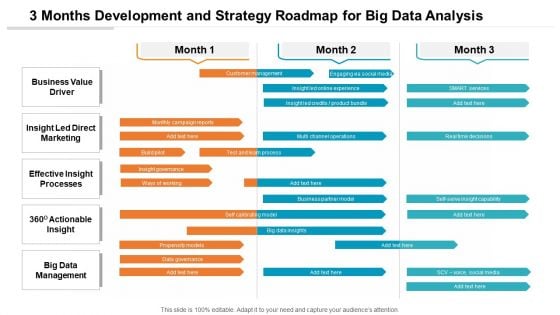
3 Months Development And Strategy Roadmap For Big Data Analysis Background
Presenting our innovatively-structured 3 months development and strategy roadmap for big data analysis background Template. Showcase your roadmap process in different formats like PDF, PNG, and JPG by clicking the download button below. This PPT design is available in both Standard Screen and Widescreen aspect ratios. It can also be easily personalized and presented with modified font size, font type, color, and shapes to measure your progress in a clear way.
3 Months Strategy Roadmap For Data Analysis Integration To Business Icons
Introducing our 3 months strategy roadmap for data analysis integration to business icons. This PPT presentation is Google Slides compatible, therefore, you can share it easily with the collaborators for measuring the progress. Also, the presentation is available in both standard screen and widescreen aspect ratios. So edit the template design by modifying the font size, font type, color, and shapes as per your requirements. As this PPT design is fully editable it can be presented in PDF, JPG and PNG formats.
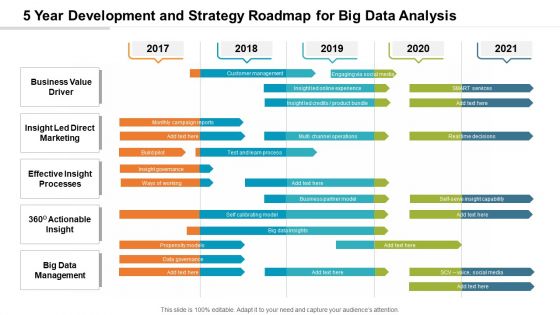
5 Year Development And Strategy Roadmap For Big Data Analysis Elements
Presenting our innovatively-structured 5 year development and strategy roadmap for big data analysis elements Template. Showcase your roadmap process in different formats like PDF, PNG, and JPG by clicking the download button below. This PPT design is available in both Standard Screen and Widescreen aspect ratios. It can also be easily personalized and presented with modified font size, font type, color, and shapes to measure your progress in a clear way.
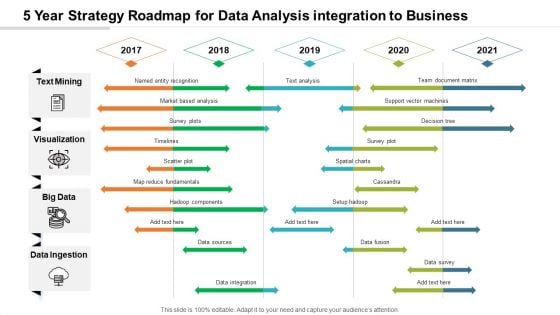
5 Year Strategy Roadmap For Data Analysis Integration To Business Pictures
Introducing our 5 year strategy roadmap for data analysis integration to business pictures. This PPT presentation is Google Slides compatible, therefore, you can share it easily with the collaborators for measuring the progress. Also, the presentation is available in both standard screen and widescreen aspect ratios. So edit the template design by modifying the font size, font type, color, and shapes as per your requirements. As this PPT design is fully editable it can be presented in PDF, JPG and PNG formats.
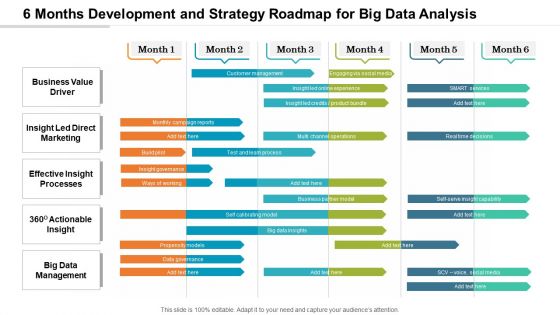
6 Months Development And Strategy Roadmap For Big Data Analysis Graphics
Presenting our innovatively-structured 6 months development and strategy roadmap for big data analysis graphics Template. Showcase your roadmap process in different formats like PDF, PNG, and JPG by clicking the download button below. This PPT design is available in both Standard Screen and Widescreen aspect ratios. It can also be easily personalized and presented with modified font size, font type, color, and shapes to measure your progress in a clear way.
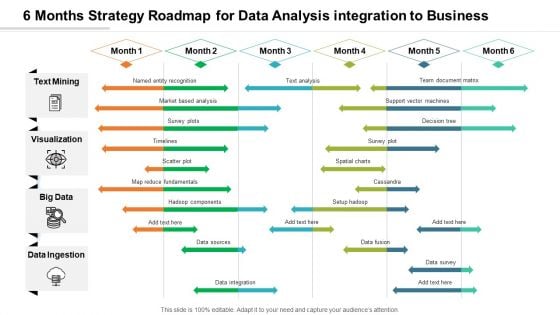
6 Months Strategy Roadmap For Data Analysis Integration To Business Diagrams
Introducing our 6 months strategy roadmap for data analysis integration to business diagrams. This PPT presentation is Google Slides compatible, therefore, you can share it easily with the collaborators for measuring the progress. Also, the presentation is available in both standard screen and widescreen aspect ratios. So edit the template design by modifying the font size, font type, color, and shapes as per your requirements. As this PPT design is fully editable it can be presented in PDF, JPG and PNG formats.
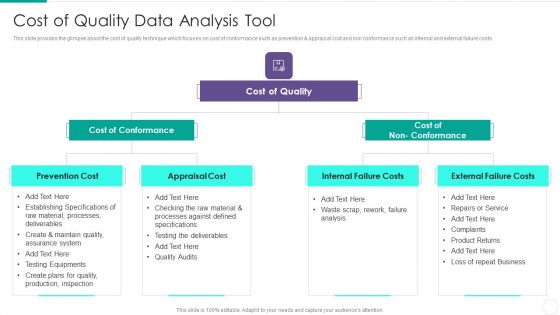
Quantitative Risk Assessment Cost Of Quality Data Analysis Tool Graphics PDF
Presenting Quantitative Risk Assessment Cost Of Quality Data Analysis Tool Graphics PDF to provide visual cues and insights. Share and navigate important information on three stages that need your due attention. This template can be used to pitch topics like Cost Of Conformance, Cost Of Quality, Internal Failure Costs, External Failure Costs, Appraisal Cost. In addtion, this PPT design contains high resolution images, graphics, etc, that are easily editable and available for immediate download.
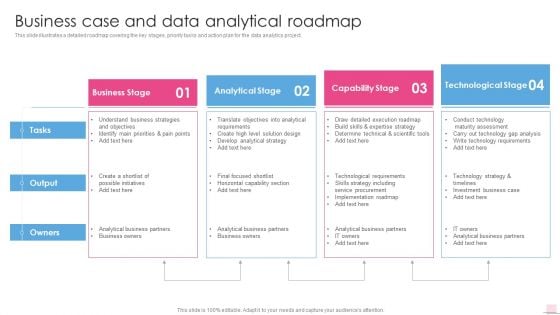
Business Case And Data Analytical Roadmap Business Analysis Modification Toolkit Structure PDF
Presenting Business Case And Data Analytical Roadmap Business Analysis Modification Toolkit Structure PDF to provide visual cues and insights. Share and navigate important information on four stages that need your due attention. This template can be used to pitch topics like Understand Business, Possible Initiatives, Business Partners. In addtion, this PPT design contains high resolution images, graphics, etc, that are easily editable and available for immediate download.
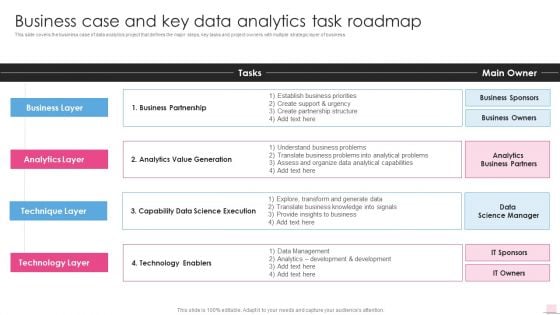
Business Case And Key Data Analytics Task Roadmap Business Analysis Modification Toolkit Information PDF
This is a Business Case And Key Data Analytics Task Roadmap Business Analysis Modification Toolkit Information PDF template with various stages. Focus and dispense information on four stages using this creative set, that comes with editable features. It contains large content boxes to add your information on topics like Business Partners, Business Sponsors, Business Owners. You can also showcase facts, figures, and other relevant content using this PPT layout. Grab it now.
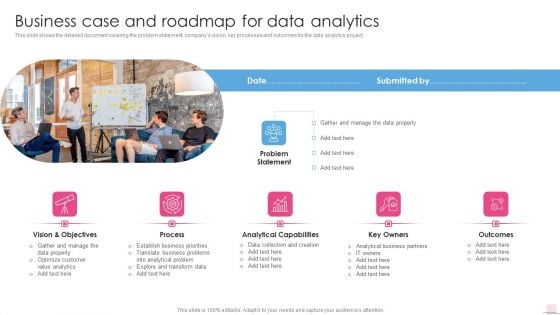
Business Case And Roadmap For Data Analytics Business Analysis Modification Toolkit Portrait PDF
Presenting Business Case And Roadmap For Data Analytics Business Analysis Modification Toolkit Portrait PDF to provide visual cues and insights. Share and navigate important information on five stages that need your due attention. This template can be used to pitch topics like Vision Objectives, Analytical Capabilities, Business Partners. In addtion, this PPT design contains high resolution images, graphics, etc, that are easily editable and available for immediate download.
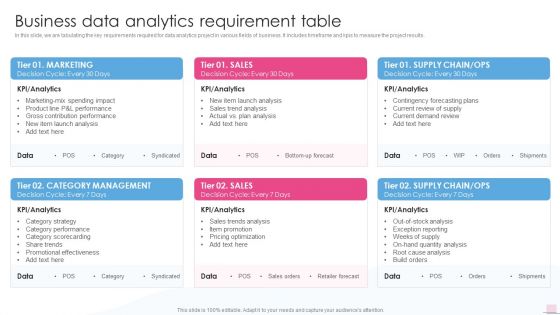
Business Data Analytics Requirement Table Business Analysis Modification Toolkit Rules PDF
This is a Business Data Analytics Requirement Table Business Analysis Modification Toolkit Rules PDF template with various stages. Focus and dispense information on six stages using this creative set, that comes with editable features. It contains large content boxes to add your information on topics like Contribution Performance, Category Performance, Category Scorecarding. You can also showcase facts, figures, and other relevant content using this PPT layout. Grab it now.
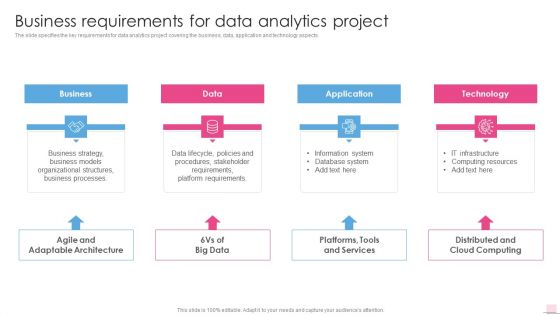
Business Requirements For Data Analytics Project Business Analysis Modification Toolkit Rules PDF
Presenting Business Requirements For Data Analytics Project Business Analysis Modification Toolkit Rules PDF to provide visual cues and insights. Share and navigate important information on four stages that need your due attention. This template can be used to pitch topics like Organizational Structures, Platform Requirements, Stakeholder Requirements. In addtion, this PPT design contains high resolution images, graphics, etc, that are easily editable and available for immediate download.
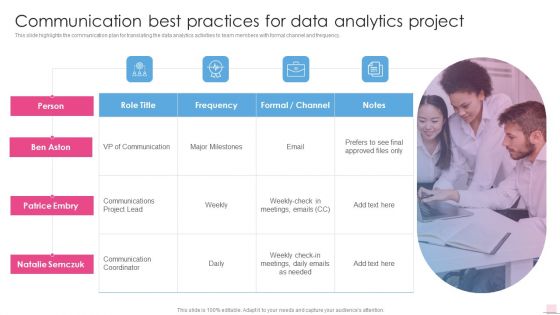
Communication Best Practices For Data Analytics Project Business Analysis Modification Toolkit Download PDF
This is a Communication Best Practices For Data Analytics Project Business Analysis Modification Toolkit Download PDF template with various stages. Focus and dispense information on one stage using this creative set, that comes with editable features. It contains large content boxes to add your information on topics like Communication Coordinator, Communications Project, Natalie Semczuk. You can also showcase facts, figures, and other relevant content using this PPT layout. Grab it now.
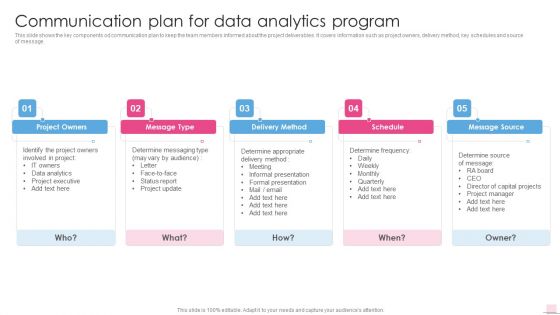
Communication Plan For Data Analytics Program Business Analysis Modification Toolkit Formats PDF
Presenting Communication Plan For Data Analytics Program Business Analysis Modification Toolkit Formats PDF to provide visual cues and insights. Share and navigate important information on five stages that need your due attention. This template can be used to pitch topics like Determine Messaging, Informal Presentation, Formal Presentation. In addtion, this PPT design contains high resolution images, graphics, etc, that are easily editable and available for immediate download.
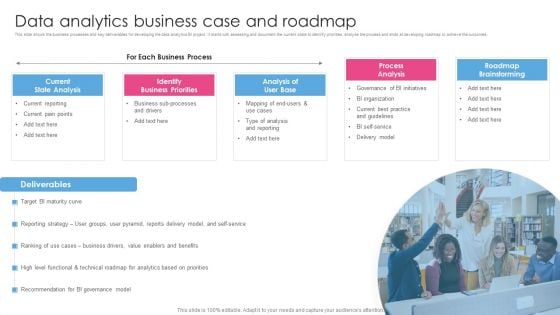
Data Analytics Business Case And Roadmap Business Analysis Modification Toolkit Diagrams PDF
Presenting Data Analytics Business Case And Roadmap Business Analysis Modification Toolkit Diagrams PDF to provide visual cues and insights. Share and navigate important information on one stage that need your due attention. This template can be used to pitch topics like Identify Business, Governance Initiatives, Governance Model. In addtion, this PPT design contains high resolution images, graphics, etc, that are easily editable and available for immediate download.
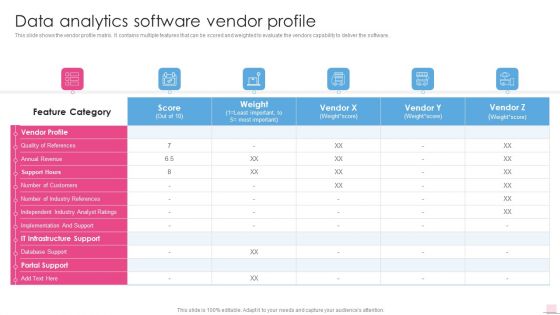
Data Analytics Software Vendor Profile Business Analysis Modification Toolkit Diagrams PDF
This slide shows the vendor profile matrix. It contains multiple features that can be scored and weighted to evaluate the vendors capability to deliver the software.Deliver an awe inspiring pitch with this creative Data Analytics Software Vendor Profile Business Analysis Modification Toolkit Diagrams PDF bundle. Topics like Independent Industry, Implementation Support, Infrastructure Support can be discussed with this completely editable template. It is available for immediate download depending on the needs and requirements of the user.
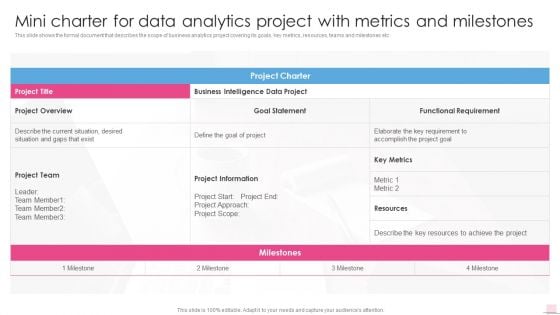
Mini Charter For Data Analytics Project With Metrics Business Analysis Modification Toolkit Infographics PDF
This slide shows the formal document that describes the scope of business analytics project covering its goals, key metrics, resources, teams and milestones etc.Deliver and pitch your topic in the best possible manner with this Mini Charter For Data Analytics Project With Metrics Business Analysis Modification Toolkit Infographics PDF. Use them to share invaluable insights on Business Intelligence, Functional Requirement, Project Information and impress your audience. This template can be altered and modified as per your expectations. So, grab it now.
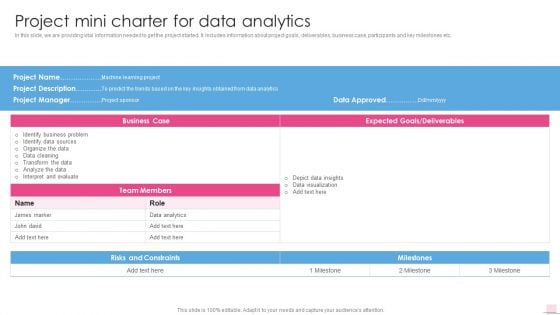
Project Mini Charter For Data Analytics Business Analysis Modification Toolkit Designs PDF
In this slide, we are providing vital information needed to get the project started. It includes information about project goals, deliverables, business case, participants and key milestones etc.Deliver an awe inspiring pitch with this creative Project Mini Charter For Data Analytics Business Analysis Modification Toolkit Designs PDF bundle. Topics like Identify Business, Team Members, Risks Constraints can be discussed with this completely editable template. It is available for immediate download depending on the needs and requirements of the user.
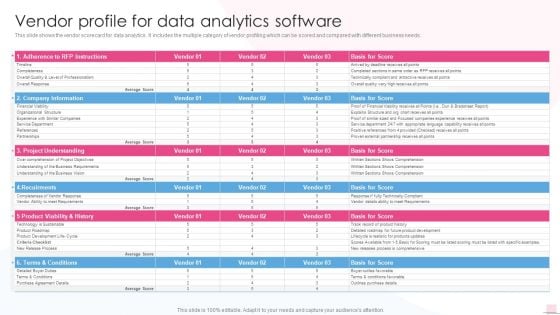
Vendor Profile For Data Analytics Software Business Analysis Modification Toolkit Rules PDF
This slide represents the list of vendors along with accompanying information including the key features, pros and cons of each vendor software.Deliver and pitch your topic in the best possible manner with this Vendor Profile For Data Analytics Software Business Analysis Modification Toolkit Rules PDF. Use them to share invaluable insights on Company Information, Terms Conditions, process comprehensive and impress your audience. This template can be altered and modified as per your expectations. So, grab it now.
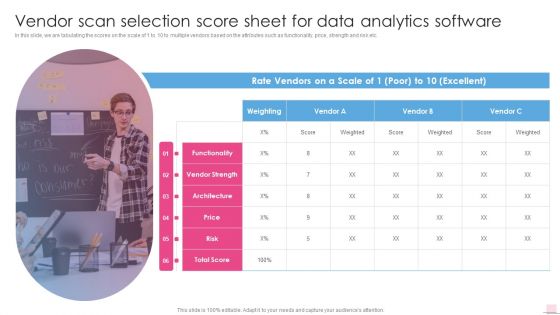
Vendor Scan Selection Score Sheet For Data Analytics Software Business Analysis Modification Toolkit Mockup PDF
This is a Vendor Scan Selection Score Sheet For Data Analytics Software Business Analysis Modification Toolkit Mockup PDF template with various stages. Focus and dispense information on one stage using this creative set, that comes with editable features. It contains large content boxes to add your information on topics like Vendor Strength, Architecture, Excellent. You can also showcase facts, figures, and other relevant content using this PPT layout. Grab it now.
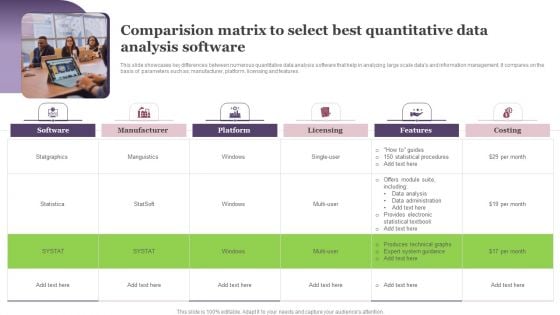
Comparision Matrix To Select Best Quantitative Data Analysis Software Download PDF
Persuade your audience using this Comparision Matrix To Select Best Quantitative Data Analysis Software Download PDF. This PPT design covers six stages, thus making it a great tool to use. It also caters to a variety of topics including Manufacturer, Platform, Licensing, Features, Costing. Download this PPT design now to present a convincing pitch that not only emphasizes the topic but also showcases your presentation skills.
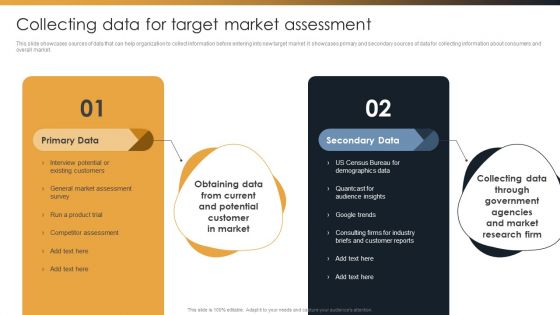
Target Customer Analysis Collecting Data For Target Market Assessment Summary PDF
Slidegeeks is one of the best resources for PowerPoint templates. You can download easily and regulate Target Customer Analysis Collecting Data For Target Market Assessment Summary PDF for your personal presentations from our wonderful collection. A few clicks is all it takes to discover and get the most relevant and appropriate templates. Use our Templates to add a unique zing and appeal to your presentation and meetings. All the slides are easy to edit and you can use them even for advertisement purposes.
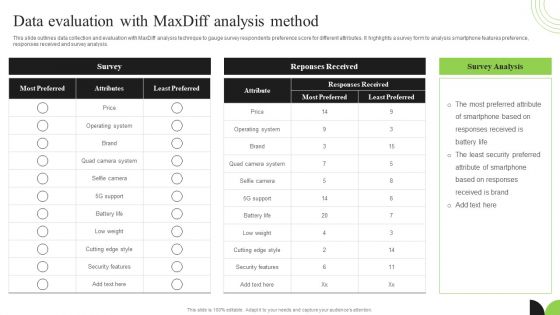
Guidebook For Executing Business Market Intelligence Data Evaluation With Maxdiff Analysis Method Designs PDF
Make sure to capture your audiences attention in your business displays with our gratis customizable Guidebook For Executing Business Market Intelligence Data Evaluation With Maxdiff Analysis Method Designs PDF. These are great for business strategies, office conferences, capital raising or task suggestions. If you desire to acquire more customers for your tech business and ensure they stay satisfied, create your own sales presentation with these plain slides.
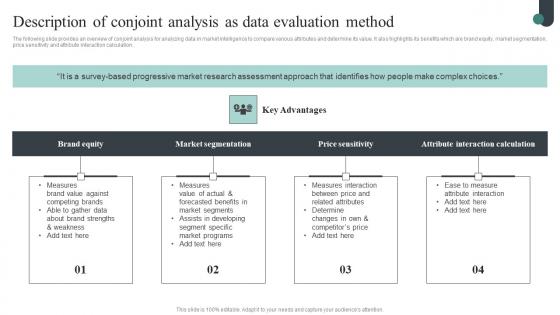
Competitive Intelligence Guide To Determine Market Description Of Conjoint Analysis As Data Designs Pdf
The following slide provides an overview of conjoint analysis for analyzing data in market intelligence to compare various attributes and determine its value. It also highlights its benefits which are brand equity, market segmentation, price sensitivity and attribute interaction calculation. Present like a pro with Competitive Intelligence Guide To Determine Market Description Of Conjoint Analysis As Data Designs Pdf Create beautiful presentations together with your team, using our easy-to-use presentation slides. Share your ideas in real-time and make changes on the fly by downloading our templates. So whether you are in the office, on the go, or in a remote location, you can stay in sync with your team and present your ideas with confidence. With Slidegeeks presentation got a whole lot easier. Grab these presentations today. The following slide provides an overview of conjoint analysis for analyzing data in market intelligence to compare various attributes and determine its value. It also highlights its benefits which are brand equity, market segmentation, price sensitivity and attribute interaction calculation.

Information Analysis And BI Playbook The Escalating Value Of Data And Analytics Download PDF
This template covers the facts about bigdata, business intelligence and data analytics. It also depicts that enterprise data and analytics solutions will drive growth and revenue, when optimized for different businesses. Slidegeeks is here to make your presentations a breeze with Information Analysis And BI Playbook The Escalating Value Of Data And Analytics Download PDF With our easy to use and customizable templates, you can focus on delivering your ideas rather than worrying about formatting. With a variety of designs to choose from, you are sure to find one that suits your needs. And with animations and unique photos, illustrations, and fonts, you can make your presentation pop. So whether you are giving a sales pitch or presenting to the board, make sure to check out Slidegeeks first.
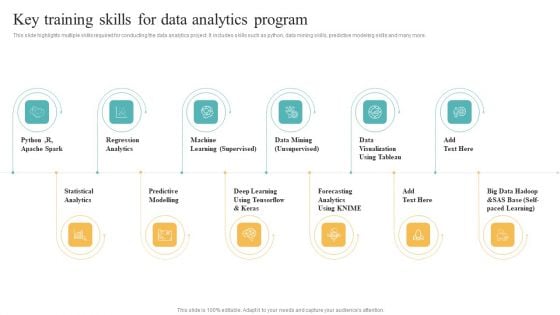
Transformation Toolkit Competitive Intelligence Information Analysis Key Training Skills For Data Analytics Program Structure PDF
This slide highlights multiple skills required for conducting the data analytics project. It includes skills such as python, data mining skills, predictive modeling skills and many more. Retrieve professionally designed Transformation Toolkit Competitive Intelligence Information Analysis Key Training Skills For Data Analytics Program Structure PDF to effectively convey your message and captivate your listeners. Save time by selecting pre made slideshows that are appropriate for various topics, from business to educational purposes. These themes come in many different styles, from creative to corporate, and all of them are easily adjustable and can be edited quickly. Access them as PowerPoint templates or as Google Slides themes. You do not have to go on a hunt for the perfect presentation because Slidegeeks got you covered from everywhere.
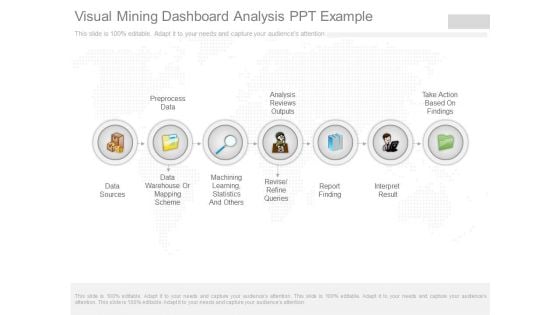
Visual Mining Dashboard Analysis Ppt Example
This is a visual mining dashboard analysis ppt example. This is a seven stage process. The stages in this process are data sources, preprocess data, data warehouse or mapping scheme, machining learning, statistics and others, analysis reviews outputs, revise refine queries, report finding, interpret result, take action based on findings.
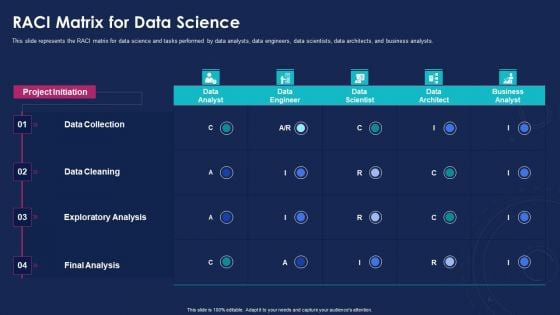
Data Analytics IT RACI Matrix For Data Science Ppt File Maker PDF
This slide represents the RACI matrix for data science and tasks performed by data analysts, data engineers, data scientists, data architects, and business analysts. Deliver and pitch your topic in the best possible manner with this data analytics it raci matrix for data science ppt file maker pdf. Use them to share invaluable insights on data collection, data cleaning, exploratory analysis, final analysis and impress your audience. This template can be altered and modified as per your expectations. So, grab it now.
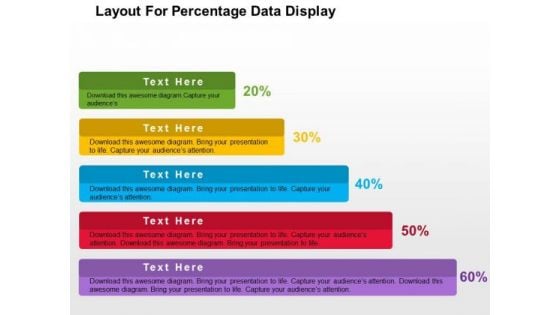
Layout For Precentage Data Display PowerPoint Template
Growth analysis for business can be defined with this business diagram. This slide depicts text boxes in increasing flow. Present your views using this innovative slide and be assured of leaving a lasting impression
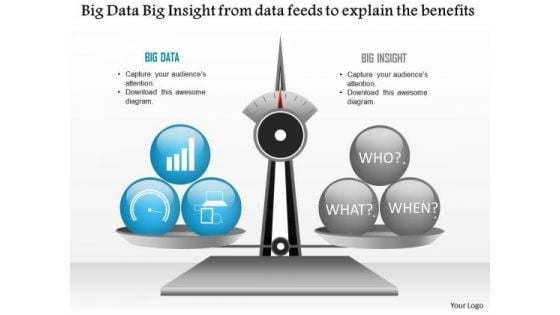
Business Diagram Big Data Big Insight From Data Feeds To Explain The Benefits Ppt Slide
Explain the benefits of big data analysis and data feeds with this technology diagram. This slide contains the graphic of scale with big data and big insight. Use this slide your data information and measurement related presentations.
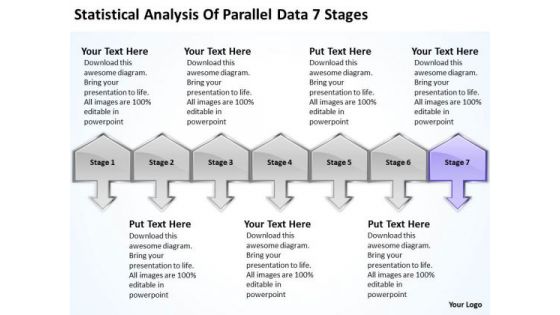
Statistical Analysis Of Parallel Data 7 Stages Ppt Help With Business Plan PowerPoint Slides
We present our statistical analysis of parallel data 7 stages ppt help with business plan PowerPoint Slides.Download and present our Communication PowerPoint Templates because You have gained great respect for your brilliant ideas. Use our PowerPoint Templates and Slides to strengthen and enhance your reputation. Present our Business PowerPoint Templates because you have developed a vision of where you want to be a few years from now. Use our Arrows PowerPoint Templates because this business powerpoint template helps expound on the logic of your detailed thought process to take your company forward. Download our Success PowerPoint Templates because iT outlines the entire thought process for the benefit of others. Tell it to the world with your characteristic aplomb. Use our Symbol PowerPoint Templates because this template helps you to bring your audiences to the table.Use these PowerPoint slides for presentations relating to 3d, Achievement, Action, Aim, Arrows, Black, Business, Color, Communication, Competition, Concept, Connection, Creative, Design, Different, Direction, Element, First, Forward, Graph, Graphic, Group, Growth, Higher, Icon, Illustration, Image, Isolated, Leader, Leadership, Line, Menu, Motion, Orange, Progress, Series, Seven, Sign, Slew, Solution, Success, Swerve, Symbol, Team, Teamwork, Turn, Up. The prominent colors used in the PowerPoint template are Purple, Gray, Black. Customers tell us our statistical analysis of parallel data 7 stages ppt help with business plan PowerPoint Slides will generate and maintain the level of interest you desire. They will create the impression you want to imprint on your audience. Use our Arrows PowerPoint templates and PPT Slides are Magnificent. PowerPoint presentation experts tell us our statistical analysis of parallel data 7 stages ppt help with business plan PowerPoint Slides will help them to explain complicated concepts. People tell us our Action PowerPoint templates and PPT Slides will make the presenter successul in his career/life. We assure you our statistical analysis of parallel data 7 stages ppt help with business plan PowerPoint Slides are Precious. People tell us our Aim PowerPoint templates and PPT Slides are Pleasant. Many a popular belief turn out fallacious. Establish the factual position with our Statistical Analysis Of Parallel Data 7 Stages Ppt Help With Business Plan PowerPoint Slides.
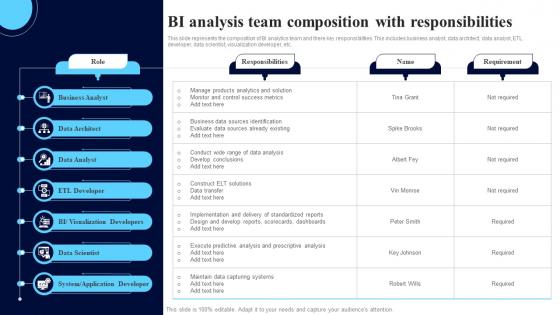
BI Analysis Team Composition With ResponsiBIlities Slides Pdf
This slide represents the composition of BI analytics team and there key responsibilities. This includes business analyst, data architect, data analyst, ETL developer, data scientist, visualization developer, etc. Pitch your topic with ease and precision using this BI Analysis Team Composition With ResponsiBIlities Slides Pdf. This layout presents information on Business Analyst, Data Architect, Data Analyst. It is also available for immediate download and adjustment. So, changes can be made in the color, design, graphics or any other component to create a unique layout. This slide represents the composition of BI analytics team and there key responsibilities. This includes business analyst, data architect, data analyst, ETL developer, data scientist, visualization developer, etc.
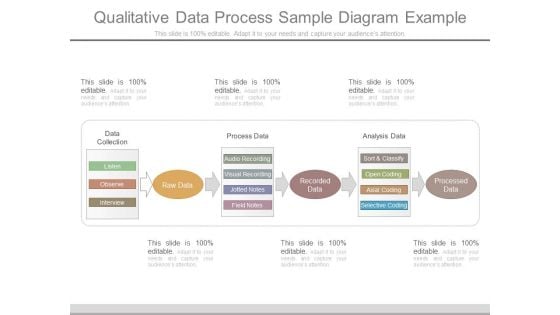
Qualitative Data Process Sample Diagram Example
This is a qualitative data process sample diagram example. This is a three stage process. The stages in this process are data collection, process data, analysis data, listen, observe, interview, audio recording, visual recording, jotted notes, field notes, sort and classify, open coding, axial coding, selective coding, processed data.
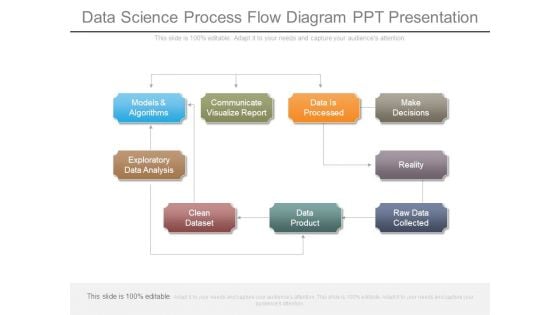
Data Science Process Flow Diagram Ppt Presentation
This is a data science process flow diagram ppt presentation. This is a nine stage process. The stages in this process are models and algorithms, communicate visualize report, data is processed, make decisions, exploratory data analysis, clean dataset, data product, raw data collected, reality.
Annual Financial Data Insights Dashboard Icon Introduction PDF
Showcasing this set of slides titled Annual Financial Data Insights Dashboard Icon Introduction PDF. The topics addressed in these templates are Annual Financial, Data Insights, Dashboard. All the content presented in this PPT design is completely editable. Download it and make adjustments in color, background, font etc. as per your unique business setting.
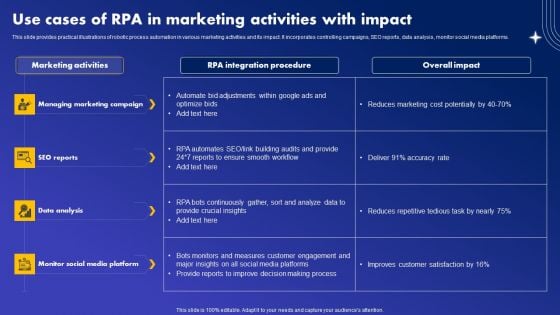
Use Cases Of RPA In Marketing Activities With Impact Clipart PDF
This slide provides practical illustrations of robotic process automation in various marketing activities and its impact. It incorporates controlling campaigns, SEO reports, data analysis, monitor social media platforms. Crafting an eye-catching presentation has never been more straightforward. Let your presentation shine with this tasteful yet straightforward Use Cases Of RPA In Marketing Activities With Impact Clipart PDF template. It offers a minimalistic and classy look that is great for making a statement. The colors have been employed intelligently to add a bit of playfulness while still remaining professional. Construct the ideal Use Cases Of RPA In Marketing Activities With Impact Clipart PDF that effortlessly grabs the attention of your audience Begin now and be certain to wow your customers
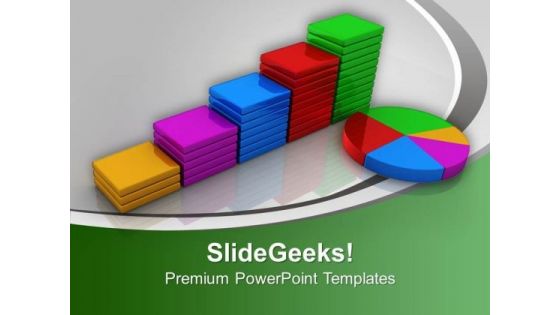
Statistical Data Analysis In Marketing PowerPoint Templates Ppt Backgrounds For Slides 0313
We present our Statistical Data Analysis In Marketing PowerPoint Templates PPT Backgrounds For Slides 0313.Download our Marketing PowerPoint Templates because Our PowerPoint Templates and Slides will let you Clearly mark the path for others to follow. Download our Success PowerPoint Templates because You have gained great respect for your brilliant ideas. Use our PowerPoint Templates and Slides to strengthen and enhance your reputation. Use our Finance PowerPoint Templates because Our PowerPoint Templates and Slides has conjured up a web of all you need with the help of our great team. Use them to string together your glistening ideas. Download our Business PowerPoint Templates because Our PowerPoint Templates and Slides help you pinpoint your timelines. Highlight the reasons for your deadlines with their use. Use our Shapes PowerPoint Templates because Our PowerPoint Templates and Slides ensures Effective communication. They help you put across your views with precision and clarity.Use these PowerPoint slides for presentations relating to The diagramme which shows the statistical data, marketing, success, business, shapes, finance. The prominent colors used in the PowerPoint template are Green, Red, Yellow. Your thoughts will come on fast and furious. Boost your speed of thought with our Statistical Data Analysis In Marketing PowerPoint Templates Ppt Backgrounds For Slides 0313.
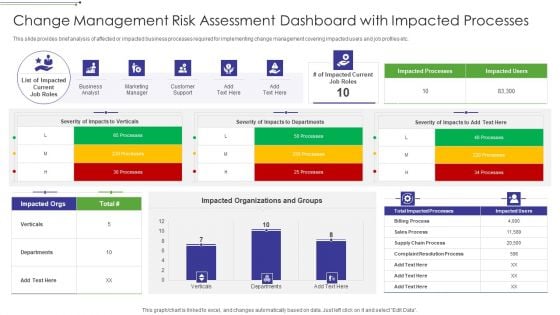
Change Management Risk Assessment Dashboard With Impacted Processes Graphics PDF
This slide provides brief analysis of affected or impacted business processes required for implementing change management covering impacted users and job profiles etc.Showcasing this set of slides titled Change Management Risk Assessment Dashboard With Impacted Processes Graphics PDF The topics addressed in these templates are Impacted Organizations And Groups, Business Analyst, Marketing Manager All the content presented in this PPT design is completely editable. Download it and make adjustments in color, background, font etc. as per your unique business setting.
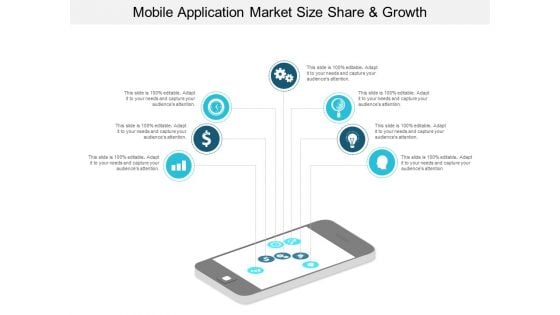
Mobile Application Market Size Share And Growth Ppt PowerPoint Presentation Outline Rules
This is a mobile application market size share and growth ppt powerpoint presentation outline rules. This is a seven stage process. The stages in this process are mobile analytics, mobile tracking, mobile web analytics.
Mobile Growth Trends And Analysis Ppt PowerPoint Presentation File Graphics
This is a mobile growth trends and analysis ppt powerpoint presentation file graphics. This is a two stage process. The stages in this process are mobile analytics, mobile tracking, mobile web analytics.
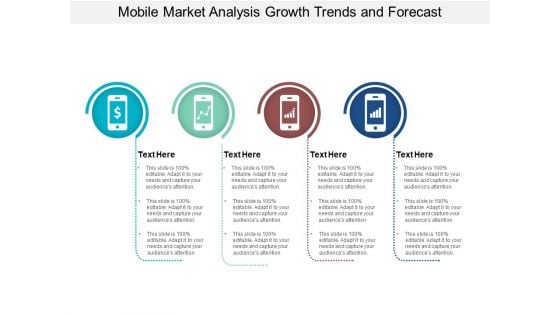
Mobile Market Analysis Growth Trends And Forecast Ppt PowerPoint Presentation Styles Outline
This is a mobile market analysis growth trends and forecast ppt powerpoint presentation styles outline. This is a three stage process. The stages in this process are mobile analytics, mobile tracking, mobile web analytics.
Mobile Market Research And Digital Trends Ppt PowerPoint Presentation Outline Ideas
This is a mobile market research and digital trends ppt powerpoint presentation outline ideas. This is a three stage process. The stages in this process are mobile analytics, mobile tracking, mobile web analytics.
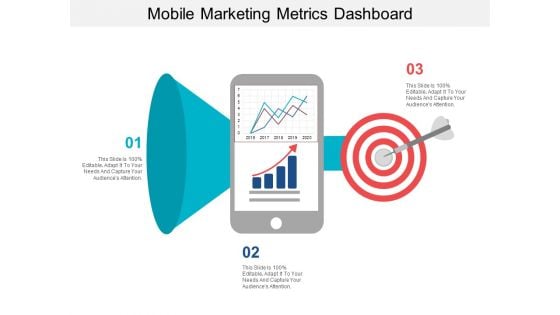
Mobile Marketing Metrics Dashboard Ppt PowerPoint Presentation Show Gridlines
This is a mobile marketing metrics dashboard ppt powerpoint presentation show gridlines. This is a three stage process. The stages in this process are mobile analytics, mobile tracking, mobile web analytics.

Mobile Marketing Trends Analysis Ppt PowerPoint Presentation Professional Example
This is a mobile marketing trends analysis ppt powerpoint presentation professional example. This is a four stage process. The stages in this process are mobile analytics, mobile tracking, mobile web analytics.
Mobile Statistics Vector Icon Ppt PowerPoint Presentation Ideas Show
This is a mobile statistics vector icon ppt powerpoint presentation ideas show. This is a two stage process. The stages in this process are mobile analytics, mobile tracking, mobile web analytics.
Smartphone Growth Trends Analysis Vector Ppt PowerPoint Presentation Summary Master Slide
This is a smartphone growth trends analysis vector ppt powerpoint presentation summary master slide. This is a four stage process. The stages in this process are mobile analytics, mobile tracking, mobile web analytics.
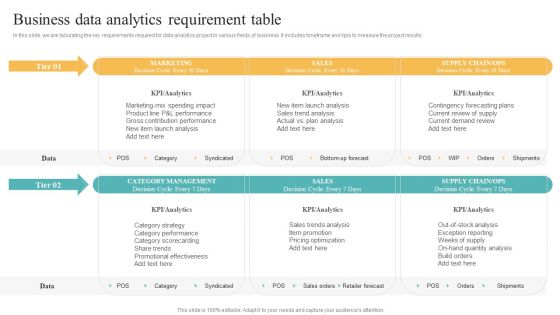
Transformation Toolkit Competitive Intelligence Information Analysis Business Data Analytics Requirement Table Elements PDF
In this slide, we are tabulating the key requirements required for data analytics project in various fields of business. It includes timeframe and kpis to measure the project results. Slidegeeks is here to make your presentations a breeze with Transformation Toolkit Competitive Intelligence Information Analysis Business Data Analytics Requirement Table Elements PDF With our easy to use and customizable templates, you can focus on delivering your ideas rather than worrying about formatting. With a variety of designs to choose from, you are sure to find one that suits your needs. And with animations and unique photos, illustrations, and fonts, you can make your presentation pop. So whether you are giving a sales pitch or presenting to the board, make sure to check out Slidegeeks first.
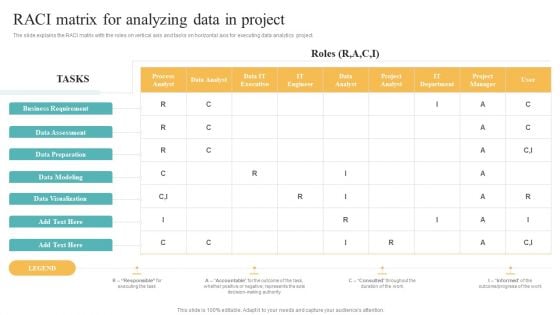
Transformation Toolkit Competitive Intelligence Information Analysis RACI Matrix For Analyzing Data In Project Demonstration PDF
The slide explains the RACI matrix with the roles on vertical axis and tasks on horizontal axis for executing data analytics project. This Transformation Toolkit Competitive Intelligence Information Analysis RACI Matrix For Analyzing Data In Project Demonstration PDF from Slidegeeks makes it easy to present information on your topic with precision. It provides customization options, so you can make changes to the colors, design, graphics, or any other component to create a unique layout. It is also available for immediate download, so you can begin using it right away. Slidegeeks has done good research to ensure that you have everything you need to make your presentation stand out. Make a name out there for a brilliant performance.
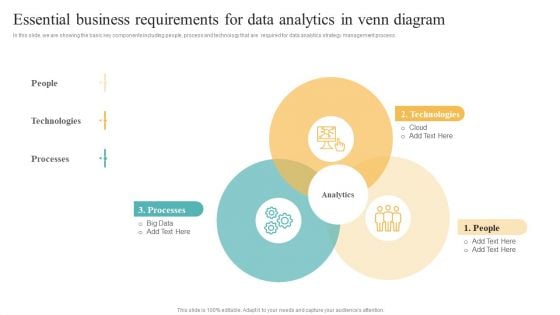
Transformation Toolkit Competitive Intelligence Information Analysis Essential Business Requirements For Data Analytics Summary PDF
In this slide, we are showing the basic key components including people, process and technology that are required for data analytics strategy management process. Present like a pro with Transformation Toolkit Competitive Intelligence Information Analysis Essential Business Requirements For Data Analytics Summary PDF Create beautiful presentations together with your team, using our easy to use presentation slides. Share your ideas in real time and make changes on the fly by downloading our templates. So whether you are in the office, on the go, or in a remote location, you can stay in sync with your team and present your ideas with confidence. With Slidegeeks presentation got a whole lot easier. Grab these presentations today.
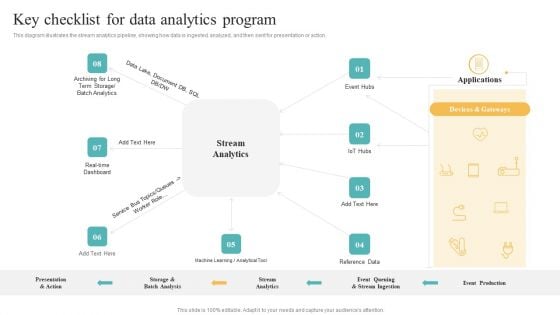
Transformation Toolkit Competitive Intelligence Information Analysis Key Checklist For Data Analytics Program Action Guidelines PDF
This diagram illustrates the stream analytics pipeline, showing how data is ingested, analyzed, and then sent for presentation or action. Slidegeeks is here to make your presentations a breeze with Transformation Toolkit Competitive Intelligence Information Analysis Key Checklist For Data Analytics Program Action Guidelines PDF With our easy to use and customizable templates, you can focus on delivering your ideas rather than worrying about formatting. With a variety of designs to choose from, you are sure to find one that suits your needs. And with animations and unique photos, illustrations, and fonts, you can make your presentation pop. So whether you are giving a sales pitch or presenting to the board, make sure to check out Slidegeeks first.
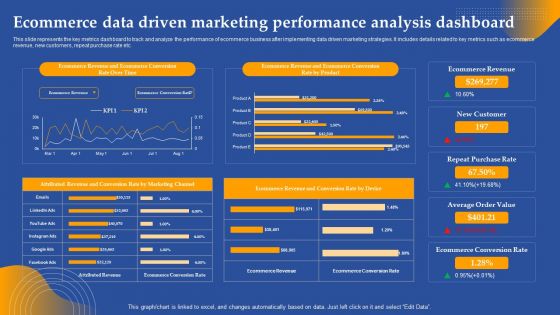
Ecommerce Data Driven Marketing Performance Analysis Dashboard Ppt Visual Aids Styles PDF
This slide represents the key metrics dashboard to track and analyze the performance of ecommerce business after implementing data driven marketing strategies. It includes details related to key metrics such as ecommerce revenue, new customers, repeat purchase rate etc. Slidegeeks has constructed Ecommerce Data Driven Marketing Performance Analysis Dashboard Ppt Visual Aids Styles PDF after conducting extensive research and examination. These presentation templates are constantly being generated and modified based on user preferences and critiques from editors. Here, you will find the most attractive templates for a range of purposes while taking into account ratings and remarks from users regarding the content. This is an excellent jumping off point to explore our content and will give new users an insight into our top notch PowerPoint Templates.
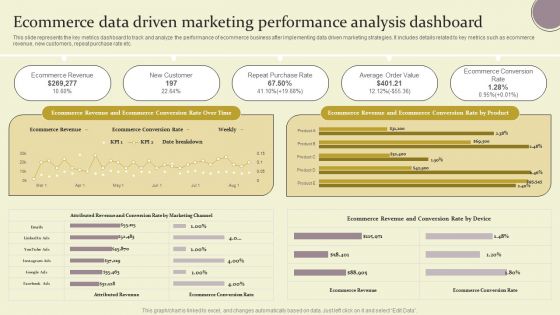
Ecommerce Data Driven Marketing Performance Analysis Dashboard Ppt Pictures Demonstration PDF
This slide represents the key metrics dashboard to track and analyze the performance of ecommerce business after implementing data driven marketing strategies. It includes details related to key metrics such as ecommerce revenue, new customers, repeat purchase rate etc. Slidegeeks has constructed Ecommerce Data Driven Marketing Performance Analysis Dashboard Ppt Pictures Demonstration PDF after conducting extensive research and examination. These presentation templates are constantly being generated and modified based on user preferences and critiques from editors. Here, you will find the most attractive templates for a range of purposes while taking into account ratings and remarks from users regarding the content. This is an excellent jumping off point to explore our content and will give new users an insight into our top notch PowerPoint Templates.
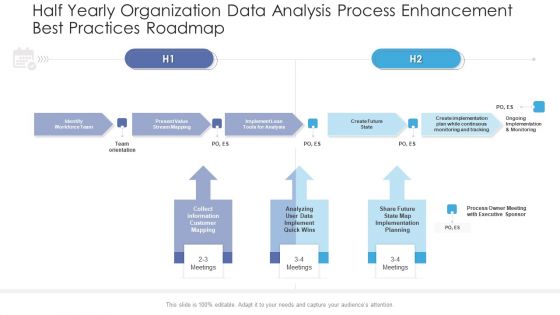
Half Yearly Organization Data Analysis Process Enhancement Best Practices Roadmap Portrait
Presenting the half yearly organization data analysis process enhancement best practices roadmap portrait. The template includes a roadmap that can be used to initiate a strategic plan. Not only this, the PowerPoint slideshow is completely editable and you can effortlessly modify the font size, font type, and shapes according to your needs. This PPT slide can be easily reached in standard screen and widescreen aspect ratios. The set is also available in various formats like PDF, PNG, and JPG. So download and use it multiple times as per your knowledge.
Advanced Service Data Analysis Ppt PowerPoint Presentation Complete Deck With Slides
This complete deck covers various topics and highlights important concepts. It has PPT slides which cater to your business needs. This complete deck presentation emphasizes advanced service data analysis ppt powerpoint presentation complete deck with slides and has templates with professional background images and relevant content. This deck consists of total of fortynine slides. Our designers have created customizable templates, keeping your convenience in mind. You can edit the colour, text and font size with ease. Not just this, you can also add or delete the content if needed. Get access to this fully editable complete presentation by clicking the download button below.
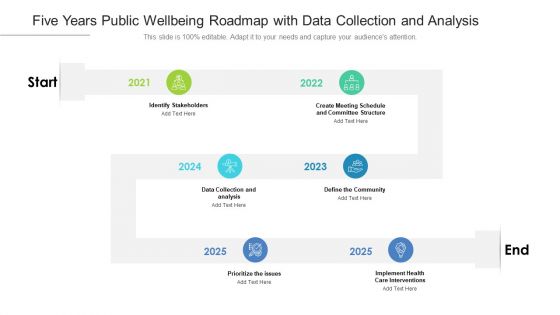
Five Years Public Wellbeing Roadmap With Data Collection And Analysis Topics
Presenting the five years public wellbeing roadmap with data collection and analysis topics. The template includes a roadmap that can be used to initiate a strategic plan. Not only this, the PowerPoint slideshow is completely editable and you can effortlessly modify the font size, font type, and shapes according to your needs. This PPT slide can be easily reached in standard screen and widescreen aspect ratios. The set is also available in various formats like PDF, PNG, and JPG. So download and use it multiple times as per your knowledge.
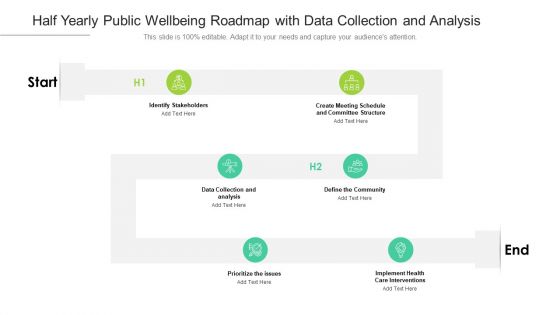
Half Yearly Public Wellbeing Roadmap With Data Collection And Analysis Graphics
Presenting the half yearly public wellbeing roadmap with data collection and analysis graphics. The template includes a roadmap that can be used to initiate a strategic plan. Not only this, the PowerPoint slideshow is completely editable and you can effortlessly modify the font size, font type, and shapes according to your needs. This PPT slide can be easily reached in standard screen and widescreen aspect ratios. The set is also available in various formats like PDF, PNG, and JPG. So download and use it multiple times as per your knowledge.
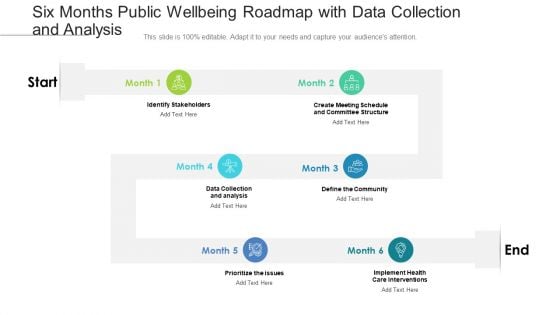
Six Months Public Wellbeing Roadmap With Data Collection And Analysis Clipart
Presenting the six months public wellbeing roadmap with data collection and analysis clipart. The template includes a roadmap that can be used to initiate a strategic plan. Not only this, the PowerPoint slideshow is completely editable and you can effortlessly modify the font size, font type, and shapes according to your needs. This PPT slide can be easily reached in standard screen and widescreen aspect ratios. The set is also available in various formats like PDF, PNG, and JPG. So download and use it multiple times as per your knowledge.
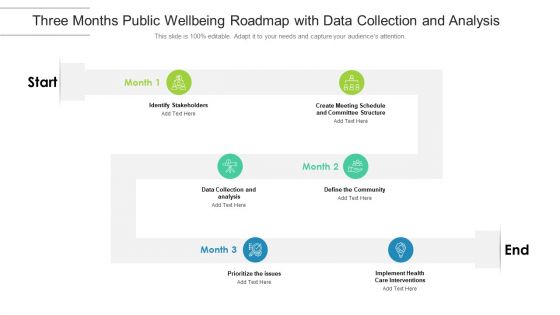
Three Months Public Wellbeing Roadmap With Data Collection And Analysis Guidelines
Presenting the three months public wellbeing roadmap with data collection and analysis guidelines. The template includes a roadmap that can be used to initiate a strategic plan. Not only this, the PowerPoint slideshow is completely editable and you can effortlessly modify the font size, font type, and shapes according to your needs. This PPT slide can be easily reached in standard screen and widescreen aspect ratios. The set is also available in various formats like PDF, PNG, and JPG. So download and use it multiple times as per your knowledge.
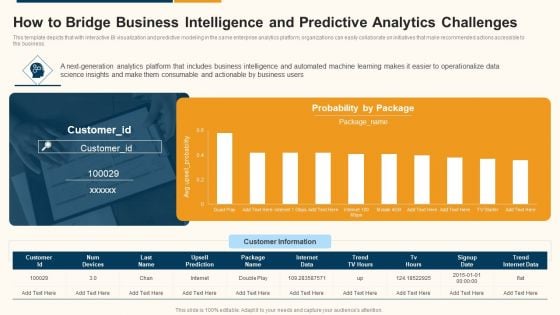
Data Interpretation And Analysis Playbook How To Bridge Business Intelligence And Predictive Analytics Challenges Designs PDF
This template depicts that with interactive BI visualization and predictive modeling in the same enterprise analytics platform, organizations can easily collaborate on initiatives that make recommended actions accessible to the business. Deliver an awe inspiring pitch with this creative data interpretation and analysis playbook how to bridge business intelligence and predictive analytics challenges designs pdf bundle. Topics like how to bridge business intelligence and predictive analytics challenges can be discussed with this completely editable template. It is available for immediate download depending on the needs and requirements of the user.


 Continue with Email

 Home
Home


