Help Icons
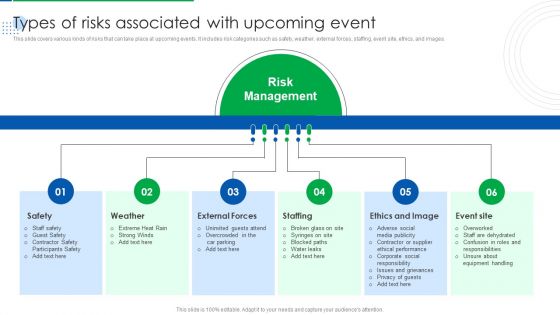
Company Event Communication Types Of Risks Associated With Upcoming Event Diagrams PDF
This slide covers various kinds of risks that can take place at upcoming events. It includes risk categories such as safety, weather, external forces, staffing, event site, ethics, and images. Coming up with a presentation necessitates that the majority of the effort goes into the content and the message you intend to convey. The visuals of a PowerPoint presentation can only be effective if it supplements and supports the story that is being told. Keeping this in mind our experts created Company Event Communication Types Of Risks Associated With Upcoming Event Diagrams PDF to reduce the time that goes into designing the presentation. This way, you can concentrate on the message while our designers take care of providing you with the right template for the situation.
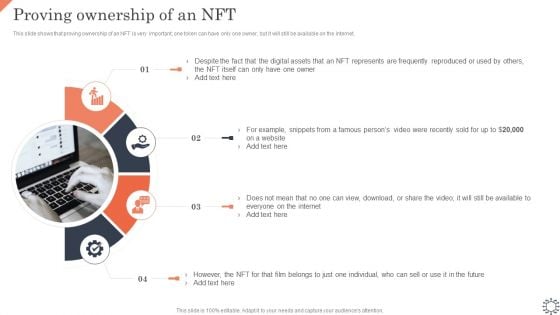
Non Fungible Token Methodology IT Proving Ownership Of An NFT Diagrams PDF
This slide shows that proving ownership of an NFT is very important, one token can have only one owner, but it will still be available on the internet. Coming up with a presentation necessitates that the majority of the effort goes into the content and the message you intend to convey. The visuals of a PowerPoint presentation can only be effective if it supplements and supports the story that is being told. Keeping this in mind our experts created Non Fungible Token Methodology IT Proving Ownership Of An NFT Diagrams PDF to reduce the time that goes into designing the presentation. This way, you can concentrate on the message while our designers take care of providing you with the right template for the situation.
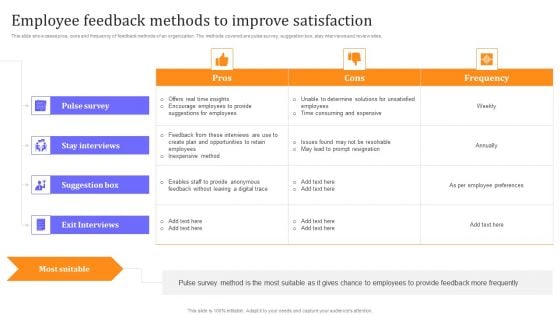
HR Communication Strategy For Workforce Engagement Employee Feedback Methods To Improve Satisfaction Diagrams PDF
This slide showcases pros, cons and frequency of feedback methods of an organization. The methods covered are pulse survey, suggestion box, stay interviews and review sites. Coming up with a presentation necessitates that the majority of the effort goes into the content and the message you intend to convey. The visuals of a PowerPoint presentation can only be effective if it supplements and supports the story that is being told. Keeping this in mind our experts created HR Communication Strategy For Workforce Engagement Employee Feedback Methods To Improve Satisfaction Diagrams PDF to reduce the time that goes into designing the presentation. This way, you can concentrate on the message while our designers take care of providing you with the right template for the situation.
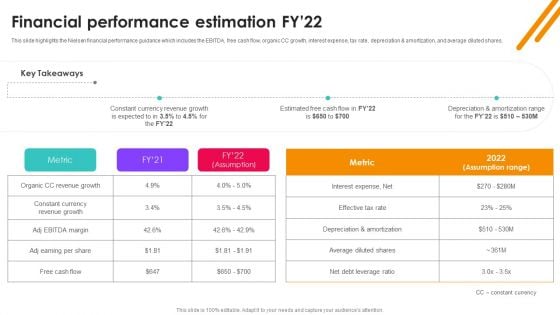
Nielsen Business Profile Financial Performance Estimation Fy22 Ppt PowerPoint Presentation File Diagrams PDF
This slide highlights the Nielsen financial performance guidance which includes the EBITDA, free cash flow, organic CC growth, interest expense, tax rate, depreciation and amortization, and average diluted shares. Coming up with a presentation necessitates that the majority of the effort goes into the content and the message you intend to convey. The visuals of a PowerPoint presentation can only be effective if it supplements and supports the story that is being told. Keeping this in mind our experts created Nielsen Business Profile Financial Performance Estimation Fy22 Ppt PowerPoint Presentation File Diagrams PDF to reduce the time that goes into designing the presentation. This way, you can concentrate on the message while our designers take care of providing you with the right template for the situation.
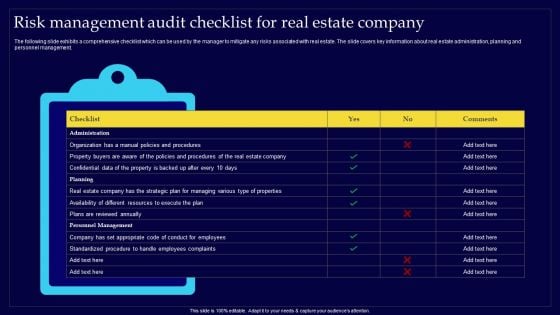
Executing Risk Mitigation Risk Management Audit Checklist For Real Estate Company Diagrams PDF
The following slide exhibits a comprehensive checklist which can be used by the manager to mitigate any risks associated with real estate. The slide covers key information about real estate administration, planning and personnel management. Coming up with a presentation necessitates that the majority of the effort goes into the content and the message you intend to convey. The visuals of a PowerPoint presentation can only be effective if it supplements and supports the story that is being told. Keeping this in mind our experts created Executing Risk Mitigation Risk Management Audit Checklist For Real Estate Company Diagrams PDF to reduce the time that goes into designing the presentation. This way, you can concentrate on the message while our designers take care of providing you with the right template for the situation.
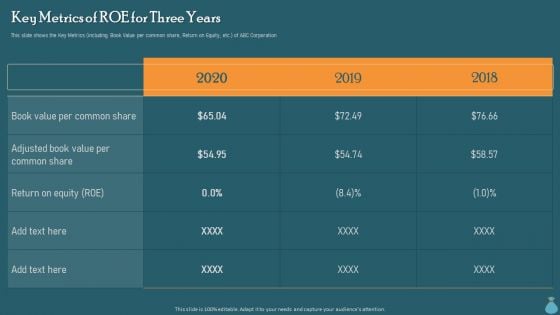
Financial Data Revelation To Varied Stakeholders Key Metrics Of Roe For Three Years Diagrams PDF
This slide shows the Key Metrics including Book Value per common share, Return on Equity, etc. of ABC Corporation. Coming up with a presentation necessitates that the majority of the effort goes into the content and the message you intend to convey. The visuals of a PowerPoint presentation can only be effective if it supplements and supports the story that is being told. Keeping this in mind our experts created Financial Data Revelation To Varied Stakeholders Key Metrics Of Roe For Three Years Diagrams PDF to reduce the time that goes into designing the presentation. This way, you can concentrate on the message while our designers take care of providing you with the right template for the situation.
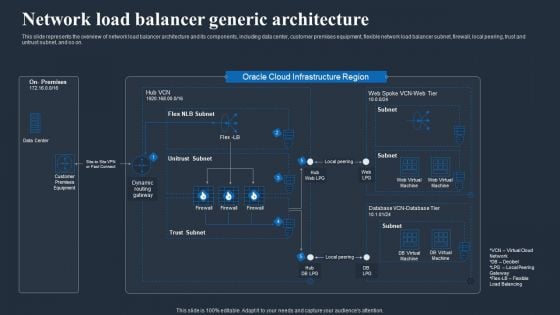
Load Balancing In Networking IT Network Load Balancer Generic Architecture Diagrams PDF
This slide represents the overview of network load balancer architecture and its components, including data center, customer premises equipment, flexible network load balancer subnet, firewall, local peering, trust and untrust subnet, and so on. Coming up with a presentation necessitates that the majority of the effort goes into the content and the message you intend to convey. The visuals of a PowerPoint presentation can only be effective if it supplements and supports the story that is being told. Keeping this in mind our experts created Load Balancing In Networking IT Network Load Balancer Generic Architecture Diagrams PDF to reduce the time that goes into designing the presentation. This way, you can concentrate on the message while our designers take care of providing you with the right template for the situation.
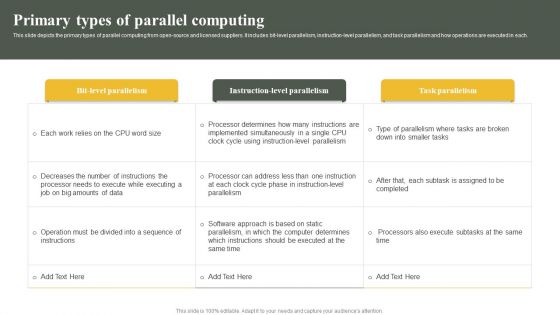
Parallel Computing System To Enhance Process Efficiency Primary Types Of Parallel Computing Diagrams PDF
This slide depicts the primary types of parallel computing from open-source and licensed suppliers. It includes bit-level parallelism, instruction-level parallelism, and task parallelism and how operations are executed in each. Coming up with a presentation necessitates that the majority of the effort goes into the content and the message you intend to convey. The visuals of a PowerPoint presentation can only be effective if it supplements and supports the story that is being told. Keeping this in mind our experts created Parallel Computing System To Enhance Process Efficiency Primary Types Of Parallel Computing Diagrams PDF to reduce the time that goes into designing the presentation. This way, you can concentrate on the message while our designers take care of providing you with the right template for the situation.
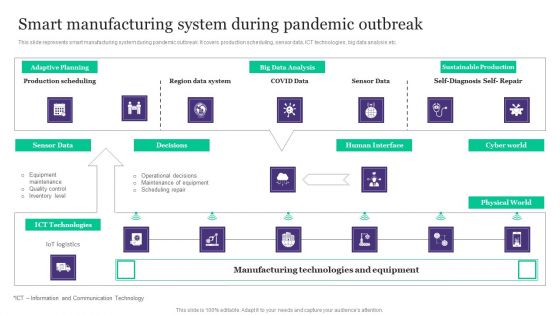
Deployment Of Automated Production Technology Smart Manufacturing System During Diagrams PDF
This slide represents smart manufacturing system during pandemic outbreak. It covers production scheduling, sensor data, ICT technologies, big data analysis etc.Coming up with a presentation necessitates that the majority of the effort goes into the content and the message you intend to convey. The visuals of a PowerPoint presentation can only be effective if it supplements and supports the story that is being told. Keeping this in mind our experts created Deployment Of Automated Production Technology Smart Manufacturing System During Diagrams PDF to reduce the time that goes into designing the presentation. This way, you can concentrate on the message while our designers take care of providing you with the right template for the situation.
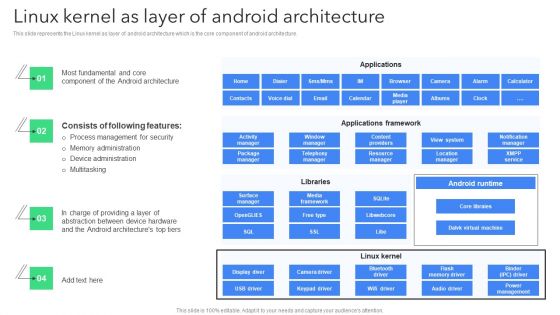
Creating Mobile Application For Android Linux Kernel As Layer Of Android Architecture Diagrams PDF
This slide represents the Linux kernel as layer of android architecture which is the core component of android architecture. Coming up with a presentation necessitates that the majority of the effort goes into the content and the message you intend to convey. The visuals of a PowerPoint presentation can only be effective if it supplements and supports the story that is being told. Keeping this in mind our experts created Creating Mobile Application For Android Linux Kernel As Layer Of Android Architecture Diagrams PDF to reduce the time that goes into designing the presentation. This way, you can concentrate on the message while our designers take care of providing you with the right template for the situation.
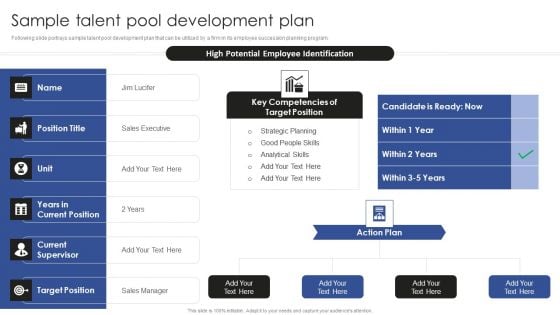
Talent Administration And Succession Sample Talent Pool Development Plan Diagrams PDF
Following slide portrays sample talent pool development plan that can be utilized by a firm in its employee succession planning program. Coming up with a presentation necessitates that the majority of the effort goes into the content and the message you intend to convey. The visuals of a PowerPoint presentation can only be effective if it supplements and supports the story that is being told. Keeping this in mind our experts created Talent Administration And Succession Sample Talent Pool Development Plan Diagrams PDF to reduce the time that goes into designing the presentation. This way, you can concentrate on the message while our designers take care of providing you with the right template for the situation.
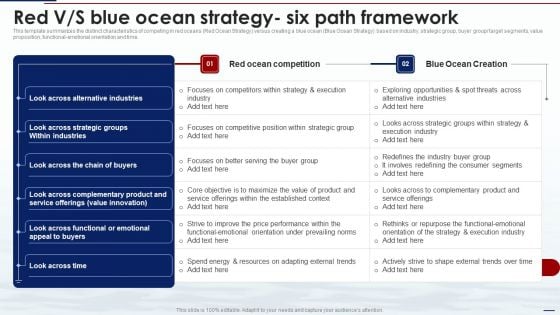
Blue Ocean Tactics Red V S Blue Ocean Strategy Six Path Framework Diagrams PDF
This template summarizes the distinct characteristics of competing in red oceans Red Ocean Strategy versus creating a blue ocean Blue Ocean Strategy based on industry, strategic group, buyer group or target segments, value proposition, functional-emotional orientation and time. Coming up with a presentation necessitates that the majority of the effort goes into the content and the message you intend to convey. The visuals of a PowerPoint presentation can only be effective if it supplements and supports the story that is being told. Keeping this in mind our experts created Blue Ocean Tactics Red VS Blue Ocean Strategy Six Path Framework Diagrams PDF to reduce the time that goes into designing the presentation. This way, you can concentrate on the message while our designers take care of providing you with the right template for the situation.
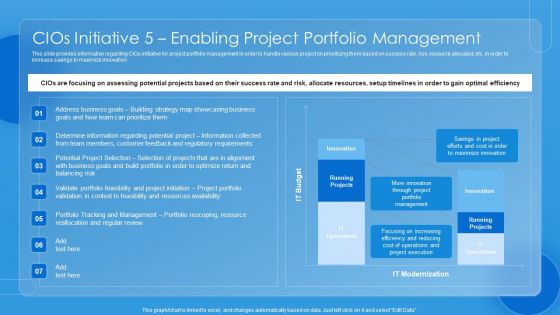
Key CIO Initiatives Cios Initiative 5 Enabling Project Portfolio Management Diagrams PDF
This slide provides information regarding CIOs initiative for project portfolio management in order to handle various project on prioritizing them based on success rate, risk, resource allocated, etc. in order to increase savings to maximize innovation. Coming up with a presentation necessitates that the majority of the effort goes into the content and the message you intend to convey. The visuals of a PowerPoint presentation can only be effective if it supplements and supports the story that is being told. Keeping this in mind our experts created Key CIO Initiatives Cios Initiative 5 Enabling Project Portfolio Management Diagrams PDF to reduce the time that goes into designing the presentation. This way, you can concentrate on the message while our designers take care of providing you with the right template for the situation.
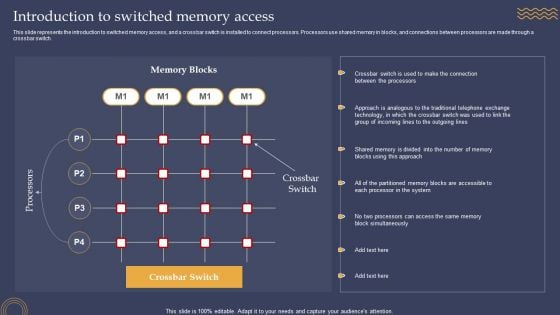
Introduction To Switched Memory Access Ppt PowerPoint Presentation Diagram Lists PDF
This slide represents the introduction to switched memory access, and a crossbar switch is installed to connect processors. Processors use shared memory in blocks, and connections between processors are made through a crossbar switch. Coming up with a presentation necessitates that the majority of the effort goes into the content and the message you intend to convey. The visuals of a PowerPoint presentation can only be effective if it supplements and supports the story that is being told. Keeping this in mind our experts created Introduction To Switched Memory Access Ppt PowerPoint Presentation Diagram Lists PDF to reduce the time that goes into designing the presentation. This way, you can concentrate on the message while our designers take care of providing you with the right template for the situation.
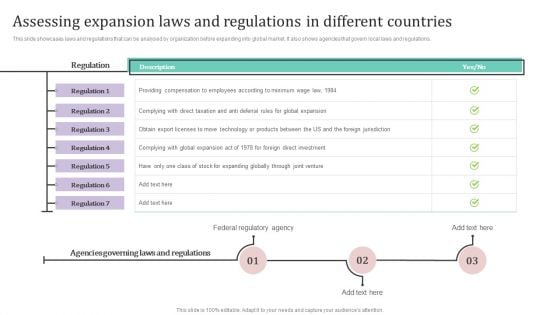
Assessing Expansion Laws And Regulations In Different Countries Ppt PowerPoint Presentation Diagram Images PDF
This slide showcases laws and regulations that can be analysed by organization before expanding into global market. It also shows agencies that govern local laws and regulations.Coming up with a presentation necessitates that the majority of the effort goes into the content and the message you intend to convey. The visuals of a PowerPoint presentation can only be effective if it supplements and supports the story that is being told. Keeping this in mind our experts created Assessing Expansion Laws And Regulations In Different Countries Ppt PowerPoint Presentation Diagram Images PDF to reduce the time that goes into designing the presentation. This way, you can concentrate on the message while our designers take care of providing you with the right template for the situation.
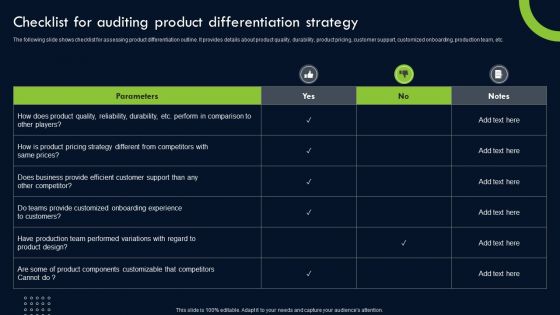
Transforming Sustainability Into Competitive Checklist For Auditing Product Differentiation Diagrams PDF
The following slide shows checklist for assessing product differentiation outline. It provides details about product quality, durability, product pricing, customer support, customized onboarding, production team, etc. Slidegeeks is here to make your presentations a breeze with Transforming Sustainability Into Competitive Checklist For Auditing Product Differentiation Diagrams PDF With our easy-to-use and customizable templates, you can focus on delivering your ideas rather than worrying about formatting. With a variety of designs to choose from, youre sure to find one that suits your needs. And with animations and unique photos, illustrations, and fonts, you can make your presentation pop. So whether youre giving a sales pitch or presenting to the board, make sure to check out Slidegeeks first.

Streamlining Manufacturing Processes With Workflow Automation Members Involved In Workflow Automation Project Team Diagrams PDF

Steps Of Project Risk Management Process Ppt PowerPoint Presentation File Diagrams PDF
This slide showcases the stages included in the risk management process. Major steps covered are risk identification, analysis, prioritization, treatment and monitoring. Coming up with a presentation necessitates that the majority of the effort goes into the content and the message you intend to convey. The visuals of a PowerPoint presentation can only be effective if it supplements and supports the story that is being told. Keeping this in mind our experts created Steps Of Project Risk Management Process Ppt PowerPoint Presentation File Diagrams PDF to reduce the time that goes into designing the presentation. This way, you can concentrate on the message while our designers take care of providing you with the right template for the situation.
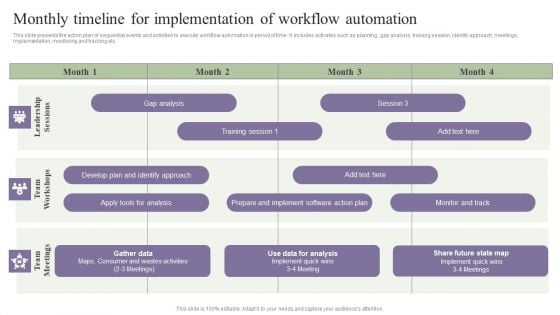
Deployment Of Process Automation To Increase Organisational Performance Monthly Timeline For Implementation Diagrams PDF
This slide presents the action plan of sequential events and activities to execute workflow automation in period of time. It includes activates such as planning , gap analysis, training session, identify approach, meetings, implementation, monitoring and tracking etc. Coming up with a presentation necessitates that the majority of the effort goes into the content and the message you intend to convey. The visuals of a PowerPoint presentation can only be effective if it supplements and supports the story that is being told. Keeping this in mind our experts created Deployment Of Process Automation To Increase Organisational Performance Monthly Timeline For Implementation Diagrams PDF to reduce the time that goes into designing the presentation. This way, you can concentrate on the message while our designers take care of providing you with the right template for the situation.
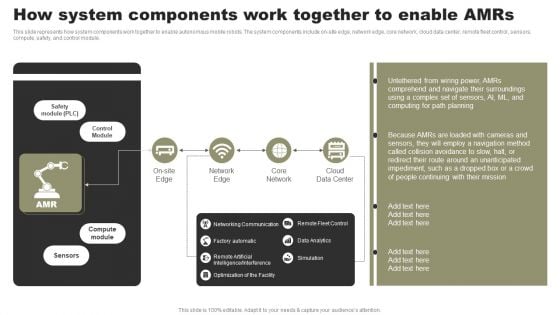
Types Of Independent Robotic System How System Components Work Together To Enable Amrs Diagrams PDF
This slide represents how system components work together to enable autonomous mobile robots. The system components include on-site edge, network edge, core network, cloud data center, remote fleet control, sensors, compute, safety, and control module. Coming up with a presentation necessitates that the majority of the effort goes into the content and the message you intend to convey. The visuals of a PowerPoint presentation can only be effective if it supplements and supports the story that is being told. Keeping this in mind our experts created Types Of Independent Robotic System How System Components Work Together To Enable Amrs Diagrams PDF to reduce the time that goes into designing the presentation. This way, you can concentrate on the message while our designers take care of providing you with the right template for the situation.
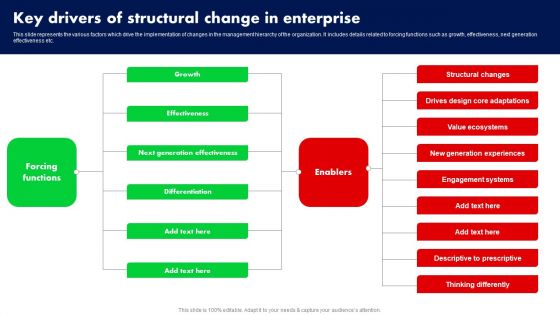
Key Drivers Of Structural Change In Enterprise Ppt PowerPoint Presentation Diagram Images PDF
This slide represents the various factors which drive the implementation of changes in the management hierarchy of the organization. It includes details related to forcing functions such as growth, effectiveness, next generation effectiveness etc. Coming up with a presentation necessitates that the majority of the effort goes into the content and the message you intend to convey. The visuals of a PowerPoint presentation can only be effective if it supplements and supports the story that is being told. Keeping this in mind our experts created Key Drivers Of Structural Change In Enterprise Ppt PowerPoint Presentation Diagram Images PDF to reduce the time that goes into designing the presentation. This way, you can concentrate on the message while our designers take care of providing you with the right template for the situation.
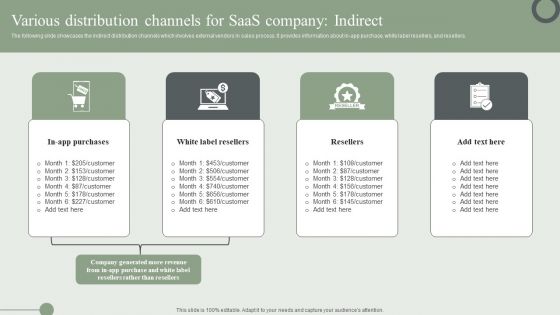
Various Distribution Channels For Saas Company Indirect Ppt PowerPoint Presentation File Diagrams PDF
The following slide showcases the indirect distribution channels which involves external vendors in sales process. It provides information about in-app purchase, white label resellers, and resellers. Coming up with a presentation necessitates that the majority of the effort goes into the content and the message you intend to convey. The visuals of a PowerPoint presentation can only be effective if it supplements and supports the story that is being told. Keeping this in mind our experts created Various Distribution Channels For Saas Company Indirect Ppt PowerPoint Presentation File Diagrams PDF to reduce the time that goes into designing the presentation. This way, you can concentrate on the message while our designers take care of providing you with the right template for the situation.
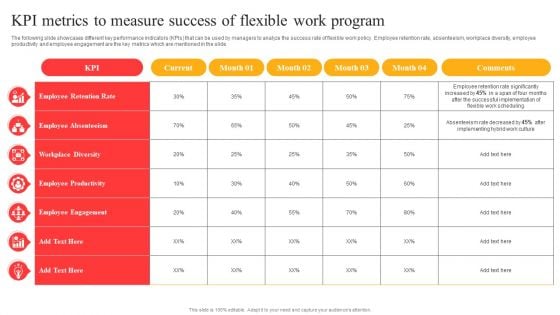
Flexible Working Policies And Guidelines Kpi Metrics To Measure Success Of Flexible Work Program Diagrams PDF
The following slide showcases different key performance indicators KPIs that can be used by managers to analyze the success rate of flexible work policy. Employee retention rate, absenteeism, workplace diversity, employee productivity and employee engagement are the key metrics which are mentioned in the slide. Coming up with a presentation necessitates that the majority of the effort goes into the content and the message you intend to convey. The visuals of a PowerPoint presentation can only be effective if it supplements and supports the story that is being told. Keeping this in mind our experts created Flexible Working Policies And Guidelines Kpi Metrics To Measure Success Of Flexible Work Program Diagrams PDF to reduce the time that goes into designing the presentation. This way, you can concentrate on the message while our designers take care of providing you with the right template for the situation.
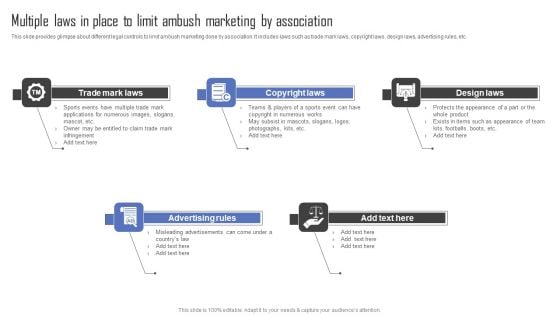
Methods For Implementing Ambush Advertising Campaigns Multiple Laws In Place To Limit Ambush Marketing Diagrams PDF
This slide provides glimpse about different legal controls to limit ambush marketing done by intrusion on multiple big events. It includes contractual controls, special legislation, etc. Coming up with a presentation necessitates that the majority of the effort goes into the content and the message you intend to convey. The visuals of a PowerPoint presentation can only be effective if it supplements and supports the story that is being told. Keeping this in mind our experts created Methods For Implementing Ambush Advertising Campaigns Multiple Laws In Place To Limit Ambush Marketing Diagrams PDF to reduce the time that goes into designing the presentation. This way, you can concentrate on the message while our designers take care of providing you with the right template for the situation.

Retail Promotion Strategies To Elevate Shopper Steps For Online Shopping In Retail Store Diagrams PDF
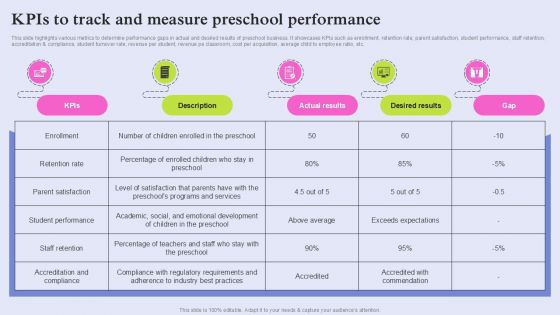
Pre School Marketing Strategy To Enhance Enrollment Rate Kpis To Track And Measure Preschool Diagrams PDF
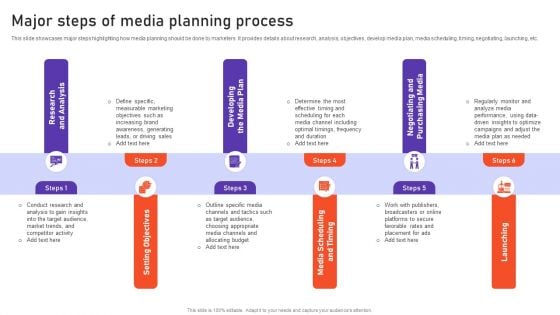
Major Steps Of Media Planning Process Ppt PowerPoint Presentation Diagram Lists PDF
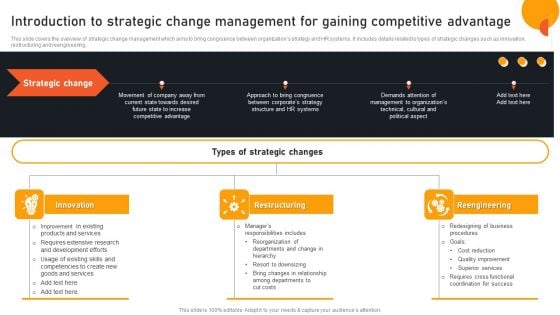
Transform Management Instruction Schedule Introduction To Strategic Change Management Diagrams PDF
This slide covers the overview of strategic change management which aims to bring congruence between organizations strategy and HR systems. It includes details related to types of strategic changes such as innovation, restructuring and reengineering. Coming up with a presentation necessitates that the majority of the effort goes into the content and the message you intend to convey. The visuals of a PowerPoint presentation can only be effective if it supplements and supports the story that is being told. Keeping this in mind our experts created Transform Management Instruction Schedule Introduction To Strategic Change Management Diagrams PDF to reduce the time that goes into designing the presentation. This way, you can concentrate on the message while our designers take care of providing you with the right template for the situation.
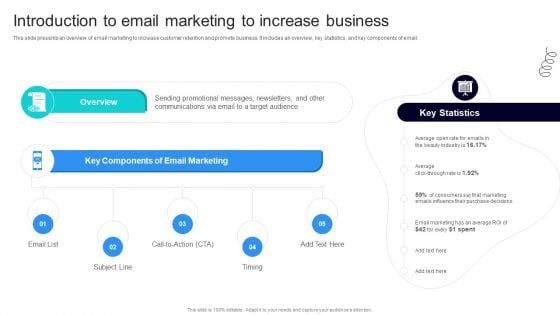
Strategic Marketing For Hair And Beauty Salon To Increase Introduction To Email Marketing Diagrams PDF
This slide presents an overview of email marketing to increase customer retention and promote business. It includes an overview, key statistics, and key components of email. Coming up with a presentation necessitates that the majority of the effort goes into the content and the message you intend to convey. The visuals of a PowerPoint presentation can only be effective if it supplements and supports the story that is being told. Keeping this in mind our experts created Strategic Marketing For Hair And Beauty Salon To Increase Introduction To Email Marketing Diagrams PDF to reduce the time that goes into designing the presentation. This way, you can concentrate on the message while our designers take care of providing you with the right template for the situation.
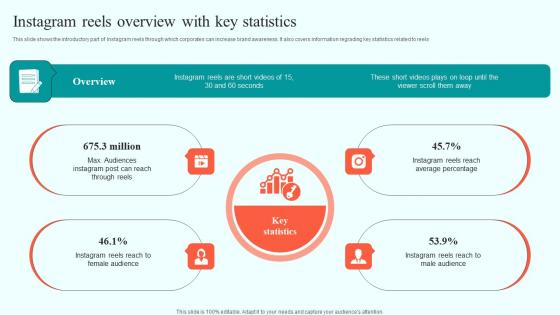
Instagram Reels Overview With Key Statistics Online Advertising Solutions Diagrams Pdf
This slide shows the introductory part of Instagram reels through which corporates can increase brand awareness. It also covers information regrading key statistics related to reels Coming up with a presentation necessitates that the majority of the effort goes into the content and the message you intend to convey. The visuals of a PowerPoint presentation can only be effective if it supplements and supports the story that is being told. Keeping this in mind our experts created Instagram Reels Overview With Key Statistics Online Advertising Solutions Diagrams Pdf to reduce the time that goes into designing the presentation. This way, you can concentrate on the message while our designers take care of providing you with the right template for the situation. This slide shows the introductory part of Instagram reels through which corporates can increase brand awareness. It also covers information regrading key statistics related to reels
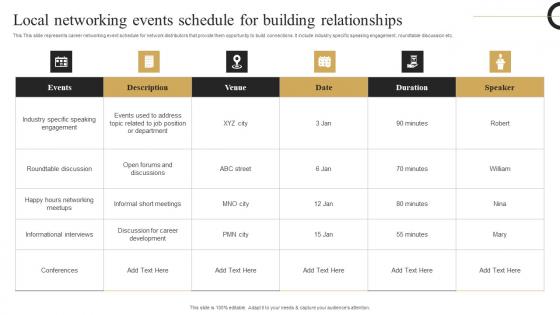
Local Networking Events Schedule Strategic Plan Develop Multi Level Marketing Diagrams Pdf
This This slide represents career networking event schedule for network distributors that provide them opportunity to build connections. It include industry specific speaking engagement, roundtable discussion etc. Coming up with a presentation necessitates that the majority of the effort goes into the content and the message you intend to convey. The visuals of a PowerPoint presentation can only be effective if it supplements and supports the story that is being told. Keeping this in mind our experts created Local Networking Events Schedule Strategic Plan Develop Multi Level Marketing Diagrams Pdf to reduce the time that goes into designing the presentation. This way, you can concentrate on the message while our designers take care of providing you with the right template for the situation. This This slide represents career networking event schedule for network distributors that provide them opportunity to build connections. It include industry specific speaking engagement, roundtable discussion etc.
Managing Social Media Activities GPT 4 Revolutionary Generative AI Innovation Diagrams Pdf
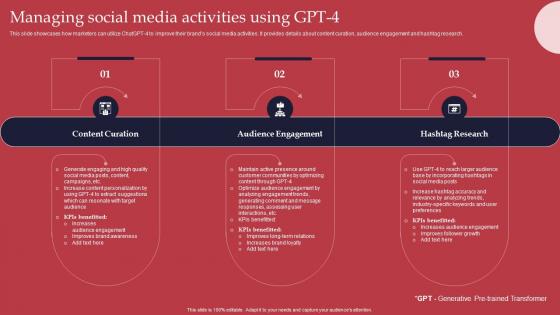
This slide showcases how marketers can utilize ChatGPT 4 to improve their brands social media activities. It provides details about content curation, audience engagement and hashtag research. Coming up with a presentation necessitates that the majority of the effort goes into the content and the message you intend to convey. The visuals of a PowerPoint presentation can only be effective if it supplements and supports the story that is being told. Keeping this in mind our experts created Managing Social Media Activities GPT 4 Revolutionary Generative AI Innovation Diagrams Pdf to reduce the time that goes into designing the presentation. This way, you can concentrate on the message while our designers take care of providing you with the right template for the situation. This slide showcases how marketers can utilize ChatGPT 4 to improve their brands social media activities. It provides details about content curation, audience engagement and hashtag research.

Cyber Security Incident Response Preparation Ppt Powerpoint Presentation Diagram Templates Pdf
This slide represents the checklist to ensure activities to effectively handle and manage cyber security incidents. It includes details related to activities such as document incident response plan with policies and procedures etc. Coming up with a presentation necessitates that the majority of the effort goes into the content and the message you intend to convey. The visuals of a PowerPoint presentation can only be effective if it supplements and supports the story that is being told. Keeping this in mind our experts created Cyber Security Incident Response Preparation Ppt Powerpoint Presentation Diagram Templates Pdf to reduce the time that goes into designing the presentation. This way, you can concentrate on the message while our designers take care of providing you with the right template for the situation. This slide represents the checklist to ensure activities to effectively handle and manage cyber security incidents. It includes details related to activities such as document incident response plan with policies and procedures etc.
Why Invest With Abc Technology Company Wearable Technology Funding Diagrams PDF
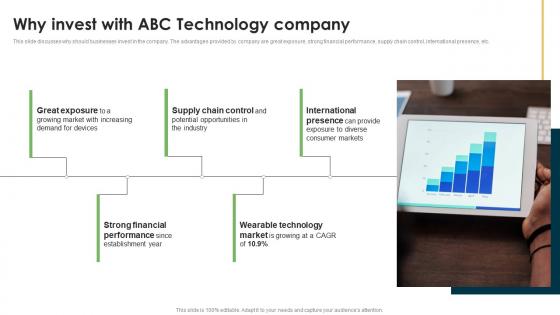
This slide discusses why should businesses invest in the company. The advantages provided by company are great exposure, strong financial performance, supply chain control, international presence, etc. Coming up with a presentation necessitates that the majority of the effort goes into the content and the message you intend to convey. The visuals of a PowerPoint presentation can only be effective if it supplements and supports the story that is being told. Keeping this in mind our experts created Why Invest With Abc Technology Company Wearable Technology Funding Diagrams PDF to reduce the time that goes into designing the presentation. This way, you can concentrate on the message while our designers take care of providing you with the right template for the situation. This slide discusses why should businesses invest in the company. The advantages provided by company are great exposure, strong financial performance, supply chain control, international presence, etc.
Brief Overview And Importance Managing Risks And Establishing Trust Through Efficient Diagrams Pdf
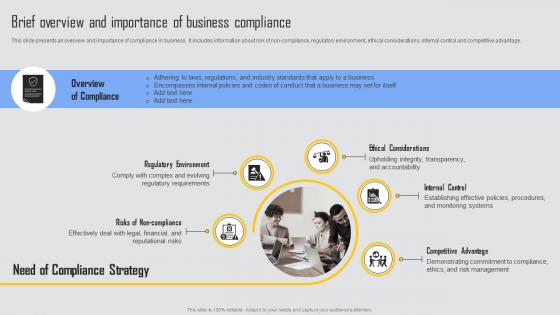
This slide presents an overview and importance of compliance in business. It includes information about risk of non compliance, regulatory environment, ethical considerations, internal control and competitive advantage. Coming up with a presentation necessitates that the majority of the effort goes into the content and the message you intend to convey. The visuals of a PowerPoint presentation can only be effective if it supplements and supports the story that is being told. Keeping this in mind our experts created Brief Overview And Importance Managing Risks And Establishing Trust Through Efficient Diagrams Pdf to reduce the time that goes into designing the presentation. This way, you can concentrate on the message while our designers take care of providing you with the right template for the situation. This slide presents an overview and importance of compliance in business. It includes information about risk of non compliance, regulatory environment, ethical considerations, internal control and competitive advantage.
Guide To Winning Tourism Facebook Marketing Strategies For Promoting Tourism Diagrams Pdf
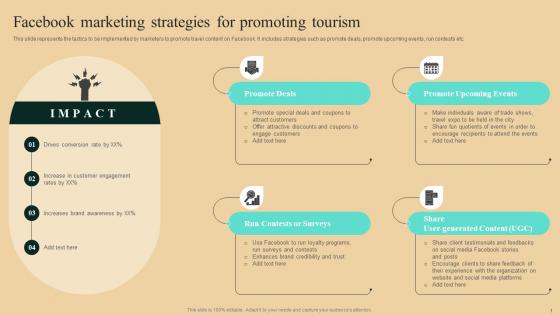
This slide represents the tactics to be implemented by marketers to promote travel content on Facebook. It includes strategies such as promote deals, promote upcoming events, run contests etc. Coming up with a presentation necessitates that the majority of the effort goes into the content and the message you intend to convey. The visuals of a PowerPoint presentation can only be effective if it supplements and supports the story that is being told. Keeping this in mind our experts created Guide To Winning Tourism Facebook Marketing Strategies For Promoting Tourism Diagrams Pdf to reduce the time that goes into designing the presentation. This way, you can concentrate on the message while our designers take care of providing you with the right template for the situation. This slide represents the tactics to be implemented by marketers to promote travel content on Facebook. It includes strategies such as promote deals, promote upcoming events, run contests etc.
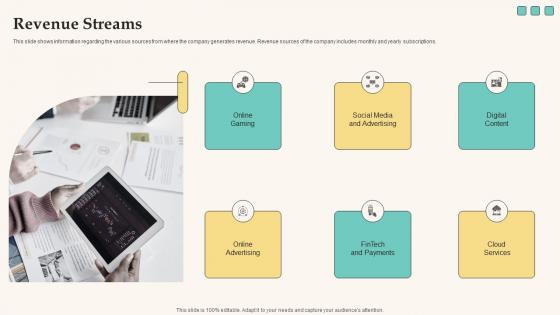
Revenue Streams Elevator Pitch Deck For Funding Tech Company Diagrams Pdf
This slide shows information regarding the various sources from where the company generates revenue. Revenue sources of the company includes monthly and yearly subscriptions. Coming up with a presentation necessitates that the majority of the effort goes into the content and the message you intend to convey. The visuals of a PowerPoint presentation can only be effective if it supplements and supports the story that is being told. Keeping this in mind our experts created Revenue Streams Elevator Pitch Deck For Funding Tech Company Diagrams Pdf to reduce the time that goes into designing the presentation. This way, you can concentrate on the message while our designers take care of providing you with the right template for the situation. This slide shows information regarding the various sources from where the company generates revenue. Revenue sources of the company includes monthly and yearly subscriptions.
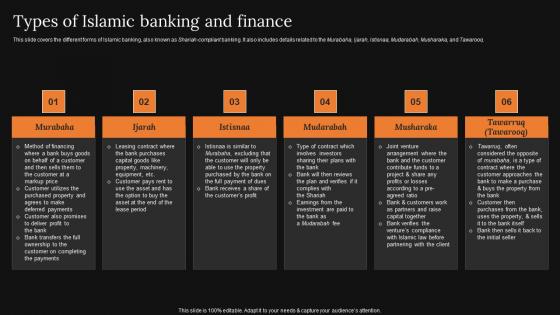
Types Of Islamic Banking And Finance A Detailed Knowledge Of Islamic Finance Diagrams Pdf
This slide covers the different forms of Islamic banking, also known as Shariah compliant banking. It also includes details related to the Murabaha, Ijarah, Istisnaa, Mudarabah, Musharaka, and Tawarooq. Coming up with a presentation necessitates that the majority of the effort goes into the content and the message you intend to convey. The visuals of a PowerPoint presentation can only be effective if it supplements and supports the story that is being told. Keeping this in mind our experts created Types Of Islamic Banking And Finance A Detailed Knowledge Of Islamic Finance Diagrams Pdf to reduce the time that goes into designing the presentation. This way, you can concentrate on the message while our designers take care of providing you with the right template for the situation. This slide covers the different forms of Islamic banking, also known as Shariah compliant banking. It also includes details related to the Murabaha, Ijarah, Istisnaa, Mudarabah, Musharaka, and Tawarooq.

Playbook For Managing Information IT Nfrastructure Management Handling Incidents Clipart PDF
This slide provides information regarding IT infrastructure management through effective management of incidents by tracking incident handling duration and customer support helpdesk incident management flowchart. Presenting Playbook For Managing Information IT Nfrastructure Management Handling Incidents Clipart PDF to provide visual cues and insights. Share and navigate important information on one stages that need your due attention. This template can be used to pitch topics like Customer Support Helpdesk, Estimated Incident Management. In addtion, this PPT design contains high resolution images, graphics, etc, that are easily editable and available for immediate download.
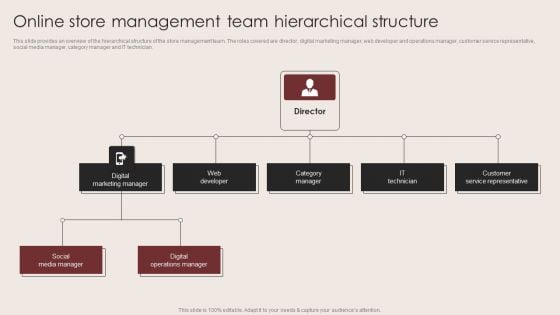
E Commerce Clothing Business Strategy Online Store Management Team Hierarchical Structure Guidelines PDF
This slide provides an overview of the hierarchical structure of the store management team. The roles covered are director, digital marketing manager, web developer and operations manager, customer service representative, social media manager, category manager and IT technician.Are you searching for a E Commerce Clothing Business Strategy Online Store Management Team Hierarchical Structure Guidelines PDF that is uncluttered, straightforward, and original Its easy to edit, and you can change the colors to suit your personal or business branding. For a presentation that expresses how much effort you have put in, this template is ideal With all of its features, including tables, diagrams, statistics, and lists, its perfect for a business plan presentation. Make your ideas more appealing with these professional slides. Download E Commerce Clothing Business Strategy Online Store Management Team Hierarchical Structure Guidelines PDF from Slidegeeks today.
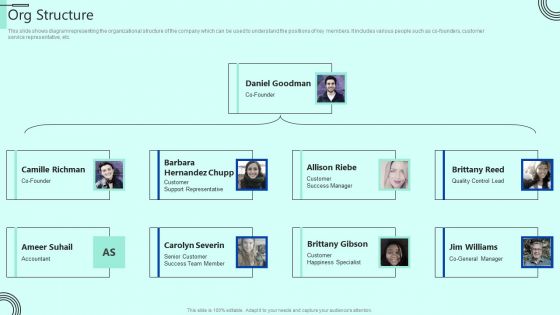
Indoor Horticulture Investor Fundraising Pitch Deck Org Structure Summary PDF
This slide shows diagram representing the organizational structure of the company which can be used to understand the positions of key members. It includes various people such as co-founders, customer service representative, etc. Slidegeeks is here to make your presentations a breeze with Indoor Horticulture Investor Fundraising Pitch Deck Org Structure Summary PDF With our easy to use and customizable templates, you can focus on delivering your ideas rather than worrying about formatting. With a variety of designs to choose from, you are sure to find one that suits your needs. And with animations and unique photos, illustrations, and fonts, you can make your presentation pop. So whether you are giving a sales pitch or presenting to the board, make sure to check out Slidegeeks first.
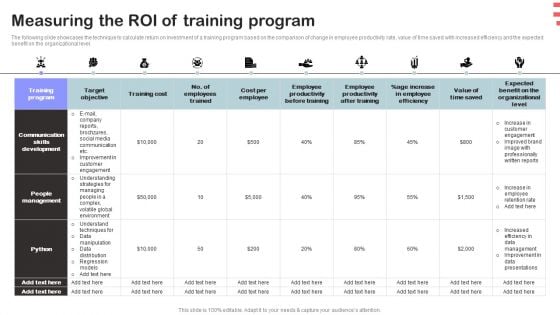
Corporate Training Program Measuring The ROI Of Training Program Diagrams PDF
The following slide showcases the technique to calculate return on investment of a training program based on the comparison of change in employee productivity rate, value of time saved with increased efficiency and the expected benefit on the organizational level. Boost your pitch with our creative Corporate Training Program Leadership Skill Matrix Of Managers Infographics PDF. Deliver an awe-inspiring pitch that will mesmerize everyone. Using these presentation templates you will surely catch everyones attention. You can browse the ppts collection on our website. We have researchers who are experts at creating the right content for the templates. So you do not have to invest time in any additional work. Just grab the template now and use them.
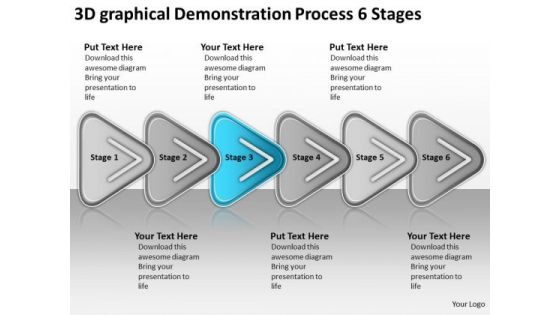
3d Graphical Demonstration Process 6 Stages Ppt Writing Small Business Plan PowerPoint Slides
We present our 3d graphical demonstration process 6 stages ppt writing small business plan PowerPoint Slides.Use our Arrows PowerPoint Templates because it expound on why you have discarded some plans as you went along to the apex and came out with the final selection which you know will make you and your team shine. Use our Signs PowerPoint Templates because the majestic tiger lord of all it surveys.It exudes power even when it is in repose. Download and present our Shapes PowerPoint Templates because it shows subtle changes that are taking place. Use our Business PowerPoint Templates because The foundation of the structure of your business is resilient and dependable. Convey this confidence to your colleagues and assure them of a great and enduring future. Download our Flow Charts PowerPoint Templates because educate your staff on the means to provide the required support for speedy recovery.Use these PowerPoint slides for presentations relating to abstract, arrow, arrows, business, chart, design, development, diagram, direction, element, flow, flowchart, graph, linear, management, model, motion, organization, plan, process, program, section, segment, set, sign, solution, strategy, symbol, technology. The prominent colors used in the PowerPoint template are Blue, Gray, White. PowerPoint presentation experts tell us our 3d graphical demonstration process 6 stages ppt writing small business plan PowerPoint Slides are Bold. The feedback we get is that our direction PowerPoint templates and PPT Slides are Luxuriant. We assure you our 3d graphical demonstration process 6 stages ppt writing small business plan PowerPoint Slides are Breathtaking. We assure you our development PowerPoint templates and PPT Slides are designed to make your presentations professional. You can be sure our 3d graphical demonstration process 6 stages ppt writing small business plan PowerPoint Slides are Exuberant. The feedback we get is that our development PowerPoint templates and PPT Slides are Spiffy. Be an outperforming global competititor with our 3d Graphical Demonstration Process 6 Stages Ppt Writing Small Business Plan PowerPoint Slides. They will make you look good.

3 Stages Converging To Form Business Process Ppt Pie Network PowerPoint Templates
We present our 3 stages converging to form business process ppt Pie Network PowerPoint templates.Present our Marketing PowerPoint Templates because you should Lay down the fundamentals to build upon. Present our Arrows PowerPoint Templates because it is in your DNA to analyse possible causes to the minutest detail. Download and present our Business PowerPoint Templates because maximising sales of your product is the intended destination. Download and present our Flow charts PowerPoint Templates because you can Show them how to churn out fresh ideas. Use our Shapes PowerPoint Templates because the gears of youthful minds are useful, therefore set them in motion.Use these PowerPoint slides for presentations relating to Analysis, analyze, background, blank, business, businessman, center, central, chart component, concept, connect, core, decentralize, deploy, diagram, disperse disseminate, distribute, diverge, diverse, diversify, divide, education, element, empty expand, extend, flow, gist, group, industry, link, man, management, manager, part people, person, plan, process, scatter, separate, spread, strategy, support, surround teacher, template, transfer. The prominent colors used in the PowerPoint template are Green, Gray, White. People tell us our 3 stages converging to form business process ppt Pie Network PowerPoint templates are designed by professionals PowerPoint presentation experts tell us our blank PowerPoint templates and PPT Slides are Majestic. Presenters tell us our 3 stages converging to form business process ppt Pie Network PowerPoint templates are Second to none. PowerPoint presentation experts tell us our central PowerPoint templates and PPT Slides are visually appealing. People tell us our 3 stages converging to form business process ppt Pie Network PowerPoint templates are Nice. People tell us our blank PowerPoint templates and PPT Slides are Magnificent. Your audience will fall under your spell. Chant the words with our 3 Stages Converging To Form Business Process Ppt Pie Network PowerPoint Templates.
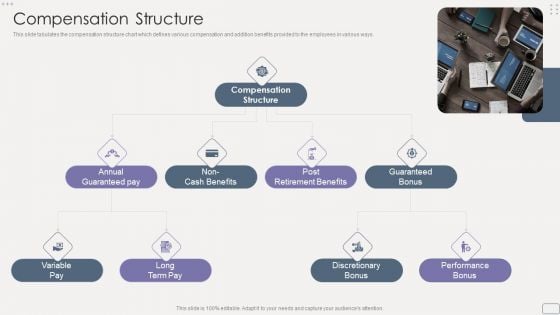
Income Assessment Report Compensation Structure Elements PDF
This slide tabulates the compensation structure chart which defines various compensation and addition benefits provided to the employees in various ways.Presenting Income Assessment Report Compensation Structure Elements PDF to provide visual cues and insights. Share and navigate important information on four stages that need your due attention. This template can be used to pitch topics like Annual Guaranteed, Retirement Benefits, Guaranteed Bonus. In addtion, this PPT design contains high resolution images, graphics, etc, that are easily editable and available for immediate download.

Christmas Background With Smiling Snowman PowerPoint Templates Ppt Backgrounds For Slides 1212
We present our Christmas Background With Smiling Snowman PowerPoint Templates PPT Backgrounds For Slides 1212.Present our Christmas PowerPoint Templates because christmas is around the corner. Present our Festival PowerPoint Templates because it describes the benefits of healthy food habits and lifestyles in respect of vital organs of the human anatomy. Download our Holidays PowerPoint Templates because you can Trigger audience minds with your interesting ideas. Use our Business PowerPoint Templates because a lot of dissimilar elements needing to gel to strike the deal. Download our Shapes PowerPoint Templates because our presentation designs are for those on the go.Use these PowerPoint slides for presentations relating to Smiling snowman with house, Christmas, Festival, Holidays, Business, Stars . The prominent colors used in the PowerPoint template are Blue, White, Green. You can be sure our Christmas Background With Smiling Snowman PowerPoint Templates PPT Backgrounds For Slides 1212 are Fancy. We assure you our Holidays PowerPoint templates and PPT Slides are designed by professionals Use our Christmas Background With Smiling Snowman PowerPoint Templates PPT Backgrounds For Slides 1212 are Nostalgic. Customers tell us our Holidays PowerPoint templates and PPT Slides are Splendid. Use our Christmas Background With Smiling Snowman PowerPoint Templates PPT Backgrounds For Slides 1212 are Handsome. The feedback we get is that our Stars PowerPoint templates and PPT Slides are Tasteful. Substantiate your exposition with our Christmas Background With Smiling Snowman PowerPoint Templates Ppt Backgrounds For Slides 1212. They will strengthen the effect of your effort.
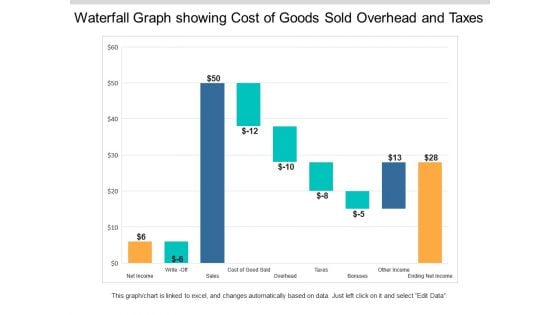
Waterfall Graph Showing Cost Of Goods Sold Overhead And Taxes Ppt PowerPoint Presentation Styles Example Topics
This is a waterfall graph showing cost of goods sold overhead and taxes ppt powerpoint presentation styles example topics. This is a three stage process. The stages in this process are profit and loss, balance sheet, income statement, benefit and loss.

Agriculture Business Elevator Pitch Deck Determine Investment Opportunities At Farming Firm Template PDF
This slide caters details about investment opportunities at agriculture firm with number of registered investors, MoM registration growth. Coming up with a presentation necessitates that the majority of the effort goes into the content and the message you intend to convey. The visuals of a PowerPoint presentation can only be effective if it supplements and supports the story that is being told. Keeping this in mind our experts created Agriculture Business Elevator Pitch Deck Determine Investment Opportunities At Farming Firm Template PDF to reduce the time that goes into designing the presentation. This way, you can concentrate on the message while our designers take care of providing you with the right template for the situation.
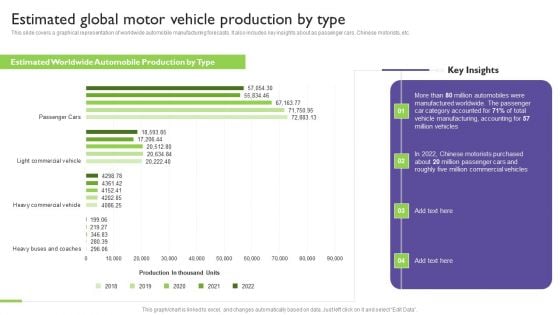
Global Automotive Industry Analysis Estimated Global Motor Vehicle Production By Type Graphics PDF
This slide covers a graphical representation of worldwide automobile manufacturing forecasts. It also includes key insights about as passenger cars, Chinese motorists, etc. Coming up with a presentation necessitates that the majority of the effort goes into the content and the message you intend to convey. The visuals of a PowerPoint presentation can only be effective if it supplements and supports the story that is being told. Keeping this in mind our experts created Global Automotive Industry Analysis Estimated Global Motor Vehicle Production By Type Graphics PDF to reduce the time that goes into designing the presentation. This way, you can concentrate on the message while our designers take care of providing you with the right template for the situation.
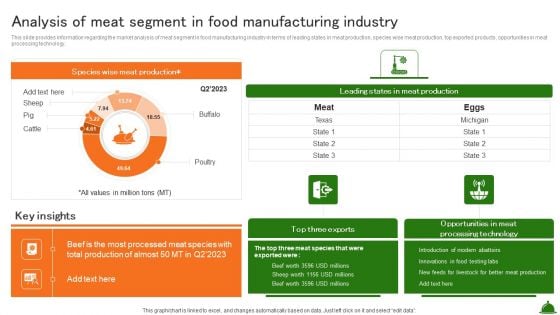
Analysis Of Meat Segment In Food Manufacturing Industry Industry Analysis Of Food Formats PDF
This slide provides information regarding the market analysis of meat segment in food manufacturing industry in terms of leading states in meat production, species wise meat production, top exported products, opportunities in meat processing technology.Coming up with a presentation necessitates that the majority of the effort goes into the content and the message you intend to convey. The visuals of a PowerPoint presentation can only be effective if it supplements and supports the story that is being told. Keeping this in mind our experts created Analysis Of Meat Segment In Food Manufacturing Industry Industry Analysis Of Food Formats PDF to reduce the time that goes into designing the presentation. This way, you can concentrate on the message while our designers take care of providing you with the right template for the situation.
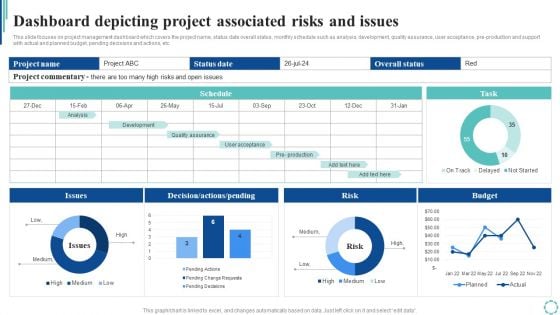
Dashboard Depicting Project Associated Risks And Issues Strategies To Enhance Project Lifecycle Background PDF
This slide focuses on project management dashboard which covers the project name, status date overall status, monthly schedule such as analysis, development, quality assurance, user acceptance, pre-production and support with actual and planned budget, pending decisions and actions, etc.Presenting this PowerPoint presentation, titled Dashboard Depicting Project Associated Risks And Issues Strategies To Enhance Project Lifecycle Background PDF, with topics curated by our researchers after extensive research. This editable presentation is available for immediate download and provides attractive features when used. Download now and captivate your audience. Presenting this Dashboard Depicting Project Associated Risks And Issues Strategies To Enhance Project Lifecycle Background PDF. Our researchers have carefully researched and created these slides with all aspects taken into consideration. This is a completely customizable Dashboard Depicting Project Associated Risks And Issues Strategies To Enhance Project Lifecycle Background PDF that is available for immediate downloading. Download now and make an impact on your audience. Highlight the attractive features available with our PPTs.
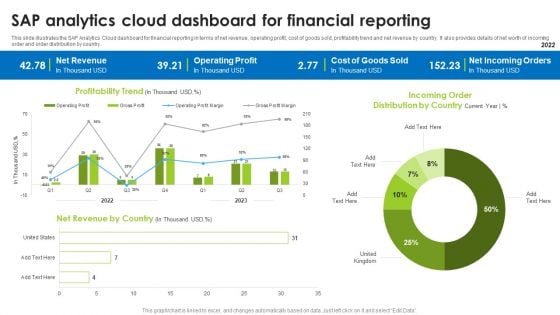
BI Technique For Data Informed Decisions Sap Analytics Cloud Dashboard For Financial Reporting Portrait PDF
This slide illustrates the SAP Analytics Cloud dashboard for financial reporting in terms of net revenue, operating profit, cost of goods sold, profitability trend and net revenue by country. It also provides details of net worth of incoming order and order distribution by country. Coming up with a presentation necessitates that the majority of the effort goes into the content and the message you intend to convey. The visuals of a PowerPoint presentation can only be effective if it supplements and supports the story that is being told. Keeping this in mind our experts created BI Technique For Data Informed Decisions Sap Analytics Cloud Dashboard For Financial Reporting Portrait PDF to reduce the time that goes into designing the presentation. This way, you can concentrate on the message while our designers take care of providing you with the right template for the situation.
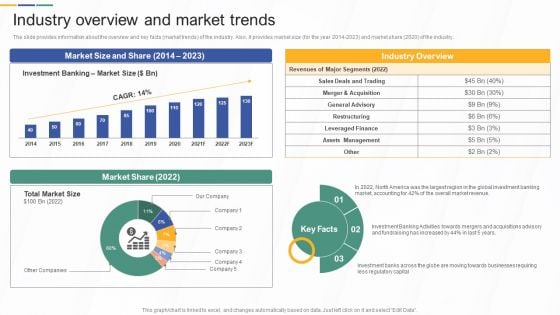
Industry Overview And Market Trends Investment Banking And Deal Pitchbook Download PDF
The slide provides information about the overview and key facts market trends of the industry. Also, it provides market size for the year 2014-2023 and market share 2020 of the industry.Coming up with a presentation necessitates that the majority of the effort goes into the content and the message you intend to convey. The visuals of a PowerPoint presentation can only be effective if it supplements and supports the story that is being told. Keeping this in mind our experts created Industry Overview And Market Trends Investment Banking And Deal Pitchbook Download PDF to reduce the time that goes into designing the presentation. This way, you can concentrate on the message while our designers take care of providing you with the right template for the situation.
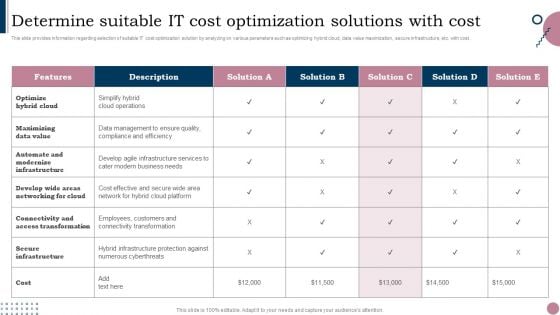
Cios Guide To Optimize Determine Suitable IT Cost Optimization Solutions With Cost Microsoft PDF
This slide provides information regarding selection of suitable IT cost optimization solution by analyzing on various parameters such as optimizing hybrid cloud, data value maximization, secure infrastructure, etc. with cost. Coming up with a presentation necessitates that the majority of the effort goes into the content and the message you intend to convey. The visuals of a PowerPoint presentation can only be effective if it supplements and supports the story that is being told. Keeping this in mind our experts created Cios Guide To Optimize Determine Suitable IT Cost Optimization Solutions With Cost Microsoft PDF to reduce the time that goes into designing the presentation. This way, you can concentrate on the message while our designers take care of providing you with the right template for the situation.
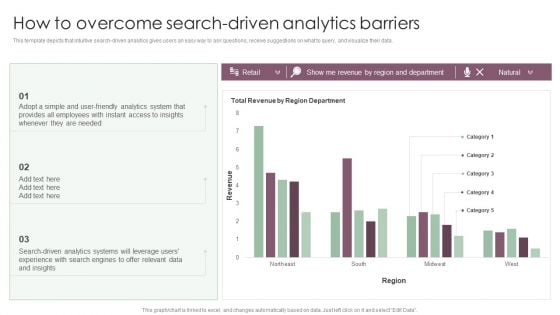
Information Analysis And BI Playbook How To Overcome Search Driven Analytics Barriers Formats PDF
This template depicts that intuitive search driven analytics gives users an easy way to ask questions, receive suggestions on what to query, and visualize their data. Coming up with a presentation necessitates that the majority of the effort goes into the content and the message you intend to convey. The visuals of a PowerPoint presentation can only be effective if it supplements and supports the story that is being told. Keeping this in mind our experts created Information Analysis And BI Playbook How To Overcome Search Driven Analytics Barriers Formats PDF to reduce the time that goes into designing the presentation. This way, you can concentrate on the message while our designers take care of providing you with the right template for the situation.

Business Strategy Consulting Solutions Company Outline CSR Breakdown And Trend Mockup PDF
This slide showcases the CSR breakdown which includes Covid 19 actions, educational support, healthcare and medical and environmental initiatives. It also covers expenditure trend for last four years. This Business Strategy Consulting Solutions Company Outline CSR Breakdown And Trend Mockup PDF from Slidegeeks makes it easy to present information on your topic with precision. It provides customization options, so you can make changes to the colors, design, graphics, or any other component to create a unique layout. It is also available for immediate download, so you can begin using it right away. Slidegeeks has done good research to ensure that you have everything you need to make your presentation stand out. Make a name out there for a brilliant performance.
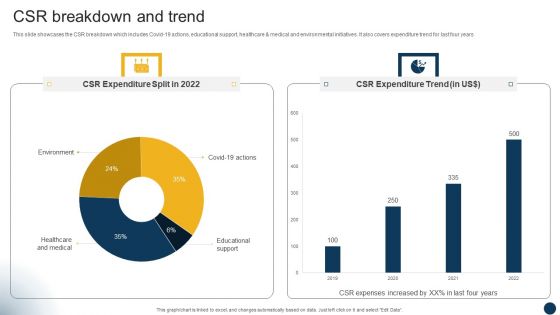
Organizational Advisory Solutions Business Profile CSR Breakdown And Trend Brochure PDF
This slide showcases the CSR breakdown which includes Covid 19 actions, educational support, healthcare and medical and environmental initiatives. It also covers expenditure trend for last four years. This Organizational Advisory Solutions Business Profile CSR Breakdown And Trend Brochure PDF from Slidegeeks makes it easy to present information on your topic with precision. It provides customization options, so you can make changes to the colors, design, graphics, or any other component to create a unique layout. It is also available for immediate download, so you can begin using it right away. Slidegeeks has done good research to ensure that you have everything you need to make your presentation stand out. Make a name out there for a brilliant performance.
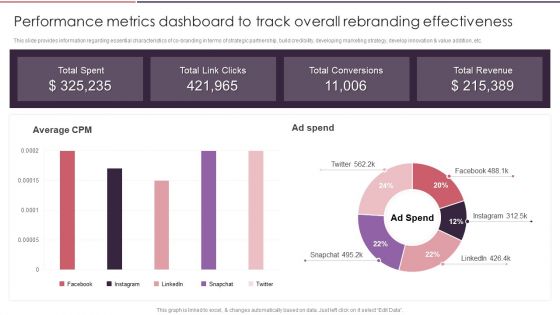
Rebranding Brand Fresh Face Development Performance Metrics Dashboard To Track Overall Rules PDF
This slide provides information regarding essential characteristics of co-branding in terms of strategic partnership, build credibility, developing marketing strategy, develop innovation and value addition, etc. Coming up with a presentation necessitates that the majority of the effort goes into the content and the message you intend to convey. The visuals of a PowerPoint presentation can only be effective if it supplements and supports the story that is being told. Keeping this in mind our experts created Rebranding Brand Fresh Face Development Performance Metrics Dashboard To Track Overall Rules PDF to reduce the time that goes into designing the presentation. This way, you can concentrate on the message while our designers take care of providing you with the right template for the situation.
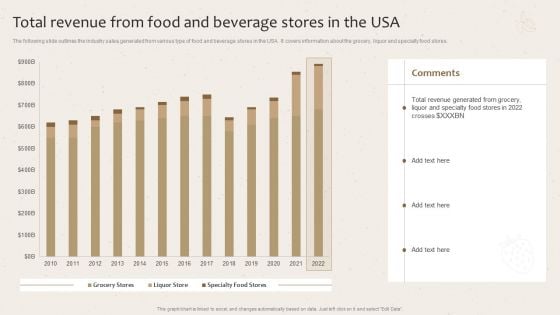
Total Revenue From Food And Beverage Stores In The Usa Launching New Beverage Product Mockup PDF
The following slide outlines the industry sales generated from various type of food and beverage stores in the USA. It covers information about the grocery, liquor and specialty food stores. Coming up with a presentation necessitates that the majority of the effort goes into the content and the message you intend to convey. The visuals of a PowerPoint presentation can only be effective if it supplements and supports the story that is being told. Keeping this in mind our experts created Total Revenue From Food And Beverage Stores In The Usa Launching New Beverage Product Mockup PDF to reduce the time that goes into designing the presentation. This way, you can concentrate on the message while our designers take care of providing you with the right template for the situation.
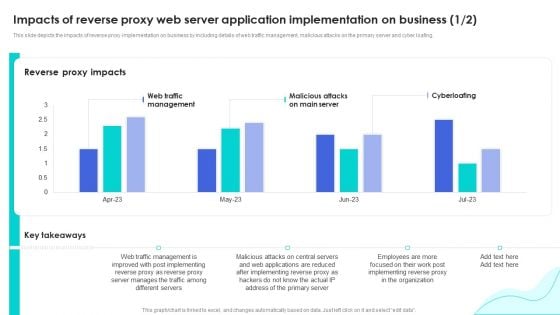
Reverse Proxy Web Server Impacts Of Reverse Proxy Web Server Application Inspiration PDF
This slide depicts the impacts of reverse proxy implementation on business by including details of web traffic management, malicious attacks on the primary server and cyber loafing. Coming up with a presentation necessitates that the majority of the effort goes into the content and the message you intend to convey. The visuals of a PowerPoint presentation can only be effective if it supplements and supports the story that is being told. Keeping this in mind our experts created Reverse Proxy Web Server Impacts Of Reverse Proxy Web Server Application Inspiration PDF to reduce the time that goes into designing the presentation. This way, you can concentrate on the message while our designers take care of providing you with the right template for the situation.
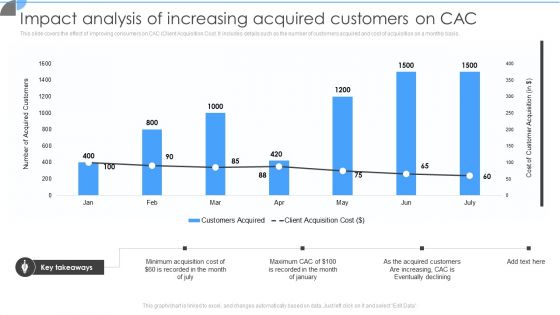
Customer Acquisition Approaches To Enhance Organization Growth Impact Analysis Of Increasing Acquired Customers On CAC Elements PDF
This slide covers the effect of improving consumers on CAC Client Acquisition Cost. It includes details such as the number of customers acquired and cost of acquisition on a monthly basis. Coming up with a presentation necessitates that the majority of the effort goes into the content and the message you intend to convey. The visuals of a PowerPoint presentation can only be effective if it supplements and supports the story that is being told. Keeping this in mind our experts created Customer Acquisition Approaches To Enhance Organization Growth Impact Analysis Of Increasing Acquired Customers On CAC Elements PDF to reduce the time that goes into designing the presentation. This way, you can concentrate on the message while our designers take care of providing you with the right template for the situation.
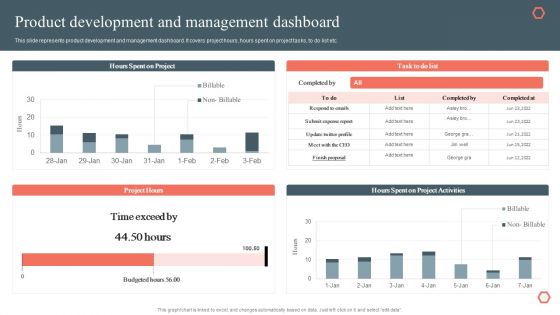
Product Development And Management Dashboard Product Development And Management Plan Brochure PDF
This slide represents product development and management dashboard. It covers project hours, hours spent on project tasks, to do list etc.Coming up with a presentation necessitates that the majority of the effort goes into the content and the message you intend to convey. The visuals of a PowerPoint presentation can only be effective if it supplements and supports the story that is being told. Keeping this in mind our experts created Product Development And Management Dashboard Product Development And Management Plan Brochure PDF to reduce the time that goes into designing the presentation. This way, you can concentrate on the message while our designers take care of providing you with the right template for the situation.
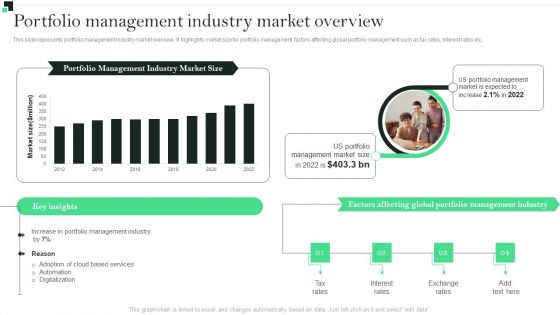
Portfolio Management Industry Market Overview Strategies To Enhance Portfolio Management Elements PDF
This slide represents portfolio management industry market overview. It highlights market size for portfolio management, factors affecting global portfolio management such as tax rates, interest rates etc.Coming up with a presentation necessitates that the majority of the effort goes into the content and the message you intend to convey. The visuals of a PowerPoint presentation can only be effective if it supplements and supports the story that is being told. Keeping this in mind our experts created Portfolio Management Industry Market Overview Strategies To Enhance Portfolio Management Elements PDF to reduce the time that goes into designing the presentation. This way, you can concentrate on the message while our designers take care of providing you with the right template for the situation.
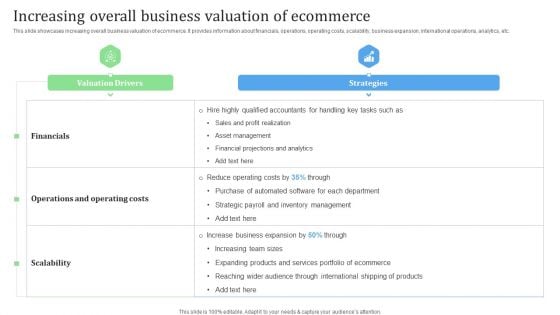
Increasing Overall Business Valuation Of Ecommerce Financial Management Strategies Inspiration PDF
This slide showcases increasing overall business valuation of ecommerce. It provides information about financials, operations, operating costs, scalability, business expansion, international operations, analytics, etc. Coming up with a presentation necessitates that the majority of the effort goes into the content and the message you intend to convey. The visuals of a PowerPoint presentation can only be effective if it supplements and supports the story that is being told. Keeping this in mind our experts created Increasing Overall Business Valuation Of Ecommerce Financial Management Strategies Inspiration PDF to reduce the time that goes into designing the presentation. This way, you can concentrate on the message while our designers take care of providing you with the right template for the situation.
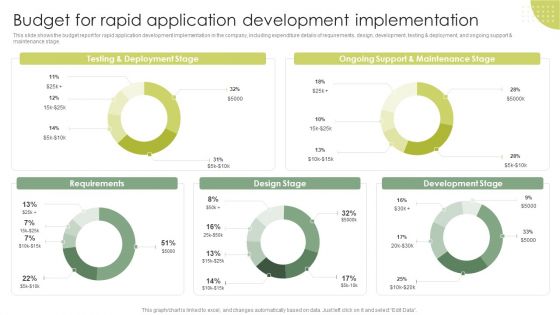
Budget For Rapid Application Development Implementation Rapid Application Building RAB Model Structure PDF
This slide shows the budget report for rapid application development implementation in the company, including expenditure details of requirements, design, development, testing and deployment, and ongoing support maintenance stage. Slidegeeks is one of the best resources for PowerPoint templates. You can download easily and regulate Budget For Rapid Application Development Implementation Rapid Application Building RAB Model Structure PDF for your personal presentations from our wonderful collection. A few clicks is all it takes to discover and get the most relevant and appropriate templates. Use our Templates to add a unique zing and appeal to your presentation and meetings. All the slides are easy to edit and you can use them even for advertisement purposes.
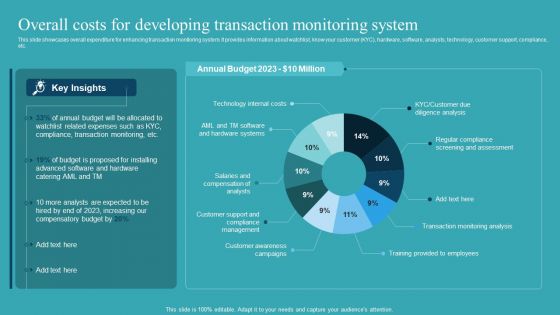
Integrating AML And Transaction Overall Costs For Developing Transaction Information PDF
This slide showcases overall expenditure for enhancing transaction monitoring system. It provides information about watchlist, know your customer KYC, hardware, software, analysts, technology, customer support, compliance, etc. Presenting this PowerPoint presentation, titled Integrating AML And Transaction Overall Costs For Developing Transaction Information PDF, with topics curated by our researchers after extensive research. This editable presentation is available for immediate download and provides attractive features when used. Download now and captivate your audience. Presenting this Integrating AML And Transaction Overall Costs For Developing Transaction Information PDF. Our researchers have carefully researched and created these slides with all aspects taken into consideration. This is a completely customizable Integrating AML And Transaction Overall Costs For Developing Transaction Information PDF that is available for immediate downloading. Download now and make an impact on your audience. Highlight the attractive features available with our PPTs.
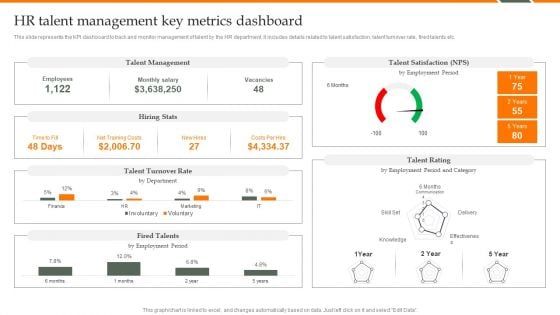
Human Resource Analytics HR Talent Management Key Metrics Dashboard Brochure PDF
This slide represents the KPI dashboard to track and monitor management of talent by the HR department. It includes details related to talent satisfaction, talent turnover rate, fired talents etc. Coming up with a presentation necessitates that the majority of the effort goes into the content and the message you intend to convey. The visuals of a PowerPoint presentation can only be effective if it supplements and supports the story that is being told. Keeping this in mind our experts created Human Resource Analytics HR Talent Management Key Metrics Dashboard Brochure PDF to reduce the time that goes into designing the presentation. This way, you can concentrate on the message while our designers take care of providing you with the right template for the situation.

Targeted Marketing Strategic Plan For Audience Engagement Strategies Used By Marketers For Personalizing Email Campaigns Template PDF
This slide showcases various strategies that are implemented by marketers for email campaigns personalization. It includes tailored messaging, triggered emails, product recommendations in email etc. Coming up with a presentation necessitates that the majority of the effort goes into the content and the message you intend to convey. The visuals of a PowerPoint presentation can only be effective if it supplements and supports the story that is being told. Keeping this in mind our experts created Targeted Marketing Strategic Plan For Audience Engagement Strategies Used By Marketers For Personalizing Email Campaigns Template PDF to reduce the time that goes into designing the presentation. This way, you can concentrate on the message while our designers take care of providing you with the right template for the situation.
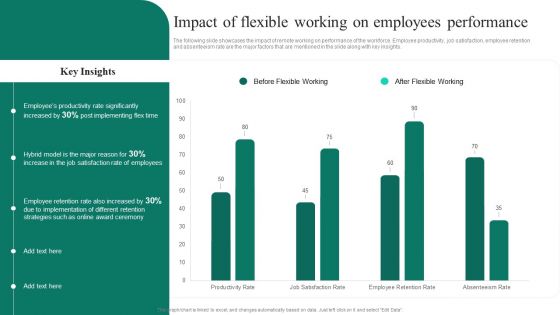
Adopting Flexible Work Policy Impact Of Flexible Working On Employees Performance Ideas PDF
The following slide showcases the impact of remote working on performance of the workforce. Employee productivity, job satisfaction, employee retention and absenteeism rate are the major factors that are mentioned in the slide along with key insights. Coming up with a presentation necessitates that the majority of the effort goes into the content and the message you intend to convey. The visuals of a PowerPoint presentation can only be effective if it supplements and supports the story that is being told. Keeping this in mind our experts created Adopting Flexible Work Policy Impact Of Flexible Working On Employees Performance Ideas PDF to reduce the time that goes into designing the presentation. This way, you can concentrate on the message while our designers take care of providing you with the right template for the situation.
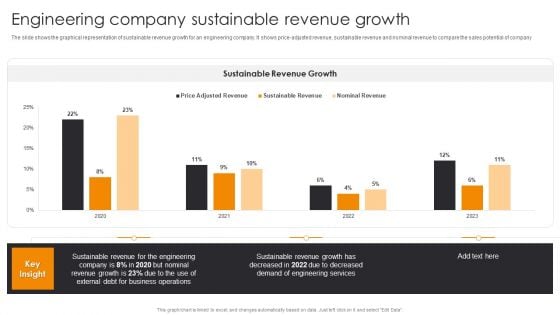
Engineering Company Sustainable Revenue Growth Engineering Company Financial Analysis Report Clipart PDF
The slide shows the graphical representation of sustainable revenue growth for an engineering company. It shows price-adjusted revenue, sustainable revenue and nominal revenue to compare the sales potential of company. Coming up with a presentation necessitates that the majority of the effort goes into the content and the message you intend to convey. The visuals of a PowerPoint presentation can only be effective if it supplements and supports the story that is being told. Keeping this in mind our experts created Engineering Company Sustainable Revenue Growth Engineering Company Financial Analysis Report Clipart PDF to reduce the time that goes into designing the presentation. This way, you can concentrate on the message while our designers take care of providing you with the right template for the situation.
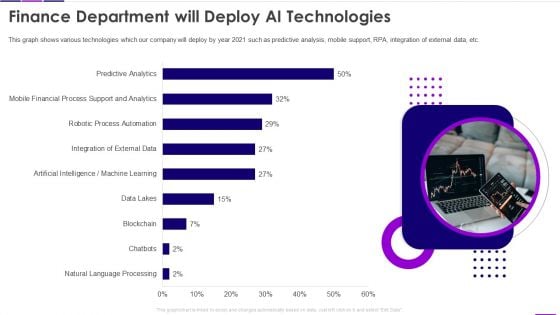
Transforming Business With AI Finance Department Will Deploy AI Technologies Infographics PDF
This graph shows various technologies which our company will deploy by year 2021 such as predictive analysis, mobile support, RPA, integration of external data, etc. Get a simple yet stunning designed Transforming Business With AI Finance Department Will Deploy AI Technologies Infographics PDF. It is the best one to establish the tone in your meetings. It is an excellent way to make your presentations highly effective. So, download this PPT today from Slidegeeks and see the positive impacts. Our easy to edit Transforming Business With AI Finance Department Will Deploy AI Technologies Infographics PDF can be your go to option for all upcoming conferences and meetings. So, what are you waiting for Grab this template today.
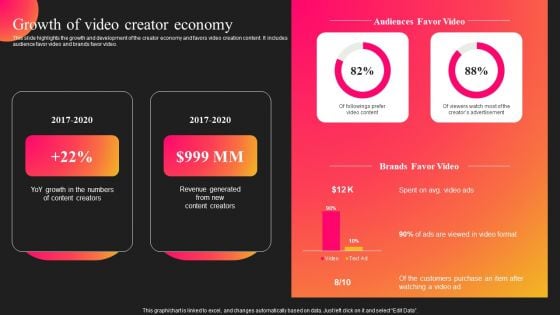
Curastory Editing Platform Pitch Deck Growth Of Video Creator Economy Template PDF
This slide highlights the growth and development of the creator economy and favors video creation content. It includes audience favor video and brands favor video. Coming up with a presentation necessitates that the majority of the effort goes into the content and the message you intend to convey. The visuals of a PowerPoint presentation can only be effective if it supplements and supports the story that is being told. Keeping this in mind our experts created Curastory Editing Platform Pitch Deck Growth Of Video Creator Economy Template PDF to reduce the time that goes into designing the presentation. This way, you can concentrate on the message while our designers take care of providing you with the right template for the situation.
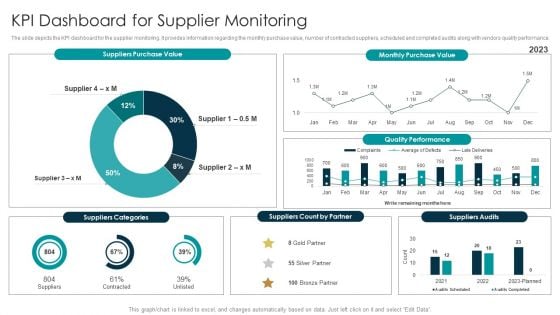
Tactical Approach For Vendor Reskilling KPI Dashboard For Supplier Monitoring Slides PDF
The slide depicts the KPI dashboard for the supplier monitoring. It provides information regarding the monthly purchase value, number of contracted suppliers, scheduled and completed audits along with vendors quality performance. Coming up with a presentation necessitates that the majority of the effort goes into the content and the message you intend to convey. The visuals of a PowerPoint presentation can only be effective if it supplements and supports the story that is being told. Keeping this in mind our experts created Tactical Approach For Vendor Reskilling KPI Dashboard For Supplier Monitoring Slides PDF to reduce the time that goes into designing the presentation. This way, you can concentrate on the message while our designers take care of providing you with the right template for the situation.
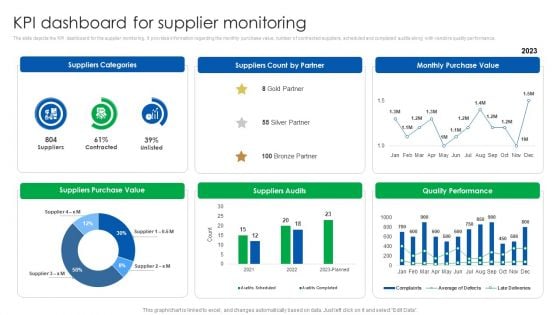
Vendor Relationship Management Strategic Plan KPI Dashboard For Supplier Monitoring Infographics PDF
The slide depicts the KPI dashboard for the supplier monitoring. It provides information regarding the monthly purchase value, number of contracted suppliers, scheduled and completed audits along with vendors quality performance. Coming up with a presentation necessitates that the majority of the effort goes into the content and the message you intend to convey. The visuals of a PowerPoint presentation can only be effective if it supplements and supports the story that is being told. Keeping this in mind our experts created Vendor Relationship Management Strategic Plan KPI Dashboard For Supplier Monitoring Infographics PDF to reduce the time that goes into designing the presentation. This way, you can concentrate on the message while our designers take care of providing you with the right template for the situation.

Competitor Assessment To Determine Companys Share Competitor Analysis Based On Companys Market Share Formats PDF
This slide covers the graphical representation of competitors market share. It also includes key takeaways such as market share of top competitors which is almost double of most others. Coming up with a presentation necessitates that the majority of the effort goes into the content and the message you intend to convey. The visuals of a PowerPoint presentation can only be effective if it supplements and supports the story that is being told. Keeping this in mind our experts created Competitor Assessment To Determine Companys Share Competitor Analysis Based On Companys Market Share Formats PDF to reduce the time that goes into designing the presentation. This way, you can concentrate on the message while our designers take care of providing you with the right template for the situation.
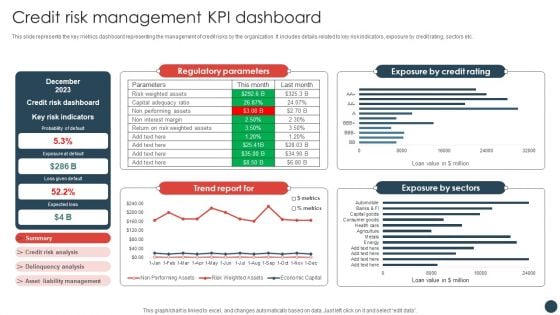
Strategic Risk Management Plan Credit Risk Management KPI Dashboard Information PDF
This slide represents the key metrics dashboard representing the management of credit risks by the organization. It includes details related to key risk indicators, exposure by credit rating, sectors etc.Coming up with a presentation necessitates that the majority of the effort goes into the content and the message you intend to convey. The visuals of a PowerPoint presentation can only be effective if it supplements and supports the story that is being told. Keeping this in mind our experts created Strategic Risk Management Plan Credit Risk Management KPI Dashboard Information PDF to reduce the time that goes into designing the presentation. This way, you can concentrate on the message while our designers take care of providing you with the right template for the situation.
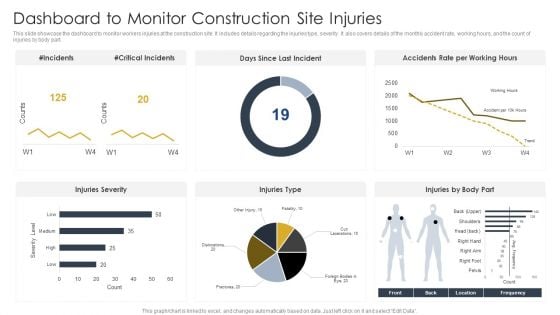
Dashboard To Monitor Construction Site Injuries Construction Site Safety Plan Elements PDF
This slide showcase the dashboard to monitor workers injuries at the construction site. It includes details regarding the injuries type, severity. It also covers details of the monthly accident rate, working hours, and the count of injuries by body part. Coming up with a presentation necessitates that the majority of the effort goes into the content and the message you intend to convey. The visuals of a PowerPoint presentation can only be effective if it supplements and supports the story that is being told. Keeping this in mind our experts created Dashboard To Monitor Construction Site Injuries Construction Site Safety Plan Elements PDF to reduce the time that goes into designing the presentation. This way, you can concentrate on the message while our designers take care of providing you with the right template for the situation.
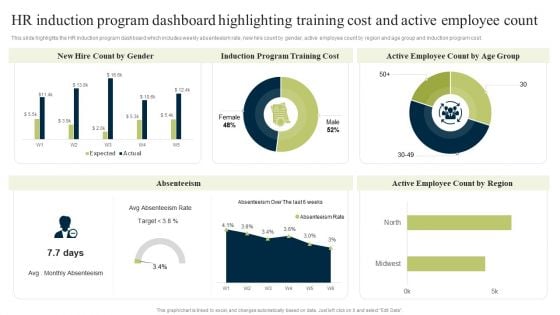
New Staff Onboarding Program HR Induction Program Dashboard Highlighting Training Cost And Active Employee Count Graphics PDF
This slide highlights the HR induction program dashboard which includes weekly absenteeism rate, new hire count by gender, active employee count by region and age group and induction program cost. Coming up with a presentation necessitates that the majority of the effort goes into the content and the message you intend to convey. The visuals of a PowerPoint presentation can only be effective if it supplements and supports the story that is being told. Keeping this in mind our experts created New Staff Onboarding Program HR Induction Program Dashboard Highlighting Training Cost And Active Employee Count Graphics PDF to reduce the time that goes into designing the presentation. This way, you can concentrate on the message while our designers take care of providing you with the right template for the situation.
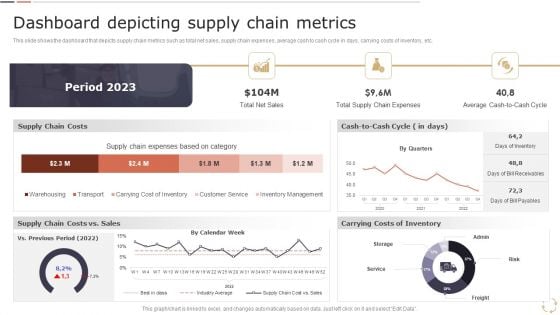
Optimizing Logistics Models To Enhance Supply Chain Management Dashboard Depicting Supply Chain Metrics Download PDF
This slide shows the dashboard that depicts supply chain metrics such as total net sales, supply chain expenses, average cash to cash cycle in days, carrying costs of inventory, etc. Coming up with a presentation necessitates that the majority of the effort goes into the content and the message you intend to convey. The visuals of a PowerPoint presentation can only be effective if it supplements and supports the story that is being told. Keeping this in mind our experts created Optimizing Logistics Models To Enhance Supply Chain Management Dashboard Depicting Supply Chain Metrics Download PDF to reduce the time that goes into designing the presentation. This way, you can concentrate on the message while our designers take care of providing you with the right template for the situation.
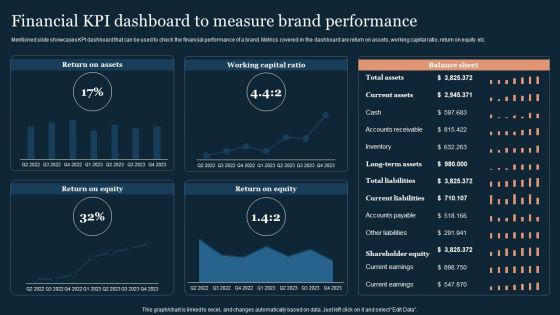
Guide To Develop And Estimate Brand Value Financial KPI Dashboard To Measure Brand Performance Formats PDF
Mentioned slide showcases KPI dashboard that can be used to check the financial performance of a brand. Metrics covered in the dashboard are return on assets, working capital ratio, return on equity etc.Coming up with a presentation necessitates that the majority of the effort goes into the content and the message you intend to convey. The visuals of a PowerPoint presentation can only be effective if it supplements and supports the story that is being told. Keeping this in mind our experts created Guide To Develop And Estimate Brand Value Financial KPI Dashboard To Measure Brand Performance Formats PDF to reduce the time that goes into designing the presentation. This way, you can concentrate on the message while our designers take care of providing you with the right template for the situation.
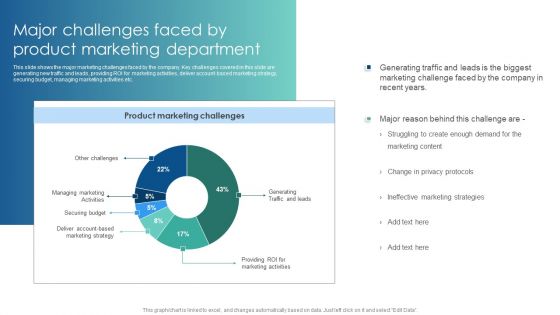
Major Challenges Faced By Product Marketing Department Customer Acquisition Through Advertising Pictures PDF
This slide shows the major marketing challenges faced by the company. Key challenges covered in this slide are generating new traffic and leads, providing ROI for marketing activities, deliver account based marketing strategy, securing budget, managing marketing activities etc. Coming up with a presentation necessitates that the majority of the effort goes into the content and the message you intend to convey. The visuals of a PowerPoint presentation can only be effective if it supplements and supports the story that is being told. Keeping this in mind our experts created Major Challenges Faced By Product Marketing Department Customer Acquisition Through Advertising Pictures PDF to reduce the time that goes into designing the presentation. This way, you can concentrate on the message while our designers take care of providing you with the right template for the situation.
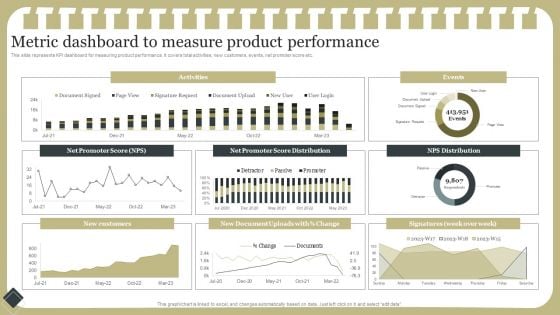
Effective Product Development Strategy Metric Dashboard To Measure Product Performance Information PDF
This slide represents KPI dashboard for measuring product performance. It covers total activities, new customers, events, net promoter score etc.Coming up with a presentation necessitates that the majority of the effort goes into the content and the message you intend to convey. The visuals of a PowerPoint presentation can only be effective if it supplements and supports the story that is being told. Keeping this in mind our experts created Effective Product Development Strategy Metric Dashboard To Measure Product Performance Information PDF to reduce the time that goes into designing the presentation. This way, you can concentrate on the message while our designers take care of providing you with the right template for the situation.
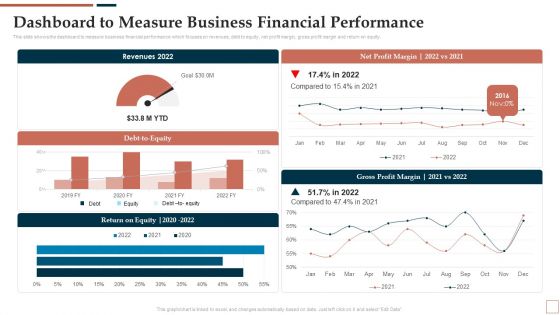
BPR To Develop Operational Effectiveness Dashboard To Measure Business Financial Performance Elements PDF
This slide shows the dashboard to measure business financial performance which focuses on revenues, debt to equity, net profit margin, gross profit margin and return on equity. Coming up with a presentation necessitates that the majority of the effort goes into the content and the message you intend to convey. The visuals of a PowerPoint presentation can only be effective if it supplements and supports the story that is being told. Keeping this in mind our experts created BPR To Develop Operational Effectiveness Dashboard To Measure Business Financial Performance Elements PDF to reduce the time that goes into designing the presentation. This way, you can concentrate on the message while our designers take care of providing you with the right template for the situation.
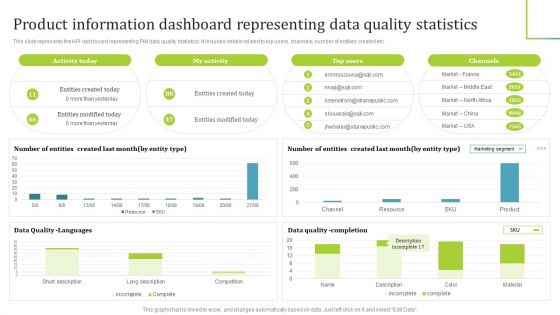
PIM Software Deployment To Enhance Conversion Rates Product Information Dashboard Representing Data Quality Statistics Download PDF
This slide represents the KPI dashboard representing PIM data quality statistics. It includes details related to top users, channels, number of entities created etc. Coming up with a presentation necessitates that the majority of the effort goes into the content and the message you intend to convey. The visuals of a PowerPoint presentation can only be effective if it supplements and supports the story that is being told. Keeping this in mind our experts created PIM Software Deployment To Enhance Conversion Rates Product Information Dashboard Representing Data Quality Statistics Download PDF to reduce the time that goes into designing the presentation. This way, you can concentrate on the message while our designers take care of providing you with the right template for the situation.
Elastic NLB Network Load Balancers Performance Tracker Dashboard Background PDF
This slide shows the dashboard for tracking the network load balancers performance by covering details of balancer status, balancer session, balancer throughput, etc. Coming up with a presentation necessitates that the majority of the effort goes into the content and the message you intend to convey. The visuals of a PowerPoint presentation can only be effective if it supplements and supports the story that is being told. Keeping this in mind our experts created Elastic NLB Network Load Balancers Performance Tracker Dashboard Background PDF to reduce the time that goes into designing the presentation. This way, you can concentrate on the message while our designers take care of providing you with the right template for the situation.
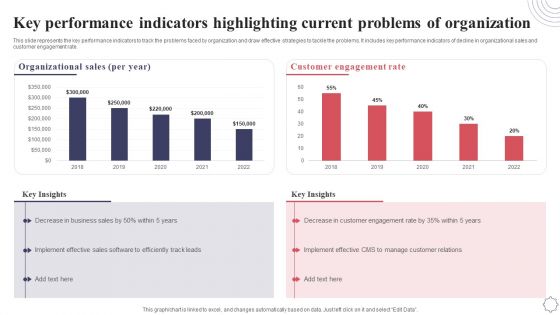
Key Performance Indicators Highlighting Current Problems Of Organization Application Deployment Project Plan Rules PDF
This slide represents the key performance indicators to track the problems faced by organization and draw effective strategies to tackle the problems. It includes key performance indicators of decline in organizational sales and customer engagement rate. Coming up with a presentation necessitates that the majority of the effort goes into the content and the message you intend to convey. The visuals of a PowerPoint presentation can only be effective if it supplements and supports the story that is being told. Keeping this in mind our experts created Key Performance Indicators Highlighting Current Problems Of Organization Application Deployment Project Plan Rules PDF to reduce the time that goes into designing the presentation. This way, you can concentrate on the message while our designers take care of providing you with the right template for the situation.
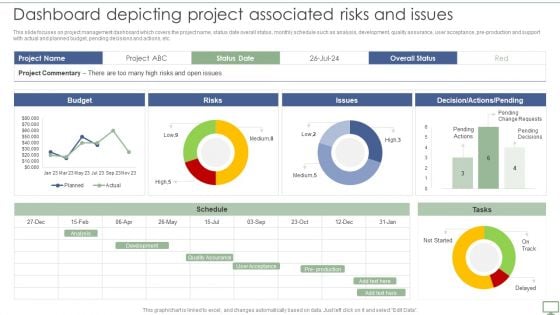
Procedure To Establish Project Administration Program Dashboard Depicting Project Associated Risks And Issues Mockup PDF
This slide focuses on project management dashboard which covers the project name, status date overall status, monthly schedule such as analysis, development, quality assurance, user acceptance, pre production and support with actual and planned budget, pending decisions and actions, etc. Get a simple yet stunning designed Procedure To Establish Project Administration Program Dashboard Depicting Project Associated Risks And Issues Mockup PDF. It is the best one to establish the tone in your meetings. It is an excellent way to make your presentations highly effective. So, download this PPT today from Slidegeeks and see the positive impacts. Our easy to edit Procedure To Establish Project Administration Program Dashboard Depicting Project Associated Risks And Issues Mockup PDF can be your go to option for all upcoming conferences and meetings. So, what are you waiting for. Grab this template today.
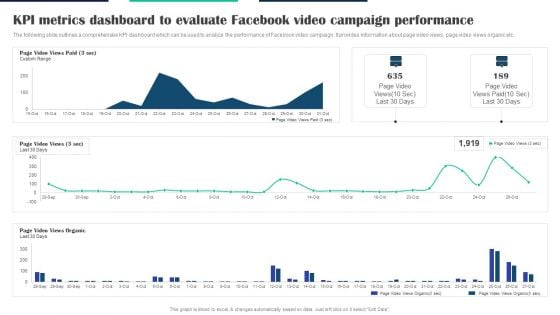
Executing Video Promotional KPI Metrics Dashboard To Evaluate Facebook Video Campaign Summary PDF
The following slide outlines a comprehensive KPI dashboard which can be used to analyze the performance of Facebook video campaign. It provides information about page video views, page video views organic etc. Coming up with a presentation necessitates that the majority of the effort goes into the content and the message you intend to convey. The visuals of a PowerPoint presentation can only be effective if it supplements and supports the story that is being told. Keeping this in mind our experts created Executing Video Promotional KPI Metrics Dashboard To Evaluate Facebook Video Campaign Summary PDF to reduce the time that goes into designing the presentation. This way, you can concentrate on the message while our designers take care of providing you with the right template for the situation.
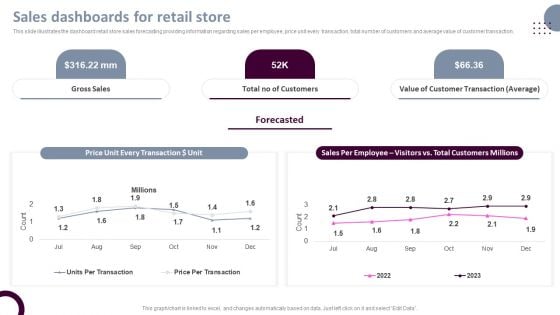
Retail Store Operations Sales Dashboards For Retail Store Structure PDF
This slide illustrates the dashboard retail store sales forecasting providing information regarding sales per employee, price unit every transaction, total number of customers and average value of customer transaction. Coming up with a presentation necessitates that the majority of the effort goes into the content and the message you intend to convey. The visuals of a PowerPoint presentation can only be effective if it supplements and supports the story that is being told. Keeping this in mind our experts created Retail Store Operations Sales Dashboards For Retail Store Structure PDF to reduce the time that goes into designing the presentation. This way, you can concentrate on the message while our designers take care of providing you with the right template for the situation.
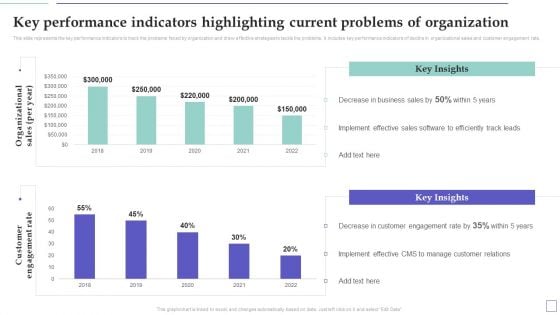
System Deployment Project Key Performance Indicators Highlighting Current Problems Information PDF
This slide represents the key performance indicators to track the problems faced by organization and draw effective strategies to tackle the problems. It includes key performance indicators of decline in organizational sales and customer engagement rate. Coming up with a presentation necessitates that the majority of the effort goes into the content and the message you intend to convey. The visuals of a PowerPoint presentation can only be effective if it supplements and supports the story that is being told. Keeping this in mind our experts created System Deployment Project Key Performance Indicators Highlighting Current Problems Information PDF to reduce the time that goes into designing the presentation. This way, you can concentrate on the message while our designers take care of providing you with the right template for the situation.
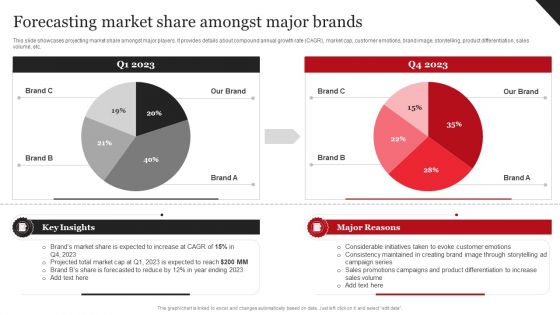
Coca Cola Emotional Marketing Strategy Forecasting Market Share Amongst Major Brands Pictures PDF
This slide showcases projecting market share amongst major players. It provides details about compound annual growth rate CAGR, market cap, customer emotions, brand image, storytelling, product differentiation, sales volume, etc. Coming up with a presentation necessitates that the majority of the effort goes into the content and the message you intend to convey. The visuals of a PowerPoint presentation can only be effective if it supplements and supports the story that is being told. Keeping this in mind our experts created Coca Cola Emotional Marketing Strategy Forecasting Market Share Amongst Major Brands Pictures PDF to reduce the time that goes into designing the presentation. This way, you can concentrate on the message while our designers take care of providing you with the right template for the situation.
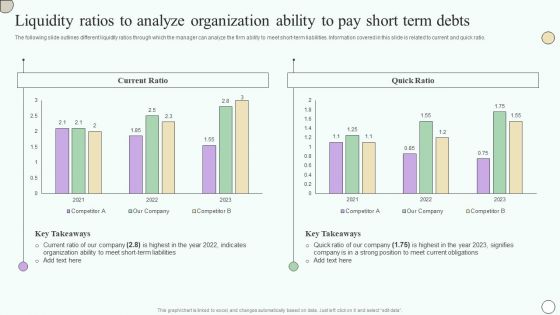
Estimating Business Overall Liquidity Ratios To Analyze Organization Ability To Pay Short Introduction PDF
The following slide outlines different liquidity ratios through which the manager can analyze the firm ability to meet short-term liabilities. Information covered in this slide is related to current and quick ratio. Coming up with a presentation necessitates that the majority of the effort goes into the content and the message you intend to convey. The visuals of a PowerPoint presentation can only be effective if it supplements and supports the story that is being told. Keeping this in mind our experts created Estimating Business Overall Liquidity Ratios To Analyze Organization Ability To Pay Short Introduction PDF to reduce the time that goes into designing the presentation. This way, you can concentrate on the message while our designers take care of providing you with the right template for the situation.
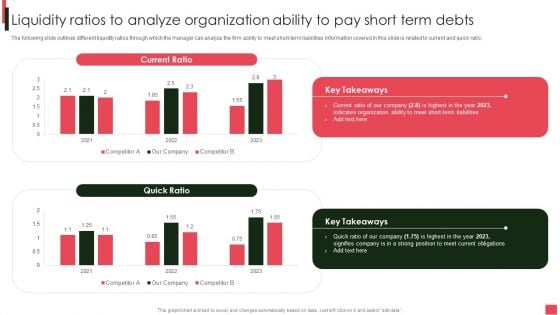
Overview Of Organizational Liquidity Ratios To Analyze Organization Ability To Pay Short Summary PDF
The following slide outlines different liquidity ratios through which the manager can analyze the firm ability to meet short-term liabilities. Information covered in this slide is related to current and quick ratio. Coming up with a presentation necessitates that the majority of the effort goes into the content and the message you intend to convey. The visuals of a PowerPoint presentation can only be effective if it supplements and supports the story that is being told. Keeping this in mind our experts created Overview Of Organizational Liquidity Ratios To Analyze Organization Ability To Pay Short Summary PDF to reduce the time that goes into designing the presentation. This way, you can concentrate on the message while our designers take care of providing you with the right template for the situation.
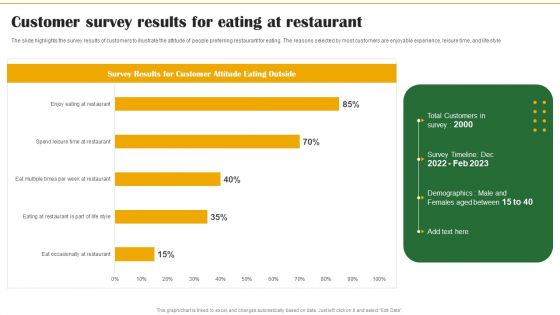
Food Organization Financial Trends Customer Survey Results For Eating At Restaurant Formats PDF
The slide highlights the survey results of customers to illustrate the attitude of people preferring restaurant for eating. The reasons selected by most customers are enjoyable experience, leisure time, and life style. Coming up with a presentation necessitates that the majority of the effort goes into the content and the message you intend to convey. The visuals of a PowerPoint presentation can only be effective if it supplements and supports the story that is being told. Keeping this in mind our experts created Food Organization Financial Trends Customer Survey Results For Eating At Restaurant Formats PDF to reduce the time that goes into designing the presentation. This way, you can concentrate on the message while our designers take care of providing you with the right template for the situation.
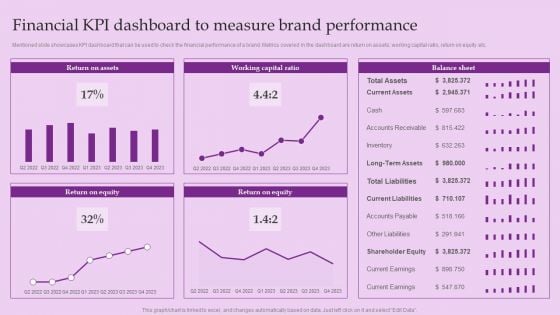
Financial KPI Dashboard To Measure Brand Performance Brand And Equity Evaluation Techniques Elements PDF
Mentioned slide showcases KPI dashboard that can be used to check the financial performance of a brand. Metrics covered in the dashboard are return on assets, working capital ratio, return on equity etc.Coming up with a presentation necessitates that the majority of the effort goes into the content and the message you intend to convey. The visuals of a PowerPoint presentation can only be effective if it supplements and supports the story that is being told. Keeping this in mind our experts created Financial KPI Dashboard To Measure Brand Performance Brand And Equity Evaluation Techniques Elements PDF to reduce the time that goes into designing the presentation. This way, you can concentrate on the message while our designers take care of providing you with the right template for the situation.
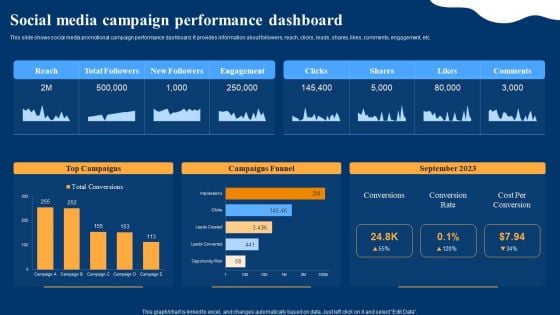
Optimizing Social Networks Social Media Campaign Performance Dashboard Guidelines PDF
This slide shows social media promotional campaign performance dashboard. It provides information about followers, reach, clicks, leads, shares, likes, comments, engagement, etc. Coming up with a presentation necessitates that the majority of the effort goes into the content and the message you intend to convey. The visuals of a PowerPoint presentation can only be effective if it supplements and supports the story that is being told. Keeping this in mind our experts created Optimizing Social Networks Social Media Campaign Performance Dashboard Guidelines PDF to reduce the time that goes into designing the presentation. This way, you can concentrate on the message while our designers take care of providing you with the right template for the situation.
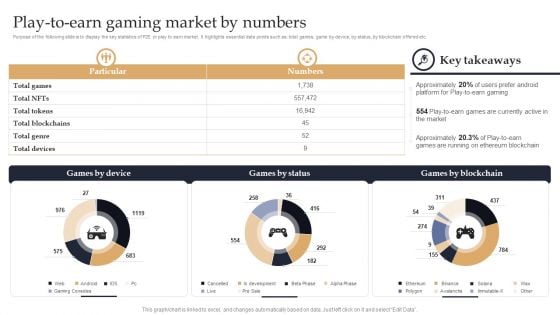
Web 3 0 Blockchain Based P2E Mobile Game Sector Report Promotional Plan Play To Earn Gaming Market By Numbers Summary PDF
Purpose of the following slide is to display the key statistics of P2E or play to earn market. It highlights essential data points such as total games, game by device, by status, by blockchain offered etc. Coming up with a presentation necessitates that the majority of the effort goes into the content and the message you intend to convey. The visuals of a PowerPoint presentation can only be effective if it supplements and supports the story that is being told. Keeping this in mind our experts created Web 3 0 Blockchain Based P2E Mobile Game Sector Report Promotional Plan Play To Earn Gaming Market By Numbers Summary PDF to reduce the time that goes into designing the presentation. This way, you can concentrate on the message while our designers take care of providing you with the right template for the situation.
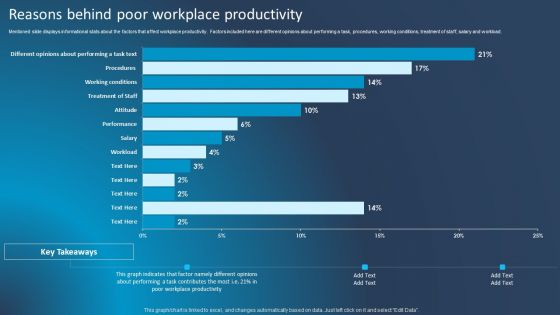
Improving Corporate Performance Reasons Behind Poor Workplace Productivity Designs PDF
Mentioned slide displays informational stats about the factors that affect workplace productivity. Factors included here are different opinions about performing a task, procedures, working conditions, treatment of staff, salary and workload. Coming up with a presentation necessitates that the majority of the effort goes into the content and the message you intend to convey. The visuals of a PowerPoint presentation can only be effective if it supplements and supports the story that is being told. Keeping this in mind our experts created Improving Corporate Performance Reasons Behind Poor Workplace Productivity Designs PDF to reduce the time that goes into designing the presentation. This way, you can concentrate on the message while our designers take care of providing you with the right template for the situation.
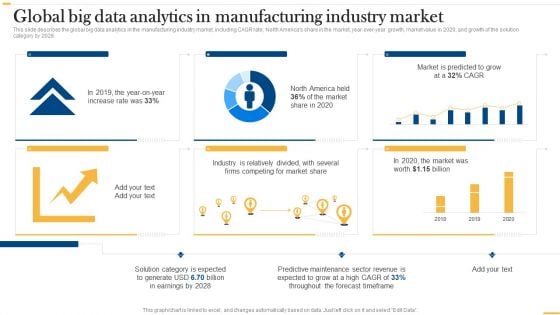
Deploying AI To Enhance Global Big Data Analytics In Manufacturing Industry Market Professional PDF
This slide describes the global big data analytics in the manufacturing industry market, including CAGR rate, North Americas share in the market, year-over-year growth, market value in 2020, and growth of the solution category by 2028. Coming up with a presentation necessitates that the majority of the effort goes into the content and the message you intend to convey. The visuals of a PowerPoint presentation can only be effective if it supplements and supports the story that is being told. Keeping this in mind our experts created Deploying AI To Enhance Global Big Data Analytics In Manufacturing Industry Market Professional PDF to reduce the time that goes into designing the presentation. This way, you can concentrate on the message while our designers take care of providing you with the right template for the situation.
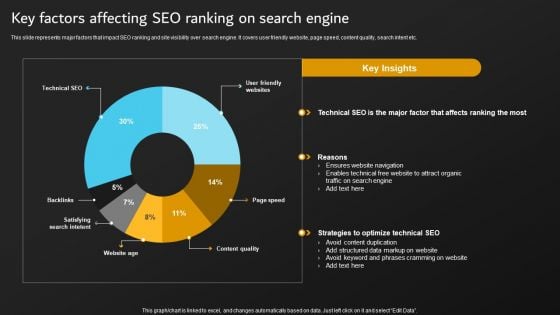
Implementation Of Digital Marketing Key Factors Affecting SEO Ranking On Search Summary PDF
This slide represents major factors that impact SEO ranking and site visibility over search engine. It covers user friendly website, page speed, content quality, search intent etc. Coming up with a presentation necessitates that the majority of the effort goes into the content and the message you intend to convey. The visuals of a PowerPoint presentation can only be effective if it supplements and supports the story that is being told. Keeping this in mind our experts created Implementation Of Digital Marketing Key Factors Affecting SEO Ranking On Search Summary PDF to reduce the time that goes into designing the presentation. This way, you can concentrate on the message while our designers take care of providing you with the right template for the situation.
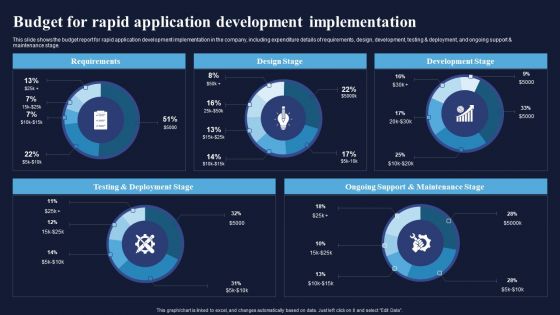
Budget For Rapid Application Development Implementation Integrating RAD Model To Simplify Introduction PDF
This slide shows the budget report for rapid application development implementation in the company, including expenditure details of requirements, design, development, testing and deployment, and ongoing support and maintenance stage. Do you have an important presentation coming up Are you looking for something that will make your presentation stand out from the rest Look no further than Budget For Rapid Application Development Implementation Integrating RAD Model To Simplify Introduction PDF. With our professional designs, you can trust that your presentation will pop and make delivering it a smooth process. And with Slidegeeks, you can trust that your presentation will be unique and memorable. So why wait Grab Budget For Rapid Application Development Implementation Integrating RAD Model To Simplify Introduction PDF today and make your presentation stand out from the rest.
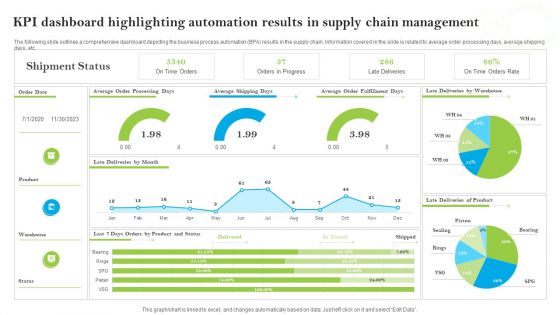
Introducing AI Tools KPI Dashboard Highlighting Automation Results In Supply Chain Portrait PDF
The following slide outlines a comprehensive dashboard depicting the business process automation BPA results in the supply chain. Information covered in the slide is related to average order processing days, average shipping days, etc. Coming up with a presentation necessitates that the majority of the effort goes into the content and the message you intend to convey. The visuals of a PowerPoint presentation can only be effective if it supplements and supports the story that is being told. Keeping this in mind our experts created Introducing AI Tools KPI Dashboard Highlighting Automation Results In Supply Chain Portrait PDF to reduce the time that goes into designing the presentation. This way, you can concentrate on the message while our designers take care of providing you with the right template for the situation.
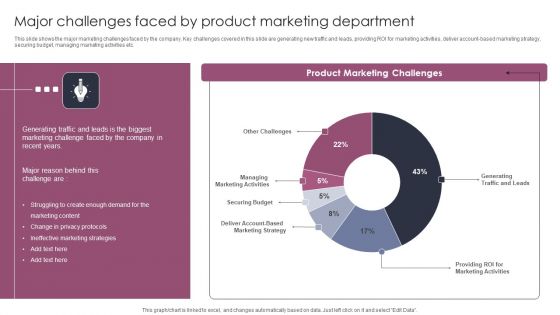
Major Challenges Faced By Product Marketing Department Stages To Develop Demand Generation Tactics Portrait PDF
This slide shows the major marketing challenges faced by the company. Key challenges covered in this slide are generating new traffic and leads, providing ROI for marketing activities, deliver account based marketing strategy, securing budget, managing marketing activities etc. Coming up with a presentation necessitates that the majority of the effort goes into the content and the message you intend to convey. The visuals of a PowerPoint presentation can only be effective if it supplements and supports the story that is being told. Keeping this in mind our experts created Major Challenges Faced By Product Marketing Department Stages To Develop Demand Generation Tactics Portrait PDF to reduce the time that goes into designing the presentation. This way, you can concentrate on the message while our designers take care of providing you with the right template for the situation.
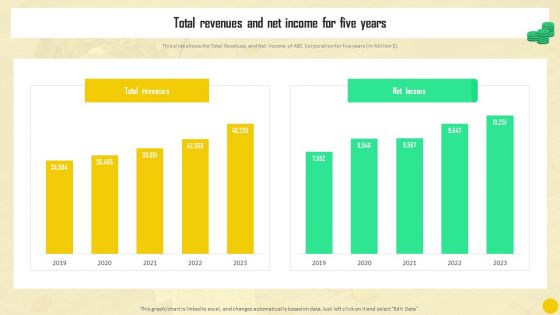
Financial Reporting To Analyze Total Revenues And Net Income For Five Years Guidelines PDF
This slide shows the Total Revenues and Net Income of ABC Corporation for five years in Million dollar Coming up with a presentation necessitates that the majority of the effort goes into the content and the message you intend to convey. The visuals of a PowerPoint presentation can only be effective if it supplements and supports the story that is being told. Keeping this in mind our experts created Financial Reporting To Analyze Total Revenues And Net Income For Five Years Guidelines PDF to reduce the time that goes into designing the presentation. This way, you can concentrate on the message while our designers take care of providing you with the right template for the situation.
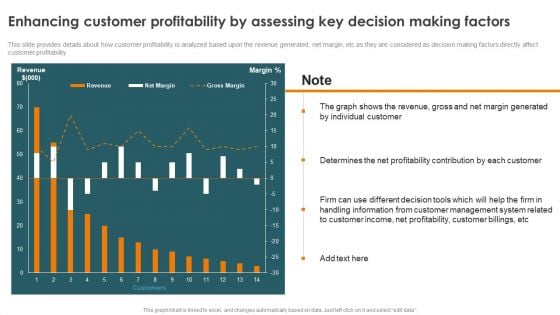
Profitability Modelling Framework Enhancing Customer Profitability By Assessing Key Sample PDF
This slide provides details about how customer profitability is analyzed based upon the revenue generated, net margin, etc as they are considered as decision making factors directly affect customer profitability. Coming up with a presentation necessitates that the majority of the effort goes into the content and the message you intend to convey. The visuals of a PowerPoint presentation can only be effective if it supplements and supports the story that is being told. Keeping this in mind our experts created Profitability Modelling Framework Enhancing Customer Profitability By Assessing Key Sample PDF to reduce the time that goes into designing the presentation. This way, you can concentrate on the message while our designers take care of providing you with the right template for the situation.
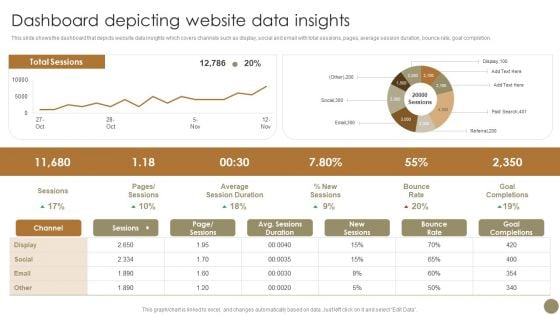
Echniques To Enhance Brand Dashboard Depicting Website Data Insights Clipart PDF
This slide shows the dashboard that depicts website data insights which covers channels such as display, social and email with total sessions, pages, average session duration, bounce rate, goal completion. Coming up with a presentation necessitates that the majority of the effort goes into the content and the message you intend to convey. The visuals of a PowerPoint presentation can only be effective if it supplements and supports the story that is being told. Keeping this in mind our experts created Echniques To Enhance Brand Dashboard Depicting Website Data Insights Clipart PDF to reduce the time that goes into designing the presentation. This way, you can concentrate on the message while our designers take care of providing you with the right template for the situation.
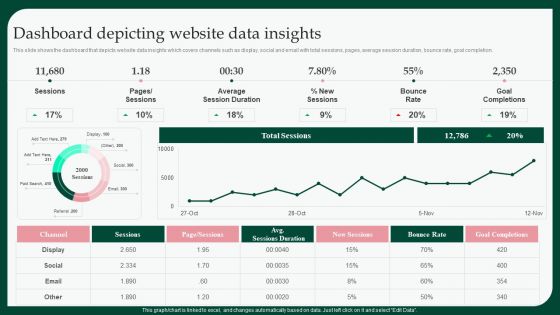
Boosting Product Sales Through Branding Dashboard Depicting Website Data Brochure PDF
This slide shows the dashboard that depicts website data insights which covers channels such as display, social and email with total sessions, pages, average session duration, bounce rate, goal completion. Coming up with a presentation necessitates that the majority of the effort goes into the content and the message you intend to convey. The visuals of a PowerPoint presentation can only be effective if it supplements and supports the story that is being told. Keeping this in mind our experts created Boosting Product Sales Through Branding Dashboard Depicting Website Data Brochure PDF to reduce the time that goes into designing the presentation. This way, you can concentrate on the message while our designers take care of providing you with the right template for the situation.
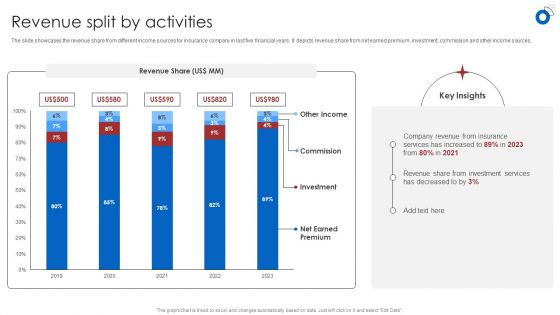
Insurance Business Financial Analysis Revenue Split By Activities Ppt Infographic Template Design Inspiration PDF
The slide showcases the revenue share from different income sources for insurance company in last five financial years. It depicts revenue share from net earned premium, investment, commission and other income sources. Coming up with a presentation necessitates that the majority of the effort goes into the content and the message you intend to convey. The visuals of a PowerPoint presentation can only be effective if it supplements and supports the story that is being told. Keeping this in mind our experts created Insurance Business Financial Analysis Revenue Split By Activities Ppt Infographic Template Design Inspiration PDF to reduce the time that goes into designing the presentation. This way, you can concentrate on the message while our designers take care of providing you with the right template for the situation.
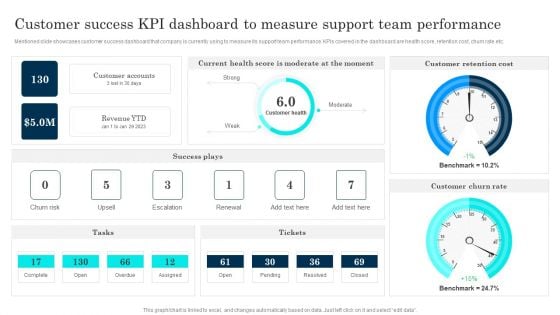
Customer Journey Enhancement Playbook Customer Success KPI Dashboard To Measure Portrait PDF
Mentioned slide showcases customer success dashboard that company is currently using to measure its support team performance. KPIs covered in the dashboard are health score, retention cost, churn rate etc. Slidegeeks is here to make your presentations a breeze with Customer Journey Enhancement Playbook Customer Success KPI Dashboard To Measure Portrait PDF With our easy-to-use and customizable templates, you can focus on delivering your ideas rather than worrying about formatting. With a variety of designs to choose from, youre sure to find one that suits your needs. And with animations and unique photos, illustrations, and fonts, you can make your presentation pop. So whether youre giving a sales pitch or presenting to the board, make sure to check out Slidegeeks first.
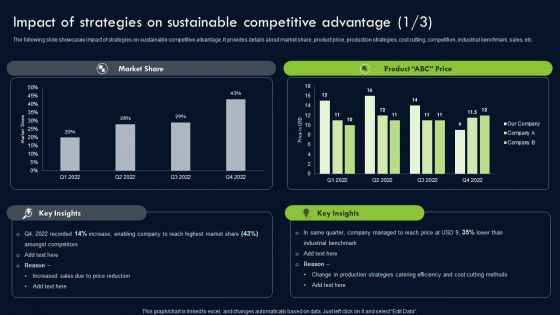
Transforming Sustainability Into Competitive Impact Of Strategies On Sustainable Slides PDF
The following slide showcases impact of strategies on sustainable competitive advantage. It provides details about market share, product price, production strategies, cost cutting, competition, industrial benchmark, sales, etc. Coming up with a presentation necessitates that the majority of the effort goes into the content and the message you intend to convey. The visuals of a PowerPoint presentation can only be effective if it supplements and supports the story that is being told. Keeping this in mind our experts created Transforming Sustainability Into Competitive Impact Of Strategies On Sustainable Slides PDF to reduce the time that goes into designing the presentation. This way, you can concentrate on the message while our designers take care of providing you with the right template for the situation.

Techniques To Monitor Transactions Overall Costs For Developing Transaction Monitoring Graphics PDF
This slide showcases overall expenditure for enhancing transaction monitoring system. It provides information about watchlist, know your customer KYC, hardware, software, analysts, technology, customer support, compliance, etc. This Techniques To Monitor Transactions Overall Costs For Developing Transaction Monitoring Graphics PDF from Slidegeeks makes it easy to present information on your topic with precision. It provides customization options, so you can make changes to the colors, design, graphics, or any other component to create a unique layout. It is also available for immediate download, so you can begin using it right away. Slidegeeks has done good research to ensure that you have everything you need to make your presentation stand out. Make a name out there for a brilliant performance.
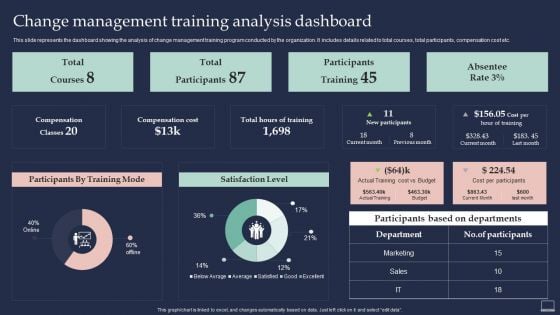
Training Program For Implementing Change Management Training Analysis Dashboard Information PDF
This slide represents the dashboard showing the analysis of change management training program conducted by the organization. It includes details related to total courses, total participants, compensation cost etc. Coming up with a presentation necessitates that the majority of the effort goes into the content and the message you intend to convey. The visuals of a PowerPoint presentation can only be effective if it supplements and supports the story that is being told. Keeping this in mind our experts created Training Program For Implementing Change Management Training Analysis Dashboard Information PDF to reduce the time that goes into designing the presentation. This way, you can concentrate on the message while our designers take care of providing you with the right template for the situation.
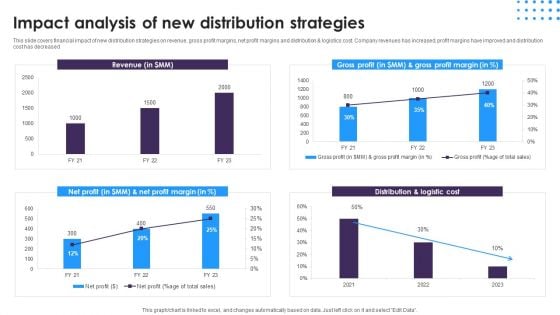
Omnichannel Distribution System To Satisfy Customer Needs Impact Analysis Of New Distribution Strategies Ideas PDF
This slide covers financial impact of new distribution strategies on revenue, gross profit margins, net profit margins and distribution and logistics cost. Company revenues has increased, profit margins have improved and distribution cost has decreased. Coming up with a presentation necessitates that the majority of the effort goes into the content and the message you intend to convey. The visuals of a PowerPoint presentation can only be effective if it supplements and supports the story that is being told. Keeping this in mind our experts created Omnichannel Distribution System To Satisfy Customer Needs Impact Analysis Of New Distribution Strategies Ideas PDF to reduce the time that goes into designing the presentation. This way, you can concentrate on the message while our designers take care of providing you with the right template for the situation.
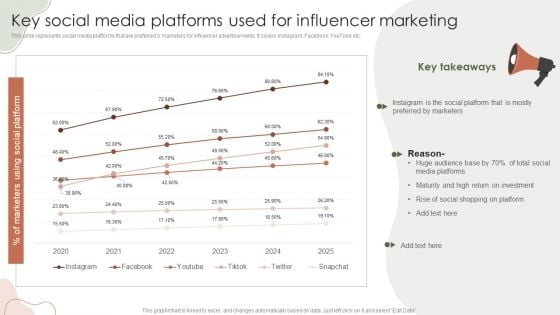
Digital Marketing Approach For Brand Awareness Key Social Media Platforms Used For Influencer Marketing Infographics PDF
This slide represents social media platforms that are preferred b marketers for influencer advertisements. It covers Instagram, Facebook, YouTube etc. Coming up with a presentation necessitates that the majority of the effort goes into the content and the message you intend to convey. The visuals of a PowerPoint presentation can only be effective if it supplements and supports the story that is being told. Keeping this in mind our experts created Digital Marketing Approach For Brand Awareness Key Social Media Platforms Used For Influencer Marketing Infographics PDF to reduce the time that goes into designing the presentation. This way, you can concentrate on the message while our designers take care of providing you with the right template for the situation.
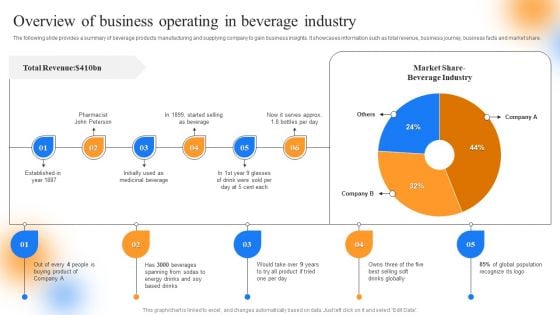
Strategic Guide To Perform Marketing Overview Of Business Operating In Beverage Industry Designs PDF
The following slide provides a summary of beverage products manufacturing and supplying company to gain business insights. It showcases information such as total revenue, business journey, business facts and market share. Coming up with a presentation necessitates that the majority of the effort goes into the content and the message you intend to convey. The visuals of a PowerPoint presentation can only be effective if it supplements and supports the story that is being told. Keeping this in mind our experts created Strategic Guide To Perform Marketing Overview Of Business Operating In Beverage Industry Designs PDF to reduce the time that goes into designing the presentation. This way, you can concentrate on the message while our designers take care of providing you with the right template for the situation.
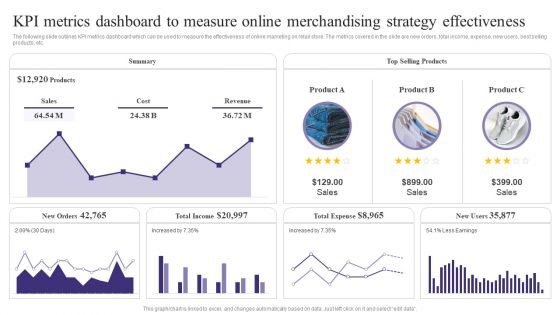
KPI Metrics Dashboard To Measure Online Merchandising Strategy Effectiveness Sample PDF
The following slide outlines KPI metrics dashboard which can be used to measure the effectiveness of online marketing on retail store. The metrics covered in the slide are new orders, total income, expense, new users, best selling products, etc. Coming up with a presentation necessitates that the majority of the effort goes into the content and the message you intend to convey. The visuals of a PowerPoint presentation can only be effective if it supplements and supports the story that is being told. Keeping this in mind our experts created KPI Metrics Dashboard To Measure Online Merchandising Strategy Effectiveness Sample PDF to reduce the time that goes into designing the presentation. This way, you can concentrate on the message while our designers take care of providing you with the right template for the situation.
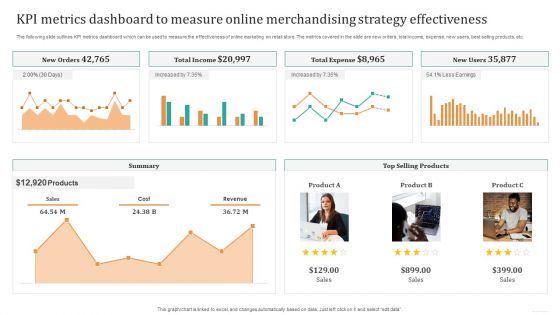
KPI Metrics Dashboard To Measure Online Merchandising Strategy Effectiveness Pictures PDF
The following slide outlines KPI metrics dashboard which can be used to measure the effectiveness of online marketing on retail store. The metrics covered in the slide are new orders, total income, expense, new users, best selling products, etc. Coming up with a presentation necessitates that the majority of the effort goes into the content and the message you intend to convey. The visuals of a PowerPoint presentation can only be effective if it supplements and supports the story that is being told. Keeping this in mind our experts created KPI Metrics Dashboard To Measure Online Merchandising Strategy Effectiveness Pictures PDF to reduce the time that goes into designing the presentation. This way, you can concentrate on the message while our designers take care of providing you with the right template for the situation.

Supply Chain Kpi Dashboard For Effective Financial Analysis Stand Out Digital Supply Chain Tactics Enhancing Graphics PDF
Mentioned slide illustrates KPI dashboard that can be used by managers to assess financial health of supply chain business. KPIs covered are supply chain costs versus sales, cash to order cycle, warehouse operating cost distribution etc.Coming up with a presentation necessitates that the majority of the effort goes into the content and the message you intend to convey. The visuals of a PowerPoint presentation can only be effective if it supplements and supports the story that is being told. Keeping this in mind our experts created Supply Chain Kpi Dashboard For Effective Financial Analysis Stand Out Digital Supply Chain Tactics Enhancing Graphics PDF to reduce the time that goes into designing the presentation. This way, you can concentrate on the message while our designers take care of providing you with the right template for the situation.
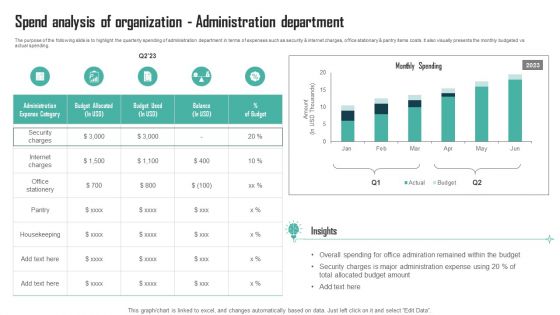
Expenses Management Plan Spend Analysis Of Organization Administration Department Professional PDF
The purpose of the following slide is to highlight the quarterly spending of administration department in terms of expenses such as security and internet charges, office stationary and pantry items costs. It also visually presents the monthly budgeted vs actual spending. Coming up with a presentation necessitates that the majority of the effort goes into the content and the message you intend to convey. The visuals of a PowerPoint presentation can only be effective if it supplements and supports the story that is being told. Keeping this in mind our experts created Expenses Management Plan Spend Analysis Of Organization Administration Department Professional PDF to reduce the time that goes into designing the presentation. This way, you can concentrate on the message while our designers take care of providing you with the right template for the situation.
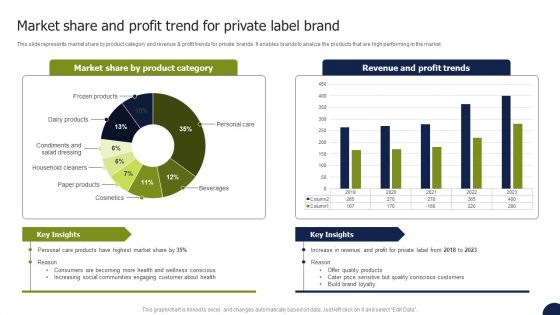
Private Labelling Strategies To Gain Market Share And Profit Trend For Private Label Brand Sample PDF
This slide represents market share by product category and revenue and profit trends for private brands. It enables brands to analyze the products that are high performing in the market. Coming up with a presentation necessitates that the majority of the effort goes into the content and the message you intend to convey. The visuals of a PowerPoint presentation can only be effective if it supplements and supports the story that is being told. Keeping this in mind our experts created Private Labelling Strategies To Gain Market Share And Profit Trend For Private Label Brand Sample PDF to reduce the time that goes into designing the presentation. This way, you can concentrate on the message while our designers take care of providing you with the right template for the situation.

 Home
Home