Hierarchy Chart Organizational
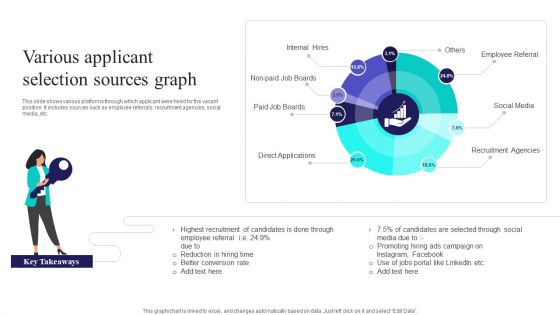
Various Applicant Selection Sources Graph Ppt PowerPoint Presentation Gallery Slide Download PDF
This slide shows various platforms through which applicant were hired for the vacant position. It includes sources such as employee referrals, recruitment agencies, social media, etc. Pitch your topic with ease and precision using this Various Applicant Selection Sources Graph Ppt PowerPoint Presentation Gallery Slide Download PDF. This layout presents information on Internal Hires, Paid Job Boards, Direct Applications. It is also available for immediate download and adjustment. So, changes can be made in the color, design, graphics or any other component to create a unique layout.
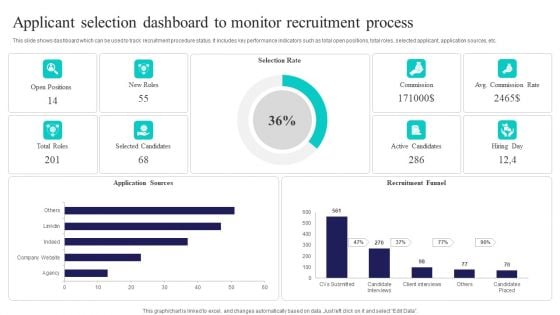
Applicant Selection Dashboard To Monitor Recruitment Process Sample PDF
This slide shows dashboard which can be used to track recruitment procedure status. It includes key performance indicators such as total open positions, total roles, selected applicant, application sources, etc. Pitch your topic with ease and precision using this Applicant Selection Dashboard To Monitor Recruitment Process Sample PDF. This layout presents information on Selection Rate, Recruitment Funnel, Application Sources. It is also available for immediate download and adjustment. So, changes can be made in the color, design, graphics or any other component to create a unique layout.
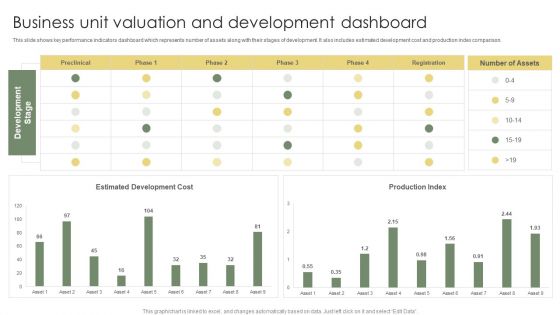
Business Unit Valuation And Development Dashboard Ppt Professional Graphic Tips PDF
This slide shows key performance indicators dashboard which represents number of assets along with their stages of development. It also includes estimated development cost and production index comparison. Pitch your topic with ease and precision using this Business Unit Valuation And Development Dashboard Ppt Professional Graphic Tips PDF. This layout presents information on Estimated Development Cost, Production Index, Development Stage. It is also available for immediate download and adjustment. So, changes can be made in the color, design, graphics or any other component to create a unique layout.
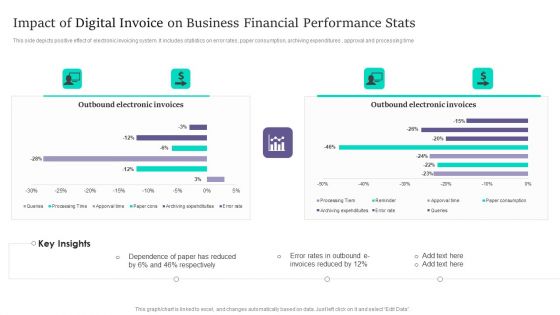
Impact Of Digital Invoice On Business Financial Performance Stats Infographics PDF
This side depicts positive effect of electronic invoicing system. It includes statistics on error rates, paper consumption, archiving expenditures , approval and processing time. Pitch your topic with ease and precision using this Impact Of Digital Invoice On Business Financial Performance Stats Infographics PDF. This layout presents information on Impact Of Digital Invoice, Business Financial Performance Stats. It is also available for immediate download and adjustment. So, changes can be made in the color, design, graphics or any other component to create a unique layout.
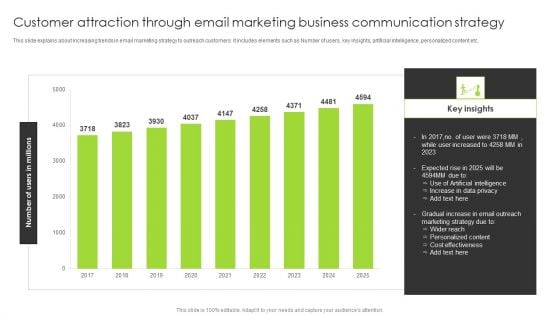
Customer Attraction Through Email Marketing Business Communication Strategy Portrait PDF
This slide explains about increasing trends in email marketing strategy to outreach customers. It includes elements such as Number of users, key insights, artificial intelligence, personalized content etc. Pitch your topic with ease and precision using this Customer Attraction Through Email Marketing Business Communication Strategy Portrait PDF. This layout presents information on Gradual Increase, Email Outreach, Marketing Strategy. It is also available for immediate download and adjustment. So, changes can be made in the color, design, graphics or any other component to create a unique layout.
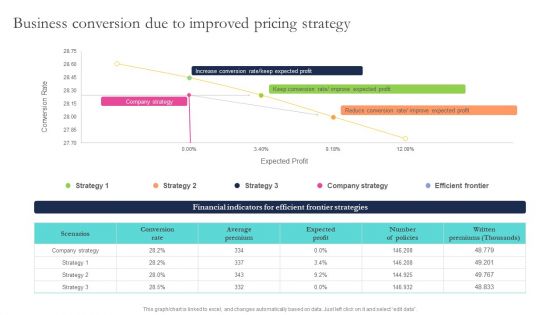
Optimizing Smart Pricing Tactics To Improve Sales Business Conversion Due To Improved Pricing Strategy Summary PDF
This Optimizing Smart Pricing Tactics To Improve Sales Business Conversion Due To Improved Pricing Strategy Summary PDF from Slidegeeks makes it easy to present information on your topic with precision. It provides customization options, so you can make changes to the colors, design, graphics, or any other component to create a unique layout. It is also available for immediate download, so you can begin using it right away. Slidegeeks has done good research to ensure that you have everything you need to make your presentation stand out. Make a name out there for a brilliant performance.
Staff Awareness Playbook Determine Workforce Training Performance Tracking Dashboard Slides PDF
This slide provides information regarding workforce training performance tracking dashboard with training cost, number of participants, hours of training, etc. This Staff Awareness Playbook Determine Workforce Training Performance Tracking Dashboard Slides PDF from Slidegeeks makes it easy to present information on your topic with precision. It provides customization options, so you can make changes to the colors, design, graphics, or any other component to create a unique layout. It is also available for immediate download, so you can begin using it right away. Slidegeeks has done good research to ensure that you have everything you need to make your presentation stand out. Make a name out there for a brilliant performance.
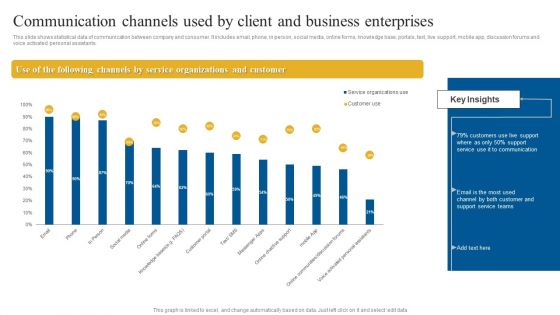
Communication Channels Used By Client And Business Enterprises Guidelines PDF
This slide shows statistical data of communication between company and consumer. It includes email, phone, in person, social media, online forms, knowledge base, portals, text, live support, mobile app, discussion forums and voice activated personal assistants. Pitch your topic with ease and precision using this Communication Channels Used By Client And Business Enterprises Guidelines PDF. This layout presents information on Service, Communication, Customer. It is also available for immediate download and adjustment. So, changes can be made in the color, design, graphics or any other component to create a unique layout.
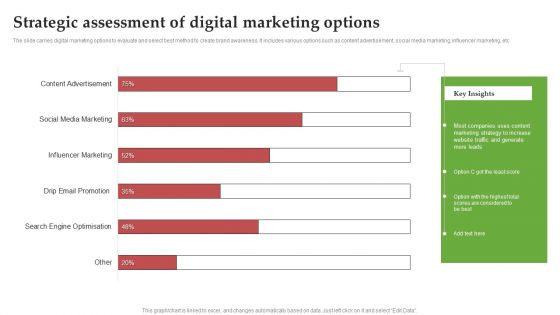
Strategic Assessment Of Digital Marketing Options Ppt PowerPoint Presentation File Show PDF
The slide carries digital marketing options to evaluate and select best method to create brand awareness. It includes various options such as content advertisement, social media marketing, influencer marketing, etc. Pitch your topic with ease and precision using this Strategic Assessment Of Digital Marketing Options Ppt PowerPoint Presentation File Show PDF. This layout presents information on Influencer Marketing, Social Media Marketing, Content Advertisement. It is also available for immediate download and adjustment. So, changes can be made in the color, design, graphics or any other component to create a unique layout.
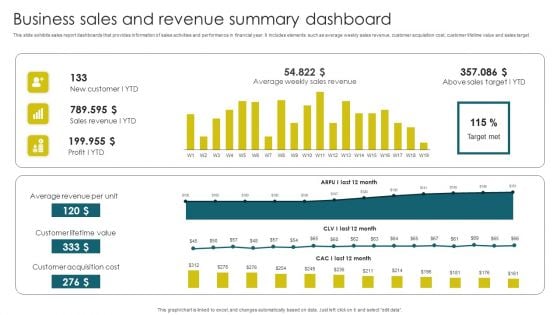
Business Sales And Revenue Summary Dashboard Brochure PDF
This slide exhibits sales report dashboards that provides information of sales activities and performance in financial year. It includes elements such as average weekly sales revenue, customer acquisition cost, customer lifetime value and sales target. Pitch your topic with ease and precision using this Business Sales And Revenue Summary Dashboard Brochure PDF. This layout presents information on Average Revenue, Customer Lifetime, Customer Acquisition. It is also available for immediate download and adjustment. So, changes can be made in the color, design, graphics or any other component to create a unique layout.
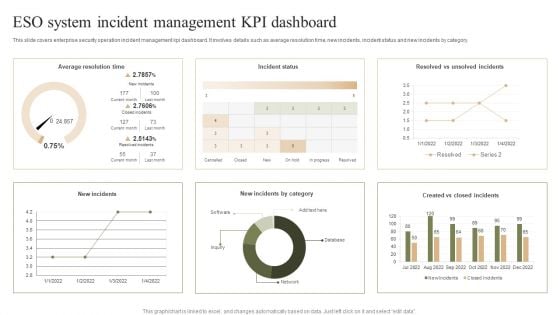
ESO System Incident Management KPI Dashboard Ppt PowerPoint Presentation File Graphic Images PDF
This slide covers enterprise security operation incident management kpi dashboard. It involves details such as average resolution time, new incidents, incident status and new incidents by category. Pitch your topic with ease and precision using this ESO System Incident Management KPI Dashboard Ppt PowerPoint Presentation File Graphic Images PDF. This layout presents information on Average Resolution Time, Incident Status, New Incidents. It is also available for immediate download and adjustment. So, changes can be made in the color, design, graphics or any other component to create a unique layout.
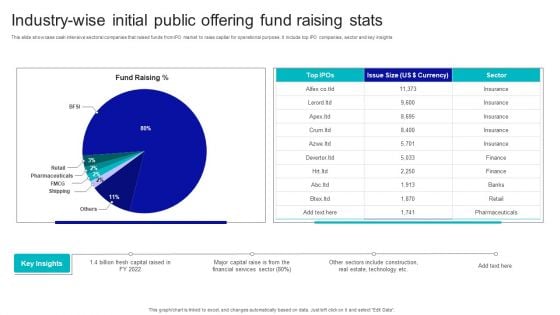
Industry Wise Initial Public Offering Fund Raising Stats Demonstration PDF
This slide showcase cash intensive sectoral companies that raised funds from IPO market to raise capital for operational purpose. It include top IPO companies, sector and key insights. Pitch your topic with ease and precision using this Industry Wise Initial Public Offering Fund Raising Stats Demonstration PDF. This layout presents information on Industry Wise Initial, Public Offering, Fund Raising Stats. It is also available for immediate download and adjustment. So, changes can be made in the color, design, graphics or any other component to create a unique layout.
Employees Attrition Tracking Statistics And Resignation Rate Report By Industry Background PDF
This slide covers dashboard for industry wise employees turnover rates. It further includes statistics on resignation rare of workers, average turnover rates for different industries. Pitch your topic with ease and precision using this Employees Attrition Tracking Statistics And Resignation Rate Report By Industry Background PDF. This layout presents information on Employees, Industry, Average Turnover Rate. It is also available for immediate download and adjustment. So, changes can be made in the color, design, graphics or any other component to create a unique layout.
Impact Survey Report Of Employee Attrition Tracking On Team Operations Demonstration PDF
This slide covers key factors having high impact on day to day team operations. It includes areas such as delay in project delivery, loss of productivity, rehiring cost and on boarding a replacement, low team morale, stress issues, legal and HR related issues. Pitch your topic with ease and precision using this Impact Survey Report Of Employee Attrition Tracking On Team Operations Demonstration PDF. This layout presents information on Employees Turnover, Project, Cost. It is also available for immediate download and adjustment. So, changes can be made in the color, design, graphics or any other component to create a unique layout.
Staff Productivity And Attrition Tracking Rate Statistical Report Ideas PDF
This slide covers dashboard for employees productivity stats. It further includes stats for absence rates, cost incurred, benefits derived, satisfaction index, net promoter score, turnover and promotion rates. Pitch your topic with ease and precision using this Staff Productivity And Attrition Tracking Rate Statistical Report Ideas PDF. This layout presents information on Absence Cost, Benefits Satisfaction, Productivity Rate. It is also available for immediate download and adjustment. So, changes can be made in the color, design, graphics or any other component to create a unique layout.
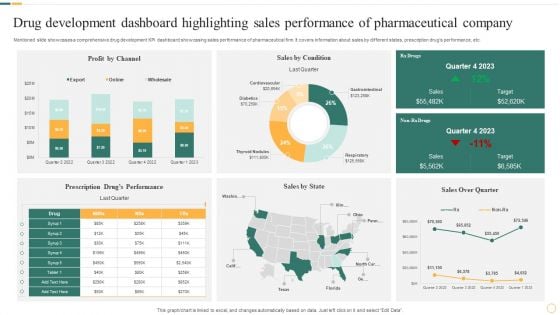
Drug Development Dashboard Highlighting Sales Performance Of Pharmaceutical Company Microsoft PDF
Mentioned slide showcases a comprehensive drug development KPI dashboard showcasing sales performance of pharmaceutical firm. It covers information about sales by different states, prescription drugs performance, etc. Pitch your topic with ease and precision using this Drug Development Dashboard Highlighting Sales Performance Of Pharmaceutical Company Microsoft PDF. This layout presents information on Sales By Condition, Profit By Channel, Sales By State. It is also available for immediate download and adjustment. So, changes can be made in the color, design, graphics or any other component to create a unique layout.
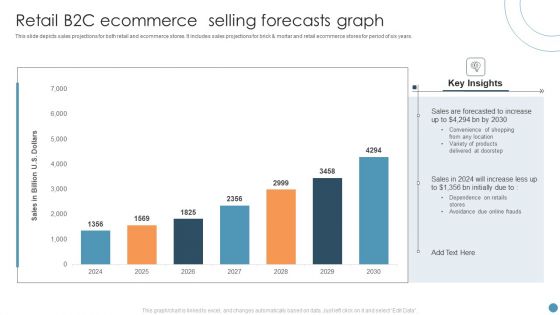
Retail B2C Ecommerce Selling Forecasts Graph Portrait PDF
This slide depicts sales projections for both retail and ecommerce stores. It includes sales projections for brick and mortar and retail ecommerce stores for period of six years. Pitch your topic with ease and precision using this Retail B2C Ecommerce Selling Forecasts Graph Portrait PDF. This layout presents information on Retail B2C Ecommerce, Selling Forecasts Graph. It is also available for immediate download and adjustment. So, changes can be made in the color, design, graphics or any other component to create a unique layout.
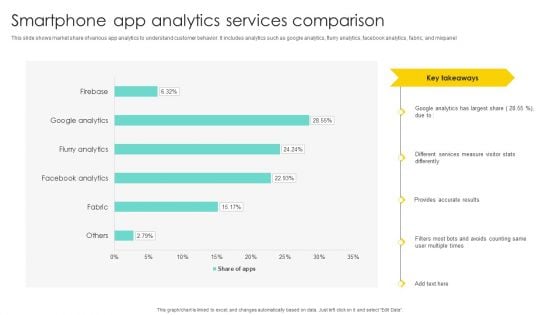
Smartphone App Analytics Services Comparison Brochure PDF
This slide shows market share of various app analytics to understand customer behavior. It includes analytics such as google analytics, flurry analytics, facebook analytics, fabric, and mixpanel. Pitch your topic with ease and precision using this Smartphone App Analytics Services Comparison Brochure PDF. This layout presents information on Different Services Measure, Visitor Stats Differently, Provides Accurate Results. It is also available for immediate download and adjustment. So, changes can be made in the color, design, graphics or any other component to create a unique layout.
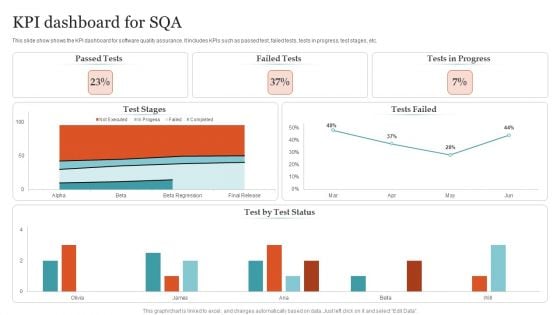
KPI Dashboard For SQA Ppt PowerPoint Presentation Gallery Structure PDF
This slide show shows the KPI dashboard for software quality assurance. It includes KPIs such as passed test, failed tests, tests in progress, test stages, etc. Pitch your topic with ease and precision using this KPI Dashboard For SQA Ppt PowerPoint Presentation Gallery Structure PDF. This layout presents information on Passed Tests, Failed Tests, Tests Progress . It is also available for immediate download and adjustment. So, changes can be made in the color, design, graphics or any other component to create a unique layout.
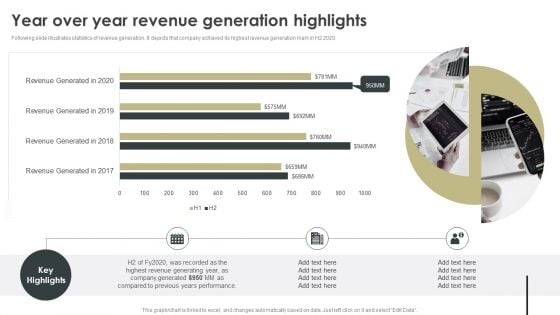
Year Over Year Revenue Generation Highlights Inspiration PDF
Following slide illustrates statistics of revenue generation. It depicts that company achieved its highest revenue generation mark in H2 2020. This Year Over Year Revenue Generation Highlights Inspiration PDF from Slidegeeks makes it easy to present information on your topic with precision. It provides customization options, so you can make changes to the colors, design, graphics, or any other component to create a unique layout. It is also available for immediate download, so you can begin using it right away. Slidegeeks has done good research to ensure that you have everything you need to make your presentation stand out. Make a name out there for a brilliant performance.
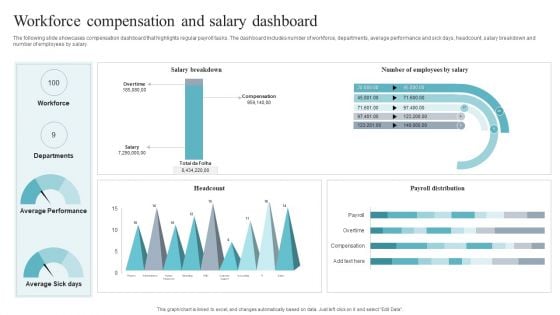
Workforce Compensation And Salary Dashboard Brochure PDF
The following slide showcases compensation dashboard that highlights regular payroll tasks. The dashboard includes number of workforce, departments, average performance and sick days, headcount, salary breakdown and number of employees by salary. Pitch your topic with ease and precision using this Workforce Compensation And Salary Dashboard Brochure PDF. This layout presents information on Workforce Compensation, Salary Dashboard. It is also available for immediate download and adjustment. So, changes can be made in the color, design, graphics or any other component to create a unique layout.
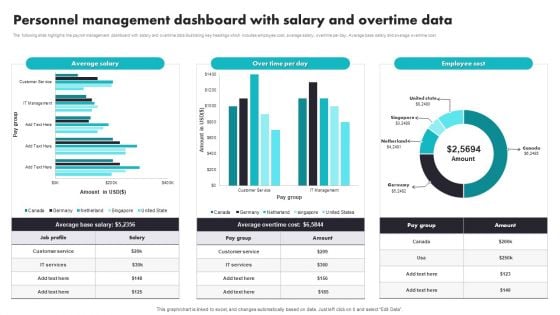
Personnel Management Dashboard With Salary And Overtime Data Ideas PDF
The following slide highlights the payroll management dashboard with salary and overtime data illustrating key headings which includes employee cost, average salary, overtime per day, Average base salary and average overtime cost. Pitch your topic with ease and precision using this Personnel Management Dashboard With Salary And Overtime Data Ideas PDF. This layout presents information on Average, Customer Service, Cost. It is also available for immediate download and adjustment. So, changes can be made in the color, design, graphics or any other component to create a unique layout.
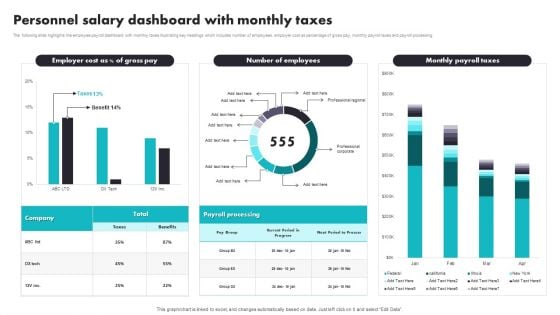
Personnel Salary Dashboard With Monthly Taxes Introduction PDF
The following slide highlights the employee payroll dashboard with monthly taxes illustrating key headings which includes number of employees, employer cost as percentage of gross pay, monthly payroll taxes and payroll processing. Pitch your topic with ease and precision using this Personnel Salary Dashboard With Monthly Taxes Introduction PDF. This layout presents information on Payroll Processing, Benefits. It is also available for immediate download and adjustment. So, changes can be made in the color, design, graphics or any other component to create a unique layout.
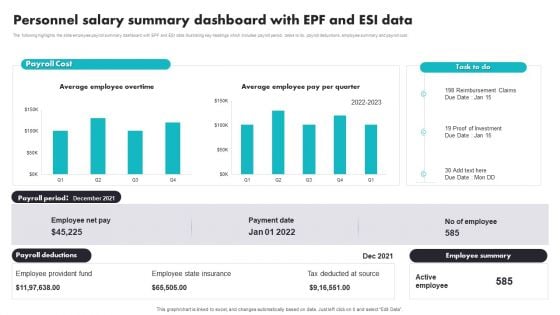
Personnel Salary Summary Dashboard With EPF And ESI Data Brochure PDF
The following highlights the slide employee payroll summary dashboard with EPF and ESI data illustrating key headings which includes payroll period, tasks to do, payroll deductions, employee summary and payroll cost. Pitch your topic with ease and precision using this Personnel Salary Summary Dashboard With EPF And ESI Data Brochure PDF. This layout presents information on Employee Provident Fund, Employee State Insurance, Tax Deducted At Source. It is also available for immediate download and adjustment. So, changes can be made in the color, design, graphics or any other component to create a unique layout.
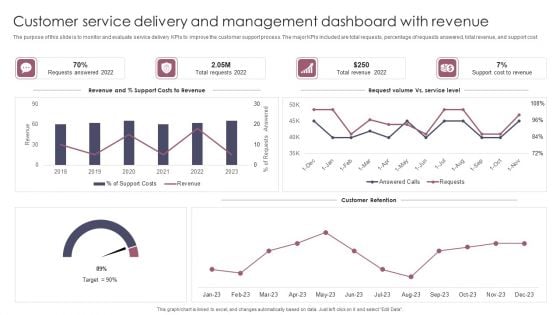
Customer Service Delivery And Management Dashboard With Revenue Brochure PDF
The purpose of this slide is to monitor and evaluate service delivery KPIs to improve the customer support process. The major KPIs included are total requests, percentage of requests answered, total revenue, and support cost. Pitch your topic with ease and precision using this Customer Service Delivery And Management Dashboard With Revenue Brochure PDF. This layout presents information on Customer Service Delivery, Management Dashboard With Revenue. It is also available for immediate download and adjustment. So, changes can be made in the color, design, graphics or any other component to create a unique layout.
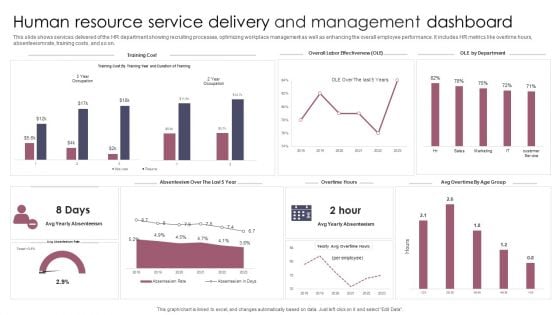
Human Resource Service Delivery And Management Dashboard Information PDF
This slide shows services delivered of the HR department showing recruiting processes, optimizing workplace management as well as enhancing the overall employee performance. It includes HR metrics like overtime hours, absenteeism rate, training costs, and so on. Pitch your topic with ease and precision using this Human Resource Service Delivery And Management Dashboard Information PDF. This layout presents information on Human Resource Service Delivery, Management Dashboard. It is also available for immediate download and adjustment. So, changes can be made in the color, design, graphics or any other component to create a unique layout.
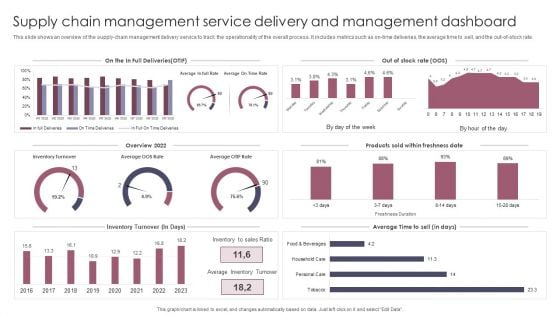
Supply Chain Management Service Delivery And Management Dashboard Guidelines PDF
This slide shows an overview of the supply chain management delivery service to track the operationality of the overall process. It includes metrics such as on time deliveries, the average time to sell, and the out of stock rate. Pitch your topic with ease and precision using this Supply Chain Management Service Delivery And Management Dashboard Guidelines PDF. This layout presents information on Supply Chain Management, Service Delivery, Management Dashboard. It is also available for immediate download and adjustment. So, changes can be made in the color, design, graphics or any other component to create a unique layout.
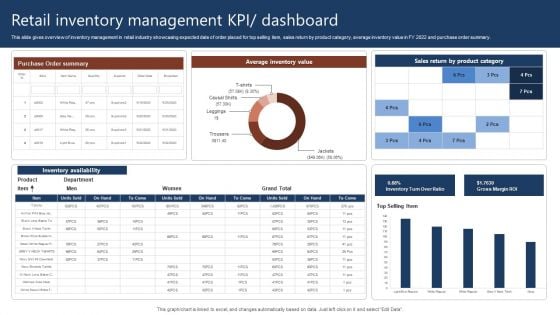
Retail Inventory Management Kpi Dashboard Rules PDF
This slide gives overview of inventory management in retail industry showcasing expected date of order placed for top selling item, sales return by product category, average inventory value in FY 2022 and purchase order summary. Pitch your topic with ease and precision using this Retail Inventory Management Kpi Dashboard Rules PDF. This layout presents information on Retail Inventory Management, Dashboard. It is also available for immediate download and adjustment. So, changes can be made in the color, design, graphics or any other component to create a unique layout.
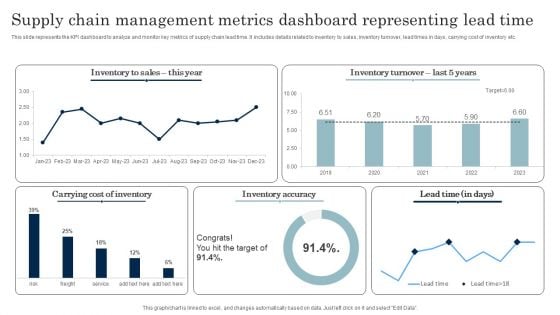
Supply Chain Management Metrics Dashboard Representing Lead Time Download PDF
This slide represents the KPI dashboard to analyze and monitor key metrics of supply chain lead time. It includes details related to inventory to sales, inventory turnover, lead times in days, carrying cost of inventory etc. Pitch your topic with ease and precision using this Supply Chain Management Metrics Dashboard Representing Lead Time Download PDF. This layout presents information on Inventory Accuracy, Carrying Cost Of Inventory. It is also available for immediate download and adjustment. So, changes can be made in the color, design, graphics or any other component to create a unique layout.
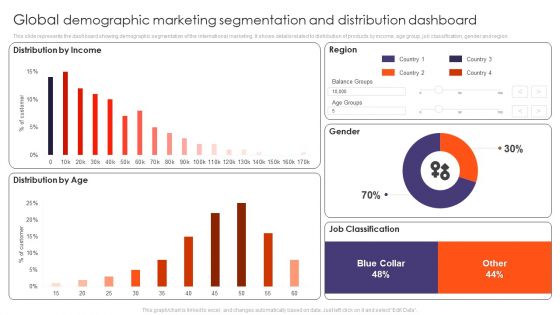
Global Demographic Marketing Segmentation And Distribution Dashboard Ppt Gallery Tips PDF
This slide represents the dashboard showing demographic segmentation of the international marketing. It shows details related to distribution of products by income, age group, job classification, gender and region. Pitch your topic with ease and precision using this Global Demographic Marketing Segmentation And Distribution Dashboard Ppt Gallery Tips PDF. This layout presents information on Distribution Income, Distribution Age, Region, Gender, Job Classification. It is also available for immediate download and adjustment. So, changes can be made in the color, design, graphics or any other component to create a unique layout.
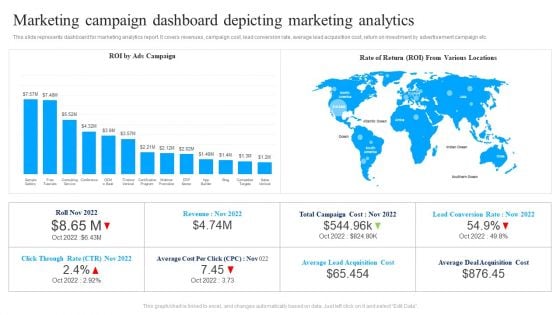
Marketing Campaign Dashboard Depicting Marketing Analytics Ppt Summary Infographics PDF
This slide represents dashboard for marketing analytics report. It covers revenues, campaign cost, lead conversion rate, average lead acquisition cost, return on investment by advertisement campaign etc. Pitch your topic with ease and precision using this Marketing Campaign Dashboard Depicting Marketing Analytics Ppt Summary Infographics PDF. This layout presents information on ROI Ads Campaign, Rate Of Return, Various Locations. It is also available for immediate download and adjustment. So, changes can be made in the color, design, graphics or any other component to create a unique layout.
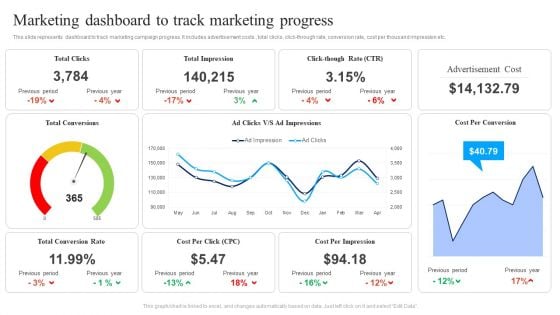
Marketing Dashboard To Track Marketing Progress Ppt Tips PDF
This slide represents dashboard to track marketing campaign progress. It includes advertisement costs , total clicks, click-through rate, conversion rate, cost per thousand impression etc. Pitch your topic with ease and precision using this Marketing Dashboard To Track Marketing Progress Ppt Tips PDF. This layout presents information on Total Clicks, Total Impression, Total Conversion Rate, Cost Per Click. It is also available for immediate download and adjustment. So, changes can be made in the color, design, graphics or any other component to create a unique layout.
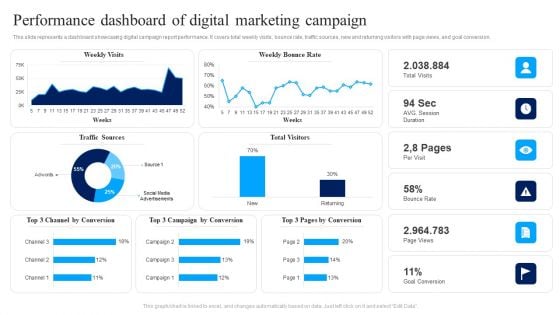
Performance Dashboard Of Digital Marketing Campaign Ppt Show Slide PDF
This slide represents a dashboard showcasing digital campaign report performance. It covers total weekly visits, bounce rate, traffic sources, new and returning visitors with page views, and goal conversion. Pitch your topic with ease and precision using this Performance Dashboard Of Digital Marketing Campaign Ppt Show Slide PDF. This layout presents information on Weekly Visits, Weekly Bounce Rate, Bounce Rate. It is also available for immediate download and adjustment. So, changes can be made in the color, design, graphics or any other component to create a unique layout.
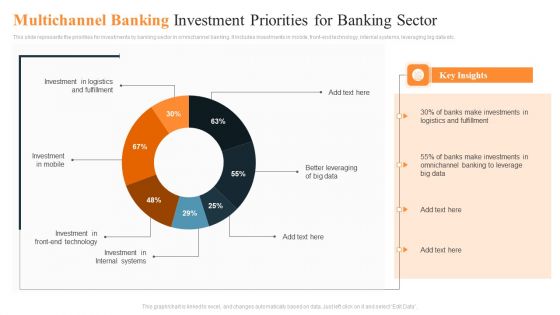
Multichannel Banking Investment Priorities For Banking Sector Ppt Model PDF
This slide represents the priorities for investments by banking sector in omnichannel banking. It includes investments in mobile, front-end technology, internal systems, leveraging big data etc. Pitch your topic with ease and precision using this Multichannel Banking Investment Priorities For Banking Sector Ppt Model PDF. This layout presents information on Better Leveraging, Big Data, Investment Internal Systems, Investment Mobile. It is also available for immediate download and adjustment. So, changes can be made in the color, design, graphics or any other component to create a unique layout.
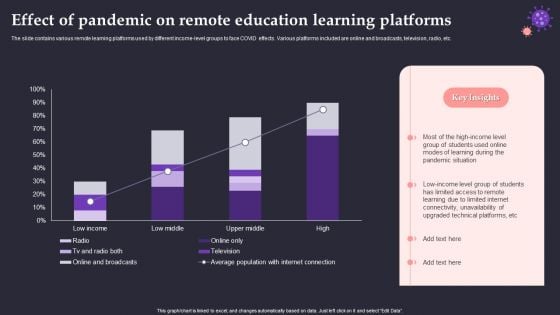
Effect Of Pandemic On Remote Education Learning Platforms Sample PDF
The slide contains various remote learning platforms used by different income-level groups to face COVID effects. Various platforms included are online and broadcasts, television, radio, etc. Pitch your topic with ease and precision using this Effect Of Pandemic On Remote Education Learning Platforms Sample PDF. This layout presents information on Pandemic Situation, High Income Level, Technical Platforms. It is also available for immediate download and adjustment. So, changes can be made in the color, design, graphics or any other component to create a unique layout.
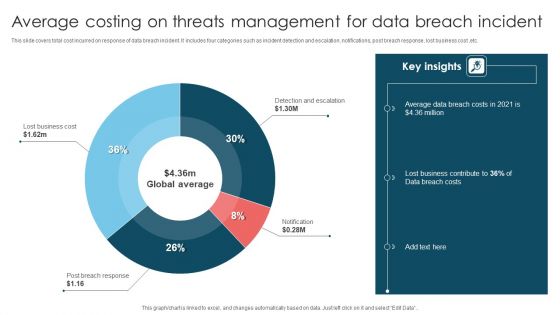
Average Costing On Threats Management For Data Breach Incident Demonstration PDF
This slide covers total cost incurred on response of data breach incident. It includes four categories such as incident detection and escalation, notifications, post breach response, lost business cost ,etc. Pitch your topic with ease and precision using this Average Costing On Threats Management For Data Breach Incident Demonstration PDF. This layout presents information on Lost Business Cost, Detection And Escalation, Notification. It is also available for immediate download and adjustment. So, changes can be made in the color, design, graphics or any other component to create a unique layout.
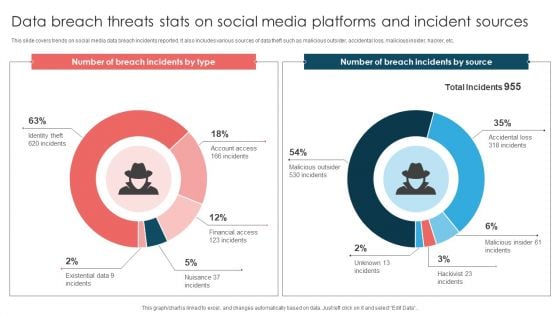
Data Breach Threats Stats On Social Media Platforms And Incident Sources Introduction PDF
This slide covers trends on social media data breach incidents reported. It also includes various sources of data theft such as malicious outsider, accidental loss, malicious insider, hacker, etc. Pitch your topic with ease and precision using this Data Breach Threats Stats On Social Media Platforms And Incident Sources Introduction PDF. This layout presents information on Number Breach, Total Incidents, Malicious Insider. It is also available for immediate download and adjustment. So, changes can be made in the color, design, graphics or any other component to create a unique layout.
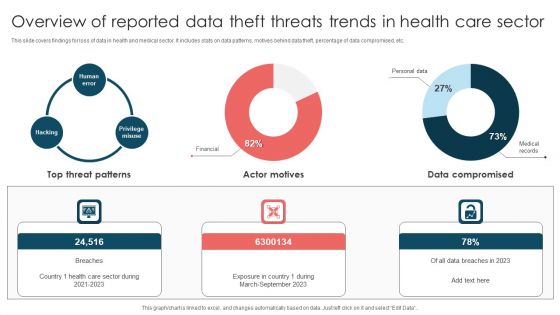
Overview Of Reported Data Theft Threats Trends In Health Care Sector Introduction PDF
This slide covers findings for loss of data in health and medical sector. It includes stats on data patterns, motives behind data theft, percentage of data compromised, etc. Pitch your topic with ease and precision using this Overview Of Reported Data Theft Threats Trends In Health Care Sector Introduction PDF. This layout presents information on Top Threat Patterns, Exposure Country, March To September 2023. It is also available for immediate download and adjustment. So, changes can be made in the color, design, graphics or any other component to create a unique layout.
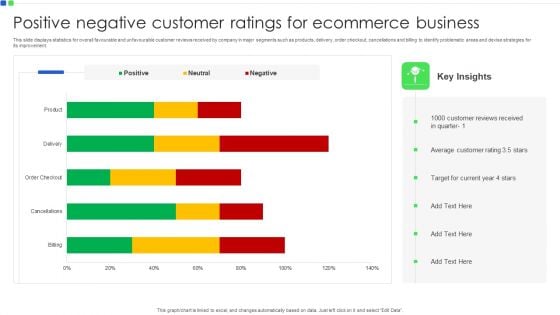
Positive Negative Customer Ratings For Ecommerce Business Rules PDF
This slide displays statistics for overall favourable and unfavourable customer reviews received by company in major segments such as products, delivery, order checkout, cancellations and billing to identify problematic areas and devise strategies for its improvement. Pitch your topic with ease and precision using this Positive Negative Customer Ratings For Ecommerce Business Rules PDF. This layout presents information on Customer Reviews Received, Average Customer Rating, Target For Current Year. It is also available for immediate download and adjustment. So, changes can be made in the color, design, graphics or any other component to create a unique layout.
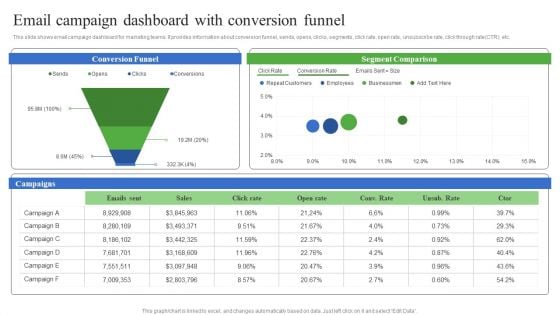
Email Campaign Dashboard With Conversion Funnel Information PDF
This slide shows email campaign dashboard for marketing teams. It provides information about conversion funnel, sends, opens, clicks, segments, click rate, open rate, unsubscribe rate, click through rate CTR, etc. Pitch your topic with ease and precision using this Email Campaign Dashboard With Conversion Funnel Information PDF. This layout presents information on Email Campaign Dashboard, Conversion Funnel. It is also available for immediate download and adjustment. So, changes can be made in the color, design, graphics or any other component to create a unique layout.
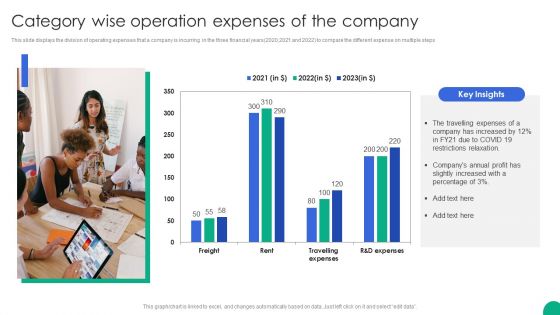
Category Wise Operation Expenses Of The Company Topics PDF
This slide displays the division of operating expenses that a company is incurring in the three financial years 2020,2021 and 2022 to compare the different expense on multiple steps.Pitch your topic with ease and precision using this Category Wise Operation Expenses Of The Company Topics PDF. This layout presents information on Travelling Expenses, Increased Restrictions, Relaxation. It is also available for immediate download and adjustment. So, changes can be made in the color, design, graphics or any other component to create a unique layout.
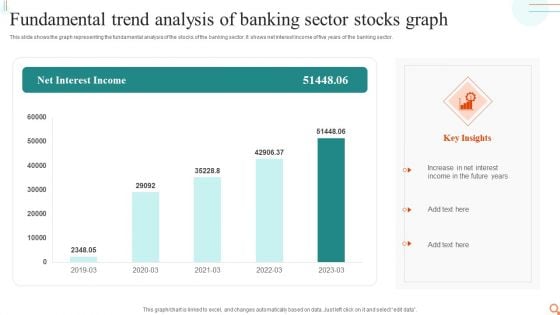
Fundamental Trend Analysis Of Banking Sector Stocks Graph Mockup PDF
This slide shows the graph representing the fundamental analysis of the stocks of the banking sector. It shows net interest income of five years of the banking sector.Pitch your topic with ease and precision using this Fundamental Trend Analysis Of Banking Sector Stocks Graph Mockup PDF. This layout presents information on Increase Interest, Income Future, Interest Income. It is also available for immediate download and adjustment. So, changes can be made in the color, design, graphics or any other component to create a unique layout.
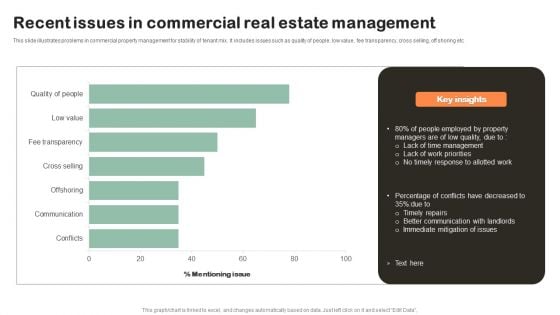
Recent Issues In Commercial Real Estate Management Ideas PDF
This slide illustrates problems in commercial property management for stability of tenant mix. It includes issues such as quality of people, low value, fee transparency, cross selling, off shoring etc. Pitch your topic with ease and precision using this Recent Issues In Commercial Real Estate Management Ideas PDF. This layout presents information on Management, Low Quality, Communication. It is also available for immediate download and adjustment. So, changes can be made in the color, design, graphics or any other component to create a unique layout.
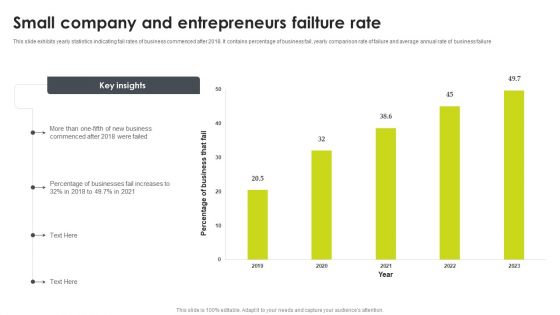
Small Company And Entrepreneurs Failture Rate Summary PDF
This slide exhibits yearly statistics indicating fail rates of business commenced after 2018. It contains percentage of business fail, yearly comparison rate of failure and average annual rate of business failure. Pitch your topic with ease and precision using this Small Company And Entrepreneurs Failture Rate Summary PDF. This layout presents information on Entrepreneurs Failture Rate, Business. It is also available for immediate download and adjustment. So, changes can be made in the color, design, graphics or any other component to create a unique layout.

Engineering Performance Metrics Dashboard To Track Pull Requests Background PDF
This slide covers engineering KPI dashboard to track pull request. It involves KPIs such as open time of average pull requests, average comment received, revision rounds, frequency of posting pull requests. Pitch your topic with ease and precision using this Engineering Performance Metrics Dashboard To Track Pull Requests Background PDF. This layout presents information on Dashboard Track Pull Requests, Engineering Performance Metrics. It is also available for immediate download and adjustment. So, changes can be made in the color, design, graphics or any other component to create a unique layout.
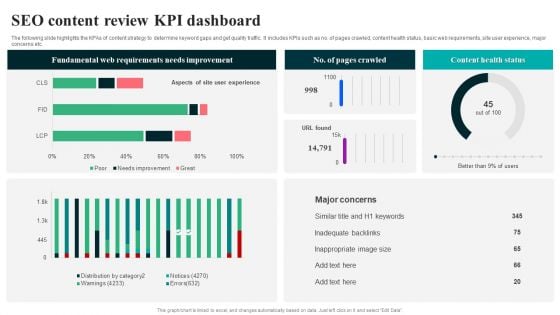
SEO Content Review KPI Dashboard Summary PDF
The following slide highlights the KPAs of content strategy to determine keyword gaps and get quality traffic. It includes KPIs such as no. of pages crawled, content health status, basic web requirements, site user experience, major concerns etc. Pitch your topic with ease and precision using this SEO Content Review KPI Dashboard Summary PDF. This layout presents information on Fundamental Web Requirements, Needs Improvement. It is also available for immediate download and adjustment. So, changes can be made in the color, design, graphics or any other component to create a unique layout.
Robotic Process Automation Metrics Dashboard For Tracking Business Return On Investment Information PDF
This slide illustrates KPI Dashboard for measuring time and money saved after RPA deployment. It also include metrics for analysis such as productivity in robot hours, hours saved per process, money saved per process, etc. Pitch your topic with ease and precision using this Robotic Process Automation Metrics Dashboard For Tracking Business Return On Investment Information PDF. This layout presents information on Management, Goal, Productivity. It is also available for immediate download and adjustment. So, changes can be made in the color, design, graphics or any other component to create a unique layout.
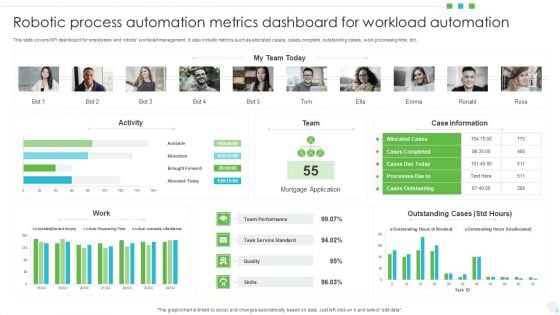
Robotic Process Automation Metrics Dashboard For Workload Automation Mockup PDF
This slide covers KPI dashboard for employees and robots workload management. It also include metrics such as allocated cases, cases complete, outstanding cases, work processing time, etc. Pitch your topic with ease and precision using this Robotic Process Automation Metrics Dashboard For Workload Automation Mockup PDF. This layout presents information on Mortgage Application, Team Performance, Case Information. It is also available for immediate download and adjustment. So, changes can be made in the color, design, graphics or any other component to create a unique layout.
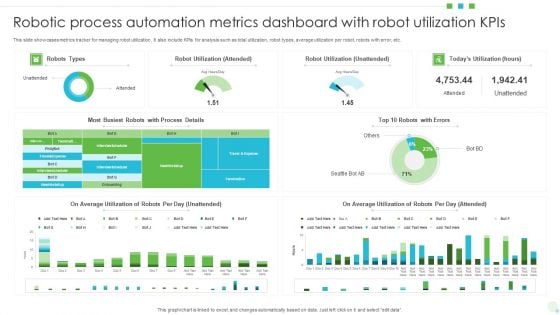
Robotic Process Automation Metrics Dashboard With Robot Utilization Kpis Background PDF
This slide showcases metrics tracker for managing robot utilization. It also include KPIs for analysis such as total utilization, robot types, average utilization per robot, robots with error, etc. Pitch your topic with ease and precision using this Robotic Process Automation Metrics Dashboard With Robot Utilization Kpis Background PDF. This layout presents information on Average Utilization, Robot Utilization, Automation Metrics Dashboard. It is also available for immediate download and adjustment. So, changes can be made in the color, design, graphics or any other component to create a unique layout.
Robotic Process Automation Metrics Tracker With Work Item Statistics Information PDF
This slide covers the RPA dashboard for analysing process data status. It also includes process details such as run success rate, inputs, processing, fail, output, robotic run minutes, total value generated, work items processed. Pitch your topic with ease and precision using this Robotic Process Automation Metrics Tracker With Work Item Statistics Information PDF. This layout presents information on Robotic Process Automation, Metrics Tracker, Work Item Statistics. It is also available for immediate download and adjustment. So, changes can be made in the color, design, graphics or any other component to create a unique layout.
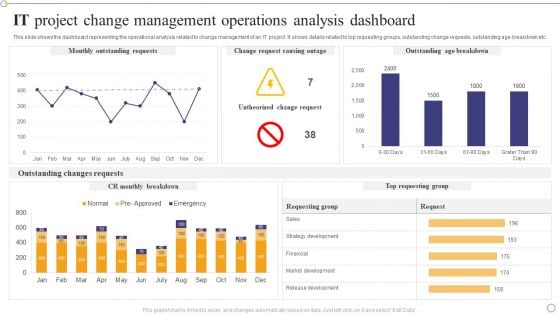
IT Project Change Management Operations Analysis Dashboard Infographics PDF
This slide shows the dashboard representing the operational analysis related to change management of an IT project. It shows details related to top requesting groups, outstanding change requests, outstanding age breakdown etc.Pitch your topic with ease and precision using this IT Project Change Management Operations Analysis Dashboard Infographics PDF. This layout presents information on Outstanding Requests, Outstanding Breakdown, Outstanding Changes. It is also available for immediate download and adjustment. So, changes can be made in the color, design, graphics or any other component to create a unique layout.
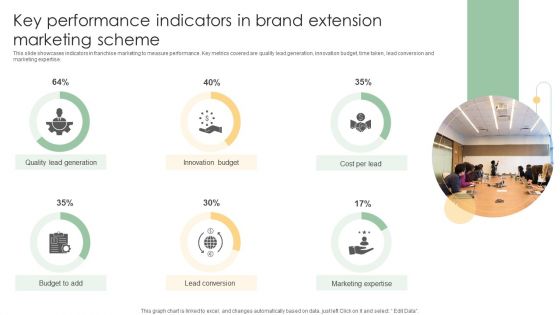
Key Performance Indicators In Brand Extension Marketing Scheme Ideas PDF
This slide showcases indicators in franchise marketing to measure performance. Key metrics covered are quality lead generation, innovation budget, time taken, lead conversion and marketing expertise.Pitch your topic with ease and precision using this Key Performance Indicators In Brand Extension Marketing Scheme Ideas PDF. This layout presents information on Quality Lead Generation, Innovation Budget, Lead Conversion. It is also available for immediate download and adjustment. So, changes can be made in the color, design, graphics or any other component to create a unique layout.

Digital Marketing Campaign Performance Monitoring Dashboard Pictures PDF
This slide represents the dashboard for measuring and monitoring the performance of digital marketing campaign. It includes information related to the advertisement cost, cost per conversion, no. of clicks, conversion rate, impressions, cost per click, click through rate and cost per thousand impressions of the project.Pitch your topic with ease and precision using this Digital Marketing Campaign Performance Monitoring Dashboard Pictures PDF. This layout presents information on Conversion Rate, Per Conversion, Cost Per Thousand. It is also available for immediate download and adjustment. So, changes can be made in the color, design, graphics or any other component to create a unique layout.
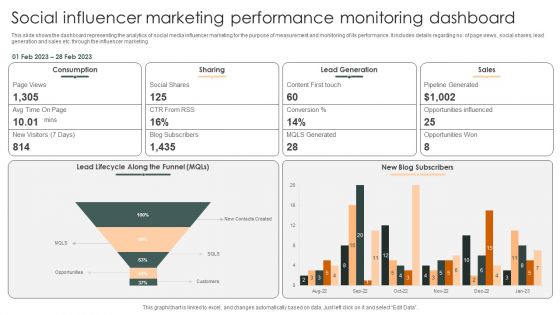
Social Influencer Marketing Performance Monitoring Dashboard Slides PDF
This slide shows the dashboard representing the analytics of social media influencer marketing for the purpose of measurement and monitoring of its performance. It includes details regarding no. of page views, social shares, lead generation and sales etc. through the influencer marketing.Pitch your topic with ease and precision using this Social Influencer Marketing Performance Monitoring Dashboard Slides PDF. This layout presents information on Lead Generation, Pipeline Generated, Opportunities Influenced. It is also available for immediate download and adjustment. So, changes can be made in the color, design, graphics or any other component to create a unique layout.
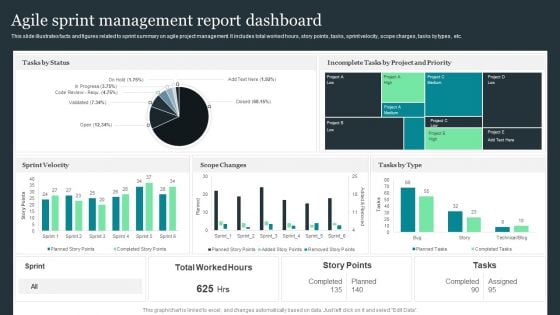
Agile Sprint Management Report Dashboard Pictures PDF
This slide illustrates facts and figures related to sprint summary on agile project management. It includes total worked hours, story points, tasks, sprint velocity, scope charges, tasks by types, etc. Pitch your topic with ease and precision using this Agile Sprint Management Report Dashboard Pictures PDF. This layout presents information on Tasks By Status, Sprint Velocity, Scope Changes. It is also available for immediate download and adjustment. So, changes can be made in the color, design, graphics or any other component to create a unique layout.
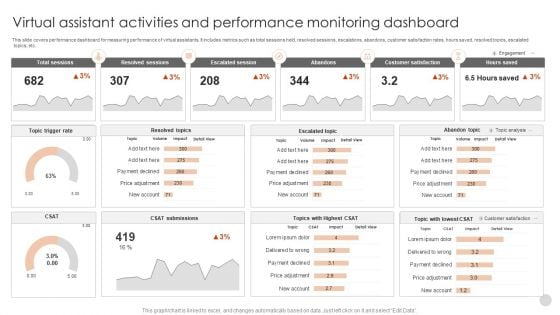
Virtual Assistant Activities And Performance Monitoring Dashboard Guidelines PDF
This slide covers performance dashboard for measuring performance of virtual assistants. It includes metrics such as total sessions held, resolved sessions, escalations, abandons, customer satisfaction rates, hours saved, resolved topics, escalated topics, etc.Pitch your topic with ease and precision using this Virtual Assistant Activities And Performance Monitoring Dashboard Guidelines PDF. This layout presents information on Total Sessions, Resolved Sessions, Escalated Session. It is also available for immediate download and adjustment. So, changes can be made in the color, design, graphics or any other component to create a unique layout.
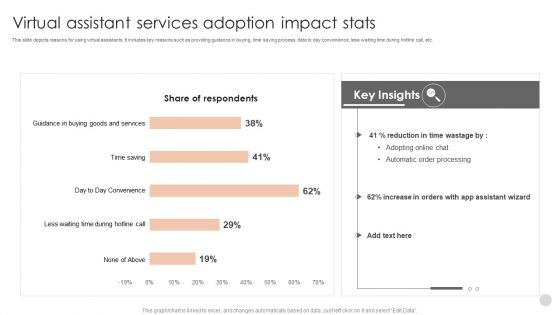
Virtual Assistant Services Adoption Impact Stats Structure PDF
This slide depicts reasons for using virtual assistants. It includes key reasons such as providing guidance in buying, time saving process, data to day convenience, less waiting time during hotline call, etc.Pitch your topic with ease and precision using this Virtual Assistant Services Adoption Impact Stats Structure PDF. This layout presents information on Automatic Order Processing, Assistant Wizard, Guidance Buying. It is also available for immediate download and adjustment. So, changes can be made in the color, design, graphics or any other component to create a unique layout.
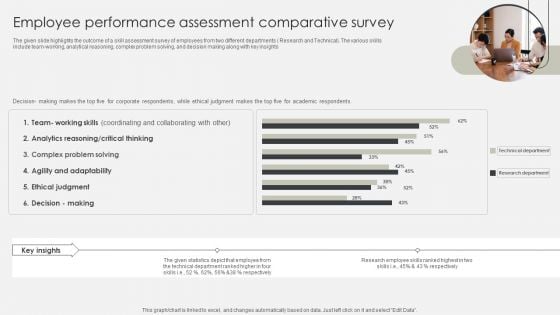
Employee Performance Assessment Comparative Survey Ideas PDF
The given slide highlights the outcome of a skill assessment survey of employees from two different departments Research and Technical. The various skills include team-working, analytical reasoning, complex problem solving, and decision making along with key insights. Pitch your topic with ease and precision using this Employee Performance Assessment Comparative Survey Ideas PDF. This layout presents information on Agility And Adaptability, Team, Research Department. It is also available for immediate download and adjustment. So, changes can be made in the color, design, graphics or any other component to create a unique layout.
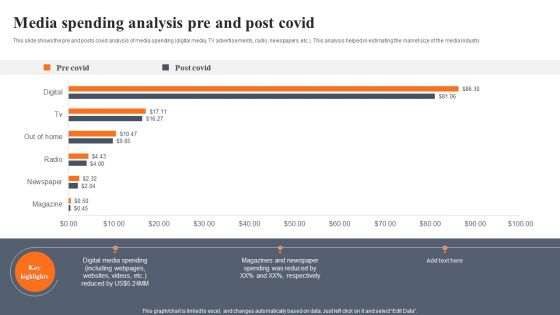
Media Spending Analysis Pre And Post Covid Elements PDF
This slide shows the pre and posts covid analysis of media spending digital media, TV advertisements, radio, newspapers, etc. This analysis helped in estimating the market size of the media industry. Pitch your topic with ease and precision using this Media Spending Analysis Pre And Post Covid Elements PDF. This layout presents information on Media Spending Analysis, Pre And Post Covid. It is also available for immediate download and adjustment. So, changes can be made in the color, design, graphics or any other component to create a unique layout.
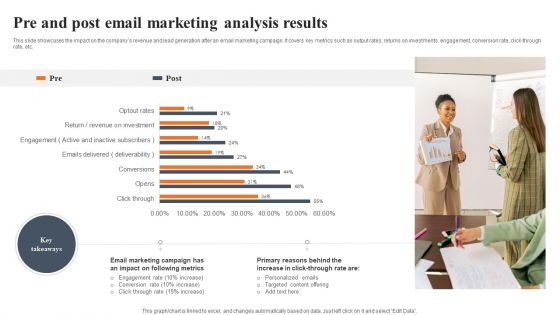
Pre And Post Email Marketing Analysis Results Slides PDF
This slide showcases the impact on the companys revenue and lead generation after an email marketing campaign. It covers key metrics such as output rates, returns on investments, engagement, conversion rate, click through rate, etc. Pitch your topic with ease and precision using this Pre And Post Email Marketing Analysis Results Slides PDF. This layout presents information on Email Marketing Campaign, Following Metrics, Targeted Content Offering. It is also available for immediate download and adjustment. So, changes can be made in the color, design, graphics or any other component to create a unique layout.


 Continue with Email

 Home
Home


