Icon List

Bar Chart Ppt PowerPoint Presentation File Skills
This is a bar chart ppt powerpoint presentation file skills. This is a nine stage process. The stages in this process are business, marketing, growth, finance, management.
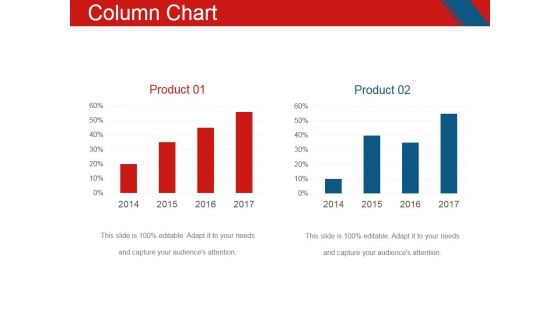
Column Chart Ppt PowerPoint Presentation Portfolio Designs
This is a column chart ppt powerpoint presentation portfolio designs. This is a two stage process. The stages in this process are business, marketing, timeline, growth, compare.
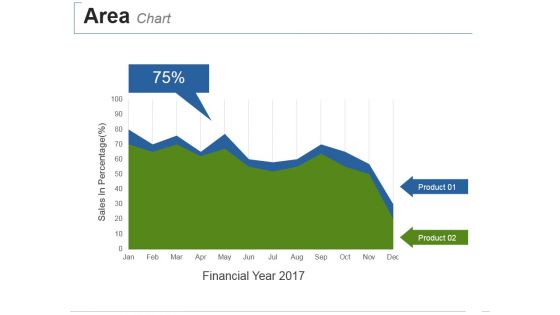
Area Chart Ppt PowerPoint Presentation Summary Deck
This is a area chart ppt powerpoint presentation summary deck. This is a two stage process. The stages in this process are sales in percentage, financial year.
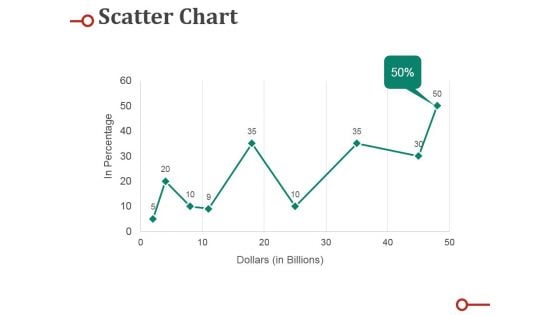
Scatter Chart Ppt PowerPoint Presentation Professional Deck
This is a scatter chart ppt powerpoint presentation professional deck. This is a nine stage process. The stages in this process are percentage, business, marketing, graph, line.
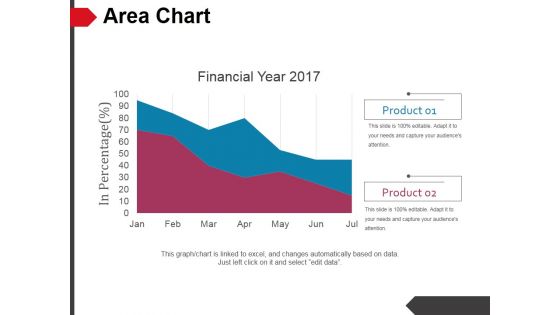
Area Chart Ppt PowerPoint Presentation Professional Display
This is a area chart ppt powerpoint presentation professional display. This is a two stage process. The stages in this process are business, finance, growth, strategy, marketing, analysis.

Line Chart Ppt PowerPoint Presentation Model Visuals
This is a line chart ppt powerpoint presentation model visuals. This is a two stage process. The stages in this process are business, strategy, analysis, pretention, growth strategy.
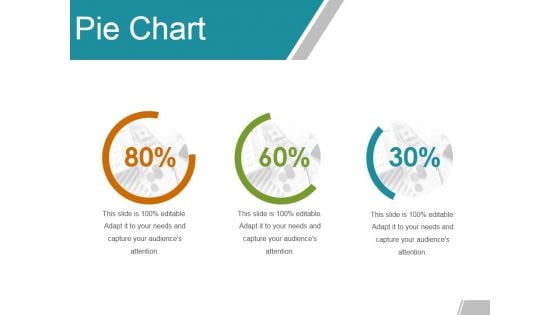
Pie Chart Ppt PowerPoint Presentation Summary Slide
This is a pie chart ppt powerpoint presentation summary slide. This is a three stage process. The stages in this process are percentage, finance, marketing, business.
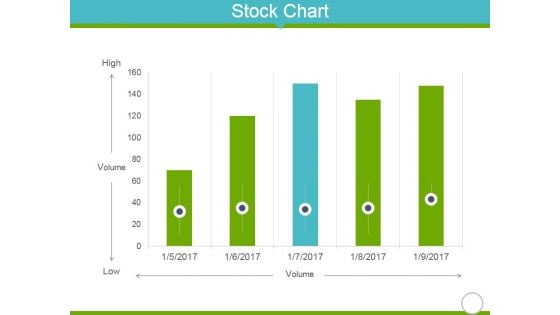
Stock Chart Ppt PowerPoint Presentation Portfolio Infographics
This is a stock chart ppt powerpoint presentation portfolio infographics. This is a five stage process. The stages in this process are high, volume, low, finance, business.
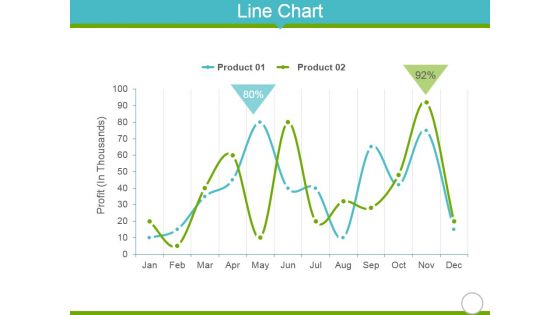
Line Chart Ppt Powerpoint Presentation Portfolio Clipart
This is a line chart ppt powerpoint presentation portfolio clipart. This is a two stage process. The stages in this process are jan, feb, mar, apr, may, jun.
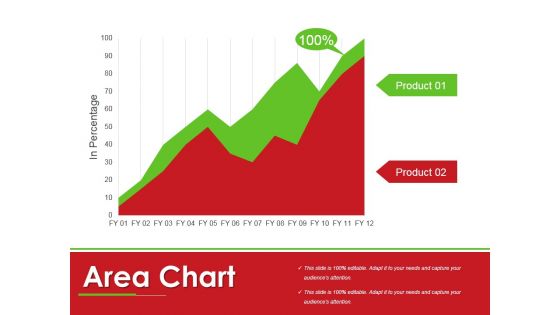
Area Chart Ppt PowerPoint Presentation Slides Inspiration
This is a area chart ppt powerpoint presentation slides inspiration. This is a two stage process. The stages in this process are business, marketing, finance, growth, management.
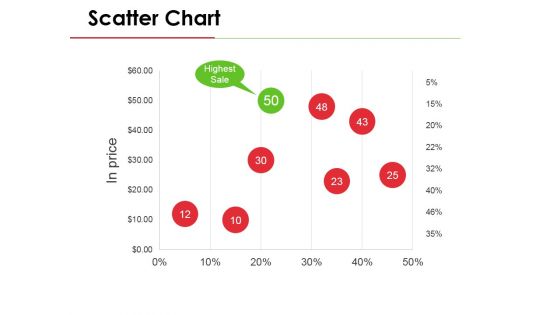
Scatter Chart Ppt PowerPoint Presentation Model Deck
This is a scatter chart ppt powerpoint presentation model deck. This is a eight stage process. The stages in this process are business, marketing, finance, management, strategy.
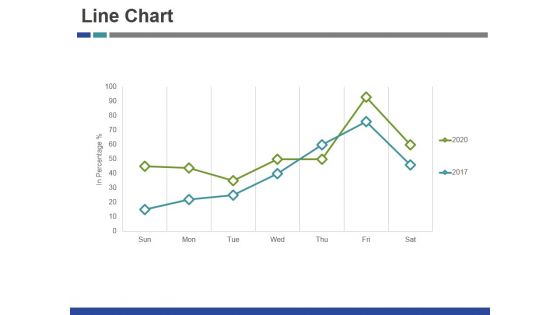
Line Chart Ppt PowerPoint Presentation Gallery Summary
This is a line chart ppt powerpoint presentation gallery summary. This is a two stage process. The stages in this process are finance, graph, business, management, marketing.
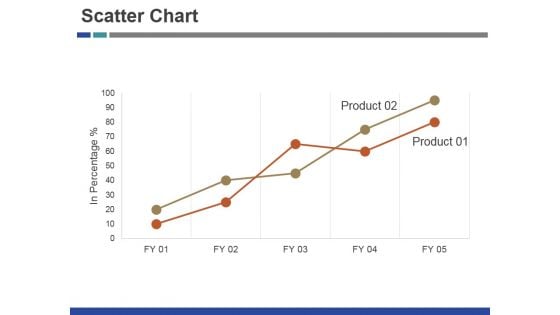
Scatter Chart Ppt PowerPoint Presentation Inspiration Brochure
This is a scatter chart ppt powerpoint presentation inspiration brochure. This is a two stage process. The stages in this process are product, growth, success, business.
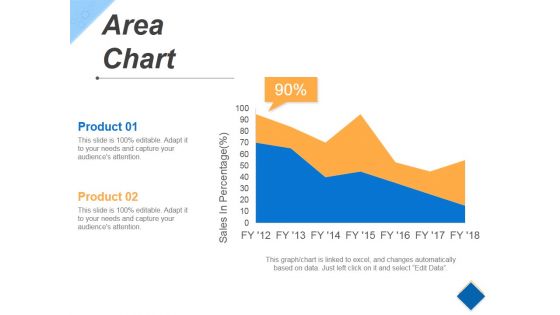
Area Chart Ppt PowerPoint Presentation Slides Gridlines
This is a area chart ppt powerpoint presentation slides gridlines. This is a two stage process. The stages in this process are business, finance, marketing, percentage.
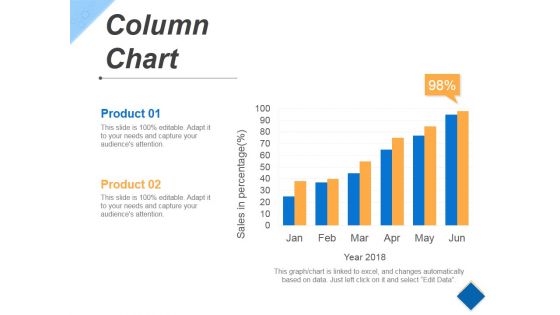
Column Chart Ppt PowerPoint Presentation Styles Vector
This is a column chart ppt powerpoint presentation styles vector. This is a six stage process. The stages in this process are growth, success, business, marketing, product.

Line Chart Ppt PowerPoint Presentation Pictures Maker
This is a line chart ppt powerpoint presentation pictures maker. This is a two stage process. The stages in this process are financial years, product, growth, success.
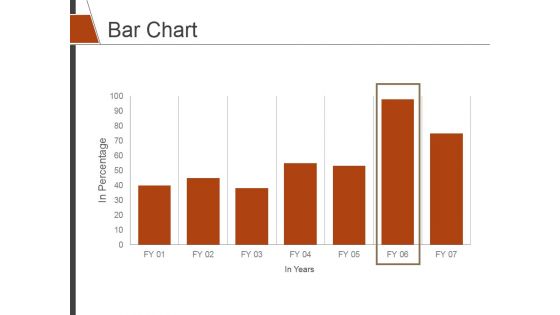
Bar Chart Ppt PowerPoint Presentation Slides Shapes
This is a bar chart ppt powerpoint presentation slides shapes. This is a seven stage process. The stages in this process are bar graph, finance, marketing, strategy, analysis.
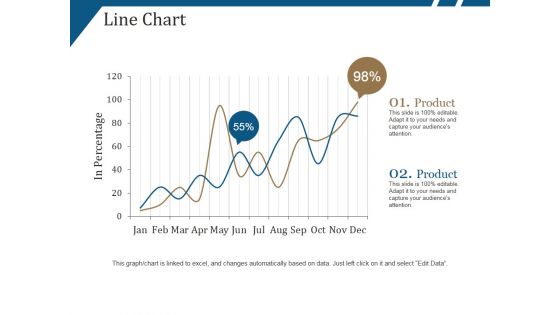
Line Chart Ppt PowerPoint Presentation Portfolio Show
This is a line chart ppt powerpoint presentation portfolio show. This is a two stage process. The stages in this process are product, in percentage, growth, success.
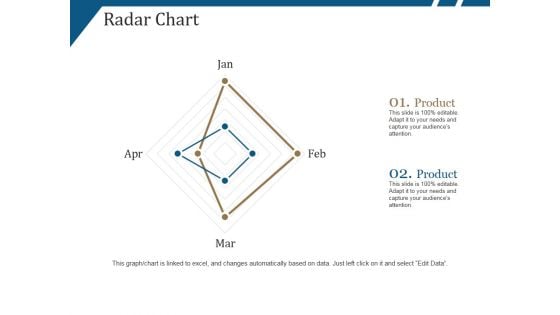
Radar Chart Ppt PowerPoint Presentation Layouts Summary
This is a radar chart ppt powerpoint presentation layouts summary. This is a four stage process. The stages in this process are product, business, marketing, shapes.
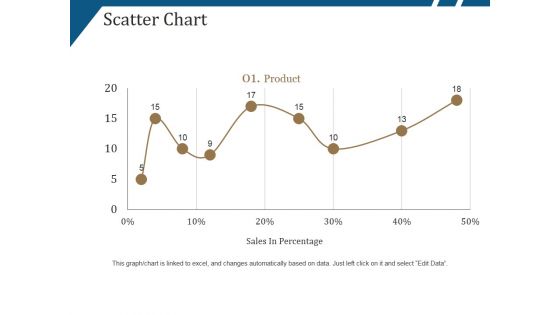
Scatter Chart Ppt PowerPoint Presentation Summary Deck
This is a scatter chart ppt powerpoint presentation summary deck. This is a nine stage process. The stages in this process are product, sales in percentage, growth, success.

Area Chart Ppt PowerPoint Presentation Slides Show
This is a area chart ppt powerpoint presentation slides show. This is a two stage process. The stages in this process are business, marketing, success, graph, growth.
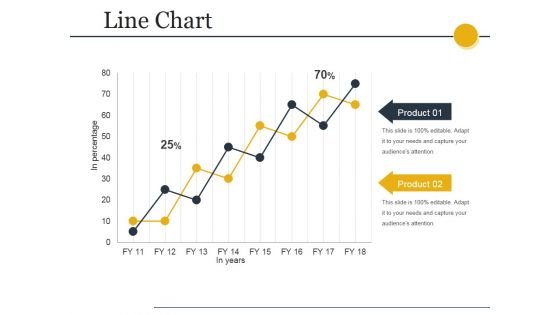
Line Chart Ppt PowerPoint Presentation Ideas Demonstration
This is a line chart ppt powerpoint presentation ideas demonstration. This is a eight stage process. The stages in this process are business, marketing, graph, success, growth.
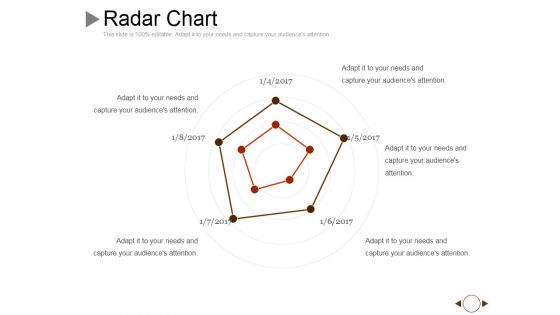
Radar Chart Ppt PowerPoint Presentation Professional Example
This is a radar chart ppt powerpoint presentation professional example. This is a five stage process. The stages in this process are business, shapes, marketing, management.
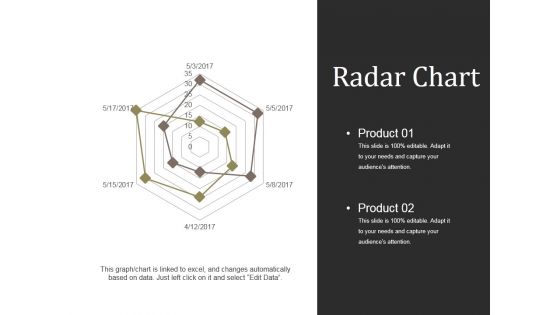
Radar Chart Ppt PowerPoint Presentation Model Picture
This is a radar chart ppt powerpoint presentation model picture. This is a six stage process. The stages in this process are product, finance marketing, business, management, analysis.
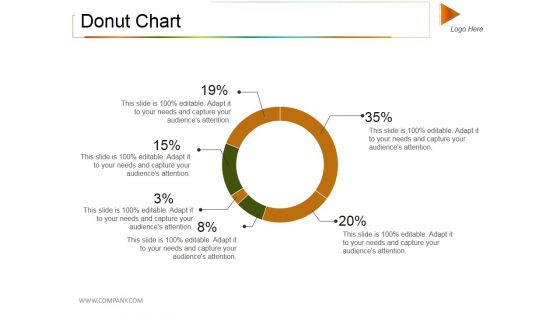
Donut Chart Ppt PowerPoint Presentation Model Rules
This is a donut chart ppt powerpoint presentation model rules. This is a six stage process. The stages in this process are donut, percentage, finance, business, marketing.
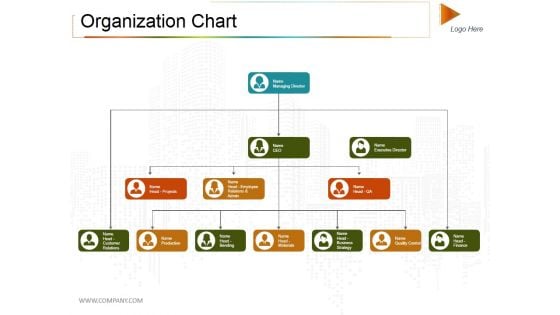
Organization Chart Ppt PowerPoint Presentation Model
This is a organization chart ppt powerpoint presentation model. This is a four stage process. The stages in this process are business, marketing, step, management.
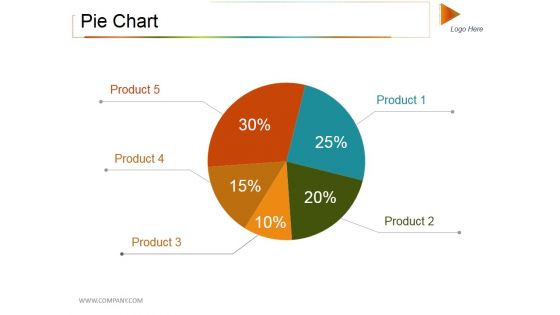
Pie Chart Ppt PowerPoint Presentation Styles Objects
This is a pie chart ppt powerpoint presentation styles objects. This is a five stage process. The stages in this process are pie, process, percentage, finance, business.
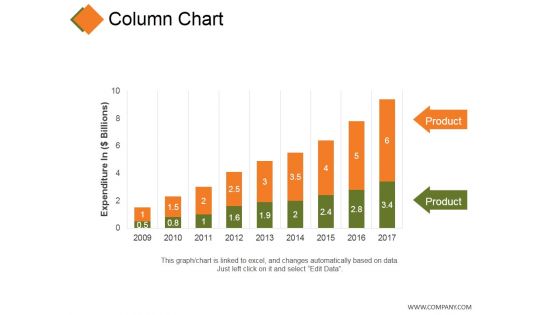
Column Chart Ppt PowerPoint Presentation Portfolio Background
This is a column chart ppt powerpoint presentation portfolio background. This is a nine stage process. The stages in this process are product, expenditure, growth, success, business.
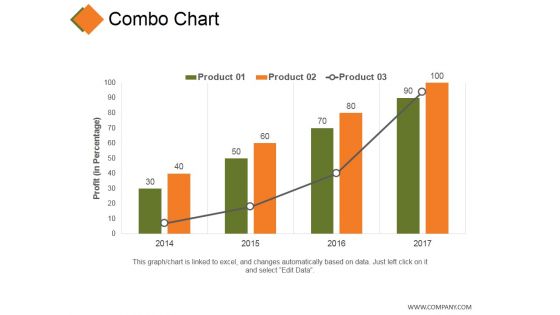
Combo Chart Ppt PowerPoint Presentation Ideas Brochure
This is a combo chart ppt powerpoint presentation ideas brochure. This is a four stage process. The stages in this process are product, profit, growth, success, business.
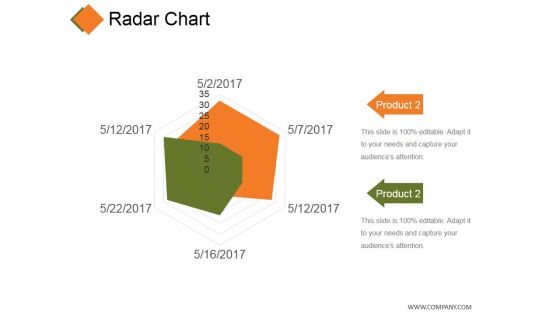
Radar Chart Ppt PowerPoint Presentation Show Demonstration
This is a radar chart ppt powerpoint presentation show demonstration. This is a two stage process. The stages in this process are product, shape, business, marketing.
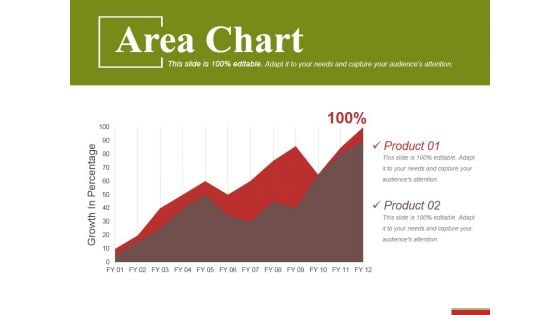
Area Chart Ppt PowerPoint Presentation Gallery Brochure
This is a area chart ppt powerpoint presentation gallery brochure. This is a two stage process. The stages in this process are product, growth in percentage, success, business.
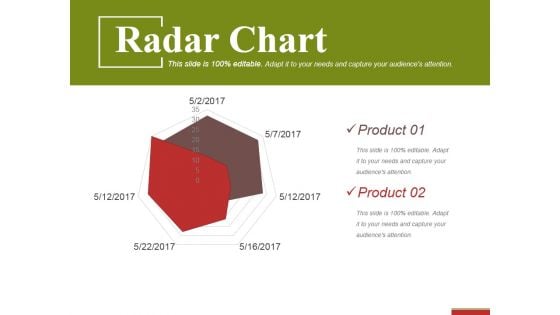
Radar Chart Ppt PowerPoint Presentation Summary Skills
This is a radar chart ppt powerpoint presentation summary skills. This is a two stage process. The stages in this process are product, shape, business, marketing.
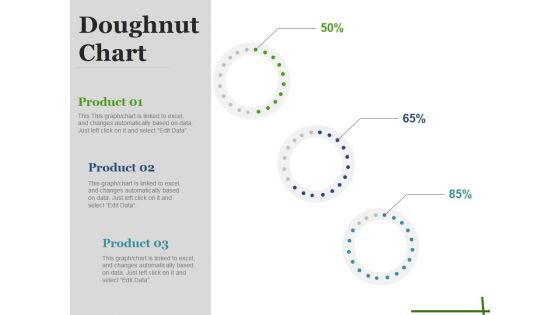
Doughnut Chart Ppt PowerPoint Presentation Styles Backgrounds
This is a doughnut chart ppt powerpoint presentation styles backgrounds. This is a three stage process. The stages in this process are percentage, finance, business, marketing, strategy.
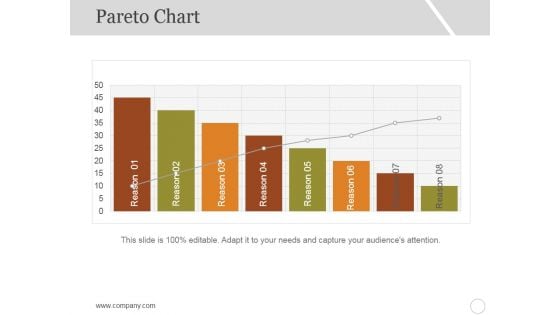
Pareto Chart Ppt PowerPoint Presentation Show Vector
This is a pareto chart ppt powerpoint presentation show vector. This is a eight stage process. The stages in this process are reason, business, marketing, graph, decline.
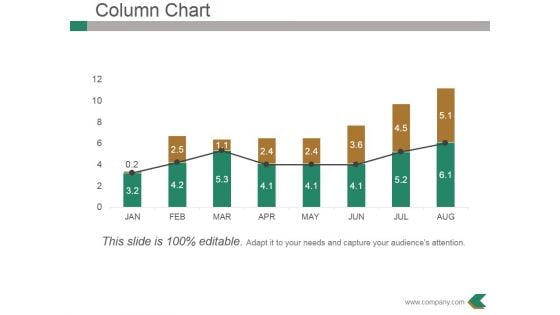
Column Chart Ppt PowerPoint Presentation Professional Example
This is a column chart ppt powerpoint presentation professional example. This is a eight stage process. The stages in this process are bar graph, growth, success, business, marketing.
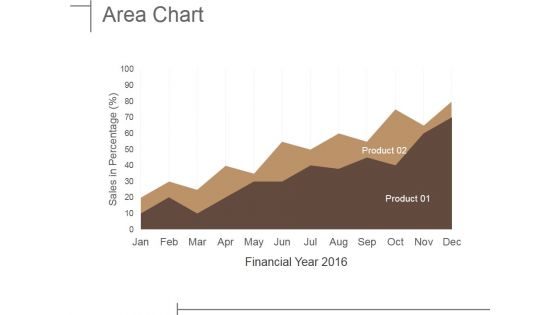
Area Chart Ppt PowerPoint Presentation Ideas Guide
This is a area chart ppt powerpoint presentation ideas guide. This is a two stage process. The stages in this process are growth, finance, success, business, marketing.
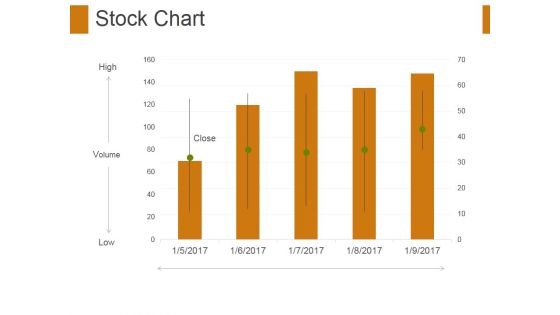
Stock Chart Ppt PowerPoint Presentation Gallery Files
This is a stock chart ppt powerpoint presentation gallery files. This is a five stage process. The stages in this process are high, volume, low, close.
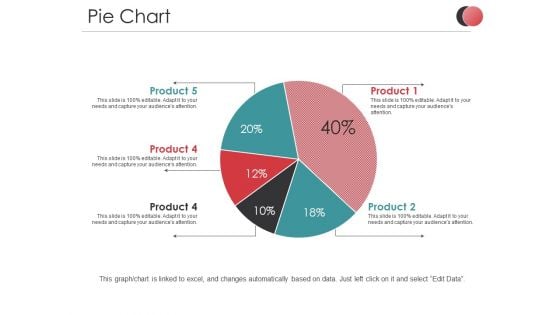
Pie Chart Ppt PowerPoint Presentation Slides Files
This is a pie chart ppt powerpoint presentation slides files. This is a five stage process. The stages in this process are product, percentage, business, marketing, process.
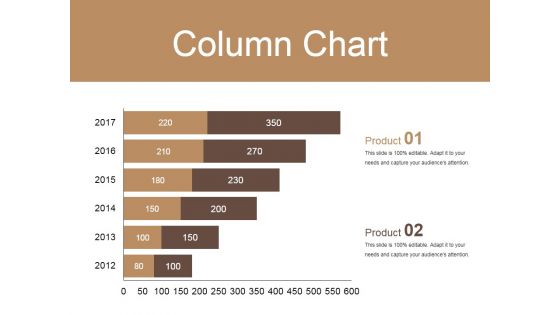
Column Chart Ppt PowerPoint Presentation Show Visuals
This is a column chart ppt powerpoint presentation show visuals. This is a two stage process. The stages in this process are product, year, success, step, business.
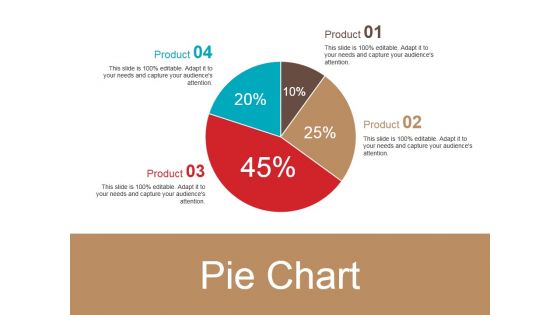
Pie Chart Ppt PowerPoint Presentation Ideas Slideshow
This is a pie chart ppt powerpoint presentation ideas slideshow. This is a four stage process. The stages in this process are pie, process, percentage, finance, business.
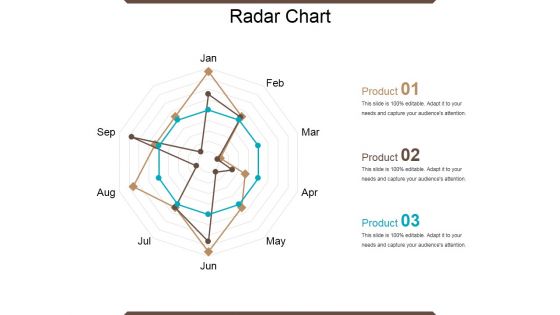
Radar Chart Ppt PowerPoint Presentation Layouts Elements
This is a radar chart ppt powerpoint presentation layouts elements. This is a three stage process. The stages in this process are product, shapes, business, marketing.
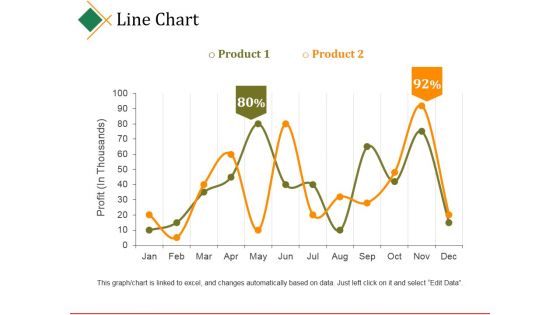
Line Chart Ppt PowerPoint Presentation Portfolio Shapes
This is a line chart ppt powerpoint presentation portfolio shapes. This is a two stage process. The stages in this process are profit, product, business, marketing, graph.
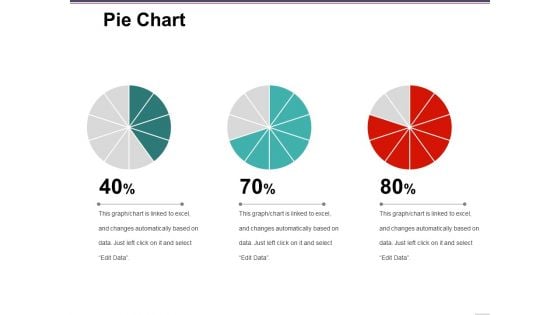
Pie Chart Ppt PowerPoint Presentation Layouts Good
This is a pie chart ppt powerpoint presentation layouts good. This is a three stage process. The stages in this process are finance, marketing, management, process, business.
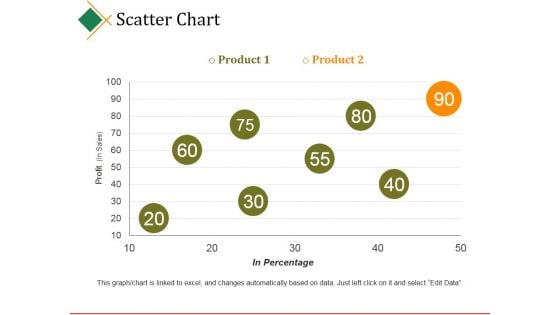
Scatter Chart Ppt PowerPoint Presentation Model
This is a scatter chart ppt powerpoint presentation model. This is a two stage process. The stages in this process are business, product, profit, in percentage, business.

Stock Chart Ppt PowerPoint Presentation Show Information
This is a stock chart ppt powerpoint presentation show information. This is a five stage process. The stages in this process are high, volume, low, open, close .

Column Chart Ppt PowerPoint Presentation Ideas Inspiration
This is a column chart ppt powerpoint presentation ideas inspiration. This is a five stage process. The stages in this process are graph, year, business, marketing, product.
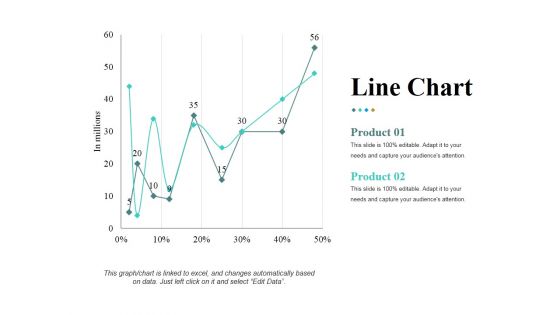
Line Chart Ppt PowerPoint Presentation Pictures Ideas
This is a line chart ppt powerpoint presentation pictures ideas. This is a two stage process. The stages in this process are in millions, percentage, finance, product, growth.
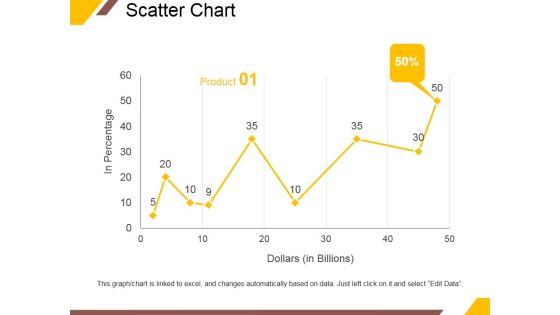
Scatter Chart Ppt PowerPoint Presentation Gallery Vector
This is a scatter chart ppt powerpoint presentation gallery vector. This is a nine stage process. The stages in this process are in percentage, dollars, product, percentage, finance.

Rader Chart Ppt PowerPoint Presentation Professional Pictures
This is a rader chart ppt powerpoint presentation professional pictures. This is a two stage process. The stages in this process are product, finance, business, marketing.
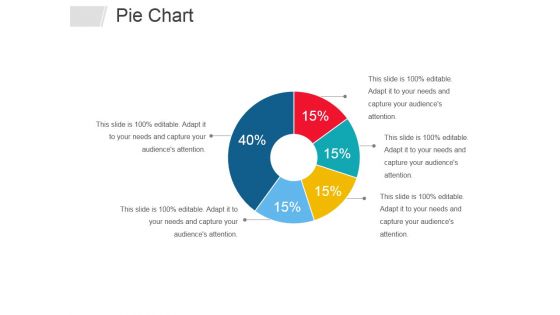
Pie Chart Ppt PowerPoint Presentation Infographics Templates
This is a pie chart ppt powerpoint presentation infographics templates. This is a five stage process. The stages in this process are business, percentage, management, process.
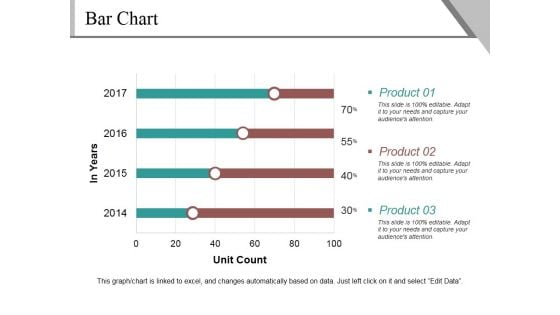
Bar Chart Ppt PowerPoint Presentation Summary Pictures
This is a bar chart ppt powerpoint presentation summary pictures. This is a four stage process. The stages in this process are product, unit count, finance, percentage, business.
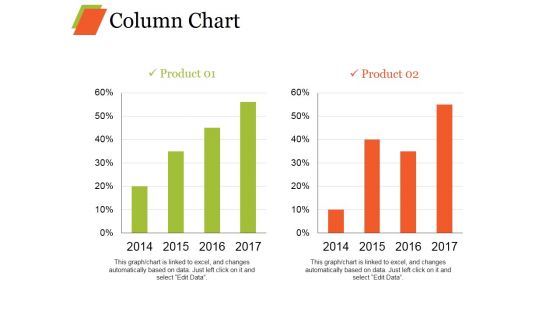
Column Chart Ppt PowerPoint Presentation Infographics Model
This is a column chart ppt powerpoint presentation infographics model. This is a two stage process. The stages in this process are bar graph, growth, product, percentage, year.
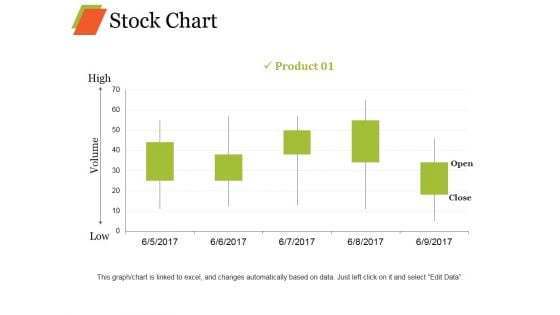
Stock Chart Ppt PowerPoint Presentation Professional Objects
This is a stock chart ppt powerpoint presentation professional objects. This is a five stage process. The stages in this process are product, high, volume, low, open, close.
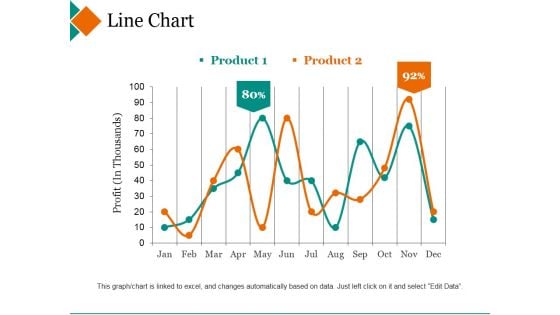
Line Chart Ppt PowerPoint Presentation Inspiration Deck
This is a line chart ppt powerpoint presentation inspiration deck. This is a two stage process. The stages in this process are product, profit, percentage, finance, line graph.
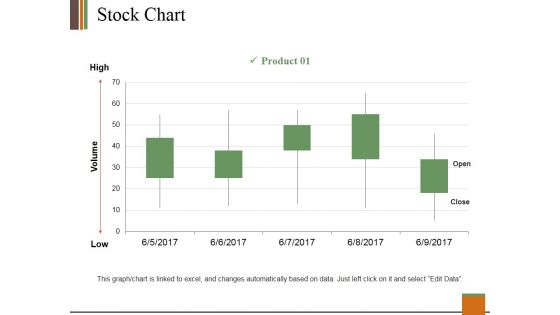
Stock Chart Ppt PowerPoint Presentation Slides Clipart
This is a stock chart ppt powerpoint presentation slides clipart. This is a one stage process. The stages in this process are product, high, volume, low, open, close.
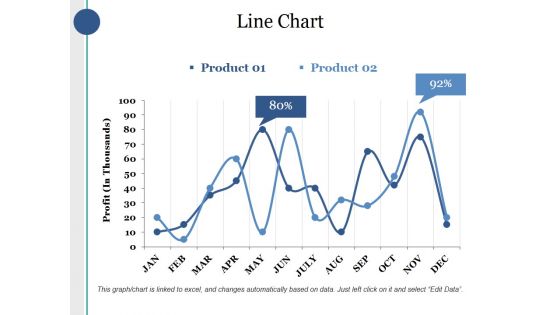
Line Chart Ppt PowerPoint Presentation Layouts Sample
This is a line chart ppt powerpoint presentation layouts sample. This is a two stage process. The stages in this process are product, profit, percentage, finance, business.
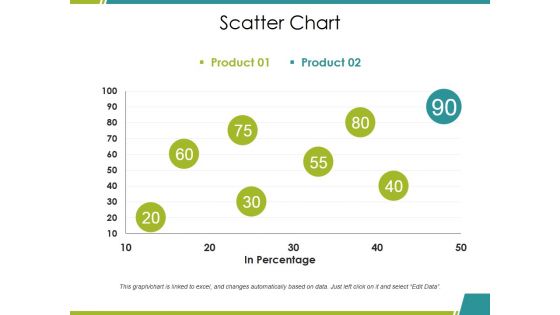
Scatter Chart Ppt PowerPoint Presentation Summary Inspiration
This is a scatter chart ppt powerpoint presentation summary inspiration. This is a two stage process. The stages in this process are product, in percentage, growth, success, business.
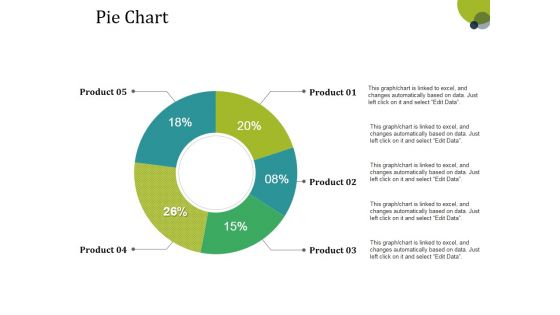
Pie Chart Ppt PowerPoint Presentation Inspiration Summary
This is a pie chart ppt powerpoint presentation inspiration summary. This is a five stage process. The stages in this process are product, donut, business, percentage, marketing.
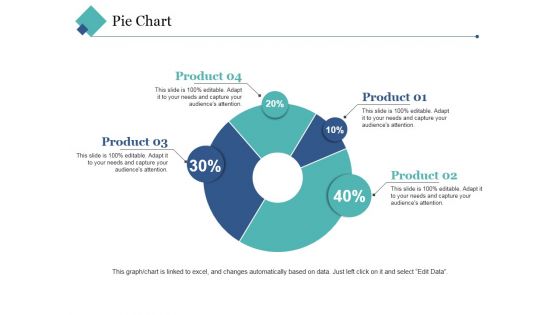
Pie Chart Ppt PowerPoint Presentation Layouts Elements
This is a pie chart ppt powerpoint presentation layouts elements. This is a four stage process. The stages in this process are product, business, marketing, percentage, growth.
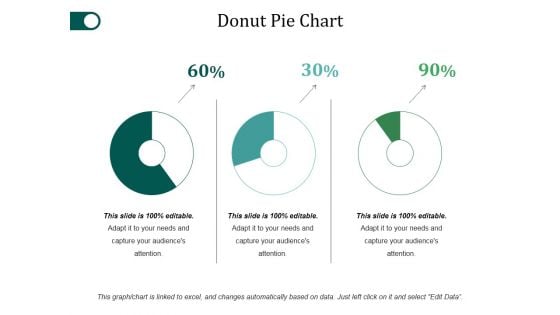
Donut Pie Chart Ppt PowerPoint Presentation Examples
This is a donut pie chart ppt powerpoint presentation examples. This is a three stage process. The stages in this process are percentage, finance, donut, business.
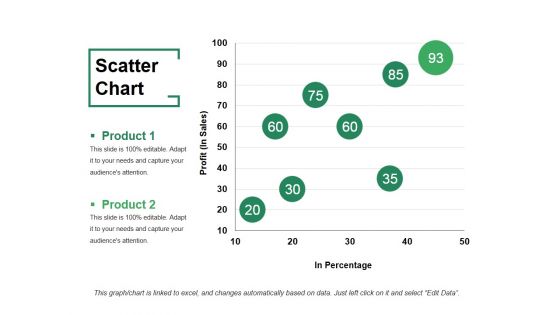
Scatter Chart Ppt PowerPoint Presentation File Visuals
This is a scatter chart ppt powerpoint presentation file visuals. This is a two stage process. The stages in this process are product, profit, in percentage, growth, success.
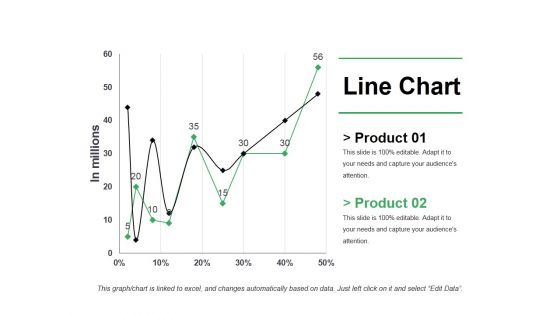
Line Chart Ppt PowerPoint Presentation Pictures Shapes
This is a line chart ppt powerpoint presentation pictures shapes. This is a two stage process. The stages in this process are business, marketing, strategy, finance, growth.
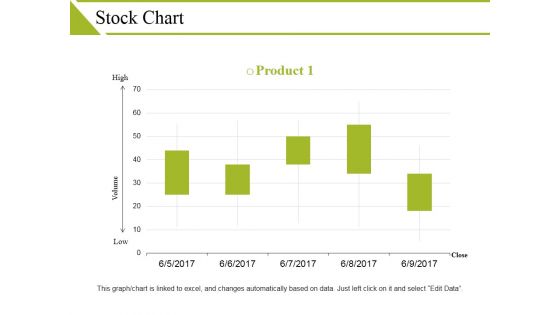
Stock Chart Ppt PowerPoint Presentation Show Guidelines
This is a stock chart ppt powerpoint presentation show guidelines. This is a one stage process. The stages in this process are high, volume, low, product, close.
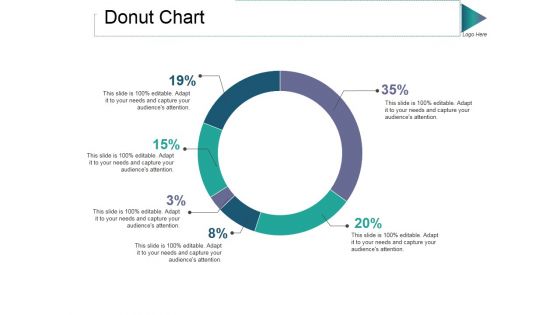
Donut Chart Ppt PowerPoint Presentation Gallery Guide
This is a donut chart ppt powerpoint presentation gallery guide. This is a six stage process. The stages in this process are percentage, finance, donut, business, process.
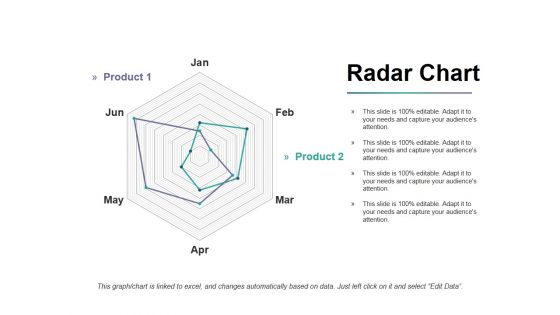
Radar Chart Ppt PowerPoint Presentation Infographics Portfolio
This is a radar chart ppt powerpoint presentation infographics portfolio. This is a two stage process. The stages in this process are product, finance, shapes, business, marketing.
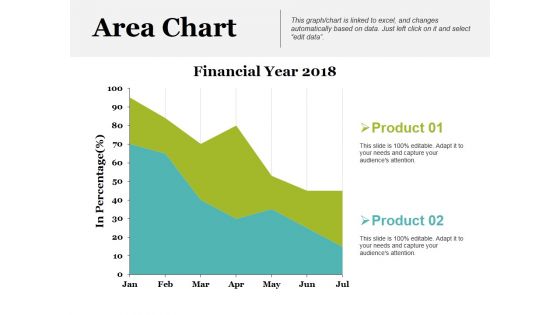
Area Chart Ppt PowerPoint Presentation Show Backgrounds
This is a area chart ppt powerpoint presentation show backgrounds. This is a two stage process. The stages in this process are financial year, product, in percentage.
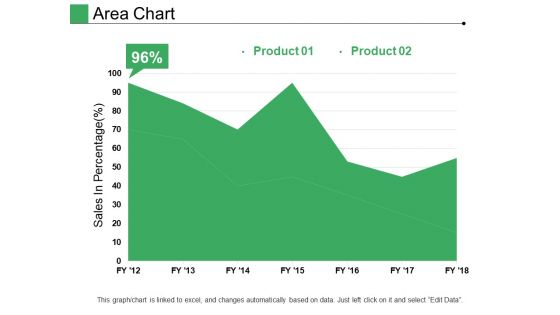
Area Chart Ppt PowerPoint Presentation Pictures Designs
This is a area chart ppt powerpoint presentation pictures designs. This is a two stage process. The stages in this process are product, sales in percentage, growth, success.
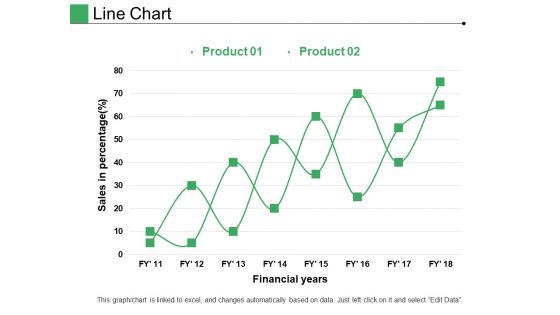
Line Chart Ppt PowerPoint Presentation Pictures Layout
This is a line chart ppt powerpoint presentation pictures layout. This is a two stage process. The stages in this process are product, financial years, sales in percentage.
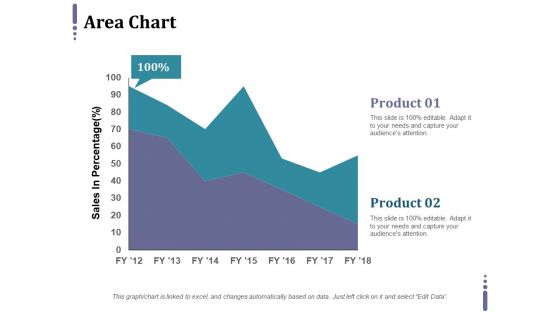
Area Chart Ppt PowerPoint Presentation Professional Grid
This is a area chart ppt powerpoint presentation professional grid. This is a two stage process. The stages in this process are product, sales in percentage, business.
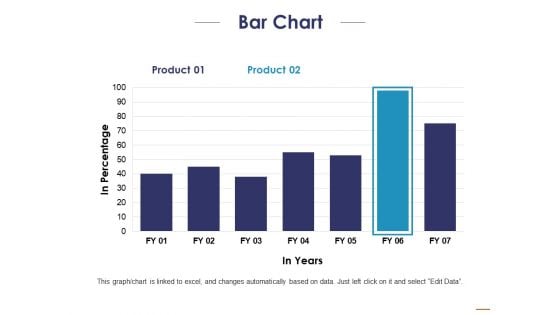
Bar Chart Ppt PowerPoint Presentation Portfolio Inspiration
This is a bar chart ppt powerpoint presentation portfolio inspiration. This is a two stage process. The stages in this process are product, in percentage, in years.
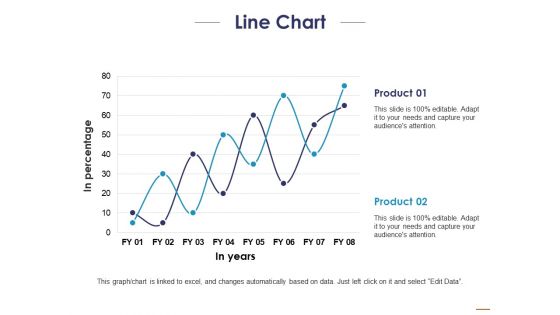
Line Chart Ppt PowerPoint Presentation Layouts Templates
This is a line chart ppt powerpoint presentation layouts templates. This is a two stage process. The stages in this process are product, in percentage, in years.

Stock Chart Ppt PowerPoint Presentation Layouts Outfit
This is a stock chart ppt powerpoint presentation layouts outfit. This is a two stage process. The stages in this process are close, high, volume, low, open.
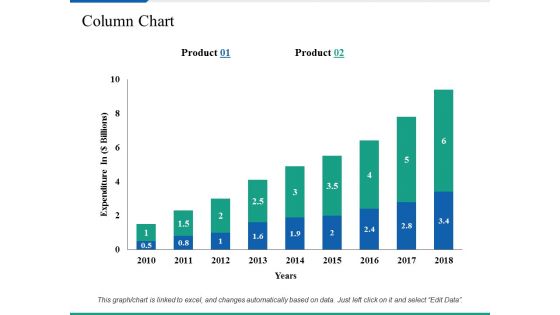
Column Chart Ppt PowerPoint Presentation Ideas Demonstration
This is a column chart ppt powerpoint presentation ideas demonstration. This is a two stage process. The stages in this process are business, marketing, expenditure in, strategy, graph.
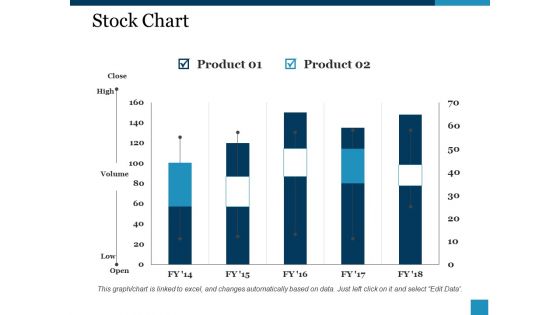
Stock Chart Ppt PowerPoint Presentation Guide
This is a stock chart ppt powerpoint presentation guide. This is a two stage process. The stages in this process are product, close, high, volume, low.
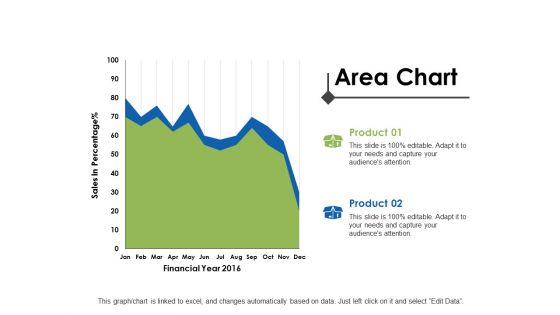
Area Chart Ppt PowerPoint Presentation Summary Model
This is a area chart ppt powerpoint presentation summary model. This is a two stage process. The stages in this process are analysis, finance, marketing, management, investment.
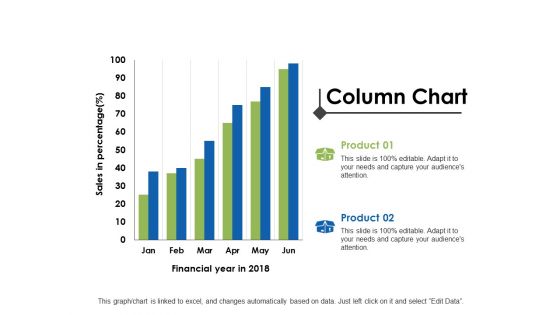
Column Chart Ppt PowerPoint Presentation Layouts Rules
This is a column chart ppt powerpoint presentation layouts rules. This is a two stage process. The stages in this process are analysis, finance, marketing, management, investment.

Column Chart Ppt PowerPoint Presentation Portfolio Inspiration
This is a column chart ppt powerpoint presentation portfolio inspiration. This is a two stage process. The stages in this process are finance, marketing, management, investment, analysis.
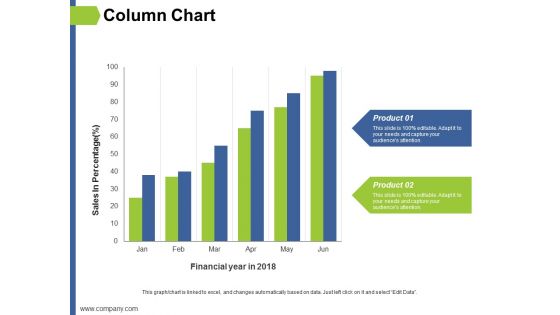
Column Chart Ppt PowerPoint Presentation Slides Format
This is a column chart ppt powerpoint presentation slides format. This is a two stage process. The stages in this process are finance, marketing, management, investment, analysis.
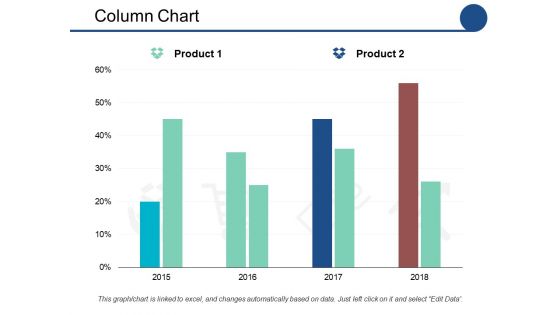
Column Chart Ppt PowerPoint Presentation Show Outfit
This is a column chart ppt powerpoint presentation show outfit. This is a two stage process. The stages in this process are product, percentage, marketing.
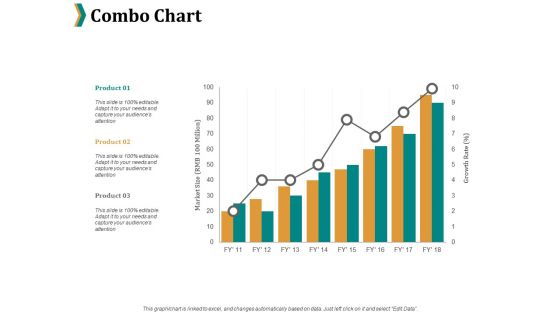
Combo Chart Ppt PowerPoint Presentation File Example
This is a combo chart ppt powerpoint presentation file example. This is a three stage process. The stages in this process are product, percentage, marketing, business, management.
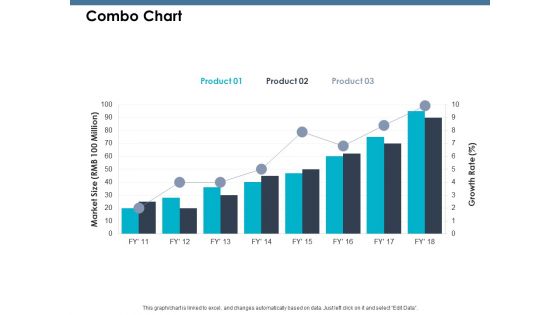
Combo Chart Ppt PowerPoint Presentation Model Grid
This is a combo chart ppt powerpoint presentation model grid. This is a three stage process. The stages in this process are growth, product, percentage, marketing.
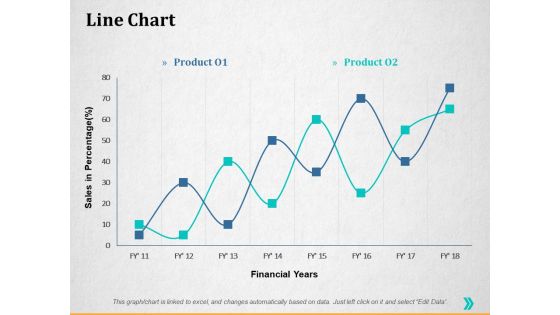
Line Chart Ppt PowerPoint Presentation Summary Guidelines
This is a line chart ppt powerpoint presentation summary guidelines. This is a two stage process. The stages in this process are percentage, product, business, management, marketing.
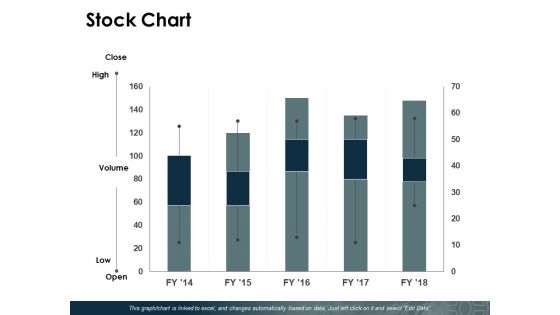
Stock Chart Ppt PowerPoint Presentation Show Pictures
This is a stock chart ppt powerpoint presentation show pictures. This is a five stage process. The stages in this process are product, percentage, management, marketing.

Pie Chart Ppt PowerPoint Presentation Model Smartart
This is a pie chart ppt powerpoint presentation model smartart. This is a five stage process. The stages in this process are management, marketing, business, percentage, product.
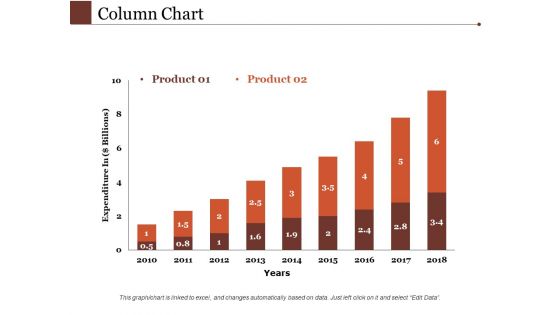
Column Chart Ppt PowerPoint Presentation Gallery Templates
This is a column chart ppt powerpoint presentation gallery templates. This is a two stage process. The stages in this process are management, marketing, business, percentage.
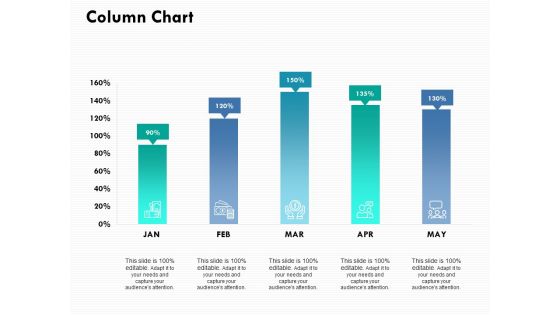
Column Chart Ppt PowerPoint Presentation Ideas Example
This is a column chart ppt powerpoint presentation ideas example. This is a five stage process. The stages in this process are percentage, product, management, marketing.
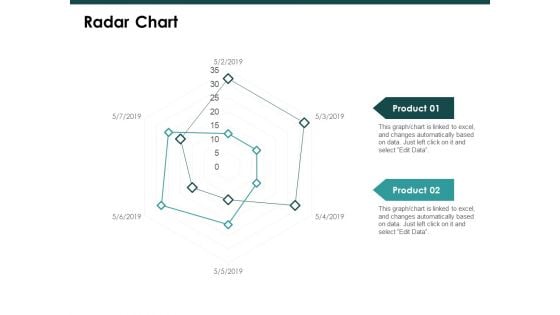
Radar Chart Graph Ppt PowerPoint Presentation Slide
This is a radar chart graph ppt powerpoint presentation slide. This is a two stage process. The stages in this process are finance, marketing, management, investment, analysis.
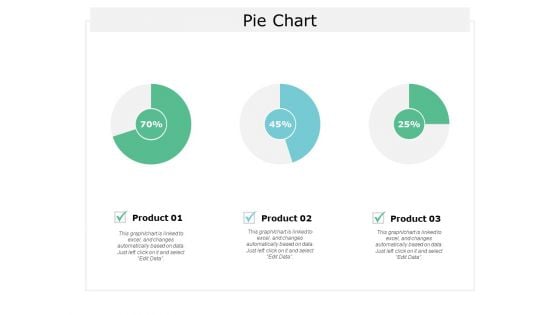
Pie Chart Finance Ppt Powerpoint Presentation Introduction
This is a pie chart finance ppt powerpoint presentation introduction. This is a three stage process. The stages in this process are finance, marketing, analysis, investment, strategy.
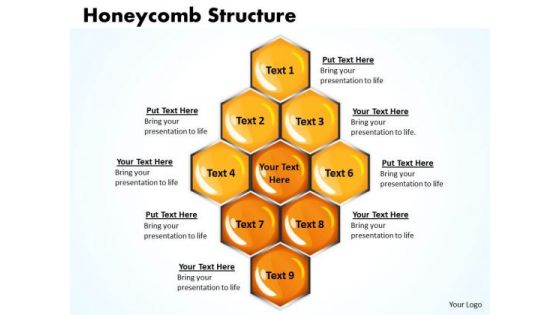
Sales Diagram Honeycomb Structure Business Cycle Diagram
Document The Process On Our Sales Diagram Honeycomb Structure Business Cycle Diagram Powerpoint Templates. Make A Record Of Every Detail.
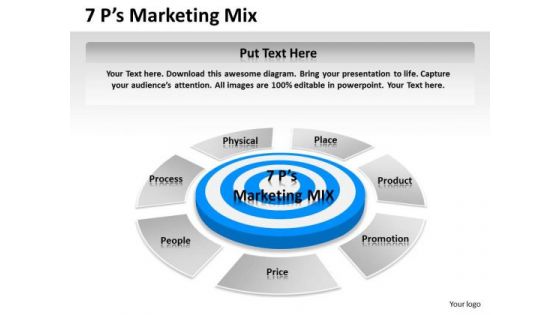
Business Diagram 7p Marketing Mix Sales Diagram
Document The Process On Our Business Diagram 7P Marketing Mix Sales Diagram Powerpoint Templates. Make A Record Of Every Detail.
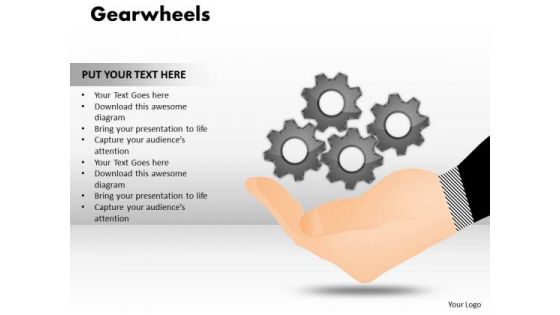
Business Cycle Diagram Gearwheels Marketing Diagram
Document The Process On Our Business Cycle Diagram Gearwheels Marketing Diagram Powerpoint Templates. Make A Record Of Every Detail.
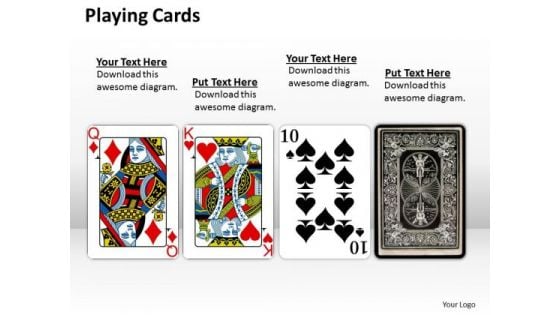
Business Diagram Playing Cards Marketing Diagram
Document The Process On Our Business Diagram playing cards Marketing Diagram Powerpoint Templates. Make A Record Of Every Detail.
Business Cycle Diagram Presentation Business Diagram
Document The Process On Our Business Cycle Diagram Presentation Business Diagram Powerpoint Templates. Make A Record Of Every Detail.
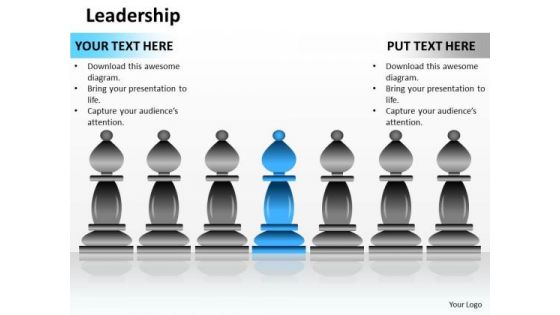
Business Cycle Diagram Leader Ship Business Diagram
Document The Process On Our Business Cycle Diagram Leader ship Business Diagram Powerpoint Templates. Make A Record Of Every Detail.

Business Cycle Diagram Sad Faces Sales Diagram
Document The Process On Our Business Cycle Diagram Sad Faces Sales Diagram Powerpoint Templates. Make A Record Of Every Detail.

Business Diagram Business Growth Business Cycle Diagram
Document The Process On Our Business Diagram Business Growth Business Cycle Diagram Powerpoint Templates. Make A Record Of Every Detail.
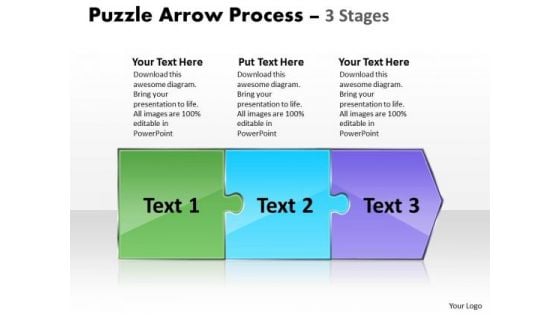
Consulting Diagram Puzzle 3 Stages Strategy Diagram
Document The Process On Our Consulting Diagram Puzzle 3 Stages Strategy Diagram Powerpoint Templates. Make A Record Of Every Detail.
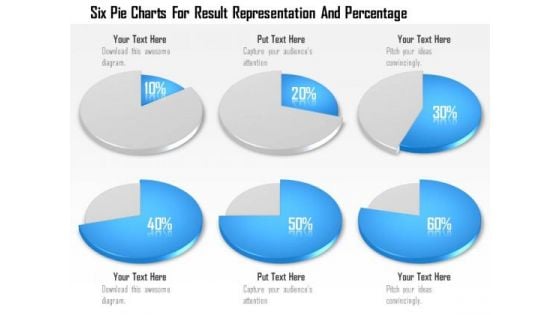
Business Diagram Six Pie Charts For Result Representation And Percentage Presentation Template
Display the concept of result analysis in your business presentation. This PPT slide contains the graphic of six pie charts. Use this PPT slide for your business and marketing data related presentations.
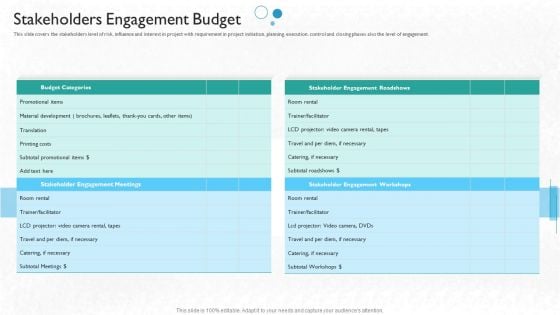
Partner Engagement Planning Procedure Stakeholders Engagement Budget Themes PDF
This slide covers the stakeholders level of risk, influence and interest in project with requirement in project initiation, planning, execution, control and closing phases also the level of engagement. Deliver and pitch your topic in the best possible manner with this partner engagement planning procedure stakeholders engagement budget themes pdf. Use them to share invaluable insights on stakeholders level, project initiation, planning and impress your audience. This template can be altered and modified as per your expectations. So, grab it now.
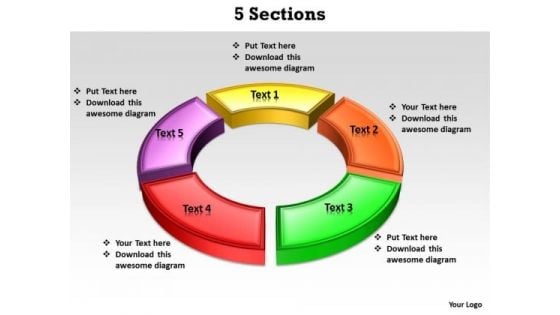
Ppt 5 Sections PowerPoint Templates
PPT 5 sections PowerPoint Templates--PowerPoint presentations on Abstract, Around, Arrow, Arrow Circle Diagram, Arrow Circles, Chart, Circle, Circle Diagram, Circular, Circular Arrows, Circular Flow, Circulation, Color, Cycle, Cycle Arrows, Cyclic, Diagram, Direction, Element, Five, Flow, Four, Glossy, Illustration, Kind Of Diagram, Loop, Motion, Movement, Process, Process Diagram, Refresh, Ring, Rotation, Round, Round Diagram, Section, Segment, Set, Shape, Sign, Symbol, Vector, Vibrant-PPT 5 sections PowerPoint Templates Communicate your clear thoughts with our Ppt 5 Sections PowerPoint Templates. You will come out on top.

Flow Chart Converging Factors 5 Steps Circular Process Diagram PowerPoint Templates
We present our flow chart converging factors 5 steps Circular Process Diagram PowerPoint templates.Download our Business PowerPoint Templates because you can Flutter your wings and enchant the world. Impress them with the innate attractiveness of your thoughts and words. Download and present our Process and Flows PowerPoint Templates because there are a bucketful of brilliant ideas swirling around within your group. Present our Shapes PowerPoint Templates because leading from the front is your preferred style. Present our Success PowerPoint Templates because you have come up with a brilliant breakthrough idea. you can also visualise the interest it will generate. Use our Circle Charts PowerPoint Templates because it gives you really bright ideas.Use these PowerPoint slides for presentations relating to Diagram, Arrow, Chart, Circle, Circular, Circulation, Concept, Connection, Continuity, Course, Direction, Duplicate, Flow, Presentation, Procedure, Process, Round, Step, Strategy, Success, System, Work Flow. The prominent colors used in the PowerPoint template are Yellow, Gray, White. People tell us our flow chart converging factors 5 steps Circular Process Diagram PowerPoint templates will generate and maintain the level of interest you desire. They will create the impression you want to imprint on your audience. Professionals tell us our Circular PowerPoint templates and PPT Slides are Elegant. Customers tell us our flow chart converging factors 5 steps Circular Process Diagram PowerPoint templates are Striking. Use our Concept PowerPoint templates and PPT Slides are Chic. We assure you our flow chart converging factors 5 steps Circular Process Diagram PowerPoint templates are Dazzling. Professionals tell us our Concept PowerPoint templates and PPT Slides are Fancy. Cash in on a bargain with our Flow Chart Converging Factors 5 Steps Circular Process Diagram PowerPoint Templates. Dont pass up this opportunity to shine.
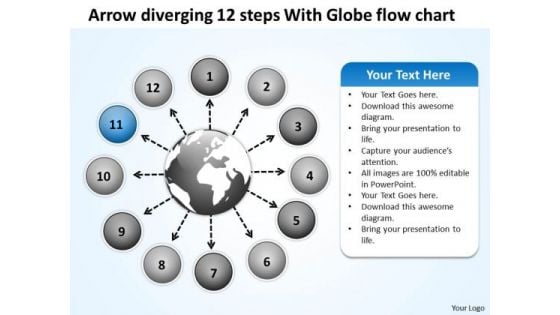
Diverging 12 Steps With Globe Flow Chart Ppt Circular Process Diagram PowerPoint Templates
We present our diverging 12 steps with globe flow chart ppt Circular Process Diagram PowerPoint templates.Present our Globe PowerPoint Templates because this Slide offers an excellent background to build up the various stages of your business process. Download and present our Business PowerPoint Templates because maximising sales of your product is the intended destination. Download and present our Circle Charts PowerPoint Templates because you can Highlight the key components of your entire manufacturing/ business process. Download and present our Process and flows PowerPoint Templates because you can Decorate it with your well wrapped ideas and colourful thoughts. Present our Marketing PowerPoint Templates because these slides are the triggers of our growth.Use these PowerPoint slides for presentations relating to Around, arrow, business, chart, circle,circular, circulation, commerce, concept,curving, cycle, diagram, direction,element, finance, financial,flow, flowchart, flowing, global, globe,internet, investment, loop, map, market,motion, movement, moving,presentation, process, recession,recycle, repeat, repetitive, ring, rotation,round, savings, shape. The prominent colors used in the PowerPoint template are Blue light, Black, White. People tell us our diverging 12 steps with globe flow chart ppt Circular Process Diagram PowerPoint templates will help you be quick off the draw. Just enter your specific text and see your points hit home. Professionals tell us our circle PowerPoint templates and PPT Slides will get their audience's attention. We assure you our diverging 12 steps with globe flow chart ppt Circular Process Diagram PowerPoint templates are Cheerful. PowerPoint presentation experts tell us our commerce PowerPoint templates and PPT Slides have awesome images to get your point across. We assure you our diverging 12 steps with globe flow chart ppt Circular Process Diagram PowerPoint templates are Awesome. People tell us our circle PowerPoint templates and PPT Slides are Striking. Our Diverging 12 Steps With Globe Flow Chart Ppt Circular Process Diagram PowerPoint Templates amplify your erudition. You will be earmarked for your brilliance.
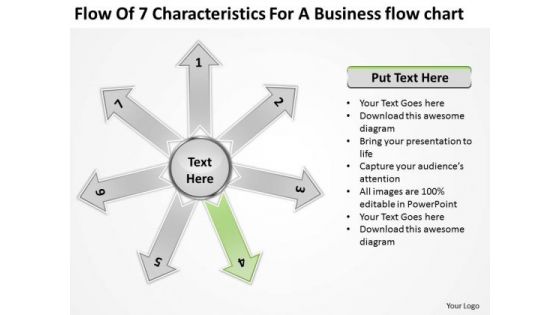
For A E Business PowerPoint Presentation Chart Circular Flow Diagram Templates
We present our for a e business powerpoint presentation chart Circular Flow Diagram templates.Download our Arrows PowerPoint Templates because it shows subtle changes that are taking place. Download and present our Circle Charts PowerPoint Templates because Our PowerPoint Templates and Slides will definately Enhance the stature of your presentation. Adorn the beauty of your thoughts with their colourful backgrounds. Use our Process and Flows PowerPoint Templates because this diagram helps you to show goal also clearly etched in your mind. Use our Business PowerPoint Templates because you have had a great year or so business wise. It is time to celebrate the efforts of your team. Download and present our Shapes PowerPoint Templates because it enlightens your team and colleagues on the critical factors involved.Use these PowerPoint slides for presentations relating to Abstract, Around, Arrows, Background, Blue, Center, Chart, Circle, Circular, Concept, Connection, Cycle, Distribution, Empty, Five, Gold, Graph, Illustration, Objects, Pieces, Process, Round, Segment, Shape, Space, System, Technology. The prominent colors used in the PowerPoint template are Green, Gray, White. Professionals tell us our for a e business powerpoint presentation chart Circular Flow Diagram templates are No-nonsense. You can be sure our Arrows PowerPoint templates and PPT Slides are Fancy. Customers tell us our for a e business powerpoint presentation chart Circular Flow Diagram templates are Gorgeous. Professionals tell us our Blue PowerPoint templates and PPT Slides are Versatile. People tell us our for a e business powerpoint presentation chart Circular Flow Diagram templates are Cheerful. People tell us our Background PowerPoint templates and PPT Slides will impress their bosses and teams. Train your team with our For A E Business PowerPoint Presentation Chart Circular Flow Diagram Templates. Download without worries with our money back guaranteee.
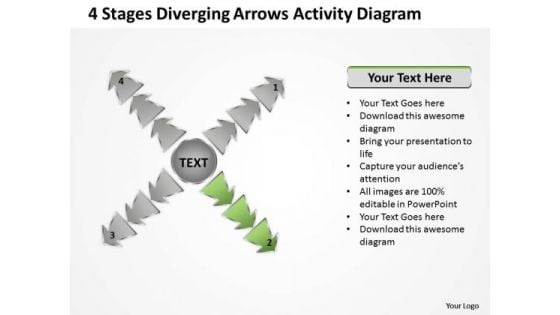
4 Stages Diverging Arrows Activity Diagram Ppt Cycle Chart PowerPoint Templates
We present our 4 stages diverging arrows activity diagram ppt Cycle Chart PowerPoint templates.Present our Process and Flows PowerPoint Templates because in our day to day pursuits we tend to overlook the fundamentals. Download our Business PowerPoint Templates because this template helps you to grab the attention of your listeners. Download our Arrows PowerPoint Templates because you have to coordinate and motivate your team. Download and present our Flow Charts PowerPoint Templates because you can Educate your team with the attention to be paid. Download and present our Success PowerPoint Templates because this is the unerring accuracy in reaching the target. the effortless ability to launch into flight.Use these PowerPoint slides for presentations relating to Business, Chart, Circle, Cyclic, Data, Diagram, Financial, Goal, Graph, Illustration, Info, Information, Marketing, Model, Option, Part, Pie, Presentation, Process, Result, Sphere, Statistics. The prominent colors used in the PowerPoint template are Green, Gray, White. People tell us our 4 stages diverging arrows activity diagram ppt Cycle Chart PowerPoint templates are Youthful. Customers tell us our Circle PowerPoint templates and PPT Slides will help you be quick off the draw. Just enter your specific text and see your points hit home. People tell us our 4 stages diverging arrows activity diagram ppt Cycle Chart PowerPoint templates are Nostalgic. Professionals tell us our Graph PowerPoint templates and PPT Slides are Pleasant. Customers tell us our 4 stages diverging arrows activity diagram ppt Cycle Chart PowerPoint templates are Whimsical. Use our Graph PowerPoint templates and PPT Slides are Quaint. Knit a great story with our 4 Stages Diverging Arrows Activity Diagram Ppt Cycle Chart PowerPoint Templates. Make sure your presentation gets the attention it deserves.
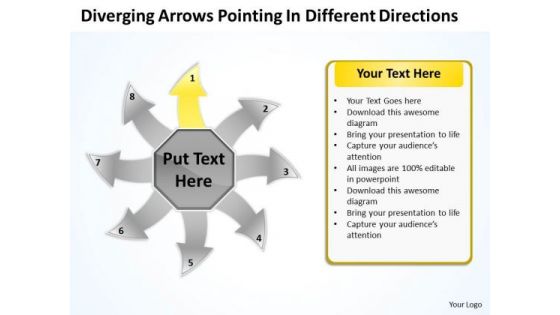
Diverging Arrows Pointing Different Directions Ppt Charts And Diagrams PowerPoint Templates
We present our diverging arrows pointing different directions ppt Charts and Diagrams PowerPoint templates.Download our Communication PowerPoint Templates because you have the people in place, selected the team leaders and all are raring to go. Use our Arrows PowerPoint Templates because they highlight the depth of your thought process. Present our Circle Charts PowerPoint Templates because you can asked to strive to give true form to your great dream. Use our Business PowerPoint Templates because profit levels have been steady over the recent past. Spread your heightened excitement to others in the room. Use our Shapes PowerPoint Templates because this business powerpoint template helps expound on the logic of your detailed thought process to take your company forward.Use these PowerPoint slides for presentations relating to Arrow, Bio, Business, Chart, Circle, Concept, Control, Cycle, Design, Development, Diagram, Eco, Ecology, Environmental, Evaluate, Flow, Flowchart, Fresh, Graphic, Green, Idea, Infographic, Iterative, Life, Lifecycle, Management, Method, Model, Natural, Nature, Organic, Process, Quality, Recycle, Research, Schema, Spiral, Step, Strategy, Success, System. The prominent colors used in the PowerPoint template are Yellow, Gray, White. Customers tell us our diverging arrows pointing different directions ppt Charts and Diagrams PowerPoint templates look good visually. Customers tell us our Concept PowerPoint templates and PPT Slides will help you be quick off the draw. Just enter your specific text and see your points hit home. Presenters tell us our diverging arrows pointing different directions ppt Charts and Diagrams PowerPoint templates are Efficient. PowerPoint presentation experts tell us our Design PowerPoint templates and PPT Slides are Spiffy. Customers tell us our diverging arrows pointing different directions ppt Charts and Diagrams PowerPoint templates will generate and maintain the level of interest you desire. They will create the impression you want to imprint on your audience. Professionals tell us our Circle PowerPoint templates and PPT Slides will make you look like a winner. Achieving excellence is not extraordinary for our Diverging Arrows Pointing Different Directions Ppt Charts And Diagrams PowerPoint Templates. Being exceptional is the basic benchmark.
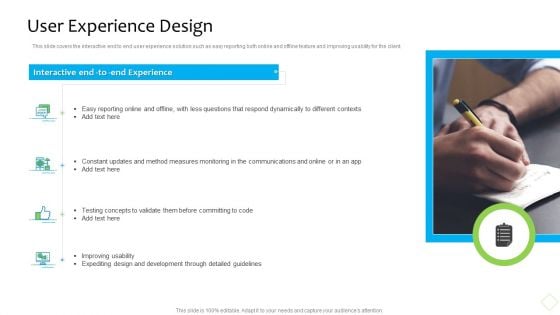
Product Demand Administration User Experience Design Diagrams PDF
This slide covers the interactive end to end user experience solution such as easy reporting both online and offline feature and improving usability for the client. This is a product demand administration user experience design diagrams pdf template with various stages. Focus and dispense information on four stages using this creative set, that comes with editable features. It contains large content boxes to add your information on topics like measures, development, expediting design. You can also showcase facts, figures, and other relevant content using this PPT layout. Grab it now.
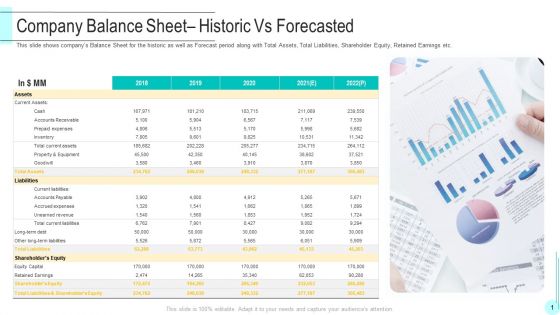
Company Balance Sheet Historic Vs Forecasted Diagrams PDF
This slide shows companys Balance Sheet for the historic as well as Forecast period along with Total Assets, Total Liabilities, Shareholder Equity, Retained Earnings etc. Presenting company balance sheet historic vs forecasted diagrams pdf to provide visual cues and insights. Share and navigate important information on one stage that need your due attention. This template can be used to pitch topics like accounts payable, accrued expenses, property and equipment. In addtion, this PPT design contains high resolution images, graphics, etc, that are easily editable and available for immediate download.
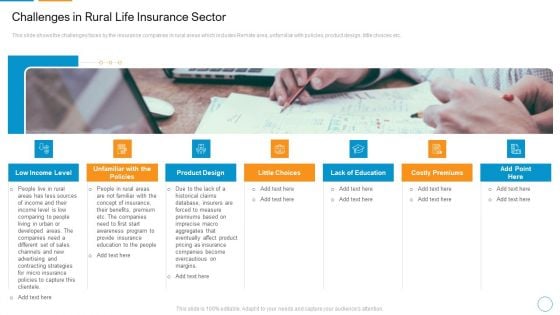
Challenges In Rural Life Insurance Sector Diagrams PDF
This slide shows the challenges faces by the insurance companies in rural areas which includes Remote area, unfamiliar with policies, product design, little choices etc This is a challenges in rural life insurance sector diagrams pdf template with various stages. Focus and dispense information on seven stages using this creative set, that comes with editable features. It contains large content boxes to add your information on topics like unfamiliar with the policies, lack of education, costly premiums. You can also showcase facts, figures, and other relevant content using this PPT layout. Grab it now.
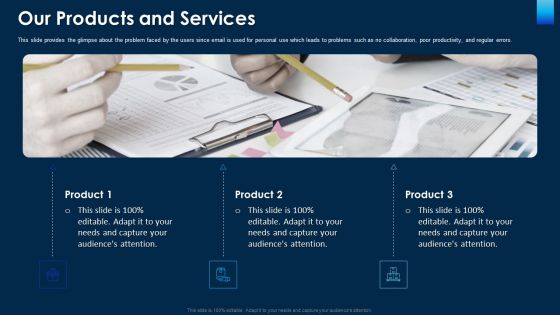
Our Products And Services Ppt Infographic Template Diagrams PDF
This slide provides the glimpse about the problem faced by the users since email is used for personal use which leads to problems such as no collaboration, poor productivity, and regular errors. Presenting our products and services ppt infographic template diagrams pdf to provide visual cues and insights. Share and navigate important information on three stages that need your due attention. This template can be used to pitch topics like our products and services. In addtion, this PPT design contains high resolution images, graphics, etc, that are easily editable and available for immediate download.

Strategy 2 Investment On New Technology And Digitalization Diagrams PDF
The slide explains the Technology Investment Strategy of the company. Under this, the slide covers major objective, strategic steps, and final impact of the strategy.Presenting strategy 2 investment on new technology and digitalization diagrams pdf to provide visual cues and insights. Share and navigate important information on three stages that need your due attention. This template can be used to pitch topics like objective, strategy, impact. In addtion, this PPT design contains high resolution images, graphics, etc, that are easily editable and available for immediate download.
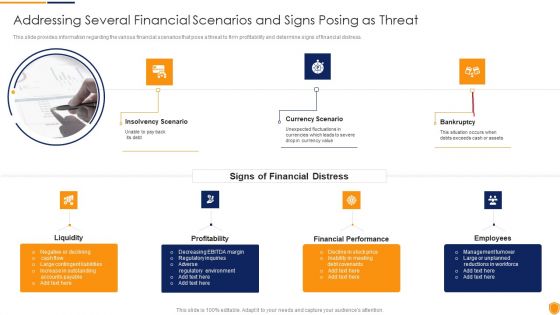
Mitigating Cybersecurity Threats And Vulnerabilities Addressing Several Financial Diagrams PDF
This slide provides information regarding the various financial scenarios that pose a threat to firm profitability and determine signs of financial distress. This is a mitigating cybersecurity threats and vulnerabilities addressing several financial diagrams pdf template with various stages. Focus and dispense information on three stages using this creative set, that comes with editable features. It contains large content boxes to add your information on topics like insolvency scenario, currency scenario, bankruptcy. You can also showcase facts, figures, and other relevant content using this PPT layout. Grab it now.
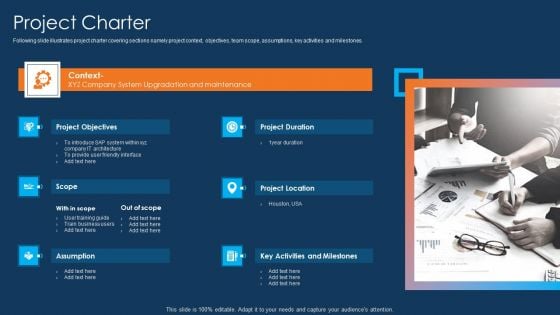
Information Technology Project Initiation Project Charter Diagrams PDF
Following slide illustrates project charter covering sections namely project context, objectives, team scope, assumptions, key activities and milestones. This is a information technology project initiation project charter diagrams pdf template with various stages. Focus and dispense information on six stages using this creative set, that comes with editable features. It contains large content boxes to add your information on topics like project objectives, scope, assumption, key activities and milestones, project location. You can also showcase facts, figures, and other relevant content using this PPT layout. Grab it now.
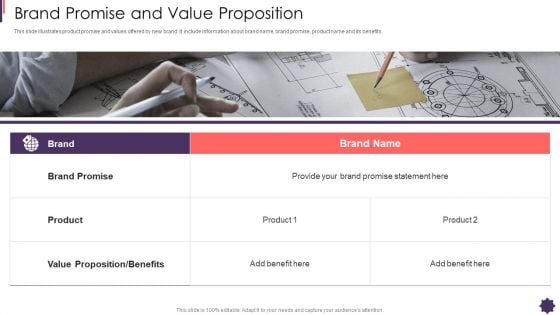
Brand Promise And Value Proposition Brand Techniques Structure Diagrams PDF
This slide illustrates product promise and values offered by new brand. It include information about brand name, brand promise, product name and its benefits. Presenting brand promise and value proposition brand techniques structure diagrams pdf to provide visual cues and insights. Share and navigate important information on one stages that need your due attention. This template can be used to pitch topics like brand promise and value proposition. In addtion, this PPT design contains high resolution images, graphics, etc, that are easily editable and available for immediate download.
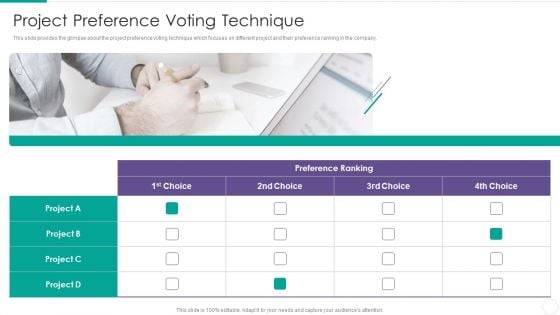
Quantitative Risk Assessment Project Preference Voting Technique Diagrams PDF
This slide provides the glimpse about the project preference voting technique which focuses on different project and their preference ranking in the company. Presenting Quantitative Risk Assessment Project Preference Voting Technique Diagrams PDF to provide visual cues and insights. Share and navigate important information on one stages that need your due attention. This template can be used to pitch topics like Project Preference Voting Technique. In addtion, this PPT design contains high resolution images, graphics, etc, that are easily editable and available for immediate download.
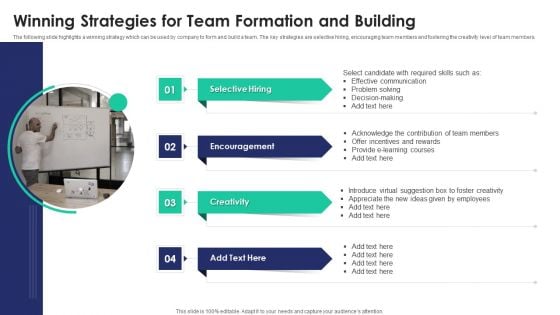
Winning Strategies For Team Formation And Building Diagrams PDF
The following slide highlights a winning strategy which can be used by company to form and build a team. The key strategies are selective hiring, encouraging team members and fostering the creativity level of team members.Persuade your audience using this Winning Strategies For Team Formation And Building Diagrams PDF. This PPT design covers four stages, thus making it a great tool to use. It also caters to a variety of topics including Selective Hiring, Encouragement, Creativity. Download this PPT design now to present a convincing pitch that not only emphasizes the topic but also showcases your presentation skills.
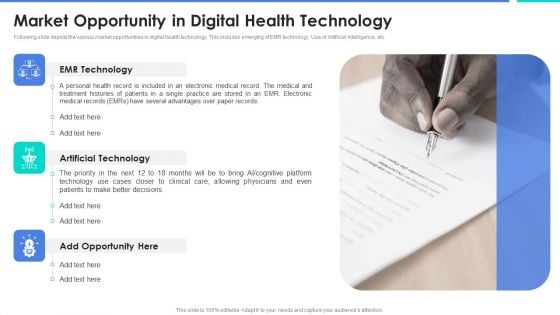
Market Opportunity In Digital Health Technology Diagrams PDF
Following slide depicts the various market opportunities in digital health technology. This includes emerging of EMR technology, Use of Artificial Intelligence, etc.This is a Market Opportunity In Digital Health Technology Diagrams PDF template with various stages. Focus and dispense information on three stages using this creative set, that comes with editable features. It contains large content boxes to add your information on topics like Emr Technology, Artificial Technology, Several Advantages. You can also showcase facts, figures, and other relevant content using this PPT layout. Grab it now.

Digitalization Of Operative Enterprises Change Drivers Why Converge Diagrams PDF
This slide covers the change drivers which are driving the IT OT convergence growth such as new edge to cloud architectures and new industrial connectivity protocols. This is a Digitalization Of Operative Enterprises Change Drivers Why Converge Diagrams PDF template with various stages. Focus and dispense information on four stages using this creative set, that comes with editable features. It contains large content boxes to add your information on topics like Market Share, Industrial Connectivity Protocols. You can also showcase facts, figures, and other relevant content using this PPT layout. Grab it now.
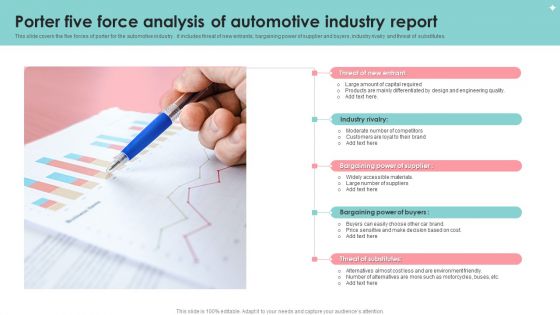
Porter Five Force Analysis Of Automotive Industry Report Diagrams PDF
This slide covers the five forces of porter for the automotive industry . it includes threat of new entrants, bargaining power of supplier and buyers, industry rivalry and threat of substitutes. Persuade your audience using this Porter Five Force Analysis Of Automotive Industry Report Diagrams PDF. This PPT design covers five stages, thus making it a great tool to use. It also caters to a variety of topics including Industry Rivalry, Customers, Materials. Download this PPT design now to present a convincing pitch that not only emphasizes the topic but also showcases your presentation skills.
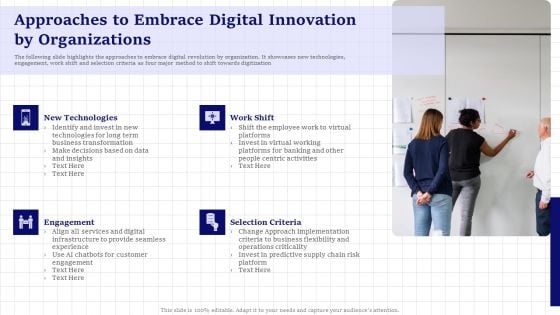
Approaches To Embrace Digital Innovation By Organizations Diagrams PDF
The following slide highlights the approaches to embrace digital revolution by organization. It showcases new technologies, engagement, work shift and selection criteria as four major method to shift towards digitization. Persuade your audience using this Approaches To Embrace Digital Innovation By Organizations Diagrams PDF. This PPT design covers four stages, thus making it a great tool to use. It also caters to a variety of topics including New Technologies, Work Shift, Selection Criteria, Engagement. Download this PPT design now to present a convincing pitch that not only emphasizes the topic but also showcases your presentation skills.
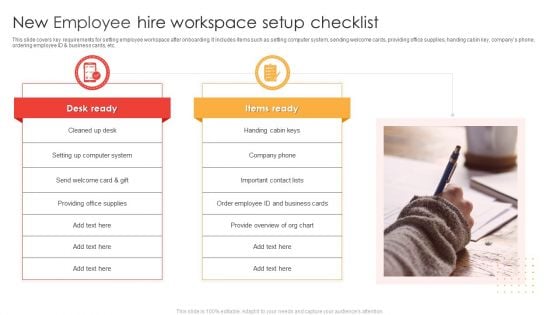
New Employee Hire Workspace Setup Checklist Ppt Model Diagrams PDF
This slide covers key requirements for setting employee workspace after onboarding. It includes items such as setting computer system, sending welcome cards, providing office supplies, handing cabin key, companys phone, ordering employee ID and business cards, etc. Persuade your audience using this New Employee Hire Workspace Setup Checklist Ppt Model Diagrams PDF. This PPT design covers two stages, thus making it a great tool to use. It also caters to a variety of topics including Cleaned Up Desk, Desk Ready, Items Ready. Download this PPT design now to present a convincing pitch that not only emphasizes the topic but also showcases your presentation skills.

 Home
Home