Icon Results
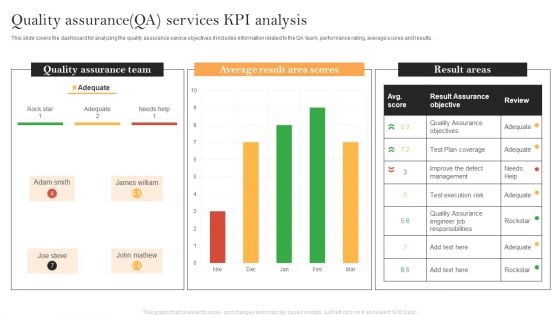
Quality Assurance QA Services KPI Analysis Demonstration PDF
This slide covers the dashboard for analyzing the quality assurance service objectives it includes information related to the QA team, performance rating, average scores and results. Showcasing this set of slides titled Quality Assurance QA Services KPI Analysis Demonstration PDF. The topics addressed in these templates are Quality Assurance Team, Average Result Area, Result Assurance Objective. All the content presented in this PPT design is completely editable. Download it and make adjustments in color, background, font etc. as per your unique business setting.
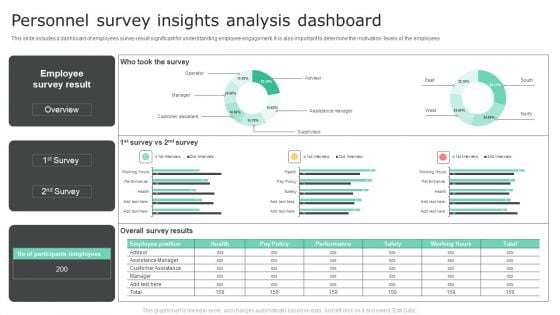
Personnel Survey Insights Analysis Dashboard Inspiration PDF
This slide includes a dashboard of employees survey result significant for understanding employee engagement. It is also important to determine the motivation levels of the employees. Pitch your topic with ease and precision using this Personnel Survey Insights Analysis Dashboard Inspiration PDF. This layout presents information on Employee Survey Result, Overall Survey Results. It is also available for immediate download and adjustment. So, changes can be made in the color, design, graphics or any other component to create a unique layout.
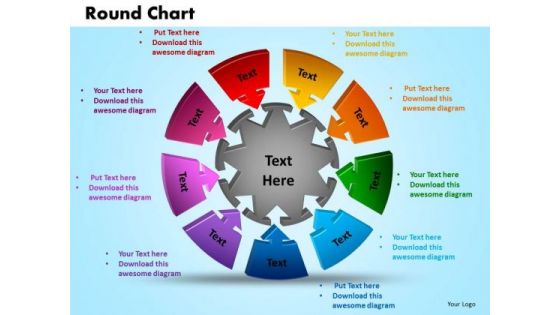
PowerPoint Presentation Round Chart Sales Ppt Template
PowerPoint Presentation Round Chart Sales PPT template-This PowerPoint Diagram represents the Round Sales Chart in which nine different problems or issues results in one common Outcome. It Portrays the concept of Teamwork as they are interconnected to each other.-PowerPoint Presentation Round Chart Sales PPT template Participate intelligently with our PowerPoint Presentation Round Chart Sales Ppt Template. Download without worries with our money back guaranteee.
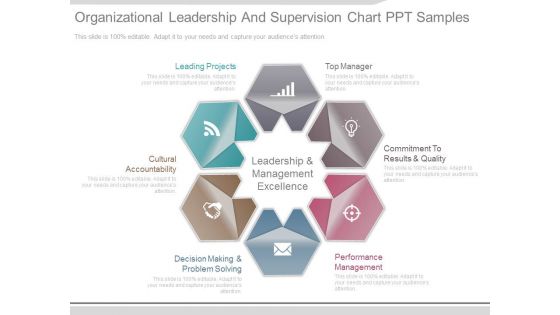
Organizational Leadership And Supervision Chart Ppt Samples
This is a organizational leadership and supervision chart ppt samples. This is a six stage process. The stages in this process are leading projects, top manager, commitment to results and quality, performance management, decision making and problem solving, cultural accountability, leadership and management excellence.
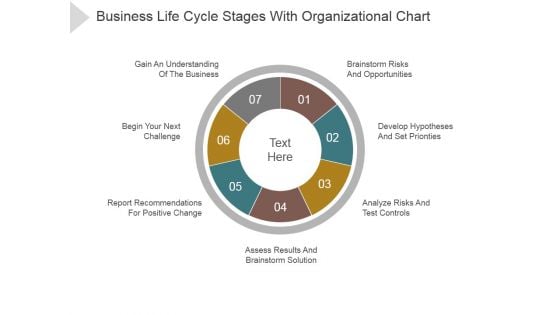
Business Life Cycle Stages With Organizational Chart Ppt PowerPoint Presentation Summary
This is a business life cycle stages with organizational chart ppt powerpoint presentation summary. This is a seven stage process. The stages in this process are gain an understanding of the business, report recommendations for positive change, assess results and brainstorm solution, analyze risks and test controls, develop hypotheses and set prionties.
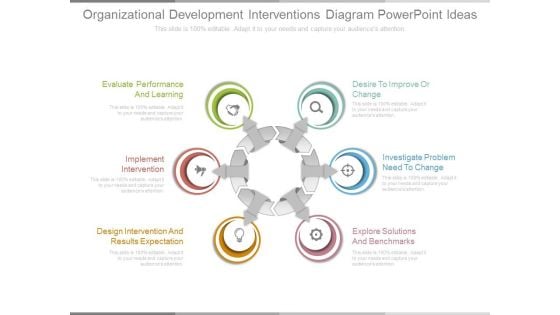
Organizational Development Interventions Diagram Powerpoint Ideas
This is a organizational development interventions diagram powerpoint ideas. This is a six stage process. The stages in this process are evaluate performance and learning, implement intervention, design intervention and results expectation, desire to improve or change, investigate problem need to change, explore solutions and benchmarks.
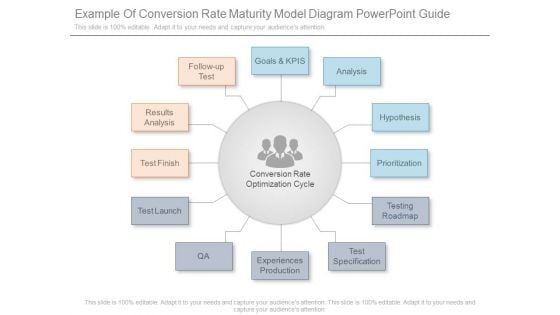
Example Of Conversion Rate Maturity Model Diagram Powerpoint Guide
This is a example of conversion rate maturity model diagram powerpoint guide. This is a twelve stage process. The stages in this process are goals and kpis, analysis, hypothesis, prioritization, testing roadmap, test specification, experiences production, qa, test launch, test finish, results analysis, follow up test.
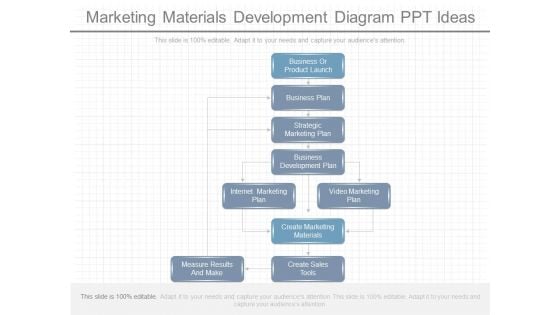
Marketing Materials Development Diagram Ppt Ideas
This is a marketing materials development diagram ppt ideas. This is a nine stage process. The stages in this process are business or product launch, business plan, strategic marketing plan, business development plan, internet marketing plan, video marketing plan, create marketing materials, create sales tools, measure results and make.
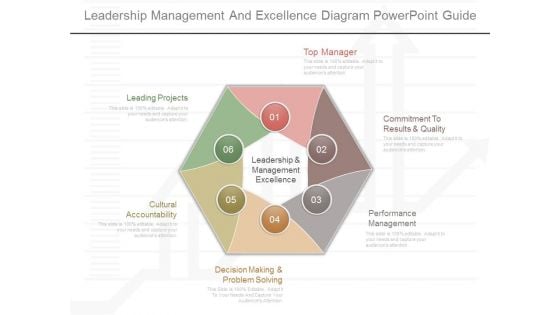
Leadership Management And Excellence Diagram Powerpoint Guide
This is a leadership management and excellence diagram powerpoint guide. This is a six stage process. The stages in this process are leading projects, cultural accountability, decision making and problem solving, performance management, commitment to results and quality, top manager, leadership and management excellence.
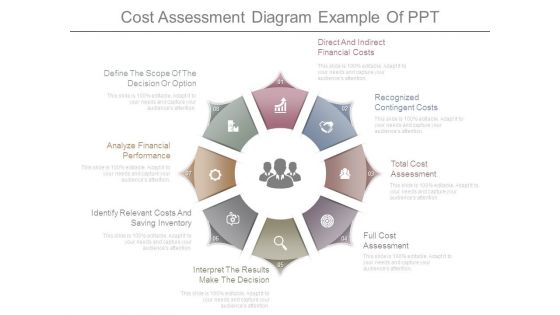
Cost Assessment Diagram Example Of Ppt
This is a cost assessment diagram example of ppt. This is a eight stage process. The stages in this process are define the scope of the decision or option, analyze financial performance, identify relevant costs and saving inventory, interpret the results make the decision, full cost assessment, total cost assessment, recognized contingent costs, direct and indirect financial costs.

Cross In Cloud Of Light Christmas PowerPoint Templates And PowerPoint Themes 0712
Cross In Cloud Of Light Christmas PowerPoint Templates And PowerPoint Themes Business Power Points-Microsoft Powerpoint Templates and Background with a cross in a glorious cloud of golden light Performance evaluation is easier with our Cross In Cloud Of Light Christmas PowerPoint Templates And PowerPoint Themes 0712. They help you assess results accurately.
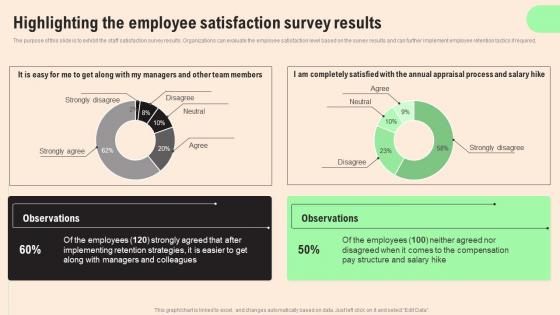
Highlighting Employee Satisfaction HR Retention Techniques For Business Owners Information Pdf
The purpose of this slide is to exhibit the staff satisfaction survey results. Organizations can evaluate the employee satisfaction level based on the survey results and can further implement employee retention tactics if required. Here you can discover an assortment of the finest PowerPoint and Google Slides templates. With these templates, you can create presentations for a variety of purposes while simultaneously providing your audience with an eye catching visual experience. Download Highlighting Employee Satisfaction HR Retention Techniques For Business Owners Information Pdf to deliver an impeccable presentation. These templates will make your job of preparing presentations much quicker, yet still, maintain a high level of quality. Slidegeeks has experienced researchers who prepare these templates and write high quality content for you. Later on, you can personalize the content by editing the Highlighting Employee Satisfaction HR Retention Techniques For Business Owners Information Pdf. The purpose of this slide is to exhibit the staff satisfaction survey results. Organizations can evaluate the employee satisfaction level based on the survey results and can further implement employee retention tactics if required.
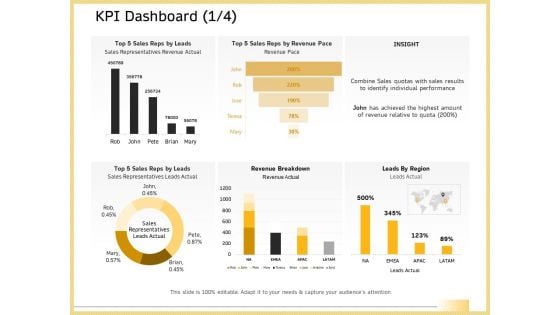
B2B Marketing KPI Dashboard INSIGHT Ppt Ideas Information PDF
Deliver an awe-inspiring pitch with this creative b2b marketing kpi dashboard insight ppt ideas information pdf bundle. Topics like revenue breakdown, leads region, sales reps leads, sales representatives leads actual, sales results identify individual performance can be discussed with this completely editable template. It is available for immediate download depending on the needs and requirements of the user.
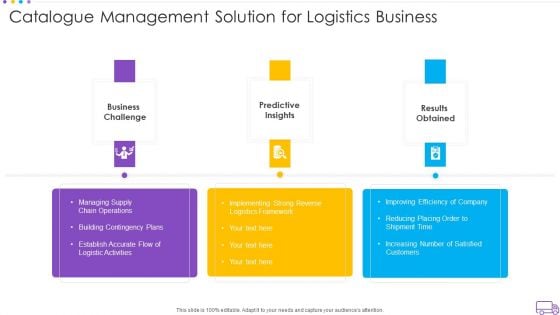
Catalogue Management Solution For Logistics Business Infographics PDF
Presenting catalogue management solution for logistics business infographics pdf to dispense important information. This template comprises three stages. It also presents valuable insights into the topics including business challenge, predictive insights, results obtained. This is a completely customizable PowerPoint theme that can be put to use immediately. So, download it and address the topic impactfully.
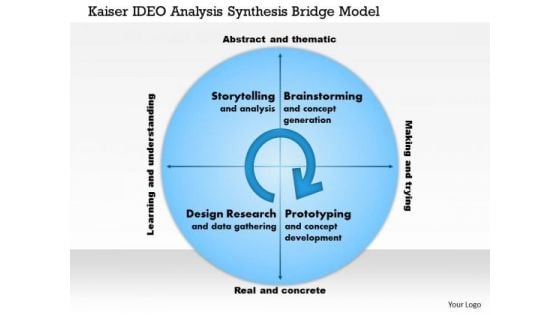
Business Framework Kaiser Ideo Analysis Synthesis Bridge Model PowerPoint Presentation
This diagram displays Kaiser IDEO analysis synthesis bridge model. It contains circular diagram in four segments. The bridge model illustrates storytelling and analysis, brainstorming and concept generation, design research and data gathering, prototyping and concept generation. Use this model to frame research results to act as a basis for framing future possibilities.

Good Idea Business PowerPoint Backgrounds And Templates 1210
Microsoft PowerPoint Template and Background with A diagram of a person coming up with an idea working hard to implement it and enjoying the successful results Load your gun with our Good Idea Business PowerPoint Backgrounds And Templates 1210. You will come out on top.
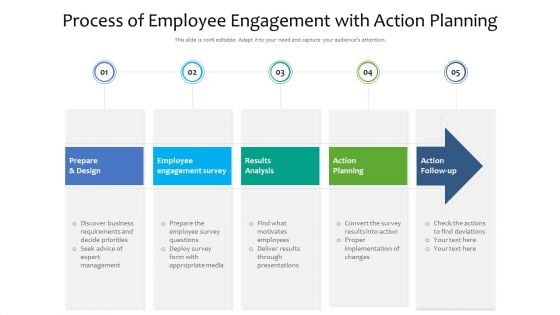
Process Of Employee Engagement With Action Planning Ppt Inspiration Graphics Download PDF
Presenting process of employee engagement with action planning ppt inspiration graphics download pdf to dispense important information. This template comprises five stages. It also presents valuable insights into the topics including results analysis, action planning, employee engagement survey. This is a completely customizable PowerPoint theme that can be put to use immediately. So, download it and address the topic impactfully.
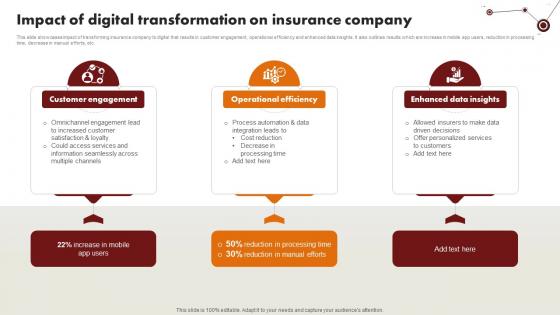
Technology Trends In Online Insurance Impact Of Digital Transformation On Insurance Company
This slide showcases impact of transforming insurance company to digital that results in customer engagement, operational efficiency and enhanced data insights. It also outlines results which are increase in mobile app users, reduction in processing time, decrease in manual efforts, etc. Retrieve professionally designed Technology Trends In Online Insurance Impact Of Digital Transformation On Insurance Company to effectively convey your message and captivate your listeners. Save time by selecting pre-made slideshows that are appropriate for various topics, from business to educational purposes. These themes come in many different styles, from creative to corporate, and all of them are easily adjustable and can be edited quickly. Access them as PowerPoint templates or as Google Slides themes. You do not have to go on a hunt for the perfect presentation because Slidegeeks got you covered from everywhere. This slide showcases impact of transforming insurance company to digital that results in customer engagement, operational efficiency and enhanced data insights. It also outlines results which are increase in mobile app users, reduction in processing time, decrease in manual efforts, etc.

Illustration Of 6 Data Processes And Flows Cycle Arrow PowerPoint Templates
We present our illustration of 6 data processes and flows Cycle Arrow PowerPoint templates.Present our Arrows PowerPoint Templates because knowledge is power goes the popular saying. Download our Process and Flows PowerPoint Templates because there is a crucial aspect that requires extra attention. Present our Business PowerPoint Templates because the NASA Space programme took mankind to the moon and so much more. Like them you too can look far beyond normal boundaries. Show them that in your mind the sky is certainly not the limit. Download and present our Shapes PowerPoint Templates because this template helps you to bring your audiences to the table. Present our Circle Charts PowerPoint Templates because let your words be the drops of wisdom spreading knowledge and peace like ripples through the expectant minds of your devoted followers.Use these PowerPoint slides for presentations relating to Arrows, Background, Blue, Chart, Circle, Circular, Circulation, Color, Connection, Continuity, Cycle, Cyclic, Diagram, Direction, Empty, Flow, Four, Dimensional, Graph, Icon, Presentation, Process, Progress, Reason, Recycle, Recycling, Repetition, Report, Result, Ring, Rotation, Round, Scheme, Section, Step, Symbol, Teamwork. The prominent colors used in the PowerPoint template are Yellow, Gray, White. Professionals tell us our illustration of 6 data processes and flows Cycle Arrow PowerPoint templates will impress their bosses and teams. You can be sure our Circulation PowerPoint templates and PPT Slides are Functional. Customers tell us our illustration of 6 data processes and flows Cycle Arrow PowerPoint templates are specially created by a professional team with vast experience. They diligently strive to come up with the right vehicle for your brilliant Ideas. Professionals tell us our Connection PowerPoint templates and PPT Slides are Graceful. People tell us our illustration of 6 data processes and flows Cycle Arrow PowerPoint templates are Awesome. People tell us our Connection PowerPoint templates and PPT Slides are Spiffy. Examine all possibilities with our Illustration Of 6 Data Processes And Flows Cycle Arrow PowerPoint Templates. Give every option a real close look.
Circular Justification Of 2 Stages Flow Chart System PowerPoint Slides
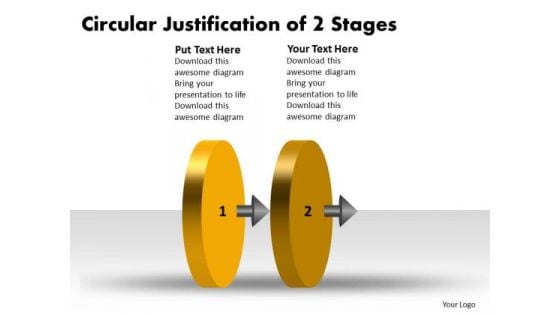
We present our circular justification of 2 stages flow chart system PowerPoint Slides.Use our Circle Charts PowerPoint Templates because, You can Show them how to churn out fresh ideas. Use our Arrows PowerPoint Templates because,Getting it done may not be enough. Use our Symbol PowerPoint Templates because,This slide represents the Tools of the Trade. Use our Business PowerPoint Templates because,This template helps you to grab the attention of your listeners. Use our Process and Flows PowerPoint Templates because,you can see In any endeavour people matter most.Use these PowerPoint slides for presentations relating to 3d, arrow, background, chart, circle, circular, circulation, clipart, colorful, connection, continuity, cyclic, diagram, direction, empty, flow, graph, icon, illustration, isolated, loop, motion, presentation, process, progress, report, result, ring, rotation, round, section, step, sticker, symbol, teamwork, template, vector. The prominent colors used in the PowerPoint template are Yellow, Brown, Gray. People tell us our circular justification of 2 stages flow chart system PowerPoint Slides are Multicolored. The feedback we get is that our circular PowerPoint templates and PPT Slides will get their audience's attention. People tell us our circular justification of 2 stages flow chart system PowerPoint Slides are Elevated. Presenters tell us our chart PowerPoint templates and PPT Slides are topically designed to provide an attractive backdrop to any subject. The feedback we get is that our circular justification of 2 stages flow chart system PowerPoint Slides are Perfect. Professionals tell us our clipart PowerPoint templates and PPT Slides are Stylish. Our Circular Justification Of 2 Stages Flow Chart System PowerPoint Slides are never far from you. They will come to your assistance in a click.
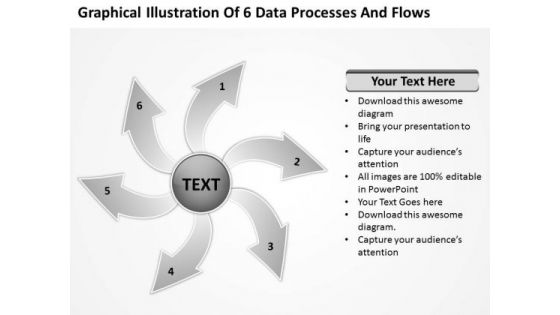
Illustration Of 6 Data Processes And Flows Circular Diagram PowerPoint Slides
We present our illustration of 6 data processes and flows Circular Diagram PowerPoint Slides.Download our Arrows PowerPoint Templates because They will bring a lot to the table. Their alluring flavours will make your audience salivate. Present our Process and Flows PowerPoint Templates because Our PowerPoint Templates and Slides will bullet point your ideas. See them fall into place one by one. Present our Business PowerPoint Templates because your product has established a foothold in the market. Customers are happy with the value it brings to their lives. Present our Shapes PowerPoint Templates because Our PowerPoint Templates and Slides team portray an attitude of elegance. Personify this quality by using them regularly. Present our Circle Charts PowerPoint Templates because you can gain the success to desired levels in one go.Use these PowerPoint slides for presentations relating to Arrows, Background, Blue, Chart, Circle, Circular, Circulation, Color, Connection, Continuity, Cycle, Cyclic, Diagram, Direction, Empty, Flow, Four, Dimensional, Graph, Icon, Presentation, Process, Progress, Reason, Recycle, Recycling, Repetition, Report, Result, Ring, Rotation, Round, Scheme, Section, Step, Symbol, Teamwork. The prominent colors used in the PowerPoint template are Gray, Black, White. Professionals tell us our illustration of 6 data processes and flows Circular Diagram PowerPoint Slides are Stunning. You can be sure our Circle PowerPoint templates and PPT Slides will make the presenter successul in his career/life. Customers tell us our illustration of 6 data processes and flows Circular Diagram PowerPoint Slides are Precious. Professionals tell us our Chart PowerPoint templates and PPT Slides are Gorgeous. People tell us our illustration of 6 data processes and flows Circular Diagram PowerPoint Slides are Playful. People tell us our Circle PowerPoint templates and PPT Slides are One-of-a-kind. Go on a binge with our Illustration Of 6 Data Processes And Flows Circular Diagram PowerPoint Slides. The after effects will always be pleasant.
Operational And Financial Impact During Business Process Evaluation Ppt Layouts Graphics Download PDF
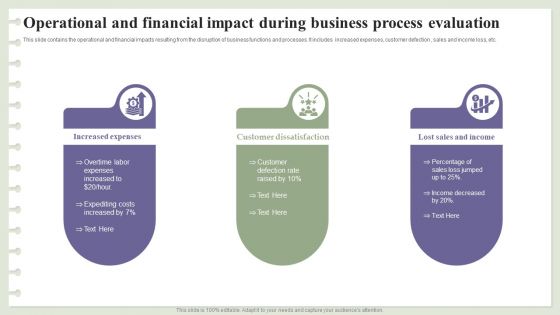
This slide contains the operational and financial impacts resulting from the disruption of business functions and processes. It includes increased expenses, customer defection , sales and income loss, etc. Presenting Operational And Financial Impact During Business Process Evaluation Ppt Layouts Graphics Download PDF to dispense important information. This template comprises three stages. It also presents valuable insights into the topics including Increased Expenses, Customer Dissatisfaction, Lost Sales Income. This is a completely customizable PowerPoint theme that can be put to use immediately. So, download it and address the topic impactfully.
Business Diagram Pie Chart For Business Infographic Presentation Template
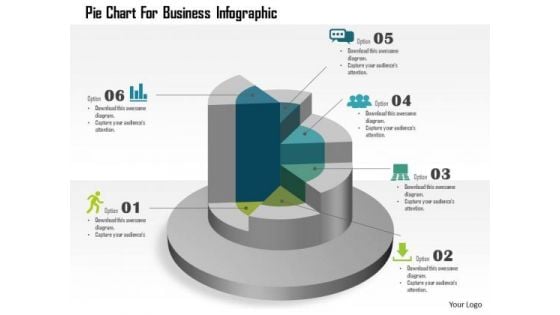
This template displays pie chart business infographic. You may download this business slide for result analysis. Amplify your thoughts via this appropriate business template.
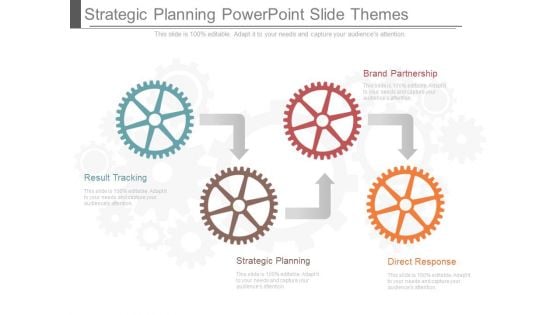
Strategic Planning Powerpoint Slide Themes
This is a strategic planning powerpoint slide themes. This is a four stage process. The stages in this process are result tracking, strategic planning, direct response, brand partnership.\n\n
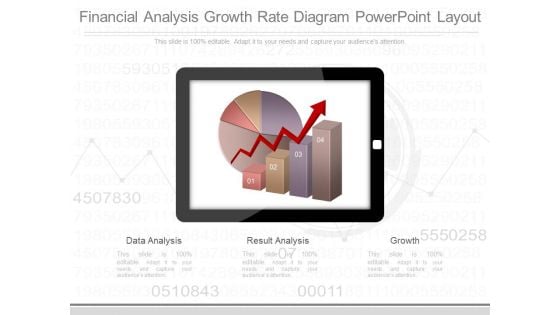
Financial Analysis Growth Rate Diagram Powerpoint Layout
This is a financial analysis growth rate diagram powerpoint layout. This is a three stage process. The stages in this process are data analysis, result analysis, growth.
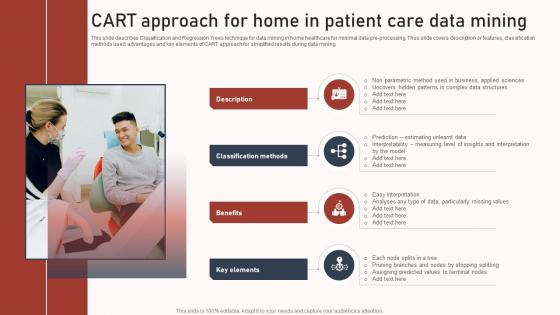
CART Approach For Home In Patient Care Data Mining Diagrams Pdf
This slide describes Classification and Regression Trees technique for data mining in home healthcare for minimal data pre processing. Thus slide covers description or features, classification methods used, advantages and key elements of CART approach for simplified results during data mining. Showcasing this set of slides titled CART Approach For Home In Patient Care Data Mining Diagrams Pdf. The topics addressed in these templates are Description, Classification Methods, Benefits . All the content presented in this PPT design is completely editable. Download it and make adjustments in color, background, font etc. as per your unique business setting. This slide describes Classification and Regression Trees technique for data mining in home healthcare for minimal data pre processing. Thus slide covers description or features, classification methods used, advantages and key elements of CART approach for simplified results during data mining.

Business Diagram Lock With Missing Puzzle Piece Presentation Template
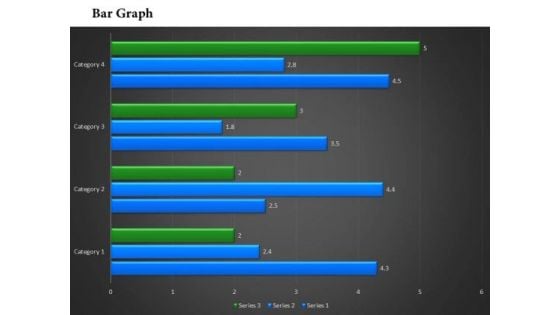
Business Framework Bar Chart In PowerPoint Presentation
This power point diagram slide has been designed with graphic of bar chart. In this diagram slide we have used green and blue colored vertical bar graph. Display result analysis with this bar graph diagram and use it in your result verification and analysis related presentations.
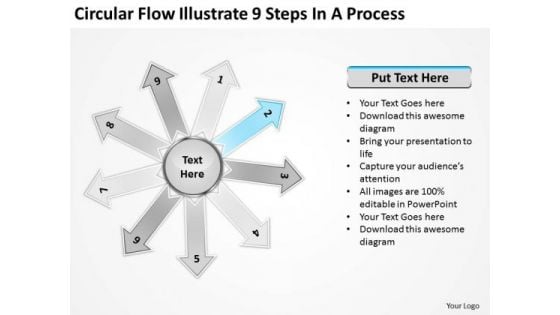
Circular Flow Illustrate 9 Steps In Process Layout Diagram PowerPoint Slides
We present our circular flow illustrate 9 steps in process Layout Diagram PowerPoint Slides.Download our Process and flows PowerPoint Templates because they are Gauranteed to focus the minds of your team. Download our Business PowerPoint Templates because your ideas too are pinpointedly focused on you goals. Download our Marketing PowerPoint Templates because networking is an imperative in todays world. You need to access the views of others. Similarly you need to give access to them of your abilities. Download our Flow charts PowerPoint Templates because it is in your DNA to analyse possible causes to the minutest detail. Present our Arrows PowerPoint Templates because you have the ideas and plans on how to achieve success.Use these PowerPoint slides for presentations relating to Circle, circular, circulation, clipart, colorful, connection, continuity, cut, cycle, cyclic, diagram, direction, flow, graph, icon, illustration, isolated, presentation, process, progress, reason, recycle, recycling, repetition, report, result, ring, rotation, round, scheme, section, step, sticker, symbol, arrows , flow charts. The prominent colors used in the PowerPoint template are Blue light, Black, White. People tell us our circular flow illustrate 9 steps in process Layout Diagram PowerPoint Slides are Upbeat. We assure you our clipart PowerPoint templates and PPT Slides are Tranquil. PowerPoint presentation experts tell us our circular flow illustrate 9 steps in process Layout Diagram PowerPoint Slides are Whimsical. You can be sure our cut PowerPoint templates and PPT Slides are Lush. Professionals tell us our circular flow illustrate 9 steps in process Layout Diagram PowerPoint Slides provide you with a vast range of viable options. Select the appropriate ones and just fill in your text. Use our continuity PowerPoint templates and PPT Slides are Quaint. Claim your prize with our Circular Flow Illustrate 9 Steps In Process Layout Diagram PowerPoint Slides. You will come out on top.

Test Conclusion Most Famous Assets Brand Value Estimation Guide Themes PDF
Following slide addresses the results of brand asset test. It shows that most recognizable assets of the company are its Logo style, Product and its Packaging.Whether you have daily or monthly meetings, a brilliant presentation is necessary. Test Conclusion Most Famous Assets Brand Value Estimation Guide Themes PDF can be your best option for delivering a presentation. Represent everything in detail using Test Conclusion Most Famous Assets Brand Value Estimation Guide Themes PDF and make yourself stand out in meetings. The template is versatile and follows a structure that will cater to your requirements. All the templates prepared by Slidegeeks are easy to download and edit. Our research experts have taken care of the corporate themes as well. So, give it a try and see the results.
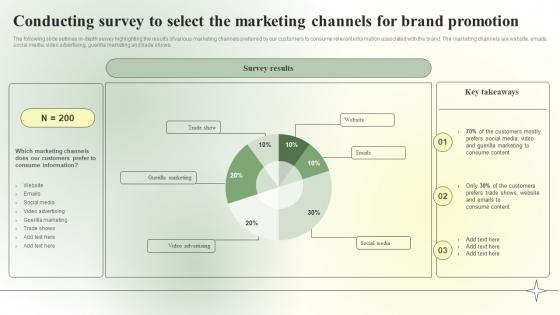
Competitive Branding Strategic Conducting Survey To Select The Marketing Themes PDF
The following slide outlines in-depth survey highlighting the results of various marketing channels preferred by our customers to consume relevant information associated with the brand. The marketing channels are website, emails, social media, video advertising, guerilla marketing and trade shows. Want to ace your presentation in front of a live audience Our Competitive Branding Strategic Conducting Survey To Select The Marketing Themes PDF can help you do that by engaging all the users towards you. Slidegeeks experts have put their efforts and expertise into creating these impeccable powerpoint presentations so that you can communicate your ideas clearly. Moreover, all the templates are customizable, and easy-to-edit and downloadable. Use these for both personal and commercial use. The following slide outlines in-depth survey highlighting the results of various marketing channels preferred by our customers to consume relevant information associated with the brand. The marketing channels are website, emails, social media, video advertising, guerilla marketing and trade shows.
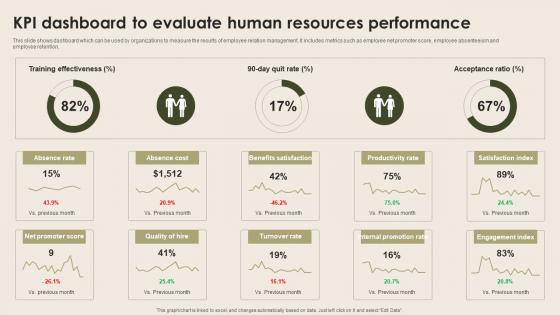
KPI Dashboard To Evaluate Human Resources Nurturing Positive Work Culture Diagrams Pdf
This slide shows dashboard which can be used by organizations to measure the results of employee relation management. It includes metrics such as employee net promoter score, employee absenteeism and employee retention. Welcome to our selection of the KPI Dashboard To Evaluate Human Resources Nurturing Positive Work Culture Diagrams Pdf. These are designed to help you showcase your creativity and bring your sphere to life. Planning and Innovation are essential for any business that is just starting out. This collection contains the designs that you need for your everyday presentations. All of our PowerPoints are 100 percent editable, so you can customize them to suit your needs. This multi-purpose template can be used in various situations. Grab these presentation templates today This slide shows dashboard which can be used by organizations to measure the results of employee relation management. It includes metrics such as employee net promoter score, employee absenteeism and employee retention.

Evaluation Of Offline Business Event Campaign Return On Investment Diagrams Pdf
The slide displays companys offline event campaigns results over the course of a year to evaluate actual cost of an event campaign and earnings generated by them so that ROI and percentage can be calculated. Pitch your topic with ease and precision using this Evaluation Of Offline Business Event Campaign Return On Investment Diagrams Pdf This layout presents information on Evaluation Of Offline, Business Event, Return On Investment It is also available for immediate download and adjustment. So, changes can be made in the color, design, graphics or any other component to create a unique layout. The slide displays companys offline event campaigns results over the course of a year to evaluate actual cost of an event campaign and earnings generated by them so that ROI and percentage can be calculated.
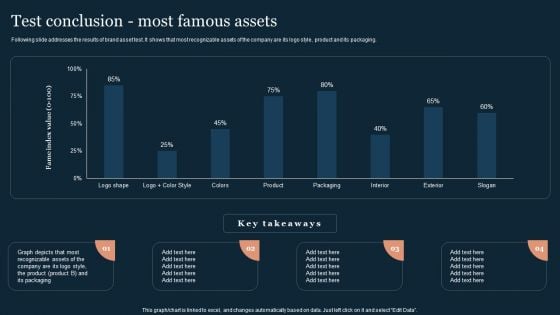
Guide To Develop And Estimate Brand Value Test Conclusion Most Famous Assets Designs PDF
Following slide addresses the results of brand asset test. It shows that most recognizable assets of the company are its logo style, product and its packaging.Whether you have daily or monthly meetings, a brilliant presentation is necessary. Guide To Develop And Estimate Brand Value Test Conclusion Most Famous Assets Designs PDF can be your best option for delivering a presentation. Represent everything in detail using Guide To Develop And Estimate Brand Value Test Conclusion Most Famous Assets Designs PDF and make yourself stand out in meetings. The template is versatile and follows a structure that will cater to your requirements. All the templates prepared by Slidegeeks are easy to download and edit. Our research experts have taken care of the corporate themes as well. So, give it a try and see the results.
PowerPoint Theme Ring Chart Diagram Business Ppt Slides
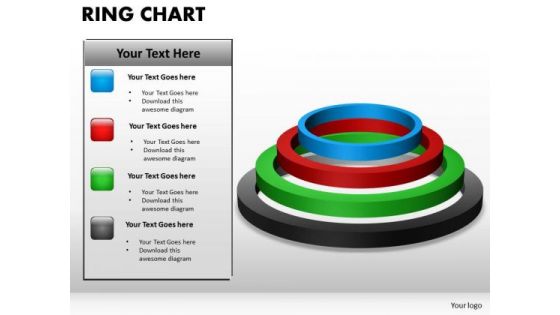
PowerPoint Theme Ring Chart Diagram Business PPT Slides-Use this Ring diagram to show activities that are related to the business plan metrics and monitor the results to determine if the business plan is proceeding as planned.-PowerPoint Theme Ring Chart Diagram Business PPT Slides An array of colors give our PowerPoint Theme Ring Chart Diagram Business Ppt Slides an alluring blend. They make your thoughts very enticing.
Search Engineer Architecture Diagram Ppt Presentation
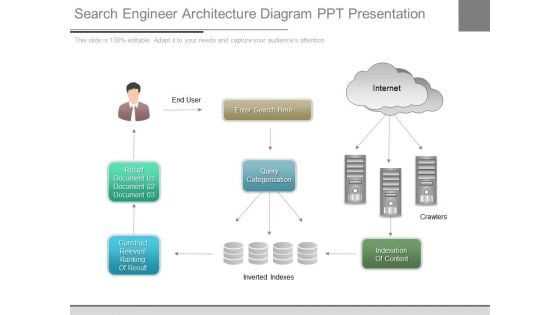
This is a search engineer architecture diagram ppt presentation. This is a one stage process. The stages in this process are end user, enter search here, internet, result document, query categorization, construct relevant ranking of result, inverted indexes, indexation of content.
Analysing Operational Describing Business Performance Administration Goals Inspiration Pdf
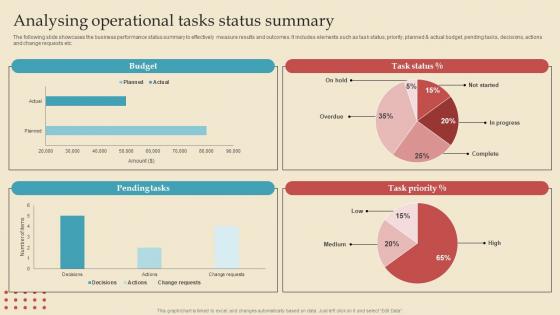
The following slide showcases the business performance status summary to effectively measure results and outcomes. It includes elements such as task status, priority, planned and actual budget, pending tasks, decisions, actions and change requests etc. Coming up with a presentation necessitates that the majority of the effort goes into the content and the message you intend to convey. The visuals of a PowerPoint presentation can only be effective if it supplements and supports the story that is being told. Keeping this in mind our experts created Analysing Operational Describing Business Performance Administration Goals Inspiration Pdf to reduce the time that goes into designing the presentation. This way, you can concentrate on the message while our designers take care of providing you with the right template for the situation. The following slide showcases the business performance status summary to effectively measure results and outcomes. It includes elements such as task status, priority, planned and actual budget, pending tasks, decisions, actions and change requests etc.
Online Campaign Business Event Return On Investment Comparison Chart Demonstration Pdf
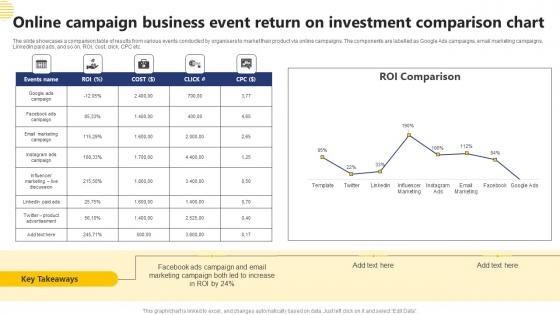
The slide showcases a comparison table of results from various events conducted by organisers to market their product via online campaigns. The components are labelled as Google Ads campaigns, email marketing campaigns, LinkedIn paid ads, and so on. ROI, cost, click, CPC etc. Pitch your topic with ease and precision using this Online Campaign Business Event Return On Investment Comparison Chart Demonstration Pdf This layout presents information on Google Ads Campaign, Email Marketing Campaign It is also available for immediate download and adjustment. So, changes can be made in the color, design, graphics or any other component to create a unique layout. The slide showcases a comparison table of results from various events conducted by organisers to market their product via online campaigns. The components are labelled as Google Ads campaigns, email marketing campaigns, LinkedIn paid ads, and so on. ROI, cost, click, CPC etc.
Running Email Marketing Plan To Retain And Nurture Product Advertising And Positioning Diagrams Pdf
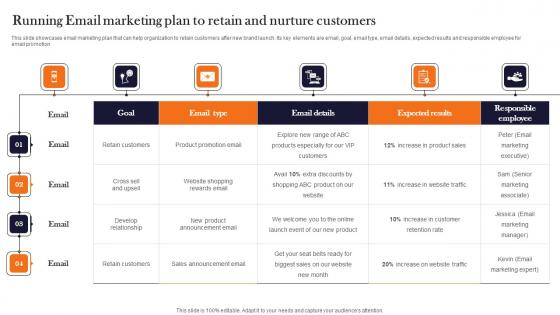
This slide showcases email marketing plan that can help organization to retain customers after new brand launch. Its key elements are email, goal, email type, email details, expected results and responsible employee for email promotion. Get a simple yet stunning designed Running Email Marketing Plan To Retain And Nurture Product Advertising And Positioning Diagrams Pdf. It is the best one to establish the tone in your meetings. It is an excellent way to make your presentations highly effective. So, download this PPT today from Slidegeeks and see the positive impacts. Our easy-to-edit Running Email Marketing Plan To Retain And Nurture Product Advertising And Positioning Diagrams Pdf can be your go-to option for all upcoming conferences and meetings. So, what are you waiting for Grab this template today. This slide showcases email marketing plan that can help organization to retain customers after new brand launch. Its key elements are email, goal, email type, email details, expected results and responsible employee for email promotion.
Summarizing The Focus Areas Digital Approaches To Increase Business Growth Demonstration Pdf
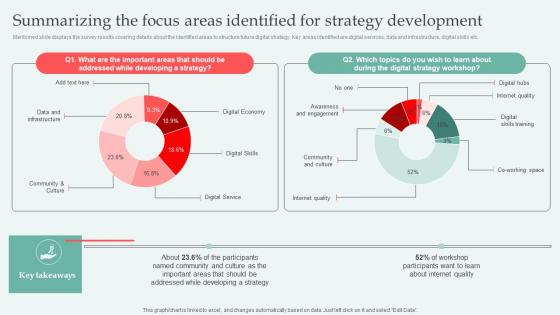
Mentioned slide displays the survey results covering details about the identified areas to structure future digital strategy. Key areas identified are digital services, data and infrastructure, digital skills etc. Are you searching for a Summarizing The Focus Areas Digital Approaches To Increase Business Growth Demonstration Pdf that is uncluttered, straightforward, and original Its easy to edit, and you can change the colors to suit your personal or business branding. For a presentation that expresses how much effort you have put in, this template is ideal With all of its features, including tables, diagrams, statistics, and lists, its perfect for a business plan presentation. Make your ideas more appealing with these professional slides. Download Summarizing The Focus Areas Digital Approaches To Increase Business Growth Demonstration Pdf from Slidegeeks today. Mentioned slide displays the survey results covering details about the identified areas to structure future digital strategy. Key areas identified are digital services, data and infrastructure, digital skills etc.
Statistical Data Supporting Data Driven Marketing Objectives Ppt Gallery Graphics Tutorials PDF
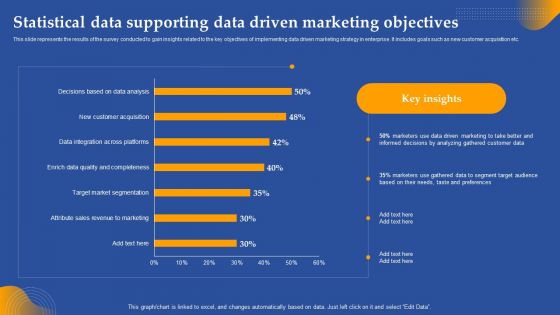
This slide represents the results of the survey conducted to gain insights related to the key objectives of implementing data driven marketing strategy in enterprise. It includes goals such as new customer acquisition etc. Whether you have daily or monthly meetings, a brilliant presentation is necessary. Statistical Data Supporting Data Driven Marketing Objectives Ppt Gallery Graphics Tutorials PDF can be your best option for delivering a presentation. Represent everything in detail using Statistical Data Supporting Data Driven Marketing Objectives Ppt Gallery Graphics Tutorials PDF and make yourself stand out in meetings. The template is versatile and follows a structure that will cater to your requirements. All the templates prepared by Slidegeeks are easy to download and edit. Our research experts have taken care of the corporate themes as well. So, give it a try and see the results.
Statistical Data Supporting Data Driven Marketing Objectives Ppt Inspiration Graphics Pictures PDF
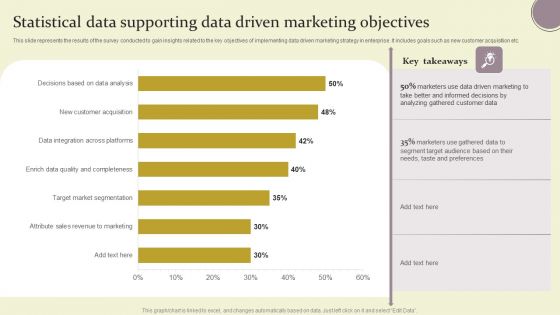
This slide represents the results of the survey conducted to gain insights related to the key objectives of implementing data driven marketing strategy in enterprise. It includes goals such as new customer acquisition etc. Whether you have daily or monthly meetings, a brilliant presentation is necessary. Statistical Data Supporting Data Driven Marketing Objectives Ppt Inspiration Graphics Pictures PDF can be your best option for delivering a presentation. Represent everything in detail using Statistical Data Supporting Data Driven Marketing Objectives Ppt Inspiration Graphics Pictures PDF and make yourself stand out in meetings. The template is versatile and follows a structure that will cater to your requirements. All the templates prepared by Slidegeeks are easy to download and edit. Our research experts have taken care of the corporate themes as well. So, give it a try and see the results.
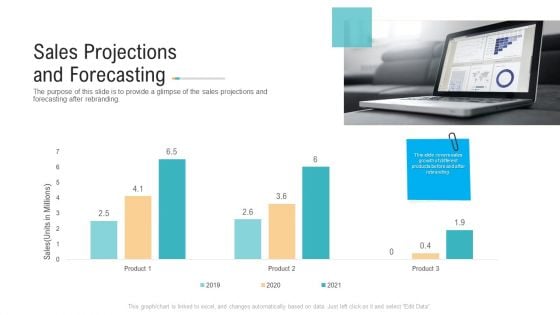
Sales Projections And Forecasting Ppt PowerPoint Presentation Portfolio Slideshow PDF
The purpose of this slide is to provide a glimpse about the customer survey result.Deliver an awe-inspiring pitch with this creative sales projections and forecasting ppt powerpoint presentation portfolio slideshow pdf. bundle. Topics like surveys result can be discussed with this completely editable template. It is available for immediate download depending on the needs and requirements of the user.
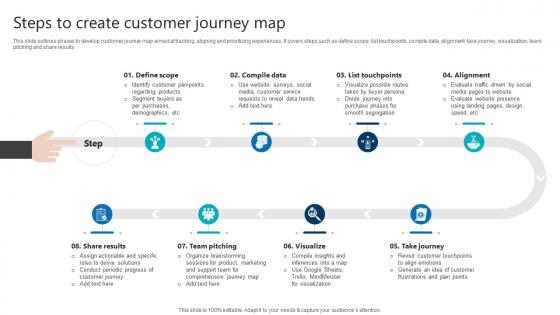
Steps To Create Customer Journey Map Product Analytics Implementation Data Analytics V
This slide outlines phases to develop customer journey map aimed at tracking, aligning and prioritizing experiences. It covers steps such as define scope, list touchpoints, compile data, alignment, take journey, visualization, team pitching and share results Welcome to our selection of the Steps To Create Customer Journey Map Product Analytics Implementation Data Analytics V. These are designed to help you showcase your creativity and bring your sphere to life. Planning and Innovation are essential for any business that is just starting out. This collection contains the designs that you need for your everyday presentations. All of our PowerPoints are 100 percent editable, so you can customize them to suit your needs. This multi-purpose template can be used in various situations. Grab these presentation templates today. This slide outlines phases to develop customer journey map aimed at tracking, aligning and prioritizing experiences. It covers steps such as define scope, list touchpoints, compile data, alignment, take journey, visualization, team pitching and share results
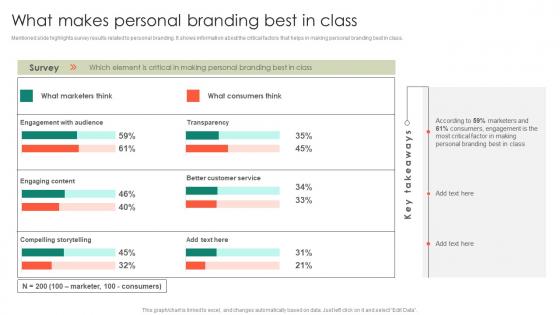
What Makes Personal Branding Best In Class Entrepreneurs Roadmap To Effective Slides Pdf
Mentioned slide highlights survey results related to personal branding. It shows information about the critical factors that helps in making personal branding best in class.Are you in need of a template that can accommodate all of your creative concepts This one is crafted professionally and can be altered to fit any style. Use it with Google Slides or PowerPoint. Include striking photographs, symbols, depictions, and other visuals. Fill, move around, or remove text boxes as desired. Test out color palettes and font mixtures. Edit and save your work, or work with colleagues. Download What Makes Personal Branding Best In Class Entrepreneurs Roadmap To Effective Slides Pdf and observe how to make your presentation outstanding. Give an impeccable presentation to your group and make your presentation unforgettable. Mentioned slide highlights survey results related to personal branding. It shows information about the critical factors that helps in making personal branding best in class.
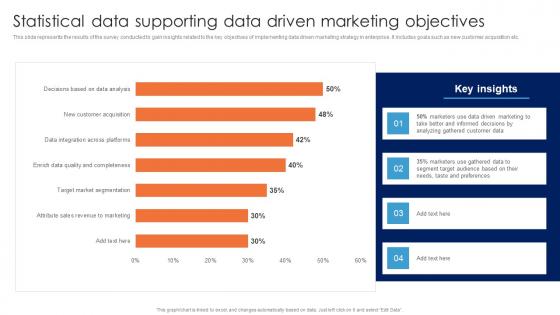
Statistical Data Supporting Data Driven Marketing Objectives Guide For Data Driven Advertising Elements Pdf
This slide represents the results of the survey conducted to gain insights related to the key objectives of implementing data driven marketing strategy in enterprise. It includes goals such as new customer acquisition etc.The Statistical Data Supporting Data Driven Marketing Objectives Guide For Data Driven Advertising Elements Pdf is a compilation of the most recent design trends as a series of slides. It is suitable for any subject or industry presentation, containing attractive visuals and photo spots for businesses to clearly express their messages. This template contains a variety of slides for the user to input data, such as structures to contrast two elements, bullet points, and slides for written information. Slidegeeks is prepared to create an impression. This slide represents the results of the survey conducted to gain insights related to the key objectives of implementing data driven marketing strategy in enterprise. It includes goals such as new customer acquisition etc.
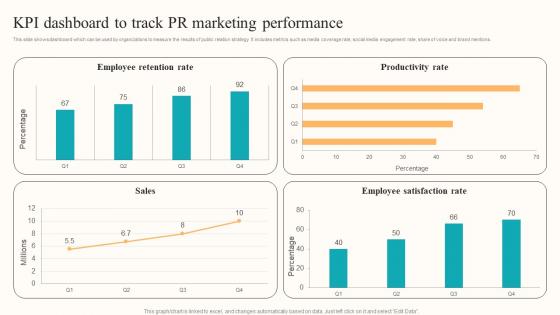
KPI Dashboard Track PR Developing Employee Centric Marketing Program Designs Pdf
This slide shows dashboard which can be used by organizations to measure the results of public relation strategy. It includes metrics such as media coverage rate, social media engagement rate, share of voice and brand mentions. This KPI Dashboard Track PR Developing Employee Centric Marketing Program Designs Pdf is perfect for any presentation, be it in front of clients or colleagues. It is a versatile and stylish solution for organizing your meetings. The KPI Dashboard Track PR Developing Employee Centric Marketing Program Designs Pdf features a modern design for your presentation meetings. The adjustable and customizable slides provide unlimited possibilities for acing up your presentation. Slidegeeks has done all the homework before launching the product for you. So, do not wait, grab the presentation templates today This slide shows dashboard which can be used by organizations to measure the results of public relation strategy. It includes metrics such as media coverage rate, social media engagement rate, share of voice and brand mentions.
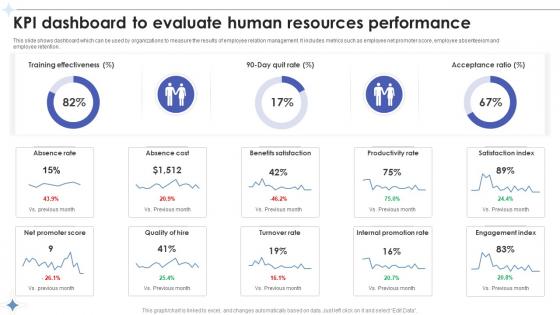
Employee Relations In Human Resource Kpi Dashboard To Evaluate Human Resources Performance
This slide shows dashboard which can be used by organizations to measure the results of employee relation management. It includes metrics such as employee net promoter score, employee absenteeism and employee retention. This Employee Relations In Human Resource Kpi Dashboard To Evaluate Human Resources Performance is perfect for any presentation, be it in front of clients or colleagues. It is a versatile and stylish solution for organizing your meetings. The Employee Relations In Human Resource Kpi Dashboard To Evaluate Human Resources Performance features a modern design for your presentation meetings. The adjustable and customizable slides provide unlimited possibilities for acing up your presentation. Slidegeeks has done all the homework before launching the product for you. So, do not wait, grab the presentation templates today This slide shows dashboard which can be used by organizations to measure the results of employee relation management. It includes metrics such as employee net promoter score, employee absenteeism and employee retention.
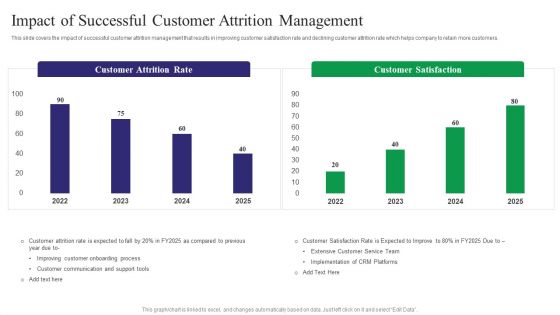
Reducing Customer Turnover Rates Impact Of Successful Customer Attrition Introduction PDF
This slide covers the impact of successful customer attrition management that results in improving customer satisfaction rate and declining customer attrition rate which helps company to retain more customers. Whether you have daily or monthly meetings, a brilliant presentation is necessary. Reducing Customer Turnover Rates Impact Of Successful Customer Attrition Introduction PDF can be your best option for delivering a presentation. Represent everything in detail using Reducing Customer Turnover Rates Impact Of Successful Customer Attrition Introduction PDF and make yourself stand out in meetings. The template is versatile and follows a structure that will cater to your requirements. All the templates prepared by Slidegeeks are easy to download and edit. Our research experts have taken care of the corporate themes as well. So, give it a try and see the results.
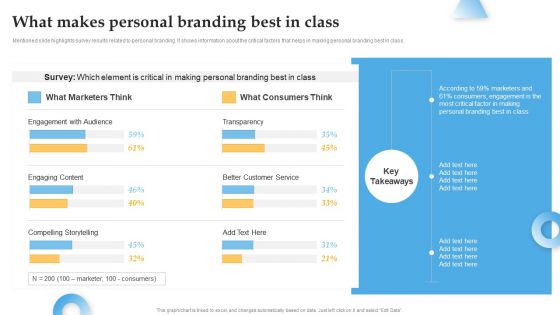
What Makes Personal Branding Best In Class Comprehensive Personal Brand Building Guide For Social Media Inspiration PDF
Mentioned slide highlights survey results related to personal branding. It shows information about the critical factors that helps in making personal branding best in class.Whether you have daily or monthly meetings, a brilliant presentation is necessary. What Makes Personal Branding Best In Class Comprehensive Personal Brand Building Guide For Social Media Inspiration PDF can be your best option for delivering a presentation. Represent everything in detail using What Makes Personal Branding Best In Class Comprehensive Personal Brand Building Guide For Social Media Inspiration PDF and make yourself stand out in meetings. The template is versatile and follows a structure that will cater to your requirements. All the templates prepared by Slidegeeks are easy to download and edit. Our research experts have taken care of the corporate themes as well. So, give it a try and see the results.
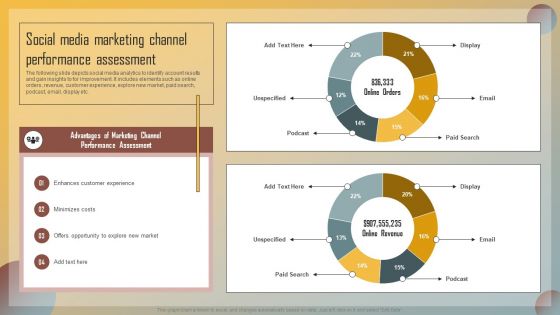
Guide For Marketing Analytics To Improve Decisions Social Media Marketing Channel Performance Assessment Pictures PDF
The following slide depicts social media analytics to identify account results and gain insights to for improvement. It includes elements such as online orders, revenue, customer experience, explore new market, paid search, podcast, email, display etc. Whether you have daily or monthly meetings, a brilliant presentation is necessary. Guide For Marketing Analytics To Improve Decisions Social Media Marketing Channel Performance Assessment Pictures PDF can be your best option for delivering a presentation. Represent everything in detail using Guide For Marketing Analytics To Improve Decisions Social Media Marketing Channel Performance Assessment Pictures PDF and make yourself stand out in meetings. The template is versatile and follows a structure that will cater to your requirements. All the templates prepared by Slidegeeks are easy to download and edit. Our research experts have taken care of the corporate themes as well. So, give it a try and see the results.
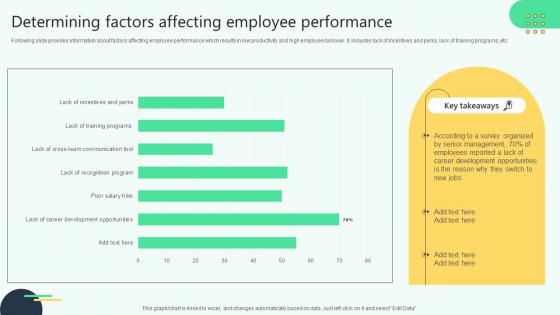
Determining Factors Affecting Employee Performance Analysing Hr Data For Effective Decision Making
Following slide provides information about factors affecting employee performance which results in low productivity and high employee turnover. It includes lack of incentives and perks, lack of training programs, etc. Find highly impressive Determining Factors Affecting Employee Performance Analysing Hr Data For Effective Decision Making on Slidegeeks to deliver a meaningful presentation. You can save an ample amount of time using these presentation templates. No need to worry to prepare everything from scratch because Slidegeeks experts have already done a huge research and work for you. You need to download Determining Factors Affecting Employee Performance Analysing Hr Data For Effective Decision Making for your upcoming presentation. All the presentation templates are 100 percent editable and you can change the color and personalize the content accordingly. Download now Following slide provides information about factors affecting employee performance which results in low productivity and high employee turnover. It includes lack of incentives and perks, lack of training programs, etc.
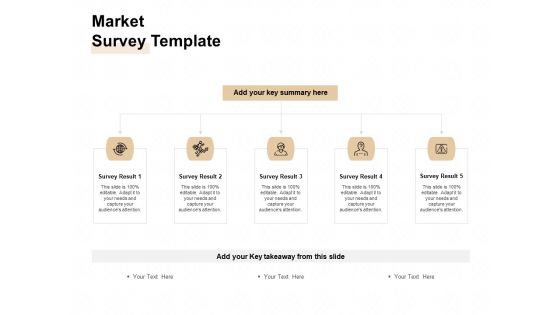
Market Sizing Market Survey Template Ppt File Picture PDF
Presenting this set of slides with name market sizing market survey template ppt file picture pdf. This is a five stage process. The stages in this process are survey result 1 to survey result 5. This is a completely editable PowerPoint presentation and is available for immediate download. Download now and impress your audience.
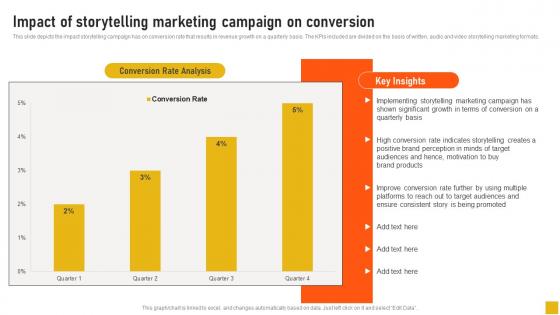
Impact Of Storytelling Marketing Campaign On Conversion Comprehensive Guide Mockup Pdf
This slide depicts the impact storytelling campaign has on conversion rate that results in revenue growth on a quarterly basis. The KPIs included are divided on the basis of written, audio and video storytelling marketing formats. From laying roadmaps to briefing everything in detail, our templates are perfect for you. You can set the stage with your presentation slides. All you have to do is download these easy-to-edit and customizable templates. Impact Of Storytelling Marketing Campaign On Conversion Comprehensive Guide Mockup Pdf will help you deliver an outstanding performance that everyone would remember and praise you for. Do download this presentation today. This slide depicts the impact storytelling campaign has on conversion rate that results in revenue growth on a quarterly basis. The KPIs included are divided on the basis of written, audio and video storytelling marketing formats.

Reviewing Current First Call Response Time Boosting Customer Retention Rate With Live Chat
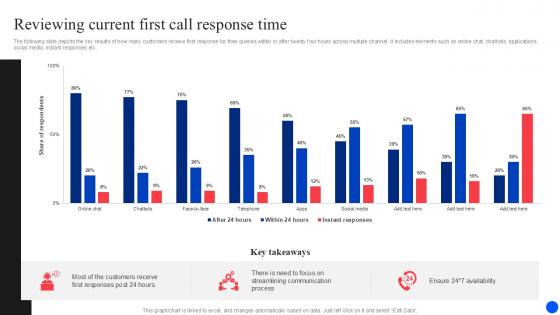
The following slide depicts the key results of how many customers receive first response for their queries within or after twenty four hours across multiple channel. It includes elements such as online chat, chatbots, applications, social media, instant responses etc. The best PPT templates are a great way to save time, energy, and resources. Slidegeeks have 100 percent editable powerpoint slides making them incredibly versatile. With these quality presentation templates, you can create a captivating and memorable presentation by combining visually appealing slides and effectively communicating your message. Download Reviewing Current First Call Response Time Boosting Customer Retention Rate With Live Chat from Slidegeeks and deliver a wonderful presentation. The following slide depicts the key results of how many customers receive first response for their queries within or after twenty four hours across multiple channel. It includes elements such as online chat, chatbots, applications, social media, instant responses etc.
Reviewing Current First Call Response Improving Customer Retention PPT Slide
The following slide depicts the key results of how many customers receive first response for their queries within or after twenty four hours across multiple channel. It includes elements such as online chat, chatbots, applications, social media, instant responses etc. The best PPT templates are a great way to save time, energy, and resources. Slidegeeks have 100 percent editable powerpoint slides making them incredibly versatile. With these quality presentation templates, you can create a captivating and memorable presentation by combining visually appealing slides and effectively communicating your message. Download Reviewing Current First Call Response Improving Customer Retention PPT Slide from Slidegeeks and deliver a wonderful presentation. The following slide depicts the key results of how many customers receive first response for their queries within or after twenty four hours across multiple channel. It includes elements such as online chat, chatbots, applications, social media, instant responses etc.

Analyzing Post COVID Impact Effective Strategies To Succeed At Virtual Ppt Presentation SA SS V
Following slide represents impact of pandemic on company sales growth and website traffic that results in shift of outside sales towards remote approach. Boost your pitch with our creative Analyzing Post COVID Impact Effective Strategies To Succeed At Virtual Ppt Presentation SA SS V. Deliver an awe-inspiring pitch that will mesmerize everyone. Using these presentation templates you will surely catch everyones attention. You can browse the ppts collection on our website. We have researchers who are experts at creating the right content for the templates. So you do not have to invest time in any additional work. Just grab the template now and use them. Following slide represents impact of pandemic on company sales growth and website traffic that results in shift of outside sales towards remote approach.

Reviewing Current First Call Enhancing Customer Experience Ppt Sample
The following slide depicts the key results of how many customers receive first response for their queries within or after twenty four hours across multiple channel. It includes elements such as online chat, chatbots, applications, social media, instant responses etc. The best PPT templates are a great way to save time, energy, and resources. Slidegeeks have 100 percent editable powerpoint slides making them incredibly versatile. With these quality presentation templates, you can create a captivating and memorable presentation by combining visually appealing slides and effectively communicating your message. Download Reviewing Current First Call Enhancing Customer Experience Ppt Sample from Slidegeeks and deliver a wonderful presentation. The following slide depicts the key results of how many customers receive first response for their queries within or after twenty four hours across multiple channel. It includes elements such as online chat, chatbots, applications, social media, instant responses etc.
KPI Dashboard To Track Channel Partner Strategy Performance Cooperative Sales Tactics Structure Pdf
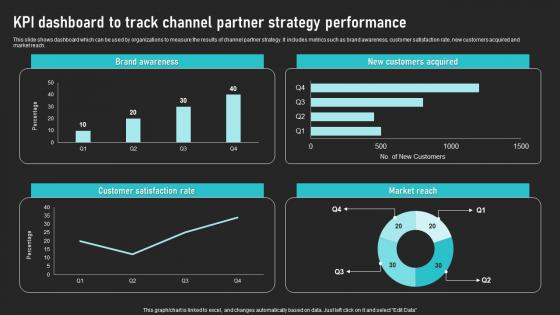
This slide shows dashboard which can be used by organizations to measure the results of channel partner strategy. It includes metrics such as brand awareness, customer satisfaction rate, new customers acquired and market reach. Get a simple yet stunning designed KPI Dashboard To Track Channel Partner Strategy Performance Cooperative Sales Tactics Structure Pdf It is the best one to establish the tone in your meetings. It is an excellent way to make your presentations highly effective. So, download this PPT today from Slidegeeks and see the positive impacts. Our easy-to-edit KPI Dashboard To Track Channel Partner Strategy Performance Cooperative Sales Tactics Structure Pdf can be your go-to option for all upcoming conferences and meetings. So, what are you waiting for Grab this template today. This slide shows dashboard which can be used by organizations to measure the results of channel partner strategy. It includes metrics such as brand awareness, customer satisfaction rate, new customers acquired and market reach.
How Do Influencers Want To Be Entrepreneurs Roadmap To Effective Sample Pdf
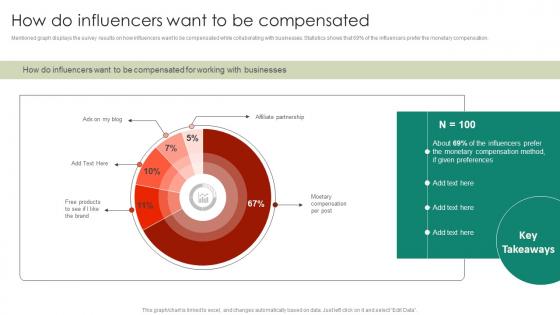
Mentioned graph displays the survey results on how influencers want to be compensated while collaborating with businesses. Statistics shows that 69precent of the influencers prefer the monetary compensation.Welcome to our selection of the How Do Influencers Want To Be Entrepreneurs Roadmap To Effective Sample Pdf. These are designed to help you showcase your creativity and bring your sphere to life. Planning and Innovation are essential for any business that is just starting out. This collection contains the designs that you need for your everyday presentations. All of our PowerPoints are 100Precent editable, so you can customize them to suit your needs. This multi-purpose template can be used in various situations. Grab these presentation templates today. Mentioned graph displays the survey results on how influencers want to be compensated while collaborating with businesses. Statistics shows that 69precent of the influencers prefer the monetary compensation.

 Home
Home