Icon Results
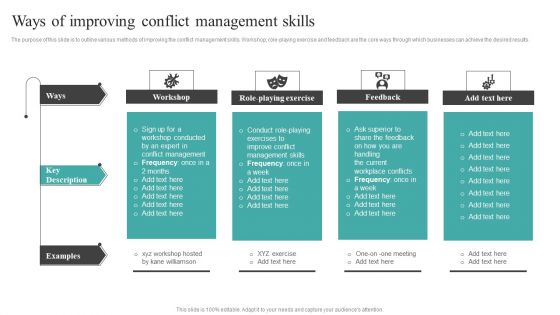
Common Conflict Situations Ways Of Improving Conflict Management Skills Formats PDF
The purpose of this slide is to outline various methods of improving the conflict management skills. Workshop, role-playing exercise and feedback are the core ways through which businesses can achieve the desired results. Slidegeeks is one of the best resources for PowerPoint templates. You can download easily and regulate Common Conflict Situations Ways Of Improving Conflict Management Skills Formats PDF for your personal presentations from our wonderful collection. A few clicks is all it takes to discover and get the most relevant and appropriate templates. Use our Templates to add a unique zing and appeal to your presentation and meetings. All the slides are easy to edit and you can use them even for advertisement purposes.
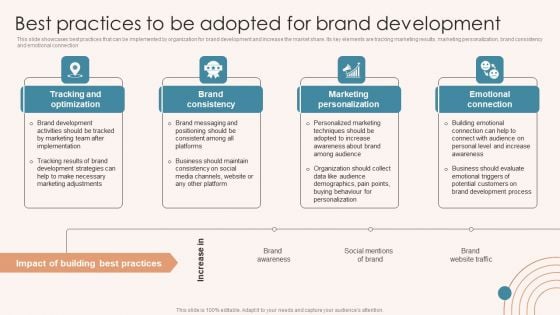
Brand Marketing Strategy Best Practices To Be Adopted For Brand Development Information PDF
This slide showcases best practices that can be implemented by organization for brand development and increase the market share. Its key elements are tracking marketing results, marketing personalization, brand consistency and emotional connection. Slidegeeks is one of the best resources for PowerPoint templates. You can download easily and regulate Brand Marketing Strategy Best Practices To Be Adopted For Brand Development Information PDF for your personal presentations from our wonderful collection. A few clicks is all it takes to discover and get the most relevant and appropriate templates. Use our Templates to add a unique zing and appeal to your presentation and meetings. All the slides are easy to edit and you can use them even for advertisement purposes.
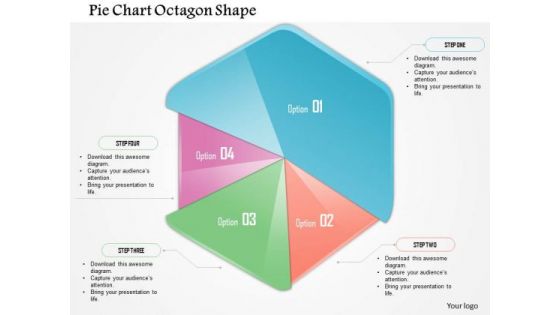
Business Diagram Pie Chart Octagon Shape Presentation Template
This business plan power point template has been designed with pie chart in octagon shape. This PPT contains the concept of result analysis for any business process. Use this PPT for business and sales related presentations.
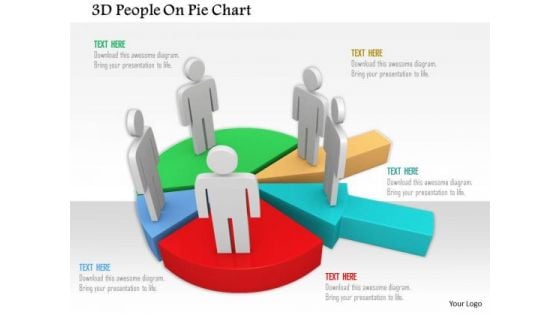
3d People On Pie Chart PowerPoint Templates
This power point diagram has been crafted with graphic of 3d team members on pie chart. This 3d diagram contains the concept of team management and result analysis. Use this diagram to create an impact on your viewers.
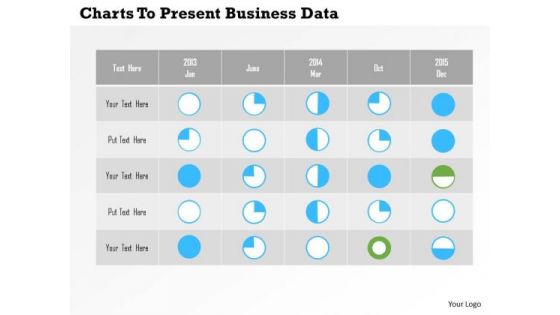
Business Diagram Charts To Present Business Data PowerPoint Templates
Table of pie graphs has been used in this power point diagram. This business diagram contains the concept of result analysis. The template offers an excellent background to build up the various stages of your business process.
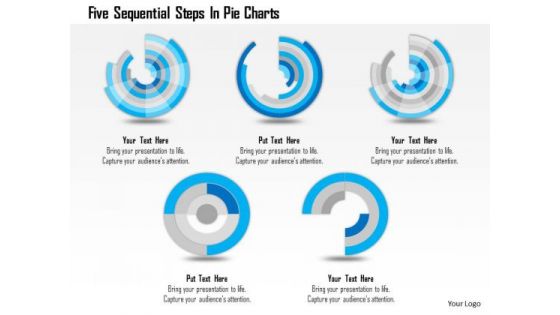
Business Diagram Five Sequential Steps In Pie Charts Presentation Template
Five sequential pie charts are used to craft this power point template. This PPT contains the concept of process flow and result analysis. Use this PPT for your business and sales related presentations and build quality presentation for your viewers.
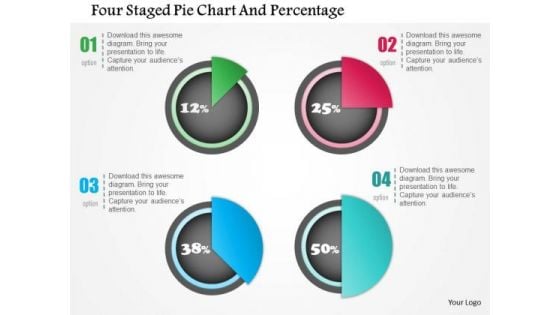
Business Diagram Four Staged Pie Chart And Percentage Presentation Template
Four staged pie chart and percentage values has been used to design this power point template. This PPT contains the concept of financial result analysis. Use this PPT for business and marketing related presentations.
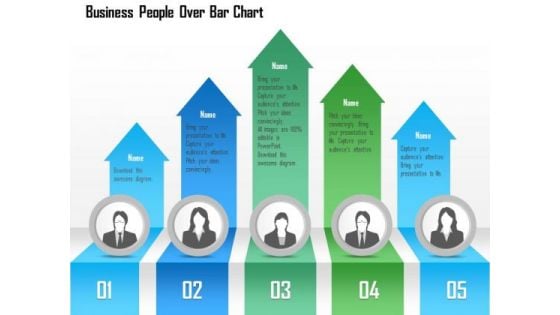
Business Diagram Business People Over Bar Chart PowerPoint Template
This Power Point template has been designed with graphic of business people and bar chart. This PPT contains the concept of result analysis and business data display. Use this PPT slide for your business and marketing related presentations.
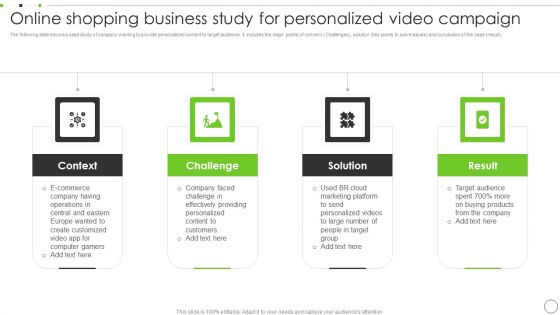
Online Shopping Business Study For Personalized Video Campaign Demonstration PDF
The following slide shows a case study of company wanting to provide personalized content to target audience. It includes the major points of concern Challenges, solution key points to solve issues and conclusion of the case result. Persuade your audience using this Online Shopping Business Study For Personalized Video Campaign Demonstration PDF. This PPT design covers four stages, thus making it a great tool to use. It also caters to a variety of topics including Context, Challenge, Solution, Result. Download this PPT design now to present a convincing pitch that not only emphasizes the topic but also showcases your presentation skills.
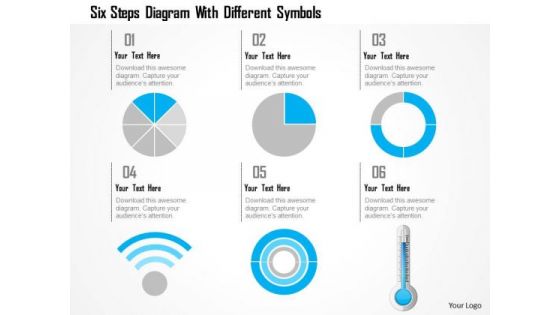
Business Diagram Six Steps Diagram With Different Symbols Presentation Template
This power point template has been crafted with graphic of 3d pie charts with Wi-Fi symbol and thermometer. This PPT contains the concept of calculation and result analysis. Use this PPT for your business and science related presentations.
Marketing Business Case Of Network Social Tracking Tool Ppt Summary Picture PDF
This slide shows case study of company that managed to make their B2B conversion success by utilizing social tracking tool. It also includes overview of the entire case, approaches used to converting the process into victory and end result. Persuade your audience using this Marketing Business Case Of Network Social Tracking Tool Ppt Summary Picture PDF. This PPT design covers three stages, thus making it a great tool to use. It also caters to a variety of topics including Overview, Approach, Result. Download this PPT design now to present a convincing pitch that not only emphasizes the topic but also showcases your presentation skills.
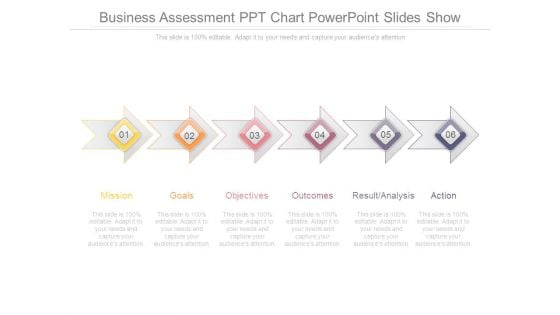
Business Assessment Ppt Chart Powerpoint Slides Show
This is a business assessment ppt chart powerpoint slides show. This is a six stage process. The stages in this process are mission, goals, objectives, outcomes, result analysis, action.
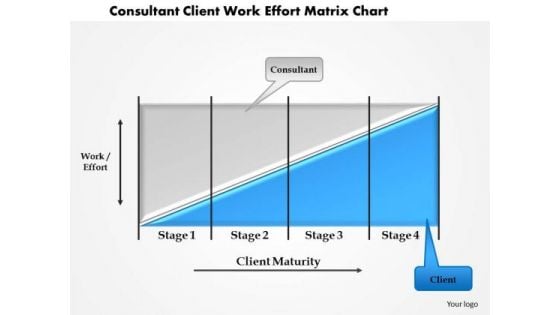
Business Framework Consultant Client Work Effort Matrix Chart PowerPoint Presentation
This business power point template slide has been crafted with graphic of bar graph. This bar graph is called as coase theorem. Use this professional diagram for your result analysis related presentation.
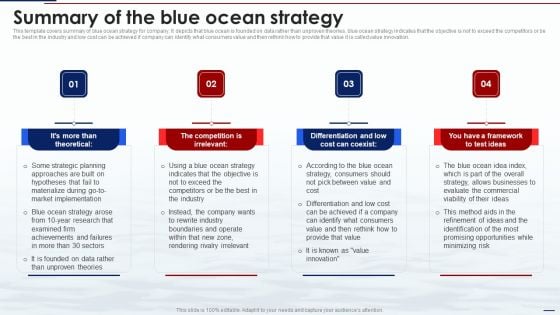
Blue Ocean Tactics Summary Of The Blue Ocean Strategy Ppt Ideas Visuals PDF
This template covers summary of blue ocean strategy for company. It depicts that blue ocean is founded on data rather than unproven theories, blue ocean strategy indicates that the objective is not to exceed the competitors or be the best in the industry and low cost can be achieved if company can identify what consumers value and then rethink how to provide that value it is called value innovation. Whether you have daily or monthly meetings, a brilliant presentation is necessary. Blue Ocean Tactics Summary Of The Blue Ocean Strategy Ppt Ideas Visuals PDF can be your best option for delivering a presentation. Represent everything in detail using Blue Ocean Tactics Summary Of The Blue Ocean Strategy Ppt Ideas Visuals PDF and make yourself stand out in meetings. The template is versatile and follows a structure that will cater to your requirements. All the templates prepared by Slidegeeks are easy to download and edit. Our research experts have taken care of the corporate themes as well. So, give it a try and see the results.
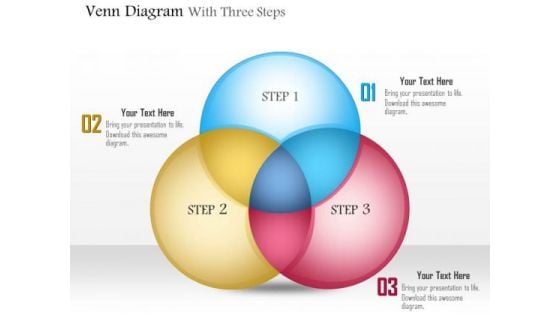
Business Diagram Venn Diagram With Three Steps Presentation Template
This slide displays Venn diagram with three steps presentation template. This power point template has been designed with graphic of Venn diagram. Use this Venn diagram for business result analysis. Build business presentations with analysis practices with this Venn diagram.
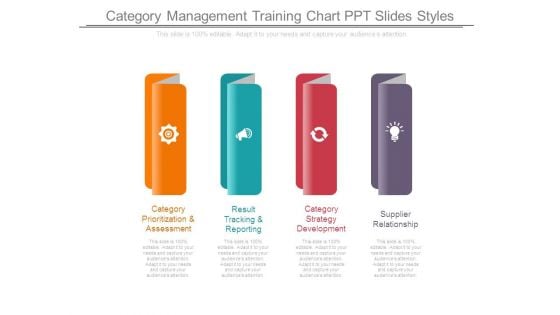
Category Management Training Chart Ppt Slides Styles
This is a category management training chart ppt slides styles. This is a four stage process. The stages in this process are category prioritization and assessment, result tracking and reporting, category strategy development, supplier relationship.
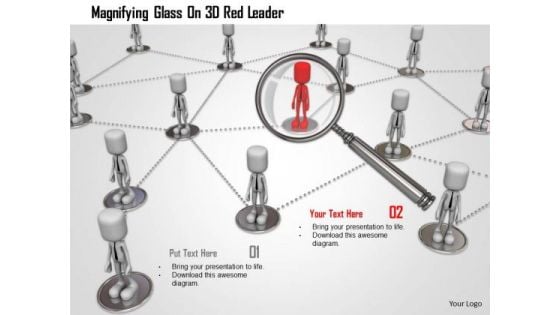
Magnifying Glass On 3d Red Leader PowerPoint Templates
Graphic of persons with magnifier has been used to design this power point template. This 3d diagram contains the concept of right people selection. You have identified the key result areas. Focus on each through this slide.
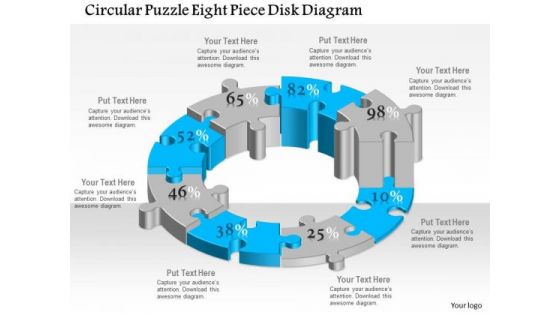
Business Diagram Circular Puzzle Eight Piece Disk Diagram Presentation Template
This business plan power point template has been designed with six staged circular puzzle diagram. This diagram template contains the concept of business process flow and result analysis representation. Use this diagram in your presentation and show these concepts.
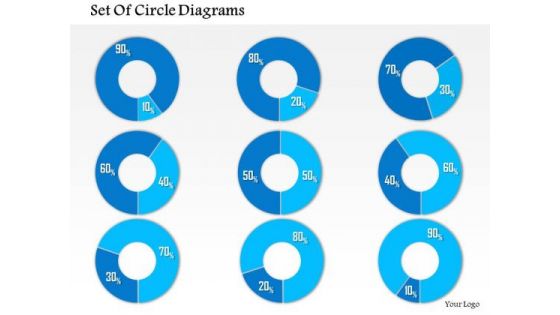
Business Framework 10 Percent To 90 Percent PowerPoint Presentation
This business diagram has been designed with graphic of multiple pie graphs. This diagram slide contains the concept of result analysis with percentage values. Use this diagram to present and compare data in an impressive manner
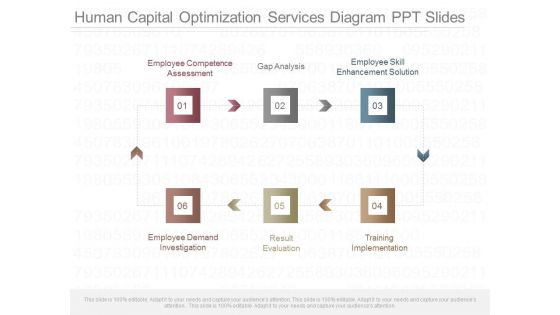
Human Capital Optimization Services Diagram Ppt Slides
This is a human capital optimization services diagram ppt slides. This is a six stage process. The stages in this process are employee competence assessment, gap analysis, employee skill enhancement solution, employee demand investigation, result evaluation, training implementation.

Pumpkins Halloween Festival PowerPoint Themes And PowerPoint Slides 0411
Microsoft PowerPoint Theme and Slide with carved glowing pumpkins at night lit by candles Our Pumpkins Halloween Festival PowerPoint Themes And PowerPoint Slides 0411 are the result of extensive brainstorming. A lot of debate goes into each one.
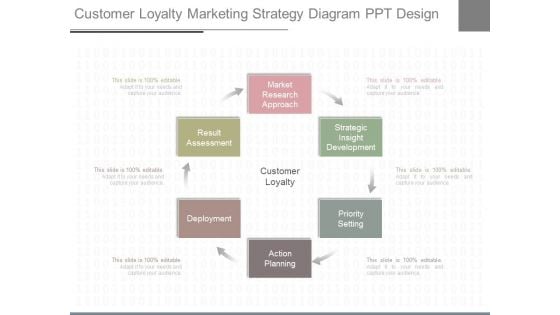
Customer Loyalty Marketing Strategy Diagram Ppt Design
This is a customer loyalty marketing strategy diagram ppt design. This is a six stage process. The stages in this process are market research approach, result assessment, deployment, action planning, priority setting, strategic insight development.
Online Market For B2b Sample Diagram Slides
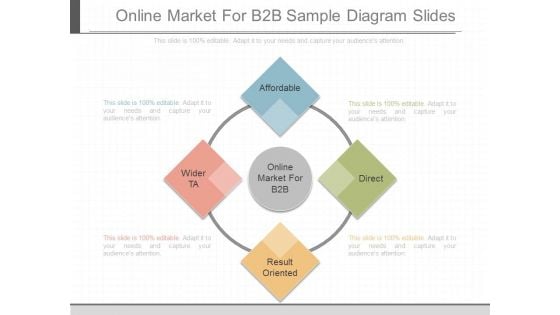
This is a online market for b2b sample diagram slides. This is a four stage process. The stages in this process are affordable, wider ta, result oriented, direct, online market for b2b.
Improved Workforce Management Diagram Ppt Design
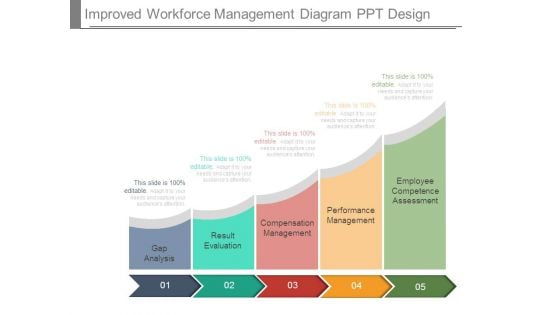
This is a improved workforce management diagram ppt design. This is a five stage process. The stages in this process are gap analysis, result evaluation, compensation management, performance management, employee competence assessment.
Channel Management Reviews Diagram Presentation Backgrounds
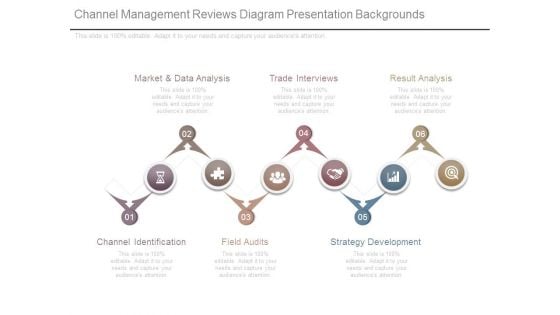
This is a channel management reviews diagram presentation backgrounds. This is a six stage process. The stages in this process are channel identification, market and data analysis, trade interviews, result analysis, strategy development, field audits.
Business Framework Multi Level Growth Text Table Text Boxes 2 PowerPoint Presentation
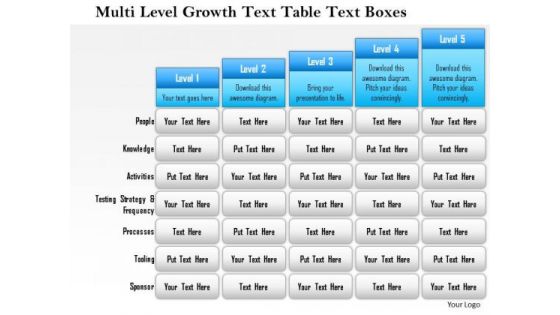
Five staged text box style chart in bar graph design has been used to decorate this power point template slide. This diagram slide contains the multilevel growth concept. Use this PPT slide for financial growth and result analysis related topics.
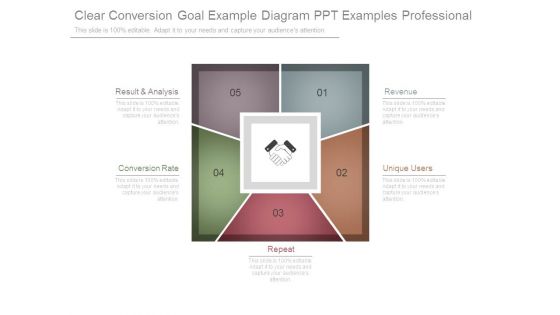
Clear Conversion Goal Example Diagram Ppt Examples Professional
This is a clear conversion goal example diagram ppt examples professional. This is a five stage process. The stages in this process are result and analysis, conversion rate, repeat, unique users, revenue.
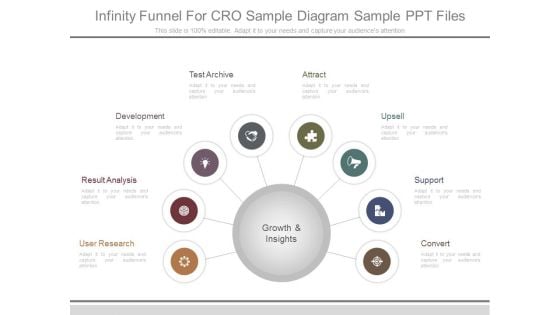
Infinity Funnel For Cro Sample Diagram Sample Ppt Files
This is a infinity funnel for cro sample diagram sample ppt files. This is a eight stage process. The stages in this process are user research, result analysis, development, test archive, attract, upsell, support, convert, growth and insights.
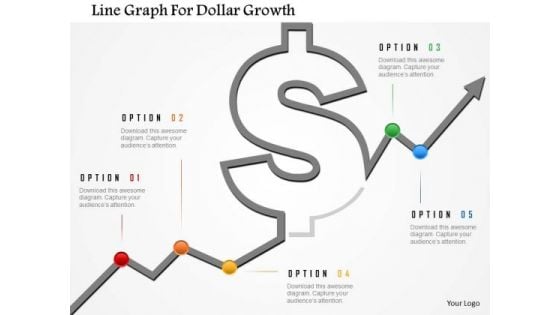
Business Diagram Line Graph For Dollar Growth Presentation Template
Graphic of dollar symbol and growth arrow has been used to design this power point template. This diagram contains the concept of financial result analysis. Use this business diagram for finance related presentations
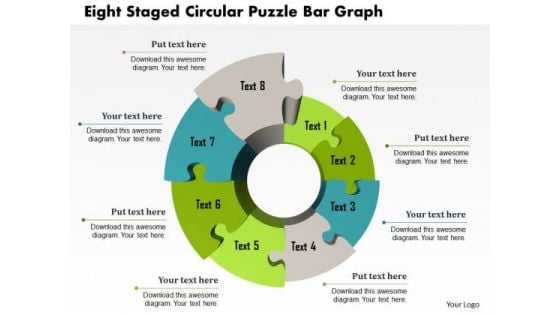
Business Diagram Eight Staged Circular Puzzle Bar Graph Presentation Template
This Power Point template has been crafted with graphic of eight staged circular puzzle and bar graph. This PPT contains the financial result analysis related concept. Use this PPT for your business and success related presentations.
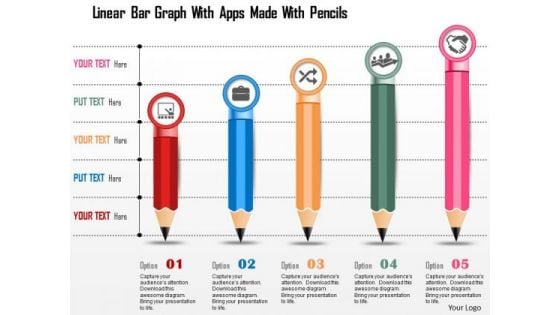
Business Diagram Linear Bar Graph With Apps Made With Pencils Presentation Template
This power point template has been crafted with graphic of linear bar graph and apps made with pencils. This PPT diagram can be used for business growth analysis and result analysis. Use this PPT for business and marketing related presentations.
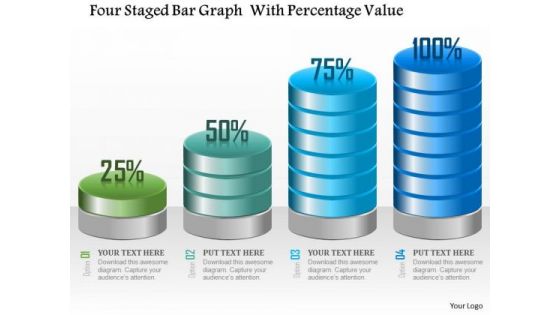
Business Diagram Four Staged Bar Graph With Percentage Value Presentation Template
Four staged bar graph with percentage value has been used to craft this power point template. This PPT contains the concept of making financial timeline and result analysis. This PPT can be used for business and finance related presentations.
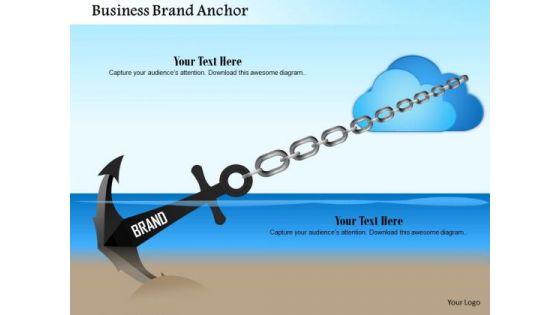
Business Framework Business Brand Anchor PowerPoint Presentation
Explain the concept of new idea generation with this exclusive PPT slide. This PPT contain the graphic of two bulbs making a Venn diagram. This PPT can be used for any business presentation to representation result analysis.

Magnifying Glass On Blue Person PowerPoint Templates
Graphic of persons with magnifier has been used to design this power point template. This 3d diagram contains the concept of right people selection. You have identified the key result areas. Focus on each through this slide.
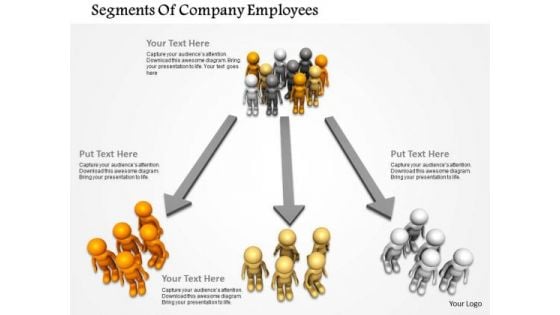
Segments Of Company Employees PowerPoint Templates
Concept of three way customer segmentation has been defined in this power point template. This 3d diagram contains the graphic of customers group and way. You have identified the key result areas. Focus on each through this slide.
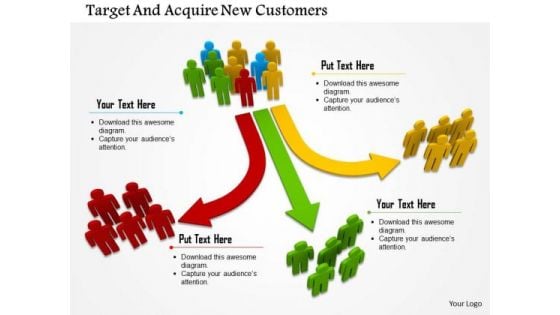
Target And Acquire New Customers PowerPoint Templates
Concept of three way customer segmentation has been defined in this power point template. This 3d diagram contains the graphic of customers group and way. You have identified the key result areas. Focus on each through this slide.
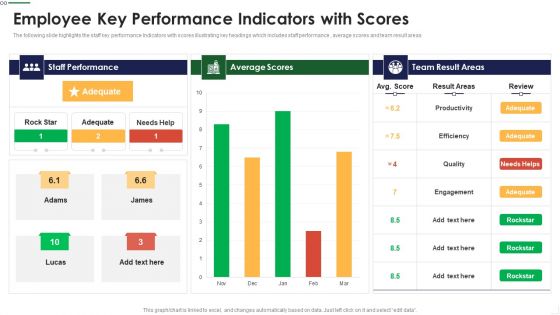
Employee Key Performance Indicators With Scores Themes PDF
The following slide highlights the staff key performance Indicators with scores illustrating key headings which includes staff performance , average scores and team result areas Pitch your topic with ease and precision using this Employee Key Performance Indicators With Scores Themes PDF This layout presents information on Staff Performance, Average Scores, Team Result It is also available for immediate download and adjustment. So, changes can be made in the color, design, graphics or any other component to create a unique layout.
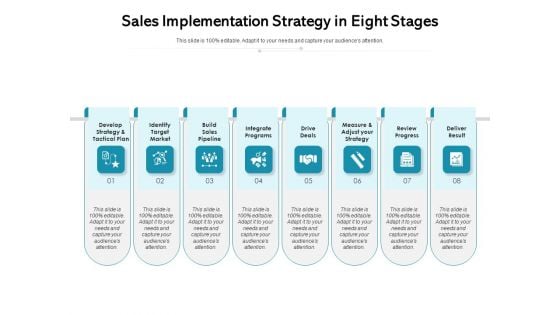
Sales Implementation Strategy In Eight Stages Ppt PowerPoint Presentation Gallery Rules PDF
Presenting sales implementation strategy in eight stages ppt powerpoint presentation gallery rules pdf to dispense important information. This template comprises eight stages. It also presents valuable insights into the topics including develop strategy and tactical plan, identify target market, build sales pipeline, integrate programs, drive deals, measure and adjust your strategy, review progress, deliver result. This is a completely customizable PowerPoint theme that can be put to use immediately. So, download it and address the topic impactfully.
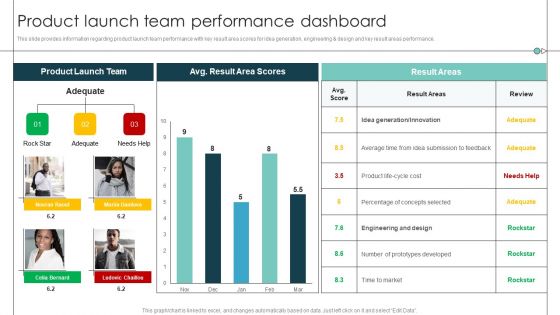
Product Launch Team Performance Dashboard Product Release Commencement Structure PDF
This slide provides information regarding product launch team performance with key result area scores for idea generation, engineering and design and key result areas performance. Deliver and pitch your topic in the best possible manner with this Product Launch Team Performance Dashboard Product Release Commencement Structure PDF. Use them to share invaluable insights on Average Time, Prototypes Developed, Percentage Concepts and impress your audience. This template can be altered and modified as per your expectations. So, grab it now.
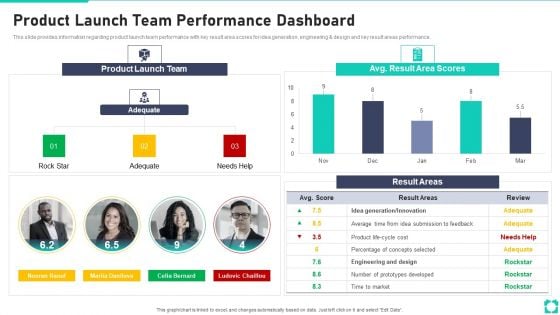
New Product Launch Playbook Product Launch Team Performance Dashboard Elements PDF
This slide provides information regarding product launch team performance with key result area scores for idea generation, engineering and design and key result areas performance. Deliver an awe inspiring pitch with this creative new product launch playbook product launch team performance dashboard elements pdf bundle. Topics like product launch team performance dashboard can be discussed with this completely editable template. It is available for immediate download depending on the needs and requirements of the user.

KPI Dashboard Showcasing Product Management Guidelines PDF
This slide showcases dashboard providing product development team performance status with determined KPIs. It provides details such as product development team score, average result scores and result KPIs. Pitch your topic with ease and precision using this KPI Dashboard Showcasing Product Management Guidelines PDF. This layout presents information on Average Rating, Innovation, Design. It is also available for immediate download and adjustment. So, changes can be made in the color, design, graphics or any other component to create a unique layout.
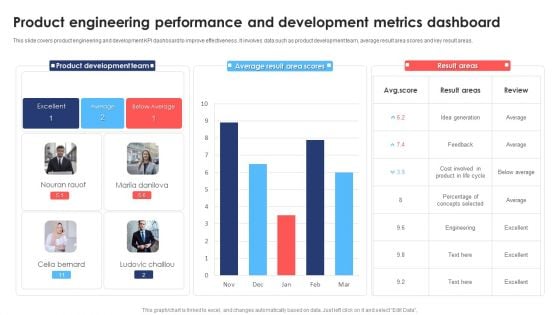
Product Engineering Performance And Development Metrics Dashboard Topics PDF
This slide covers product engineering and development KPI dashboard to improve effectiveness. It involves data such as product development team, average result area scores and key result areas. Showcasing this set of slides titled Product Engineering Performance And Development Metrics Dashboard Topics PDF. The topics addressed in these templates are Product Development Team, Average, Cost. All the content presented in this PPT design is completely editable. Download it and make adjustments in color, background, font etc. as per your unique business setting.
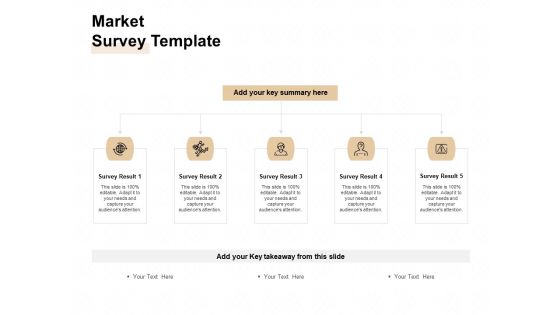
TAM SAM And SOM Market Survey Template Ppt Portfolio Graphic Tips PDF
Presenting tam sam and som market survey template ppt portfolio graphic tips pdf to provide visual cues and insights. Share and navigate important information on five stages that need your due attention. This template can be used to pitch topics like survey result 1 to survey result 5. In addition, this PPT design contains high-resolution images, graphics, etc, that are easily editable and available for immediate download.
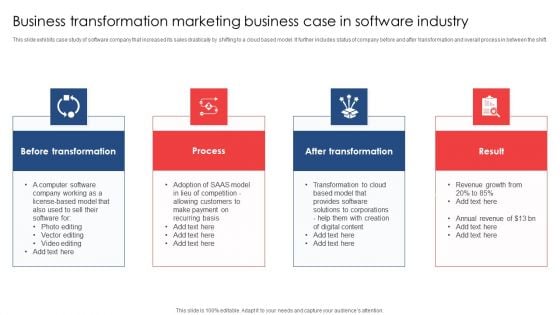
Business Transformation Marketing Business Case In Software Industry Ppt Inspiration Design Templates PDF
This slide exhibits case study of software company that increased its sales drastically by shifting to a cloud based model. It further includes status of company before and after transformation and overall process in between the shift. Presenting Business Transformation Marketing Business Case In Software Industry Ppt Inspiration Design Templates PDF to dispense important information. This template comprises four stages. It also presents valuable insights into the topics including Before Transformation, Process, After Transformation, Result. This is a completely customizable PowerPoint theme that can be put to use immediately. So, download it and address the topic impactfully.
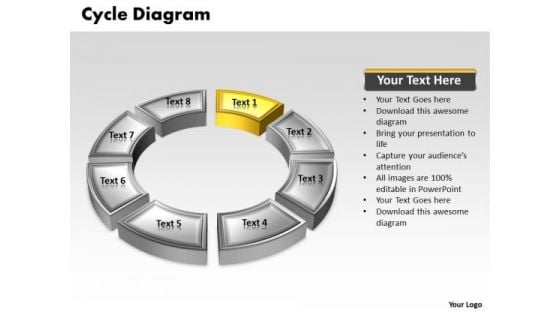
Ppt Yellow Animated Text Cycle Network Diagram PowerPoint Template Templates
PPT yellow animated text cycle network diagram powerpoint template Templates-Use this Circular diagram to show activities that are related to the business plan metrics and monitor the results to determine if the business plan is proceeding as planned.-PPT yellow animated text cycle network diagram powerpoint template Templates-Abstract, Blank, Business, Chart, Circular, Circulation, Cycle, Design, Diagram, Empty, Executive, Icon, Illustration, Management, Model, Numbers, Organization, Procedure, Process Recognize your calling with our Ppt Yellow Animated Text Cycle Network Diagram PowerPoint Template Templates. Download without worries with our money back guaranteee.
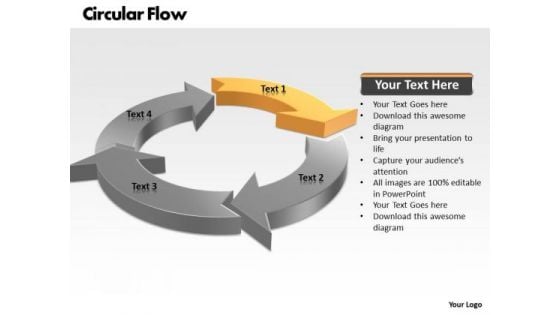
Ppt Circular Flow Process PowerPoint Presentation Chart 4 Stages Templates
PPT circular flow process powerpoint presentation chart 4 stages Templates-The diagrams are used to represent part whole relationship because results relationship etc. this is a 4 parts circle to express your ideas. They are indicators of the path you have in mind.-PPT circular flow process powerpoint presentation chart 4 stages Templates-Arrow, Chart, Circle, Circular, Circulation, Collection, Concept, Connection, Continuity, Cursor, Cycle, Cyclic, Diagram, Direction, Flow, Flowchart, Graph, Graphic, Group, Icon, Motion, Movement, Process, Progress, Recycle, Recycling, Refresh, Reload, Renew, Repetition, Return, Reuse, Ring, Rotation, Round, Sign, Six, Symbol Address eco-clubs with our Ppt Circular Flow Process PowerPoint Presentation Chart 4 Stages Templates. Advocate curbing of carbon emissions.
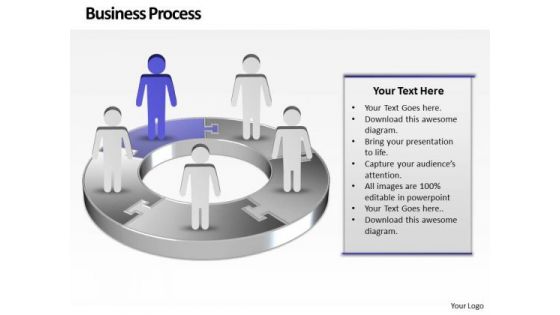
Ppt Purple Men Standing On Free Concept Pie PowerPoint Presentation Chart Templates
PPT purple men standing on free concept pie powerpoint presentation chart Templates-Use this Circular Arrow diagram to show activities that are related to the business plan metrics and monitor the results to determine if the business plan is proceeding as planned.-PPT purple men standing on free concept pie powerpoint presentation chart Templates-3d, arrow, background, blue, chart, circle, circular, clipart, colorful, connection, continuity, cycle, cyclic, diagram, direction, flow, graph, icon, illustration, isolated, loop, motion, process, progress, recycle, ring, round, step, sticker, symbol, teamwork, template, turn, vector Analyse the effect of different factors. Our Ppt Purple Men Standing On Free Concept Pie PowerPoint Presentation Chart Templates will give them equal attention.
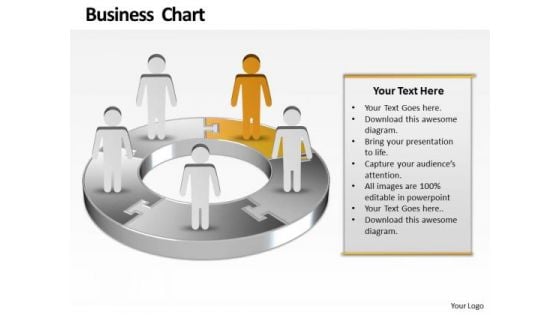
Ppt Yellow Men Standing On Business PowerPoint Presentation Pie Chart Templates
PPT yellow men standing on business powerpoint presentation pie chart Templates-Use this Circular Arrow diagram to show activities that are related to the business plan metrics and monitor the results to determine if the business plan is proceeding as planned.-PPT yellow men standing on business powerpoint presentation pie chart Templates-3d, arrow, background, blue, chart, circle, circular, clipart, colorful, connection, continuity, cycle, cyclic, diagram, direction, flow, graph, icon, illustration, isolated, loop, motion, process, progress, recycle, ring, round, step, sticker, symbol, teamwork, template, turn, vector Deal with matters in an equitable way. Reach a settlement with the help of our Ppt Yellow Men Standing On Business PowerPoint Presentation Pie Chart Templates.

Ppt Horizontal Flow Actions In Diamond Mining Process PowerPoint Presentation Templates
PPT horizontal flow actions in diamond mining process powerpoint presentation Templates-Use this Circular diagram to show activities that are related to the business plan metrics and monitor the results to determine if the business plan is proceeding as planned. Deliver amazing presentations to mesmerize your audience using this Diagram.-PPT horizontal flow actions in diamond mining process powerpoint presentation Templates-3d, Advertisement, Advertising, Arrow, Border, Business, Circles, Collection, Customer, Design, Element, Icon, Idea, Illustration, Info, Information, Isolated, Label, Light, Location, Needle, New, Notification, Notify, Point, Pointer, Promotion, Role, Rounded Our Ppt Horizontal Flow Actions In Diamond Mining Process PowerPoint Presentation Templates will soon be your favourites. They will delight you with their charm.
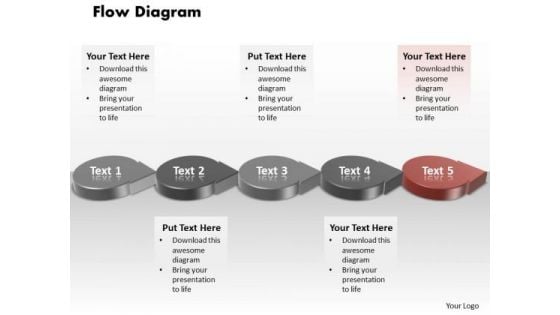
Ppt Red Circular Arrow Process Flow Network Diagram PowerPoint Template Templates
PPT red circular arrow process flow network diagram powerpoint template Templates-Use this Circular Arrow diagram to show activities that are related to the business plan metrics and monitor the results to determine if the business plan is proceeding as planned.-PPT red circular arrow process flow network diagram powerpoint template Templates-3d, arrow, background, blue, chart, clipart, colorful, connection, continuity, cycle, cyclic, diagram, direction, flow, graph, icon, illustration, isolated, loop, motion, process, progress, step, sticker, symbol, teamwork, template, turn, vector Call on the expertise of our Ppt Red Circular Arrow Process Flow Network Diagram PowerPoint Template Templates team. Experience excellence in their every design.
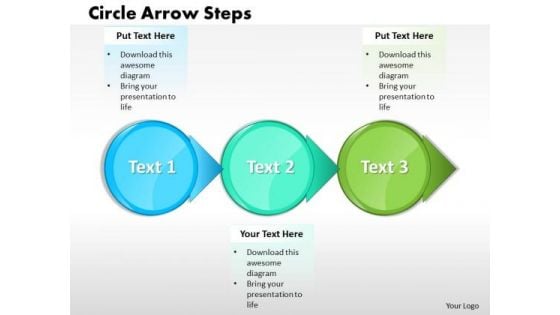
Ppt Three Circle Text Arrow Process Create PowerPoint Macro Templates
PPT three circle text arrow process create powerpoint macro Templates-Use this Circular diagram to show activities that are related to the business plan metrics and monitor the results to determine if the business plan is proceeding as planned.-PPT three circle text arrow process create powerpoint macro Templates-3d, Advertisement, Advertising, Arrow, Border, Business, Circles, Collection, Customer, Design, Element, Icon, Idea, Illustration, Info, Information, Isolated, Label, Light, Location, Needle, New, Notification, Notify, Point, Pointer, Promotion, Role, Rounded Half the effort for double the rewards. Our Ppt Three Circle Text Arrow Process Create PowerPoint Macro Templates deliver exponential returns.
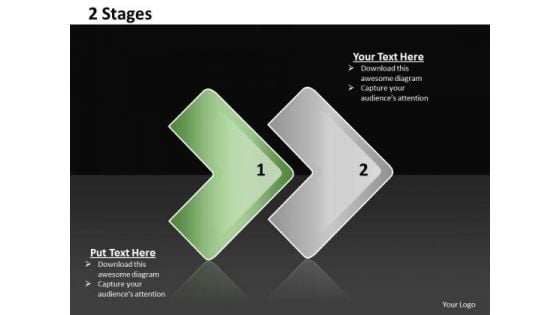
Ppt Linear Way To Show 2 State PowerPoint Presentation Diagram Templates
PPT linear way to show 2 state powerpoint presentation diagram Templates-Emphatically define your message with our above Diagram which contains a graphic of Linear model with its components. It symbolizes affiliation, affinity, alliance, association, connection etc. It shows the ninth stage with pink color.-PPT linear way to show 2 state powerpoint presentation diagram Templates-Aim, Arrow, Arrowheads, Badge, Border, Click, Connection, Curve, Design, Direction, Download, Element, Fuchsia, Icon, Illustration, Indicator, Internet, Magenta, Mark, Object, Orientation, Pointer, Shadow, Shape, Sign Performance evaluation is easier with our Ppt Linear Way To Show 2 State PowerPoint Presentation Diagram Templates. They help you assess results accurately.
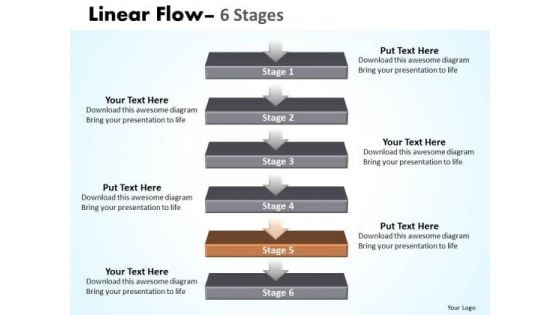
Usa Ppt Non-linear PowerPoint Flow 6 Stages1 Operations Management Design
USA PPT non-linear powerpoint flow 6 stages1 operations management design-Some opportunities are bound to be highly profitable for you to follow up. Use this slide to highlight the results of you thought process and convince your team of the reasons for selecting a particular path to follow.-USA PPT non-linear powerpoint flow 6 stages1 operations management design-Arrow, Background, Business, Chart, Diagram, Financial, Flow, Graphic, Gray, Icon, Illustration, Linear, Management, Orange, Perspective, Process, Reflection, Shapes, Stage, Text Experience exponential.growth with our Usa Ppt Non-linear PowerPoint Flow 6 Stages1 Operations Management Design. Your earnings will acquire a big boost.
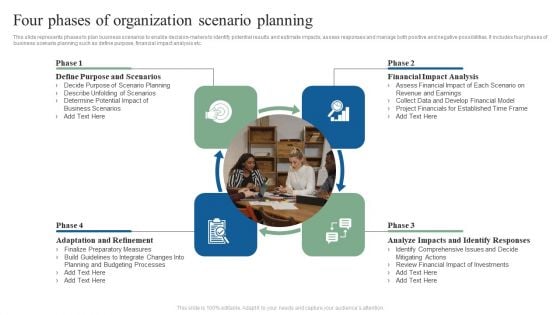
Four Phases Of Organization Scenario Planning Ppt Portfolio Diagrams PDF
This slide represents phases to plan business scenarios to enable decision-makers to identify potential results and estimate impacts, assess responses and manage both positive and negative possibilities. It includes four phases of business scenario planning such as define purpose, financial impact analysis etc. Presenting Four Phases Of Organization Scenario Planning Ppt Portfolio Diagrams PDF to dispense important information. This template comprises four stages. It also presents valuable insights into the topics including Financial Impact Analysis, Analyze Impacts, Identify Responses, Adaptation And Refinement. This is a completely customizable PowerPoint theme that can be put to use immediately. So, download it and address the topic impactfully.
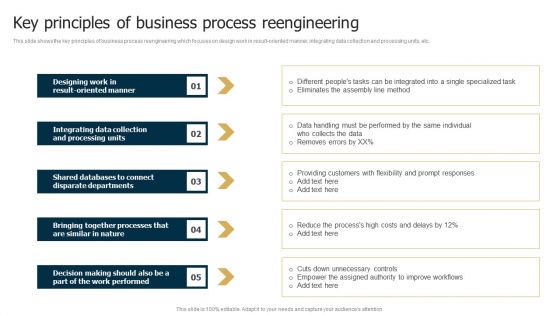
Business Restructuring Process Key Principles Of Business Process Reengineering Diagrams PDF
This slide shows the key principles of business process reengineering which focuses on design work in result-oriented manner, integrating data collection and processing units, etc. Slidegeeks is here to make your presentations a breeze with Business Process Redesigning Key Principles Of Business Process Reengineering Professional PDF With our easy-to-use and customizable templates, you can focus on delivering your ideas rather than worrying about formatting. With a variety of designs to choose from, youre sure to find one that suits your needs. And with animations and unique photos, illustrations, and fonts, you can make your presentation pop. So whether youre giving a sales pitch or presenting to the board, make sure to check out Slidegeeks first
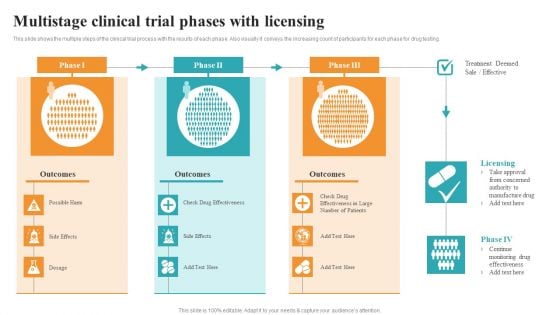
Multistage Clinical Trial Phases With Licensing Medical Research Phases For Clinical Tests Graphics PDF
This slide shows the multiple steps of the clinical trial process with the results of each phase. Also visually it conveys the increasing count of participants for each phase for drug testing. The best PPT templates are a great way to save time, energy, and resources. Slidegeeks have 100 percent editable powerpoint slides making them incredibly versatile. With these quality presentation templates, you can create a captivating and memorable presentation by combining visually appealing slides and effectively communicating your message. Download Multistage Clinical Trial Phases With Licensing Medical Research Phases For Clinical Tests Graphics PDF from Slidegeeks and deliver a wonderful presentation.
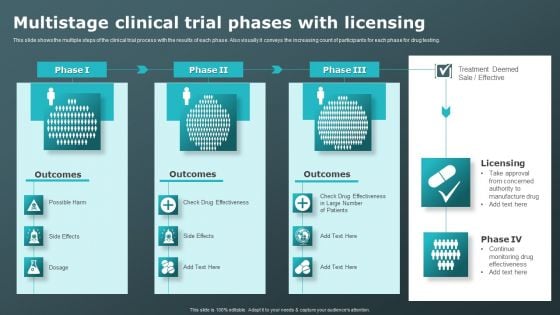
Multistage Clinical Trial Phases With Licensing Clinical Research Trial Phases Rules PDF
This slide shows the multiple steps of the clinical trial process with the results of each phase. Also visually it conveys the increasing count of participants for each phase for drug testing. Boost your pitch with our creative Multistage Clinical Trial Phases With Licensing Clinical Research Trial Phases Rules PDF. Deliver an awe-inspiring pitch that will mesmerize everyone. Using these presentation templates you will surely catch everyones attention. You can browse the ppts collection on our website. We have researchers who are experts at creating the right content for the templates. So you do not have to invest time in any additional work. Just grab the template now and use them.
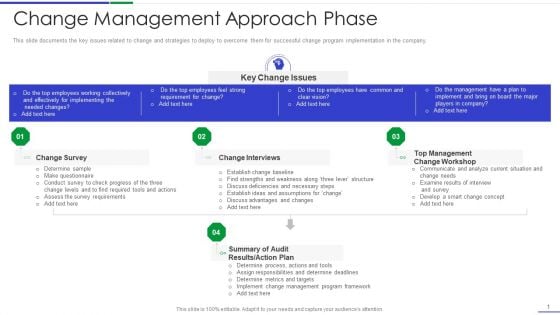
Ultimate Guide To Effective Change Management Process Change Management Approach Phase Diagrams PDF
This slide documents the key issues related to change and strategies to deploy to overcome them for successful change program implementation in the company. This is a ultimate guide to effective change management process change management approach phase diagrams pdf template with various stages. Focus and dispense information on four stages using this creative set, that comes with editable features. It contains large content boxes to add your information on topics like change survey, change interviews, summary of audit results or action plan, top management change workshop. You can also showcase facts, figures, and other relevant content using this PPT layout. Grab it now.
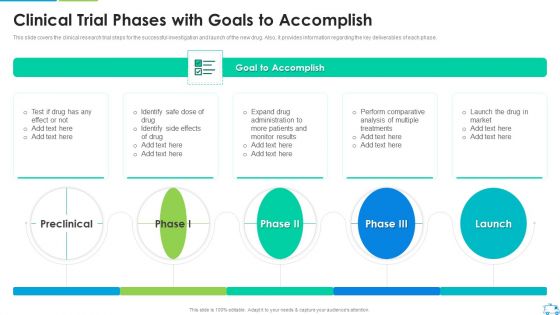
Clinical Trial Phases With Goals To Accomplish Sample PDF
This slide covers the clinical research trial steps for the successful investigation and launch of the new drug. Also, it provides information regarding the key deliverables of each phase.This is a Clinical Trial Phases With Goals To Accomplish Sample PDF template with various stages. Focus and dispense information on four stages using this creative set, that comes with editable features. It contains large content boxes to add your information on topics like Expand Drug Administration, Patients And Monitor, Results Perform You can also showcase facts, figures, and other relevant content using this PPT layout. Grab it now.
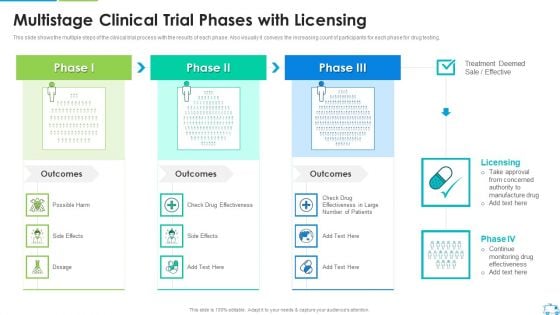
Multistage Clinical Trial Phases With Licensing Elements PDF
This slide shows the multiple steps of the clinical trial process with the results of each phase. Also visually it conveys the increasing count of participants for each phase for drug testing.Deliver and pitch your topic in the best possible manner with this Multistage Clinical Trial Phases With Licensing Elements PDF Use them to share invaluable insights on Take Approval From Concerned Continue, Monitoring Drug Effectiveness, Drug Effectiveness and impress your audience. This template can be altered and modified as per your expectations. So, grab it now.

 Home
Home