Icon Results
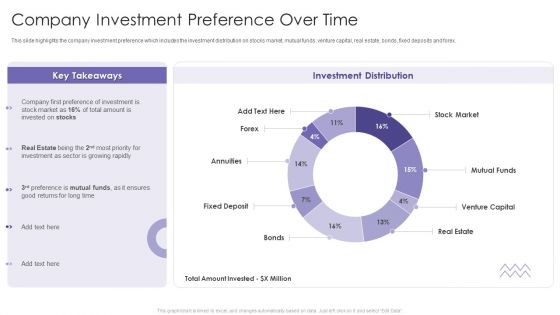
Evaluating Hedge Funds For Greater ROI Company Investment Preference Over Time Diagrams PDF
This slide highlights the company investment preference which includes the investment distribution on stocks market, mutual funds, venture capital, real estate, bonds, fixed deposits and forex. Deliver and pitch your topic in the best possible manner with this Evaluating Hedge Funds For Greater ROI Company Investment Preference Over Time Diagrams PDF. Use them to share invaluable insights on Investment Distribution, Stock Market, Mutual Funds, Venture Capital and impress your audience. This template can be altered and modified as per your expectations. So, grab it now.
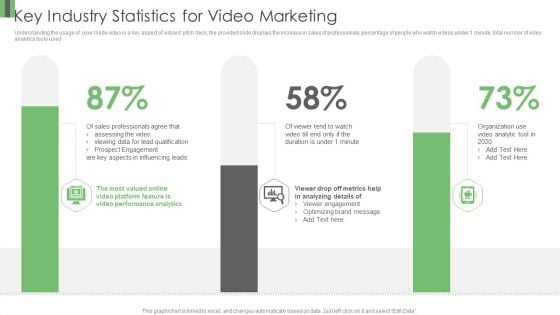
Vidyard Elevator Funding Key Industry Statistics For Video Marketing Ppt Show Diagrams PDF
Understanding the usage of user made video is a key aspect of vidyard pitch deck, the provided slide displays the increase in sales of professionals, percentage of people who watch videos under 1 minute, total number of video analytics tools used . Deliver an awe inspiring pitch with this creative Vidyard Elevator Funding Key Industry Statistics For Video Marketing Ppt Show Diagrams PDF bundle. Topics like Sales Professionals Agree, Prospect Engagement, Valued Online can be discussed with this completely editable template. It is available for immediate download depending on the needs and requirements of the user.
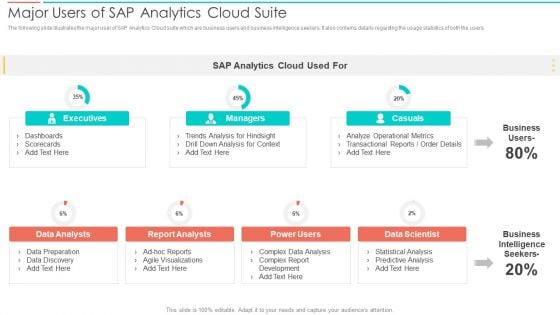
SAC Planning And Implementation Major Users Of SAP Analytics Cloud Suite Diagrams PDF
The following slide illustrates the major user of SAP Analytics Cloud suite which are business users and business intelligence seekers. It also contains details regarding the usage statistics of both the users. Deliver an awe inspiring pitch with this creative SAC Planning And Implementation Major Users Of SAP Analytics Cloud Suite Diagrams PDF bundle. Topics like Executives, Casuals, Business Intelligence Seekers, Data Scientist can be discussed with this completely editable template. It is available for immediate download depending on the needs and requirements of the user.
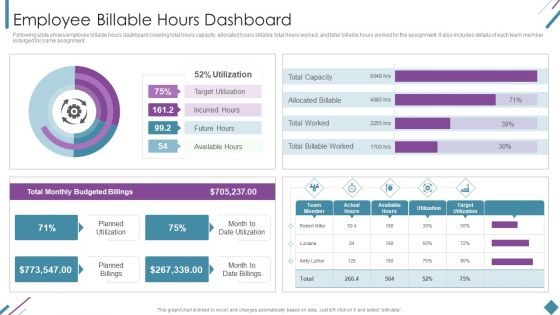
Metrics To Measure Business Performance Employee Billable Hours Dashboard Diagrams PDF
Following slide shows employee billable hours dashboard covering total hours capacity, allocated hours billable, total hours worked, and total billable hours worked for the assignment. It also includes details of each team member indulged for same assignment. Deliver an awe inspiring pitch with this creative Metrics To Measure Business Performance Employee Billable Hours Dashboard Diagrams PDF bundle. Topics like Total Monthly, Budgeted Billings, Planned Utilization can be discussed with this completely editable template. It is available for immediate download depending on the needs and requirements of the user.
B2B Sales Techniques Playbook Sales Management Activities Tracking Dashboard Diagrams PDF
This slide provides information regarding sales management activities tracking dashboard to measure closed business, sales pipeline, sales activity by sales rep, month over month growth, forecast by month, etc. Deliver and pitch your topic in the best possible manner with this B2B Sales Techniques Playbook Sales Management Activities Tracking Dashboard Diagrams PDF. Use them to share invaluable insights on Sales Pipeline, Sales Activity, Sales Pipeline and impress your audience. This template can be altered and modified as per your expectations. So, grab it now.
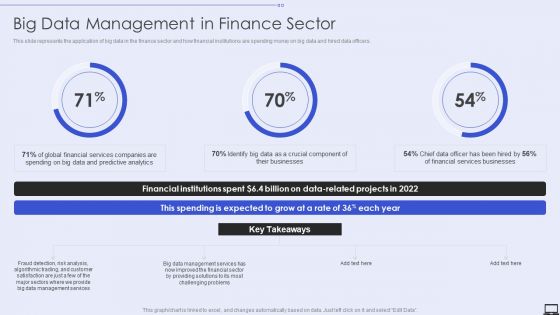
Big Data Management In Finance Sector Ppt PowerPoint Presentation File Diagrams PDF
This slide represents the application of big data in the finance sector and how financial institutions are spending money on big data and hired data officers. Deliver and pitch your topic in the best possible manner with this Big Data Management In Finance Sector Ppt PowerPoint Presentation File Diagrams PDF. Use them to share invaluable insights on Big Data Management Services, Risk Analysis, Global Financial Services and impress your audience. This template can be altered and modified as per your expectations. So, grab it now.
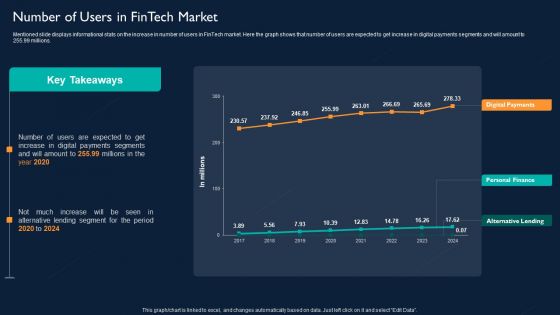
Technology Investment To Enhance Business Growth Number Of Users In Fintech Market Diagrams PDF
Mentioned slide displays informational stats on the increase in number of users in FinTech market. Here the graph shows that number of users are expected to get increase in digital payments segments and will amount to 255.99 millions. Deliver and pitch your topic in the best possible manner with this Technology Investment To Enhance Business Growth Number Of Users In Fintech Market Diagrams PDF. Use them to share invaluable insights on Alternative Lending, Personal Finance, Digital Payments and impress your audience. This template can be altered and modified as per your expectations. So, grab it now.
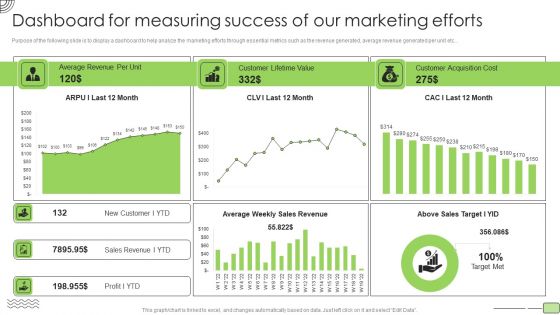
Organic Business Growth Strategies Dashboard For Measuring Success Of Our Marketing Efforts Diagrams PDF
Purpose of the following slide is to display a dashboard to help analyze the marketing efforts through essential metrics such as the revenue generated, average revenue generated per unit etc. Deliver an awe inspiring pitch with this creative Organic Business Growth Strategies Dashboard For Measuring Success Of Our Marketing Efforts Diagrams PDF bundle. Topics like Average Revenue, Customer Lifetime Value, Customer Acquisition Cost can be discussed with this completely editable template. It is available for immediate download depending on the needs and requirements of the user.
Precooked Food Industry Analysis KPI Dashboard For Tracking Supply Chain Costs Diagrams PDF
This slide represents the KPI dashboard to track the multiple cost associated with supply chain in food manufacturing industry. It includes information regarding cash to cash cycle in days, carry cost of inventory along with details of net sales.Deliver an awe inspiring pitch with this creative Precooked Food Industry Analysis KPI Dashboard For Tracking Supply Chain Costs Diagrams PDF bundle. Topics like Processing Industry, Food Processing, Manufacturing Industry can be discussed with this completely editable template. It is available for immediate download depending on the needs and requirements of the user.
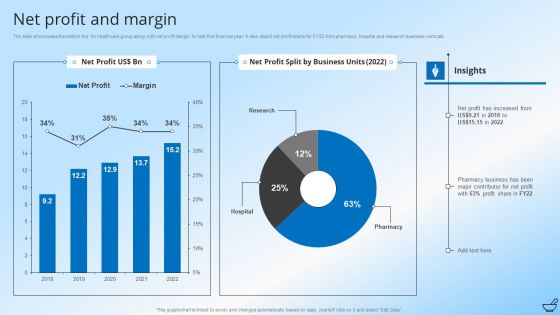
Pharmaceutical And Clinical Research Summary Net Profit And Margin Diagrams PDF
The slide showcases the bottom line for healthcare group along with net profit margin for last five financial year. It also depict net profit share for FY22 from pharmacy, hospital and research business verticals. Deliver an awe inspiring pitch with this creative Pharmaceutical And Clinical Research Summary Net Profit And Margin Diagrams PDF bundle. Topics like Pharmacy Business, Profit Share, Business Units can be discussed with this completely editable template. It is available for immediate download depending on the needs and requirements of the user.
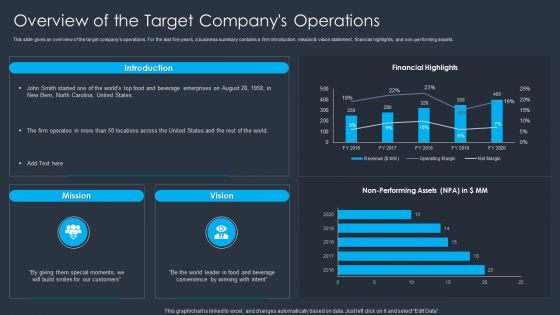
Merger And Acquisition Buying Strategy For Business Growth Overview Of The Target Companys Operations Diagrams PDF
This slide gives an overview of the target companys operations. For the last five years, a business summary contains a firm introduction, mission and vision statement, financial highlights, and non performing assets. Deliver and pitch your topic in the best possible manner with this Merger And Acquisition Buying Strategy For Business Growth Overview Of The Target Companys Operations Diagrams PDF. Use them to share invaluable insights on Customers, Financial Highlights, Enterprises and impress your audience. This template can be altered and modified as per your expectations. So, grab it now.
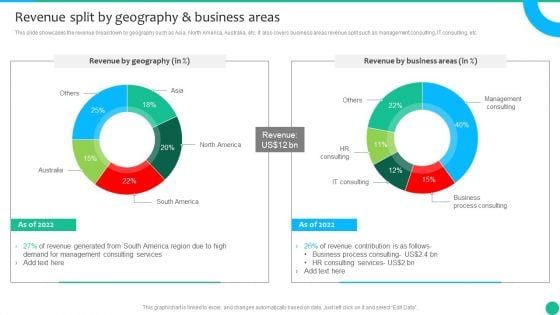
Strategic Management Consultancy Business Profile Revenue Split By Geography And Business Areas Diagrams PDF
This slide showcases the revenue breakdown by geography such as Asia, North America, Australia, etc. It also covers business areas revenue split such as management consulting, IT consulting, etc. Deliver and pitch your topic in the best possible manner with this Strategic Management Consultancy Business Profile Revenue Split By Geography And Business Areas Diagrams PDF. Use them to share invaluable insights on Demand For Management, Consulting Services, Revenue and impress your audience. This template can be altered and modified as per your expectations. So, grab it now.
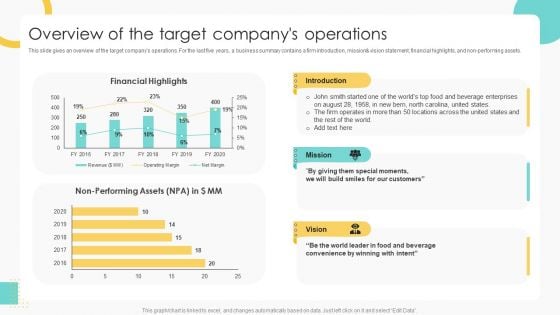
Buy Side Merger And Acquisition Pitch Book Overview Of The Target Companys Operations Diagrams PDF
This slide gives an overview of the target companys operations. For the last five years, a business summary contains a firm introduction, mission and vision statement, financial highlights, and non performing assets. Deliver and pitch your topic in the best possible manner with this Buy Side Merger And Acquisition Pitch Book Overview Of The Target Companys Operations Diagrams PDF. Use them to share invaluable insights on Financial Highlights, Enterprises, Customers and impress your audience. This template can be altered and modified as per your expectations. So, grab it now.
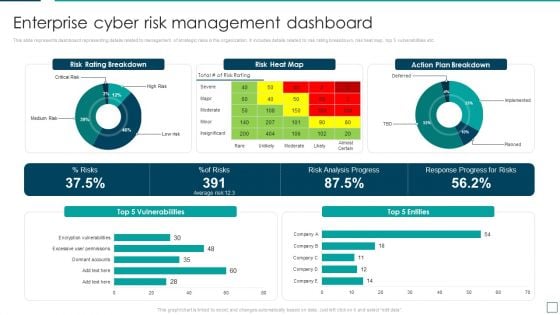
Strategic Risk Management And Mitigation Plan Enterprise Cyber Risk Management Dashboard Diagrams PDF
This slide represents dashboard representing details related to management of strategic risks in the organization. It includes details related to risk rating breakdown, risk heat map, top 5 vulnerabilities etc. From laying roadmaps to briefing everything in detail, our templates are perfect for you. You can set the stage with your presentation slides. All you have to do is download these easy to edit and customizable templates. Strategic Risk Management And Mitigation Plan Enterprise Cyber Risk Management Dashboard Diagrams PDF will help you deliver an outstanding performance that everyone would remember and praise you for. Do download this presentation today.
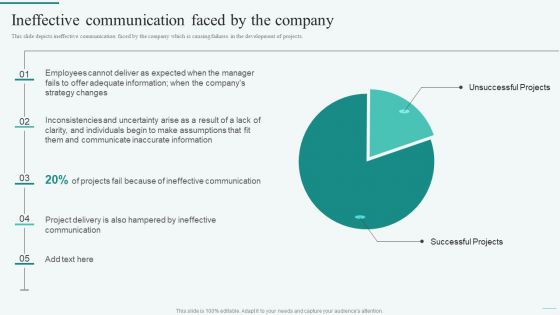
Ineffective Communication Faced By The Company Integration Of Dynamic System Diagrams PDF
This slide depicts ineffective communication faced by the company which is causing failures in the development of projects. The best PPT templates are a great way to save time, energy, and resources. Slidegeeks have 100 precent editable powerpoint slides making them incredibly versatile. With these quality presentation templates, you can create a captivating and memorable presentation by combining visually appealing slides and effectively communicating your message. Download Ineffective Communication Faced By The Company Integration Of Dynamic System Diagrams PDF from Slidegeeks and deliver a wonderful presentation.
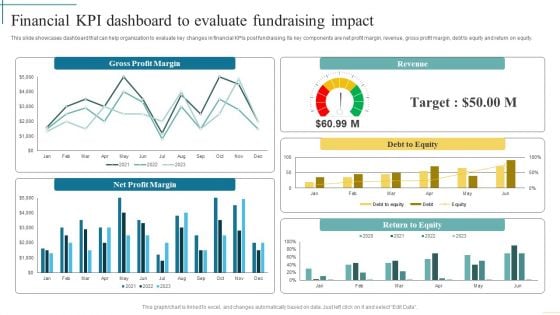
Financial Kpi Dashboard To Evaluate Fundraising Impact Developing Fundraising Techniques Diagrams PDF
This slide showcases dashboard that can help organization to evaluate key changes in financial KPIs post fundraising. Its key components are net profit margin, revenue, gross profit margin, debt to equity and return on equity. From laying roadmaps to briefing everything in detail, our templates are perfect for you. You can set the stage with your presentation slides. All you have to do is download these easy-to-edit and customizable templates. Financial Kpi Dashboard To Evaluate Fundraising Impact Developing Fundraising Techniques Diagrams PDF will help you deliver an outstanding performance that everyone would remember and praise you for. Do download this presentation today.
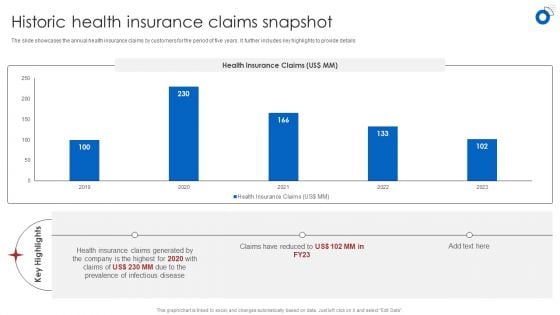
Insurance Business Financial Analysis Historic Health Insurance Claims Snapshot Diagrams PDF
The slide showcases the annual health insurance claims by customers for the period of five years. It further includes key highlights to provide details Boost your pitch with our creative Insurance Business Financial Analysis Historic Health Insurance Claims Snapshot Diagrams PDF. Deliver an awe-inspiring pitch that will mesmerize everyone. Using these presentation templates you will surely catch everyones attention. You can browse the ppts collection on our website. We have researchers who are experts at creating the right content for the templates. So you dont have to invest time in any additional work. Just grab the template now and use them.
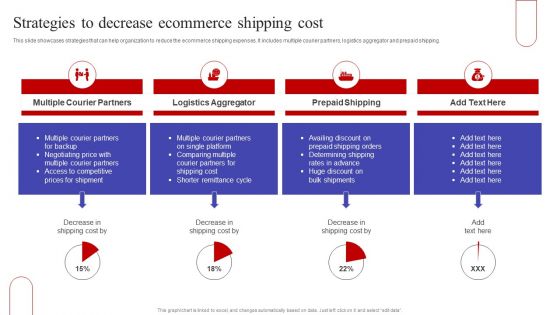
Strategies To Decrease Ecommerce Shipping Cost Ppt PowerPoint Presentation File Diagrams PDF
This slide showcases strategies that can help organization to reduce the ecommerce shipping expenses. It includes multiple courier partners, logistics aggregator and prepaid shipping. From laying roadmaps to briefing everything in detail, our templates are perfect for you. You can set the stage with your presentation slides. All you have to do is download these easy to edit and customizable templates. Strategies To Decrease Ecommerce Shipping Cost Ppt PowerPoint Presentation File Diagrams PDF will help you deliver an outstanding performance that everyone would remember and praise you for. Do download this presentation today.
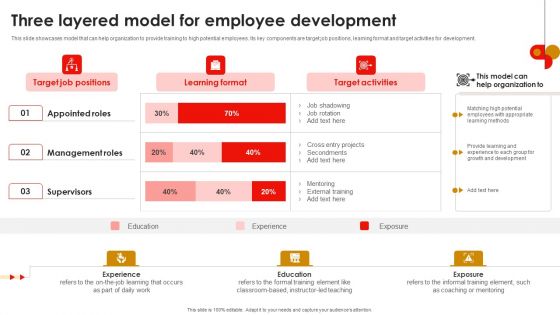
Strategic Talent Development Three Layered Model For Employee Development Diagrams PDF
This slide showcases model that can help organization to provide training to high potential employees. Its key components are target job positions, learning format and target activities for development. From laying roadmaps to briefing everything in detail, our templates are perfect for you. You can set the stage with your presentation slides. All you have to do is download these easy-to-edit and customizable templates. Strategic Talent Development Three Layered Model For Employee Development Diagrams PDF will help you deliver an outstanding performance that everyone would remember and praise you for. Do download this presentation today.
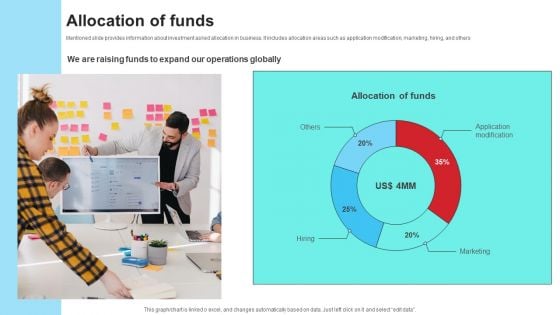
Community Engagement Platform Fundraising Pitch Deck Allocation Of Funds Diagrams PDF
Mentioned slide provides information about investment asked allocation in business. It includes allocation areas such as application modification, marketing, hiring, and others. Boost your pitch with our creative Community Engagement Platform Fundraising Pitch Deck Allocation Of Funds Diagrams PDF. Deliver an awe-inspiring pitch that will mesmerize everyone. Using these presentation templates you will surely catch everyones attention. You can browse the ppts collection on our website. We have researchers who are experts at creating the right content for the templates. So you do not have to invest time in any additional work. Just grab the template now and use them.
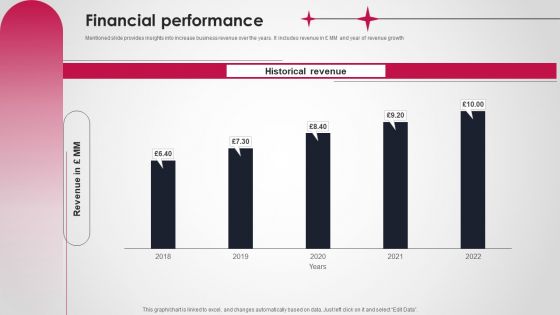
Logistics And Supply Chain Platform Funding Pitch Deck Financial Performance Diagrams PDF
Mentioned slide provides insights into increase business revenue over the years. It includes revenue in MM and year of revenue growth Boost your pitch with our creative Logistics And Supply Chain Platform Funding Pitch Deck Financial Performance Diagrams PDF. Deliver an awe-inspiring pitch that will mesmerize everyone. Using these presentation templates you will surely catch everyones attention. You can browse the ppts collection on our website. We have researchers who are experts at creating the right content for the templates. So you do not have to invest time in any additional work. Just grab the template now and use them.
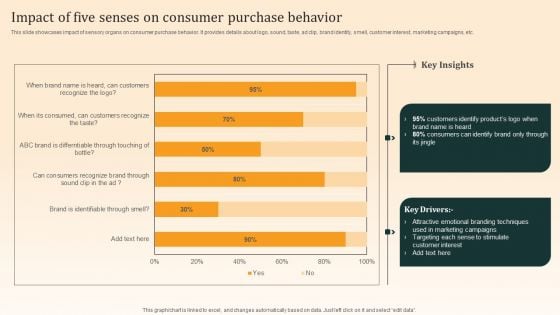
Nike Emotional Branding Strategy Impact Of Five Senses On Consumer Purchase Behavior Diagrams PDF
This slide showcases impact of sensory organs on consumer purchase behavior. It provides details about logo, sound, taste, ad clip, brand identity, smell, customer interest, marketing campaigns, etc. The best PPT templates are a great way to save time, energy, and resources. Slidegeeks have 100 percent editable powerpoint slides making them incredibly versatile. With these quality presentation templates, you can create a captivating and memorable presentation by combining visually appealing slides and effectively communicating your message. Download Nike Emotional Branding Strategy Impact Of Five Senses On Consumer Purchase Behavior Diagrams PDF from Slidegeeks and deliver a wonderful presentation.
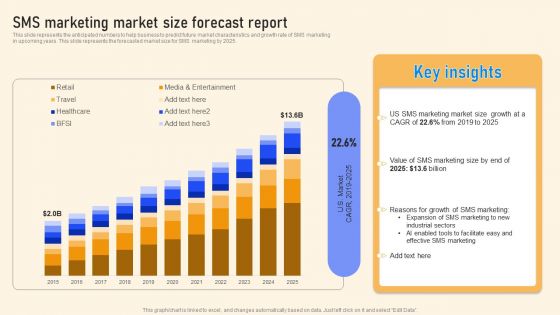
SMS Marketing Market Size Forecast Report Ppt PowerPoint Presentation File Diagrams PDF
This slide represents the anticipated numbers to help business to predict future market characteristics and growth rate of SMS marketing in upcoming years. This slide represents the forecasted market size for SMS marketing by 2025. From laying roadmaps to briefing everything in detail, our templates are perfect for you. You can set the stage with your presentation slides. All you have to do is download these easy to edit and customizable templates. SMS Marketing Market Size Forecast Report Ppt PowerPoint Presentation File Diagrams PDF will help you deliver an outstanding performance that everyone would remember and praise you for. Do download this presentation today.
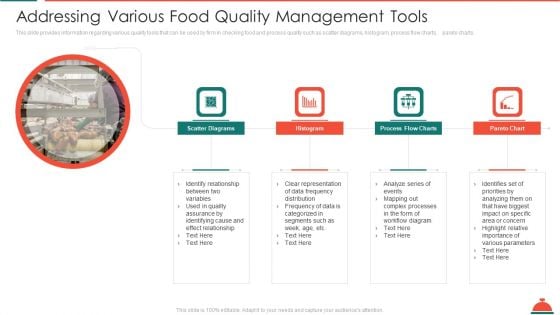
Addressing Various Food Quality Management Tools Increased Superiority For Food Products Graphics PDF
This slide provides information regarding various quality tools that can be used by firm in checking food and process quality such as scatter diagrams, histogram, process flow charts, pareto charts. This is a addressing various food quality management tools increased superiority for food products graphics pdf template with various stages. Focus and dispense information on four stages using this creative set, that comes with editable features. It contains large content boxes to add your information on topics like scatter diagrams, histogram, process flow charts, pareto chart. You can also showcase facts, figures, and other relevant content using this PPT layout. Grab it now.
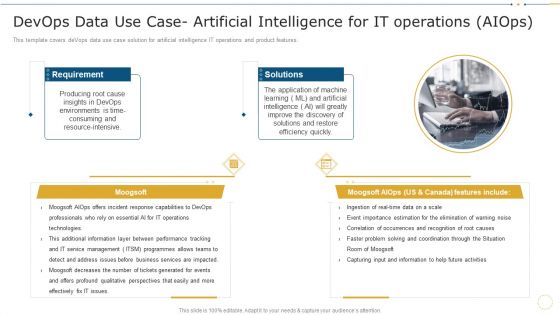
Devops Data Use Case Artificial Intelligence For IT Operations Aiops Themes PDF
This template covers deVops data use case solution for artificial intelligence IT operations and product features. This is a devops data use case artificial intelligence for it operations aiops themes pdf template with various stages. Focus and dispense information on two stages using this creative set, that comes with editable features. It contains large content boxes to add your information on topics like environments, application, information, performance, service. You can also showcase facts, figures, and other relevant content using this PPT layout. Grab it now.
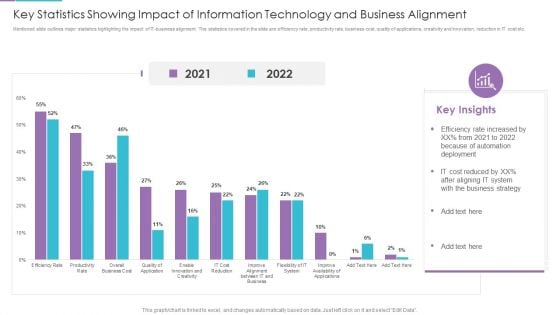
Key Statistics Showing Impact Of Information Technology And Business Alignment Diagrams PDF
Mentioned slide outlines major statistics highlighting the impact of IT business alignment. The statistics covered in the slide are efficiency rate, productivity rate, business cost, quality of applications, creativity and innovation, reduction in IT cost etc. Showcasing this set of slides titled key statistics showing impact of information technology and business alignment diagrams pdf. The topics addressed in these templates are reduced, system, business strategy. All the content presented in this PPT design is completely editable. Download it and make adjustments in color, background, font etc. as per your unique business setting.
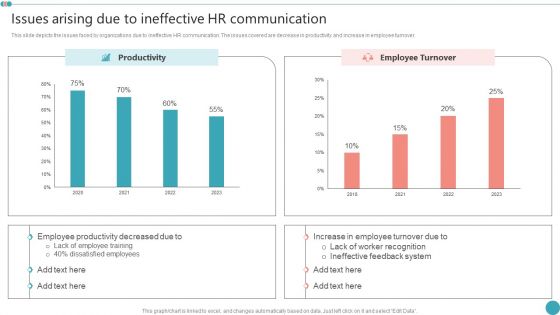
Issues Arising Due To Ineffective HR Communication Employee Engagement HR Strategy At Organization Diagrams PDF
This slide depicts the issues faced by organizations due to ineffective HR communication. The issues covered are decrease in productivity and increase in employee turnover.Want to ace your presentation in front of a live audience Our Issues Arising Due To Ineffective HR Communication Employee Engagement HR Strategy At Organization Diagrams PDF can help you do that by engaging all the users towards you.. Slidegeeks experts have put their efforts and expertise into creating these impeccable powerpoint presentations so that you can communicate your ideas clearly. Moreover, all the templates are customizable, and easy-to-edit and downloadable. Use these for both personal and commercial use.
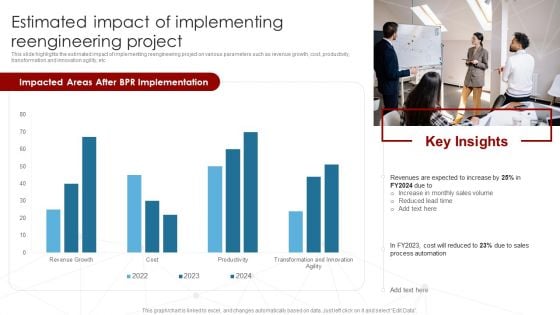
Deployment Of Business Process Estimated Impact Of Implementing Reengineering Diagrams PDF
This slide highlights the estimated impact of implementing reengineering project on various parameters such as revenue growth, cost, productivity, transformation and innovation agility, etc. Present like a pro with Deployment Of Business Process Estimated Impact Of Implementing Reengineering Diagrams PDF Create beautiful presentations together with your team, using our easy-to-use presentation slides. Share your ideas in real-time and make changes on the fly by downloading our templates. So whether youre in the office, on the go, or in a remote location, you can stay in sync with your team and present your ideas with confidence. With Slidegeeks presentation got a whole lot easier. Grab these presentations today.
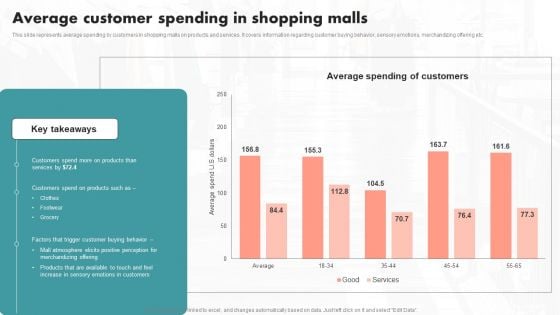
Average Customer Spending In Shopping Malls Ppt PowerPoint Presentation Diagram Images PDF
This slide represents average spending by customers in shopping malls on products and services. It covers information regarding customer buying behavior, sensory emotions, merchandizing offering etc. qIf your project calls for a presentation, then Slidegeeks is your go to partner because we have professionally designed, easy to edit templates that are perfect for any presentation. After downloading, you can easily edit Average Customer Spending In Shopping Malls Ppt PowerPoint Presentation Diagram Images PDF and make the changes accordingly. You can rearrange slides or fill them with different images. Check out all the handy templates
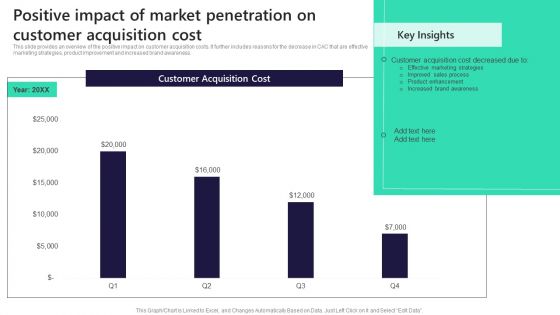
Positive Impact Of Market Penetration On Customer Acquisition Cost Diagrams PDF
This slide provides an overview of the positive impact on customer acquisition costs. It further includes reasons for the decrease in CAC that are effective marketing strategies, product improvement and increased brand awareness. There are so many reasons you need a Positive Impact Of Market Penetration On Customer Acquisition Cost Diagrams PDF. The first reason is you can not spend time making everything from scratch, Thus, Slidegeeks has made presentation templates for you too. You can easily download these templates from our website easily.
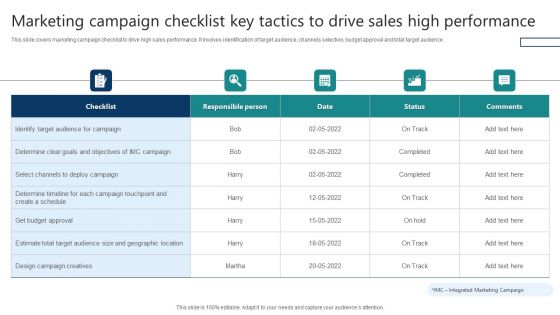
Marketing Campaign Checklist Key Tactics To Drive Sales High Performance Themes PDF
This slide covers marketing campaign checklist to drive high sales performance. It involves identification of target audience, channels selection, budget approval and total target audience. Showcasing this set of slides titled Marketing Campaign Checklist Key Tactics To Drive Sales High Performance Themes PDF. The topics addressed in these templates are Responsible Person, Checklist, Goals And Objectives. All the content presented in this PPT design is completely editable. Download it and make adjustments in color, background, font etc. as per your unique business setting.
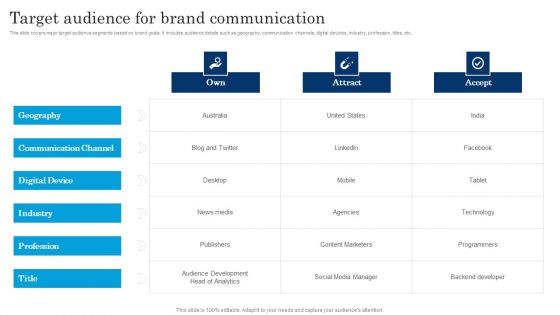
Target Audience For Brand Communication Executing Brand Communication Strategy Themes PDF
This slide covers major target audience segments based on brand goals. It includes audience details such as geography, communication channels, digital devices, industry, profession, titles, etc. There are so many reasons you need a Target Audience For Brand Communication Executing Brand Communication Strategy Themes PDF. The first reason is you can not spend time making everything from scratch, Thus, Slidegeeks has made presentation templates for you too. You can easily download these templates from our website easily.
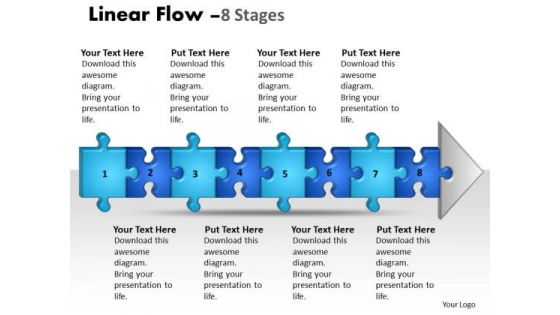
Strategy Ppt Background Linear Flow 8 Stages Style1 Project Management PowerPoint Graphic
We present our strategy PPT Background linear flow 8 stages style1 project management PowerPoint Graphic. Use our Arrows PowerPoint Templates because, the basic stages are in place, you need to build upon them with our PowerPoint templates. Use our Business PowerPoint Templates because, Puzzles or Jigsaw Template: - It is all there in bits and pieces. Use our Puzzles or jigsaws PowerPoint Templates because, the core of any organization is the people who work for it. Use our Technology PowerPoint Templates because, you have the basic goal in mind. Use our Process and flows PowerPoint Templates because, you have the product you are very confident of and are very sure it will proveimmensely popular with clients all over your target areas. Use these PowerPoint slides for presentations relating to Algorithm, arrow, arrow chart, business, chart, color, connection, development, diagram, direction, flow chart, flow diagram, flowchart, kind of diagram, linear, linear diagram, management, motion, organization, plan, process, process arrows, process chart, process diagram, process flow, program, sign, solution, strategy, symbol, technology. The prominent colors used in the PowerPoint template are Gray, Blue, and Blue navy Find the means with our Strategy Ppt Background Linear Flow 8 Stages Style1 Project Management PowerPoint Graphic. They will soon be an automatic choice.
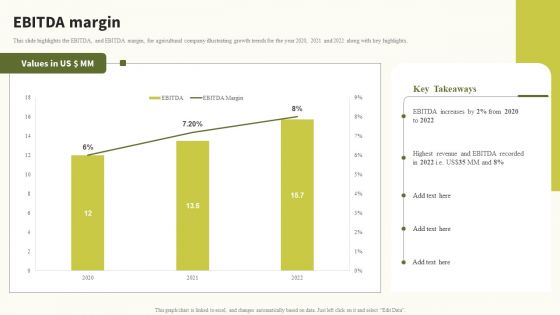
Ebitda Margin Global Food Products Company Profile Slides PDF
This slide highlights the EBITDA, and EBITDA margin, for agricultural company illustrating growth trends for the year 2020, 2021 and 2022 along with key highlights.Presenting this PowerPoint presentation, titled Ebitda Margin Global Food Products Company Profile Slides PDF, with topics curated by our researchers after extensive research. This editable presentation is available for immediate download and provides attractive features when used. Download now and captivate your audience. Presenting this Ebitda Margin Global Food Products Company Profile Slides PDF. Our researchers have carefully researched and created these slides with all aspects taken into consideration. This is a completely customizable Ebitda Margin Global Food Products Company Profile Slides PDF that is available for immediate downloading. Download now and make an impact on your audience. Highlight the attractive features available with our PPTs.
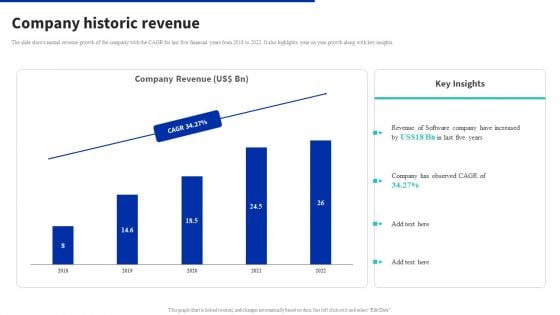
Digital Products Company Outline Company Historic Revenue Graphics PDF
The slide shows annual revenue growth of the company with the CAGR for last five financial years from 2018 to 2022. It also highlights year on year growth along with key insights. Presenting this PowerPoint presentation, titled Digital Products Company Outline Company Historic Revenue Graphics PDF, with topics curated by our researchers after extensive research. This editable presentation is available for immediate download and provides attractive features when used. Download now and captivate your audience. Presenting this Digital Products Company Outline Company Historic Revenue Graphics PDF. Our researchers have carefully researched and created these slides with all aspects taken into consideration. This is a completely customizable Digital Products Company Outline Company Historic Revenue Graphics PDF that is available for immediate downloading. Download now and make an impact on your audience. Highlight the attractive features available with our PPTs.
Product And Customer Performance Tracking Dashboard Portrait PDF
This slide provides information regarding dashboard utilized by firm to monitor performance of products offered and customer associated. The performance is tracked through revenues generated, new customer acquired, customer satisfaction, sales comparison, etc. Do you have an important presentation coming up Are you looking for something that will make your presentation stand out from the rest Look no further than Product And Customer Performance Tracking Dashboard Portrait PDF. With our professional designs, you can trust that your presentation will pop and make delivering it a smooth process. And with Slidegeeks, you can trust that your presentation will be unique and memorable. So why wait Grab Product And Customer Performance Tracking Dashboard Portrait PDF today and make your presentation stand out from the rest.
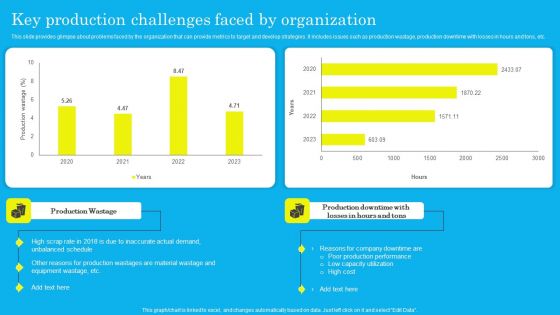
Key Production Challenges Faced By Organization Microsoft PDF
This slide provides glimpse about problems faced by the organization that can provide metrics to target and develop strategies. It includes issues such as production wastage, production downtime with losses in hours and tons, etc. This Key Production Challenges Faced By Organization Microsoft PDF from Slidegeeks makes it easy to present information on your topic with precision. It provides customization options, so you can make changes to the colors, design, graphics, or any other component to create a unique layout. It is also available for immediate download, so you can begin using it right away. Slidegeeks has done good research to ensure that you have everything you need to make your presentation stand out. Make a name out there for a brilliant performance.
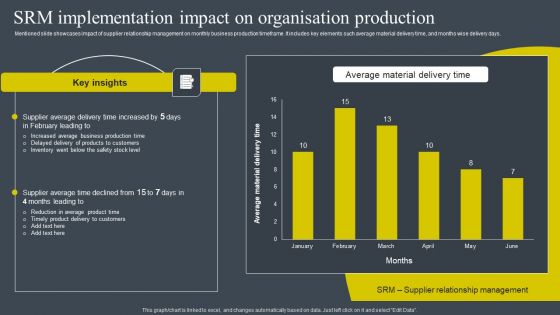
SRM Implementation Impact On Organisation Production Information PDF
Mentioned slide showcases impact of supplier relationship management on monthly business production timeframe. It includes key elements such average material delivery time, and months wise delivery days. Do you have an important presentation coming up Are you looking for something that will make your presentation stand out from the rest Look no further than SRM Implementation Impact On Organisation Production Information PDF. With our professional designs, you can trust that your presentation will pop and make delivering it a smooth process. And with Slidegeeks, you can trust that your presentation will be unique and memorable. So why wait Grab SRM Implementation Impact On Organisation Production Information PDF today and make your presentation stand out from the rest
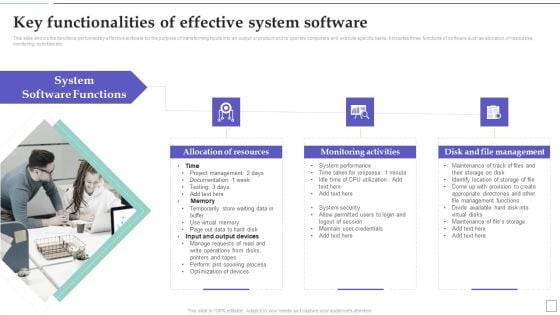
System Deployment Project Key Functionalities Of Effective System Software Themes PDF
This slide shows the functions performed by effective software for the purpose of transforming inputs into an output or product and to operate computers and execute specific tasks. It includes three functions of software such as allocation of resources, monitoring activities etc. Formulating a presentation can take up a lot of effort and time, so the content and message should always be the primary focus. The visuals of the PowerPoint can enhance the presenters message, so our System Deployment Project Key Functionalities Of Effective System Software Themes PDF was created to help save time. Instead of worrying about the design, the presenter can concentrate on the message while our designers work on creating the ideal templates for whatever situation is needed. Slidegeeks has experts for everything from amazing designs to valuable content, we have put everything into System Deployment Project Key Functionalities Of Effective System Software Themes PDF
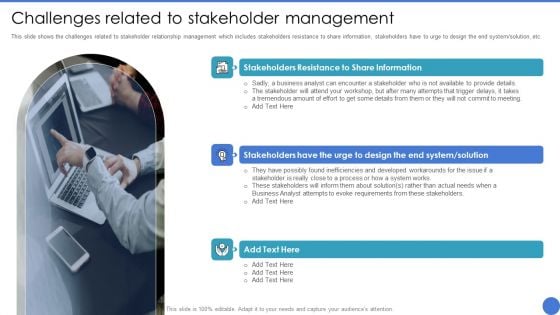
Managing Stakeholder Relationship Challenges Related To Stakeholder Management Diagrams PDF
This slide shows the challenges related to stakeholder relationship management which includes stakeholders resistance to share information, stakeholders have to urge to design the end system solution, etc.Retrieve professionally designed Managing Stakeholder Relationship Challenges Related To Stakeholder Management Diagrams PDF to effectively convey your message and captivate your listeners. Save time by selecting pre made slideshows that are appropriate for various topics, from business to educational purposes. These themes come in many different styles, from creative to corporate, and all of them are easily adjustable and can be edited quickly. Access them as PowerPoint templates or as Google Slides themes. You dont have to go on a hunt for the perfect presentation because Slidegeeks got you covered from everywhere.

Marketing And Operations Dashboard To Drive Effective Productivity Background PDF
This slide covers sales and operations dashboard to drive effective productivity. It involves details such as number of account assigned, working accounts, engaged accounts and total account activity. Pitch your topic with ease and precision using this Marketing And Operations Dashboard To Drive Effective Productivity Background PDF. This layout presents information on Total Account Activity, Number Of Working Account, Engaged Account. It is also available for immediate download and adjustment. So, changes can be made in the color, design, graphics or any other component to create a unique layout.
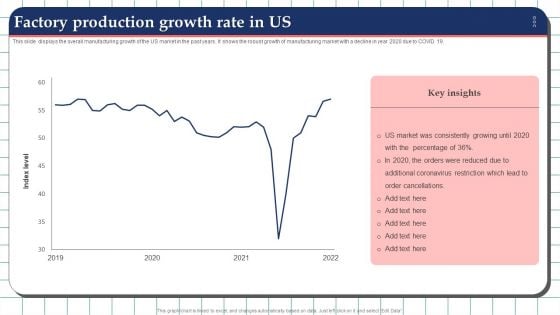
Factory Production Growth Rate In Us Graphics PDF
This slide displays the overall manufacturing growth of the US market in the past years. It shows the robust growth of manufacturing market with a decline in year 2020 due to COVID 19. Showcasing this set of slides titled Factory Production Growth Rate In Us Graphics PDF. The topics addressed in these templates are Factory Production Growth Rate, Market. All the content presented in this PPT design is completely editable. Download it and make adjustments in color, background, font etc. as per your unique business setting.
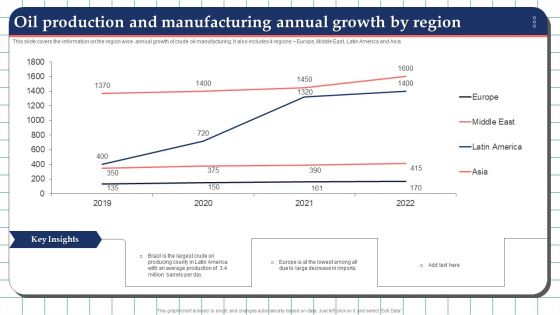
Oil Production And Manufacturing Annual Growth By Region Graphics PDF
This slide covers the information on the region wise. annual growth of crude oil manufacturing. It also includes 4 regions Europe, Middle East, Latin America and Asia. Pitch your topic with ease and precision using this Oil Production And Manufacturing Annual Growth By Region Graphics PDF. This layout presents information on Average Production, Manufacturing Annual Growth. It is also available for immediate download and adjustment. So, changes can be made in the color, design, graphics or any other component to create a unique layout.
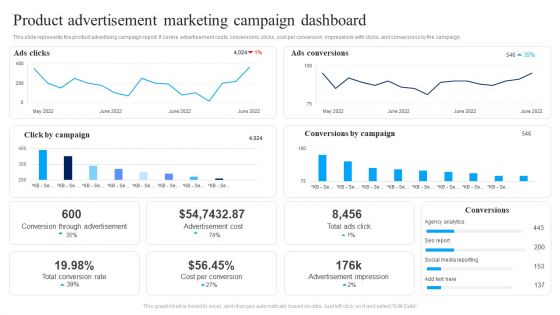
Product Advertisement Marketing Campaign Dashboard Ppt Infographic Template Show PDF
This slide represents the product advertising campaign report. It covers advertisement costs, conversions, clicks, cost per conversion, impressions with clicks, and conversions by the campaign. Showcasing this set of slides titled Product Advertisement Marketing Campaign Dashboard Ppt Infographic Template Show PDF. The topics addressed in these templates are Ads Clicks, Ads Conversions, Conversion Through Advertisement, Advertisement Cost. All the content presented in this PPT design is completely editable. Download it and make adjustments in color, background, font etc. as per your unique business setting.
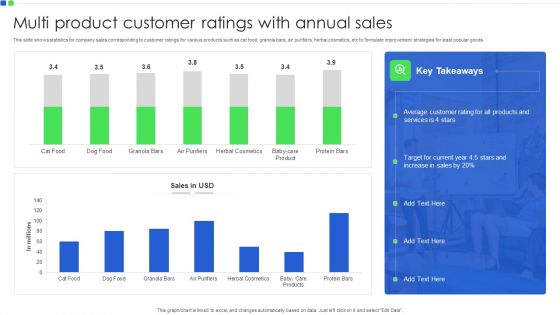
Multi Product Customer Ratings With Annual Sales Infographics PDF
This slide shows statistics for company sales corresponding to customer ratings for various products such as cat food, granola bars, air purifiers, herbal cosmetics, etc to formulate improvement strategies for least popular goods. Showcasing this set of slides titled Multi Product Customer Ratings With Annual Sales Infographics PDF. The topics addressed in these templates are Target For Current Year, Average Customer Rating. All the content presented in this PPT design is completely editable. Download it and make adjustments in color, background, font etc. as per your unique business setting.

Inventory Management Summary By Production Team Summary Designs PDF
This slide shows the dashboard representing the analysis of the inventory management report prepared by the production team manager. It includes information related to total no. of sales, inventory, suppliers, accounts payable etc. Pitch your topic with ease and precision using this Inventory Management Summary By Production Team Summary Designs PDF. This layout presents information on Days Inventory Outstanding, Inventory Value By Item. It is also available for immediate download and adjustment. So, changes can be made in the color, design, graphics or any other component to create a unique layout.
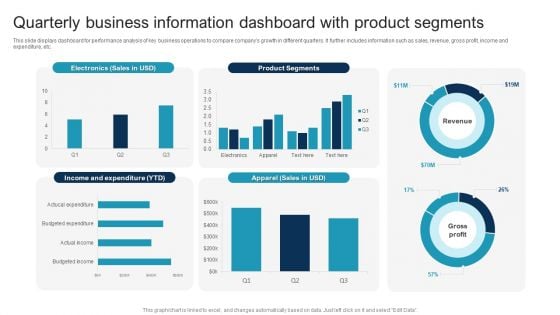
Quarterly Business Information Dashboard With Product Segments Slides PDF
This slide displays dashboard for performance analysis of key business operations to compare companys growth in different quarters. It further includes information such as sales, revenue, gross profit, income and expenditure, etc. Showcasing this set of slides titled Quarterly Business Information Dashboard With Product Segments Slides PDF. The topics addressed in these templates are Quarterly Business Information, Dashboard With Product Segments. All the content presented in this PPT design is completely editable. Download it and make adjustments in color, background, font etc. as per your unique business setting.
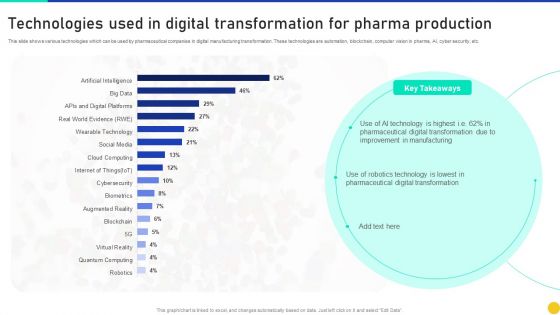
Technologies Used In Digital Transformation For Pharma Production Information PDF
This slide shows various technologies which can be used by pharmaceutical companies in digital manufacturing transformation. These technologies are automation, blockchain, computer vision in pharma, AI, cyber security, etc. Showcasing this set of slides titled Technologies Used In Digital Transformation For Pharma Production Information PDF. The topics addressed in these templates are Technologies Used Digital Transformation, Pharma Production. All the content presented in this PPT design is completely editable. Download it and make adjustments in color, background, font etc. as per your unique business setting.
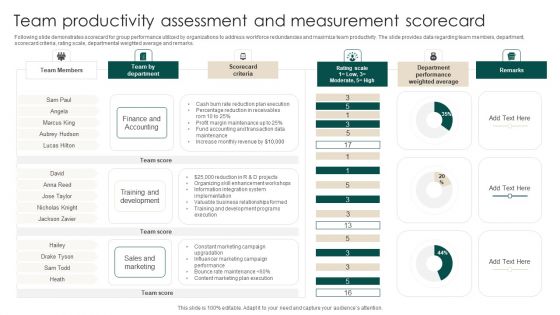
Team Productivity Assessment And Measurement Scorecard Introduction PDF
Following slide demonstrates scorecard for group performance utilized by organizations to address workforce redundancies and maximize team productivity. The slide provides data regarding team members, department, scorecard criteria, rating scale, departmental weighted average and remarks. Showcasing this set of slides titled Team Productivity Assessment And Measurement Scorecard Introduction PDF. The topics addressed in these templates are Finance And Accounting, Training And Development. All the content presented in this PPT design is completely editable. Download it and make adjustments in color, background, font etc. as per your unique business setting.
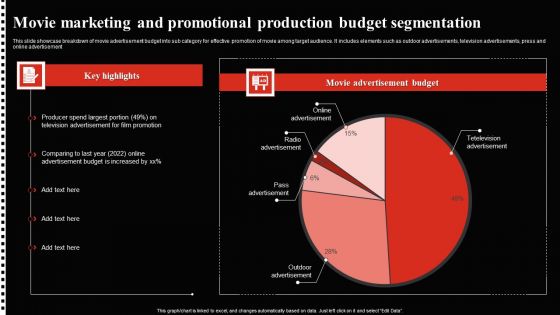
Movie Marketing And Promotional Production Budget Segmentation Topics PDF
This slide showcase breakdown of movie advertisement budget into sub category for effective promotion of movie among target audience. It includes elements such as outdoor advertisements, television advertisements, press and online advertisement. Showcasing this set of slides titled Movie Marketing And Promotional Production Budget Segmentation Topics PDF. The topics addressed in these templates are Movie Marketing Promotional, Production Budget Segmentation. All the content presented in this PPT design is completely editable. Download it and make adjustments in color, background, font etc. as per your unique business setting.
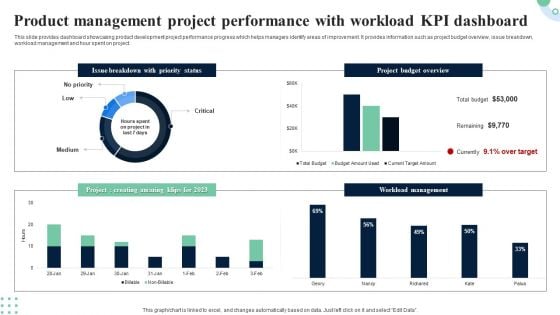
Product Management Project Performance With Workload KPI Dashboard Structure PDF
This slide provides dashboard showcasing product development project performance progress which helps managers identify areas of improvement. It provides information such as project budget overview, issue breakdown, workload management and hour spent on project. Pitch your topic with ease and precision using this Product Management Project Performance With Workload KPI Dashboard Structure PDF. This layout presents information on Project Budget Overview, Workload Management. It is also available for immediate download and adjustment. So, changes can be made in the color, design, graphics or any other component to create a unique layout.
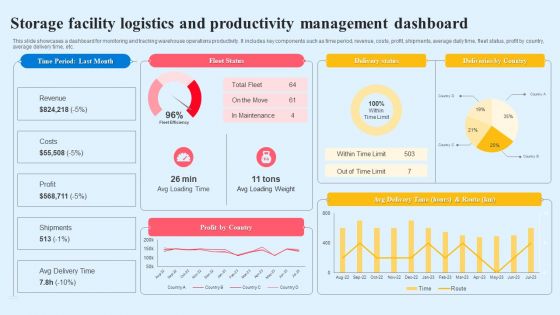
Storage Facility Logistics And Productivity Management Dashboard Summary PDF
This slide showcases a dashboard for monitoring and tracking warehouse operations productivity. It includes key components such as time period, revenue, costs, profit, shipments, average daily time, fleet status, profit by country, average delivery time, etc. Showcasing this set of slides titled Storage Facility Logistics And Productivity Management Dashboard Summary PDF. The topics addressed in these templates are Fleet Status, Delivery Status, Deliveries By Country. All the content presented in this PPT design is completely editable. Download it and make adjustments in color, background, font etc. as per your unique business setting.
Storage Facility Productivity Tracking KPI Dashboard Graphics PDF
This slide showcases a dashboard for tracking and managing warehouse productivity to optimize logistics operations. It includes key components such as warehouse operating costs, perfect order rate, total shipments by country and on time shipments. Showcasing this set of slides titled Storage Facility Productivity Tracking KPI Dashboard Graphics PDF. The topics addressed in these templates are Warehouse Operating Costs, Perfect Order Rate, Total Shipment Country. All the content presented in this PPT design is completely editable. Download it and make adjustments in color, background, font etc. as per your unique business setting.

Tactics To Launch New Product Communication Pictures PDF
Following slide demonstrates communication strategies used by managers to launch new product in different market. It includes strategies such as social media marketing, sales promotion, email marketing, press release, public relations, pay per click, direct mail, digital display, etc. Showcasing this set of slides titled Tactics To Launch New Product Communication Pictures PDF. The topics addressed in these templates are Communication Strategies, Social Media, Market Growth. All the content presented in this PPT design is completely editable. Download it and make adjustments in color, background, font etc. as per your unique business setting.
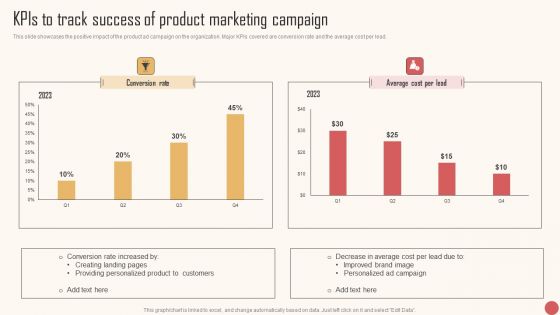
Kpis To Track Success Of Product Marketing Campaign Guidelines PDF
This slide showcases the positive impact of the product ad campaign on the organization. Major KPIs covered are conversion rate and the average cost per lead. Slidegeeks is one of the best resources for PowerPoint templates. You can download easily and regulate Kpis To Track Success Of Product Marketing Campaign Guidelines PDF for your personal presentations from our wonderful collection. A few clicks is all it takes to discover and get the most relevant and appropriate templates. Use our Templates to add a unique zing and appeal to your presentation and meetings. All the slides are easy to edit and you can use them even for advertisement purposes.
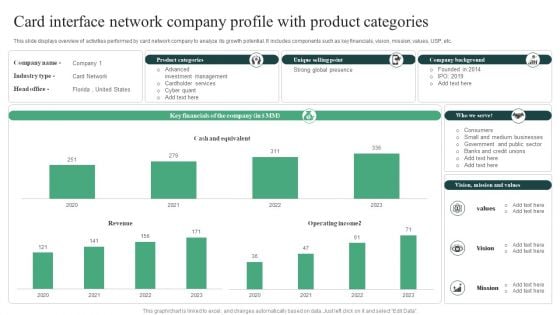
Card Interface Network Company Profile With Product Categories Pictures PDF
This slide displays overview of activities performed by card network company to analyze its growth potential. It includes components such as key financials, vision, mission, values, USP, etc. Showcasing this set of slides titled Card Interface Network Company Profile With Product Categories Pictures PDF. The topics addressed in these templates are Company Background, Unique Selling Point, Product Categories . All the content presented in this PPT design is completely editable. Download it and make adjustments in color, background, font etc. as per your unique business setting.
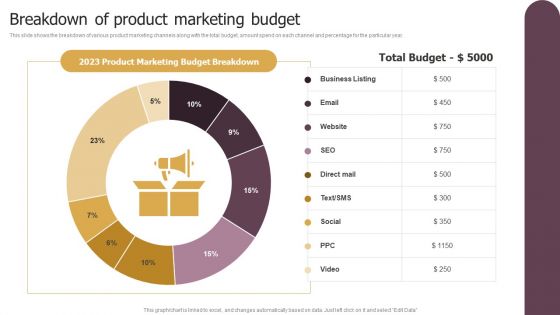
Breakdown Of Product Marketing Budget Ppt Guidelines PDF
This slide shows the breakdown of various product marketing channels along with the total budget, amount spend on each channel and percentage for the particular year. Slidegeeks is one of the best resources for PowerPoint templates. You can download easily and regulate Breakdown Of Product Marketing Budget Ppt Guidelines PDF for your personal presentations from our wonderful collection. A few clicks is all it takes to discover and get the most relevant and appropriate templates. Use our Templates to add a unique zing and appeal to your presentation and meetings. All the slides are easy to edit and you can use them even for advertisement purposes.
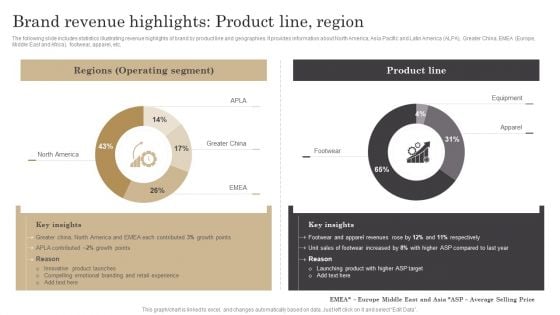
Brand Revenue Highlights Product Line Region Ppt Slides Guide PDF
The following slide includes statistics illustrating revenue highlights of brand by product line and geographies. It provides information about North America, Asia Pacific and Latin America ALPA, Greater China, EMEA Europe, Middle East and Africa, footwear, apparel, etc. Make sure to capture your audiences attention in your business displays with our gratis customizable Brand Revenue Highlights Product Line Region Ppt Slides Guide PDF. These are great for business strategies, office conferences, capital raising or task suggestions. If you desire to acquire more customers for your tech business and ensure they stay satisfied, create your own sales presentation with these plain slides.
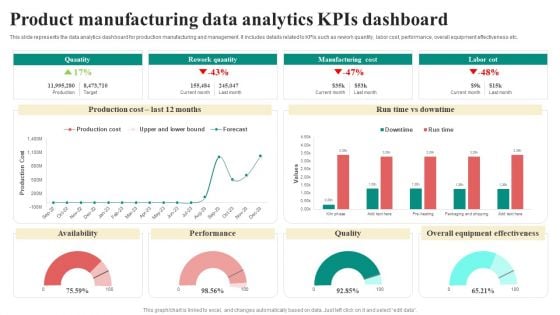
Product Manufacturing Data Analytics Kpis Dashboard Guidelines PDF
This slide represents the data analytics dashboard for production manufacturing and management. It includes details related to KPIs such as rework quantity, labor cost, performance, overall equipment effectiveness etc. Showcasing this set of slides titled Product Manufacturing Data Analytics Kpis Dashboard Guidelines PDF. The topics addressed in these templates are Quantity, Rework Quantity, Manufacturing Cost, Labor Cot. All the content presented in this PPT design is completely editable. Download it and make adjustments in color, background, font etc. as per your unique business setting.
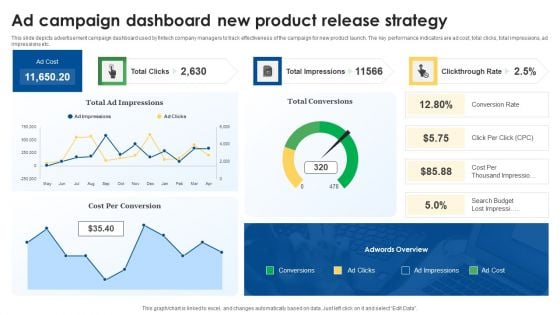
Ad Campaign Dashboard New Product Release Strategy Guidelines PDF
This slide depicts advertisement campaign dashboard used by fintech company managers to track effectiveness of the campaign for new product launch. The key performance indicators are ad cost, total clicks, total impressions, ad impressions etc. Pitch your topic with ease and precision using this Ad Campaign Dashboard New Product Release Strategy Guidelines PDF. This layout presents information on Impressions, Conversion, Strategy. It is also available for immediate download and adjustment. So, changes can be made in the color, design, graphics or any other component to create a unique layout.

 Home
Home