Icon Revenue
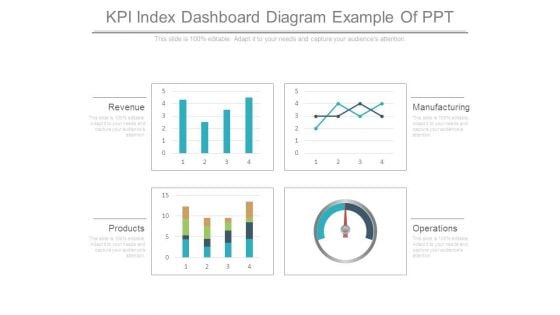
Kpi Index Dashboard Diagram Example Of Ppt
This is a kpi index dashboard diagram example of ppt. This is a four stage process. The stages in this process are revenue, products, operations, manufacturing.
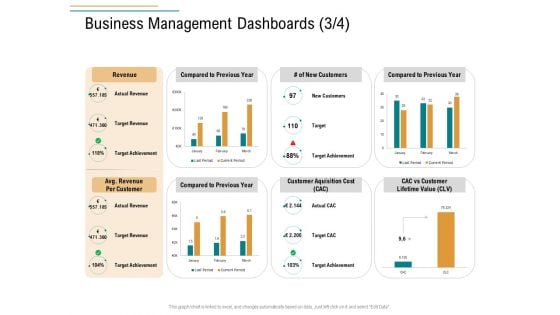
Business Operations Assessment Business Management Dashboards Customers Ppt Outline Designs Download PDF
Deliver and pitch your topic in the best possible manner with this business operations assessment business management dashboards customers ppt outline designs download pdf. Use them to share invaluable insights on actual revenue, target revenue, revenue, compared to previous year, new customers, compared to previous year, compared to previous year your audience. This template can be altered and modified as per your expectations. So, grab it now.
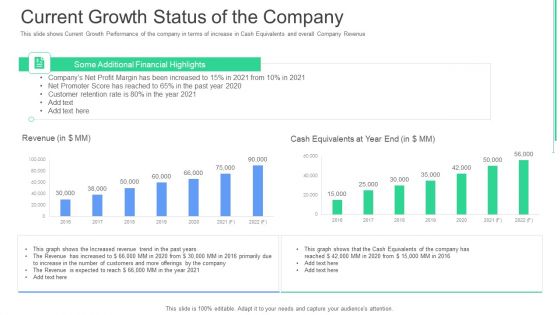
Current Growth Status Of The Company Ppt Ideas Design Templates PDF
This slide shows Current Growth Performance of the company in terms of increase in Cash Equivalents and overall Company Revenue. Deliver and pitch your topic in the best possible manner with this current growth status of the company ppt ideas design templates pdf. Use them to share invaluable insights on revenue, customers, revenue, cash equivalents at year end and impress your audience. This template can be altered and modified as per your expectations. So, grab it now.
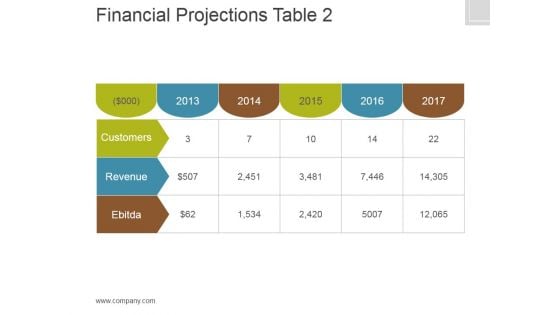
Financial Projections Table 2 Ppt PowerPoint Presentation Guidelines
This is a financial projections table 2 ppt powerpoint presentation guidelines. This is a five stage process. The stages in this process are financial projections, ebitda, revenue, net.
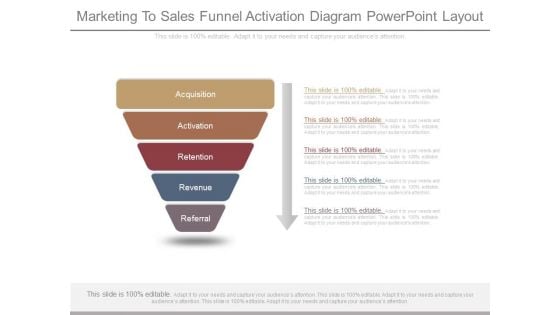
Marketing To Sales Funnel Activation Diagram Powerpoint Layout
This is a marketing to sales funnel activation diagram powerpoint layout. This is a five stage process. The stages in this process are acquisition, activation, retention, revenue, referral.
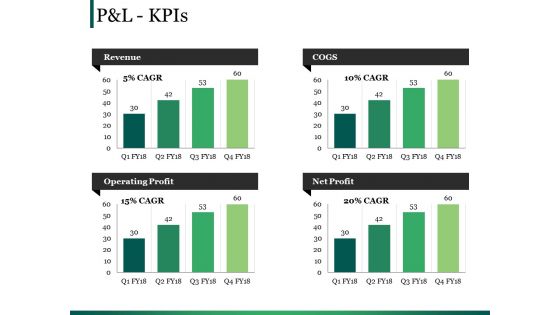
Pandl Kpis Ppt PowerPoint Presentation Outline Gallery
This is a pandl kpis ppt powerpoint presentation outline gallery. This is a four stage process. The stages in this process are revenue, cogs, operating profit, net profit.
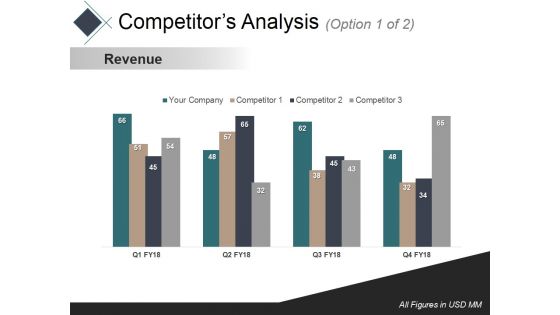
Competitors Analysis 1 Ppt PowerPoint Presentation Outline Templates
This is a competitors analysis 1 ppt powerpoint presentation outline templates. This is a four stage process. The stages in this process are revenue, business, marketing, bar, success.
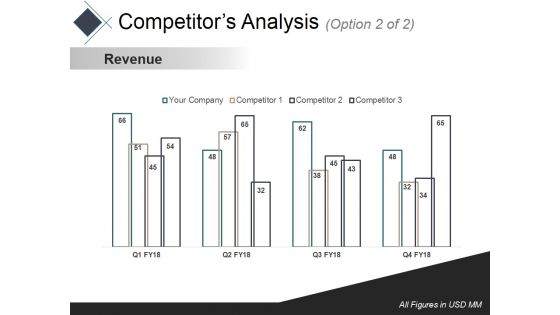
Competitors Analysis 2 Ppt PowerPoint Presentation Slides Gallery
This is a competitors analysis 2 ppt powerpoint presentation slides gallery. This is a four stage process. The stages in this process are revenue, business, marketing, bar, success.
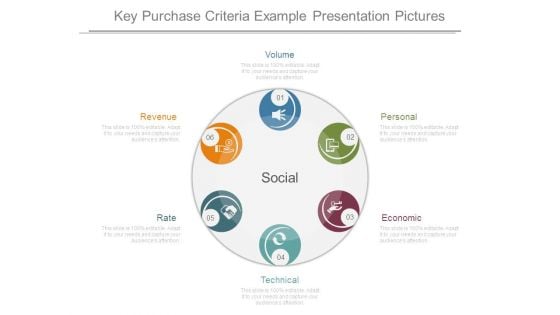
Key Purchase Criteria Example Presentation Pictures
This is a key purchase criteria example presentation pictures. This is a six stage process. The stages in this process are volume, revenue, rate, technical, personal, economic, social.
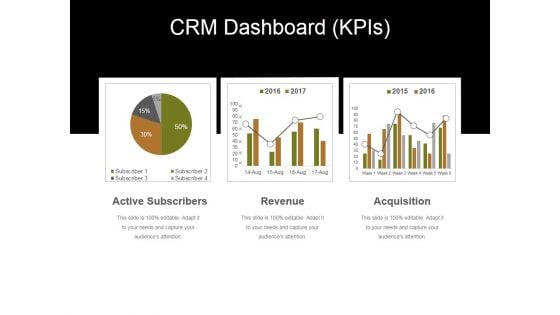
Crm Dashboard Kpis Ppt PowerPoint Presentation Infographic Template Designs
This is a crm dashboard kpis ppt powerpoint presentation infographic template designs. This is a three stage process. The stages in this process are active subscribers, acquisition, revenue.
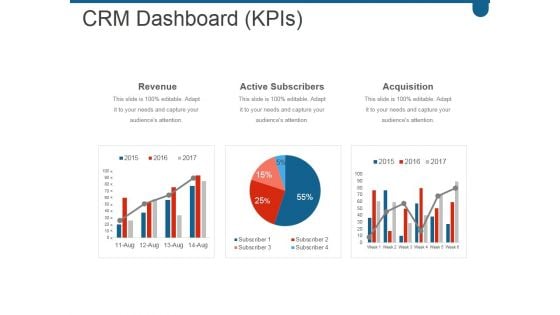
Crm Dashboard Kpis Ppt PowerPoint Presentation Layouts
This is a crm dashboard kpis ppt powerpoint presentation layouts. This is a three stage process. The stages in this process are revenue, active subscribers, acquisition.
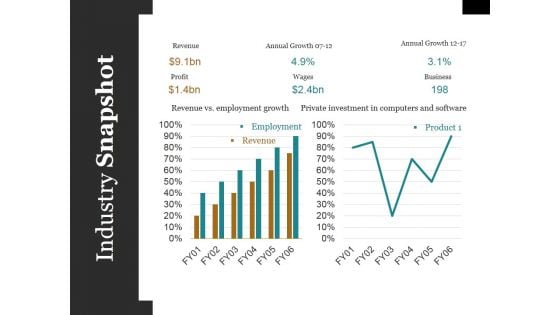
Industry Snapshot Ppt PowerPoint Presentation Styles Microsoft
This is a industry snapshot ppt powerpoint presentation styles microsoft. This is a two stage process. The stages in this process are employment, revenue, bar, marketing, success.
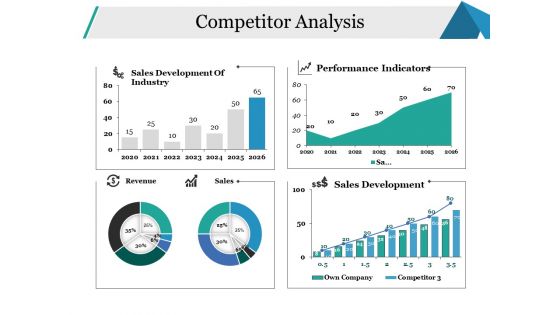
Competitor Analysis Ppt PowerPoint Presentation Infographic Template Elements
This is a competitor analysis ppt powerpoint presentation infographic template elements. This is a four stage process. The stages in this process are revenue, sales, business, marketing, finance.
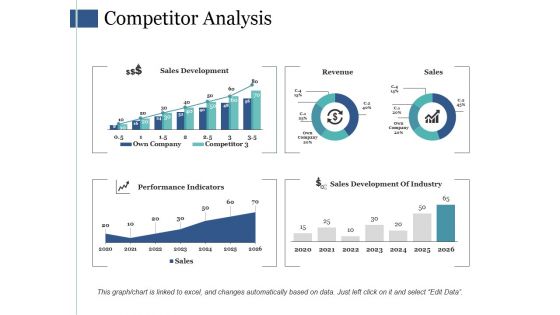
Competitor Analysis Ppt PowerPoint Presentation Slides Visuals
This is a competitor analysis ppt powerpoint presentation slides visuals. This is a four stage process. The stages in this process are sales development, revenue, sales, performance, indicators.
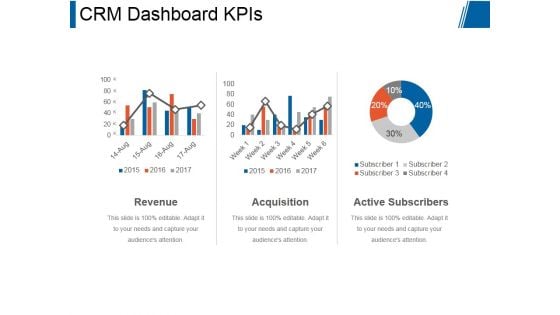
Crm Dashboard Kpis Ppt PowerPoint Presentation Rules
This is a crm dashboard kpis ppt powerpoint presentation rules. This is a three stage process. The stages in this process are revenue, acquisition, active subscribers.
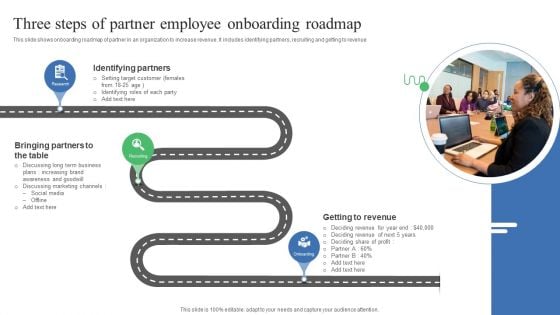
Three Steps Of Partner Employee Onboarding Roadmap Ideas PDF
This slide shows onboarding roadmap of partner in an organization to increase revenue. It includes identifying partners, recruiting and getting to revenue.Presenting Three Steps Of Partner Employee Onboarding Roadmap Ideas PDF to dispense important information. This template comprises three stages. It also presents valuable insights into the topics including Identifying Partners, Discussing Business, Deciding Revenue. This is a completely customizable PowerPoint theme that can be put to use immediately. So, download it and address the topic impactfully.
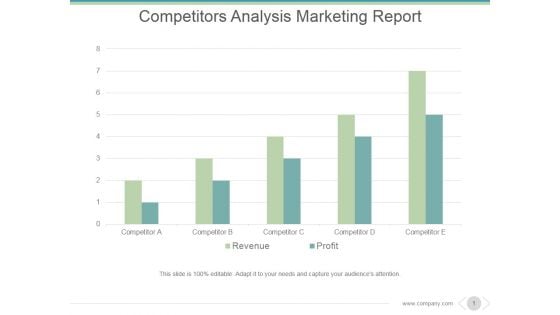
Competitors Analysis Marketing Report Ppt PowerPoint Presentation Tips
This is a competitors analysis marketing report ppt powerpoint presentation tips. This is a five stage process. The stages in this process are competitor, revenue, profit.
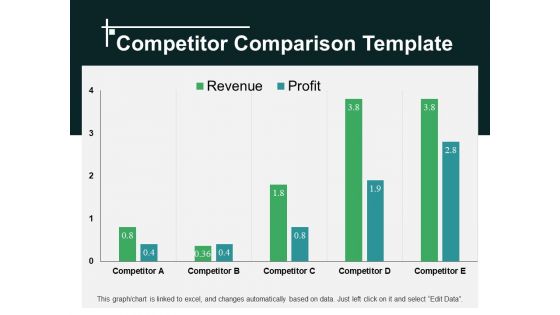
Competitor Comparison Template 2 Ppt PowerPoint Presentation Show Design Ideas
This is a competitor comparison template 2 ppt powerpoint presentation show design ideas. This is a four stage process. The stages in this process are competitor, profit, revenue.
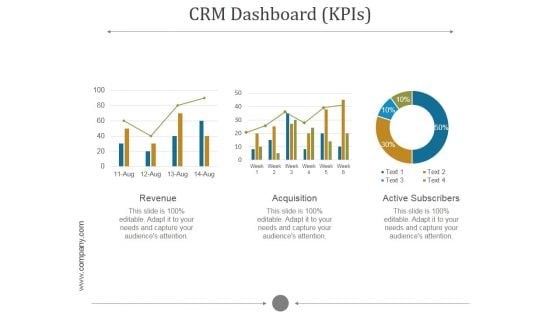
Crm Dashboard Kpis Ppt PowerPoint Presentation Pictures
This is a crm dashboard kpis ppt powerpoint presentation pictures. This is a five stage process. The stages in this process are revenue, acquisition, active subscribers.
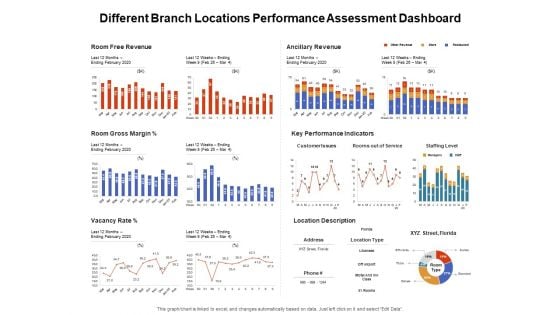
Venture Capitalist Control Board Different Branch Locations Performance Assessment Dashboard Graphics PDF
Presenting this set of slides with name venture capitalist control board different branch locations performance assessment dashboard graphics pdf. The topics discussed in these slides are room free revenue, ancillary revenue, key performance indicators, room gross margin, location description, vacancy rate. This is a completely editable PowerPoint presentation and is available for immediate download. Download now and impress your audience.
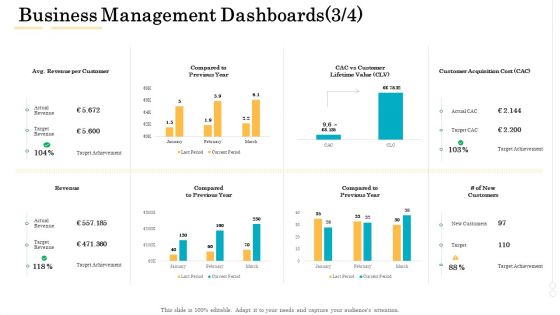
Administrative Regulation Business Management Dashboards Customer Ppt PowerPoint Presentation Images PDF
Deliver an awe-inspiring pitch with this creative administrative regulation business management dashboards customer ppt powerpoint presentation images pdf bundle. Topics like actual revenue, target revenue, target achievement, new customers, customer acquisition cost can be discussed with this completely editable template. It is available for immediate download depending on the needs and requirements of the user.
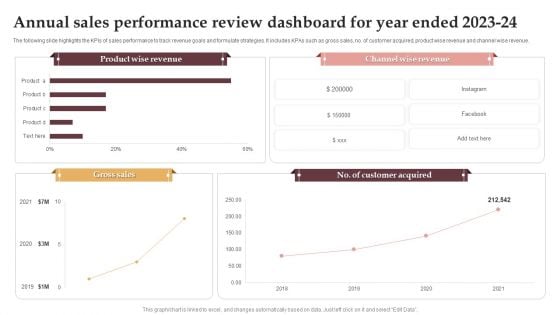
Annual Sales Performance Review Dashboard For Year Ended 2023 24 Formats PDF
Showcasing this set of slides titled Annual Sales Performance Review Dashboard For Year Ended 2023 24 Formats PDF. The topics addressed in these templates are Product Wise Revenue, Channel Wise Revenue, Gross Sales. All the content presented in this PPT design is completely editable. Download it and make adjustments in color, background, font etc. as per your unique business setting.
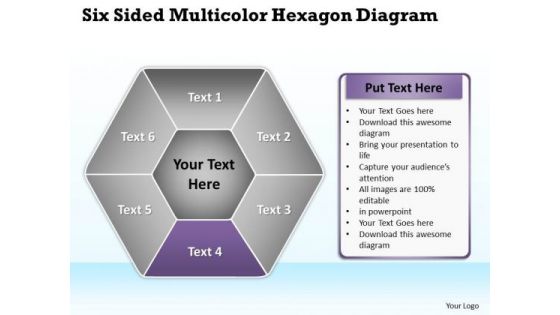
Business Process Diagram Chart Six Sided Multicolor Hexagon PowerPoint Slides
We present our business process diagram chart six sided multicolor hexagon PowerPoint Slides.Use our Circle Charts PowerPoint Templates because You have gained great respect for your brilliant ideas. Use our PowerPoint Templates and Slides to strengthen and enhance your reputation. Use our Ring Charts PowerPoint Templates because You can Raise a toast with our PowerPoint Templates and Slides. Spread good cheer amongst your audience. Present our Flow Charts PowerPoint Templates because Our PowerPoint Templates and Slides team portray an attitude of elegance. Personify this quality by using them regularly. Present our Process and Flows PowerPoint Templates because It can Leverage your style with our PowerPoint Templates and Slides. Charm your audience with your ability. Download our Marketing PowerPoint Templates because Watching this your Audience will Grab their eyeballs, they wont even blink.Use these PowerPoint slides for presentations relating to Business, color, colorful, cycle, executive, icon, illustration, management, model, numbers, organization, procedure, red, resource, sequence, sequential, seven, strategy, symbol, process, process and flows, circle process, circle, process, steps. The prominent colors used in the PowerPoint template are Purple, Gray, White. People tell us our business process diagram chart six sided multicolor hexagon PowerPoint Slides will help you be quick off the draw. Just enter your specific text and see your points hit home. PowerPoint presentation experts tell us our executive PowerPoint templates and PPT Slides help you meet deadlines which are an element of today's workplace. Just browse and pick the slides that appeal to your intuitive senses. Presenters tell us our business process diagram chart six sided multicolor hexagon PowerPoint Slides are the best it can get when it comes to presenting. Use our icon PowerPoint templates and PPT Slides are visually appealing. Customers tell us our business process diagram chart six sided multicolor hexagon PowerPoint Slides are specially created by a professional team with vast experience. They diligently strive to come up with the right vehicle for your brilliant Ideas. People tell us our management PowerPoint templates and PPT Slides are specially created by a professional team with vast experience. They diligently strive to come up with the right vehicle for your brilliant Ideas. Review your plans with our Business Process Diagram Chart Six Sided Multicolor Hexagon PowerPoint Slides. Download without worries with our money back guaranteee.
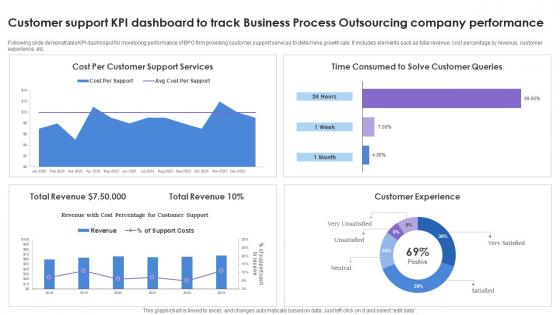
Customer Support KPI Dashboard To Track Business Process Outsourcing Company Performance Rules Pdf Wd
Following slide demonstrates KPI dashboard for monitoring performance of BPO firm providing customer support services to determine growth rate. It includes elements such as total revenue, cost percentage by revenue, customer experience, etc. Showcasing this set of slides titled Customer Support KPI Dashboard To Track Business Process Outsourcing Company Performance Rules Pdf Wd. The topics addressed in these templates are Customer Experience, Total Revenue. All the content presented in this PPT design is completely editable. Download it and make adjustments in color, background, font etc. as per your unique business setting. Following slide demonstrates KPI dashboard for monitoring performance of BPO firm providing customer support services to determine growth rate. It includes elements such as total revenue, cost percentage by revenue, customer experience, etc.
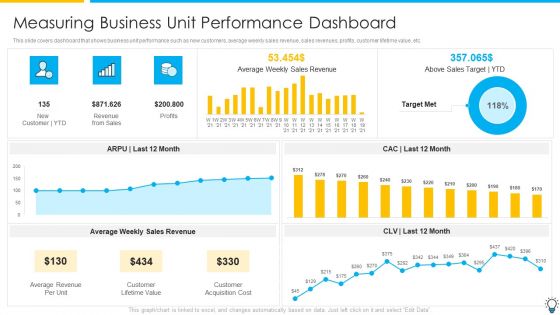
Assuring Management In Product Innovation To Enhance Processes Measuring Business Unit Performance Dashboard Inspiration PDF
This slide covers dashboard that shows business unit performance such as new customers, average weekly sales revenue, sales revenues, profits, customer lifetime value, etc.Deliver an awe inspiring pitch with this creative assuring management in product innovation to enhance processes measuring business unit performance dashboard inspiration pdf bundle. Topics like average weekly sales revenue, customer lifetime value, customer acquisition cost can be discussed with this completely editable template. It is available for immediate download depending on the needs and requirements of the user.
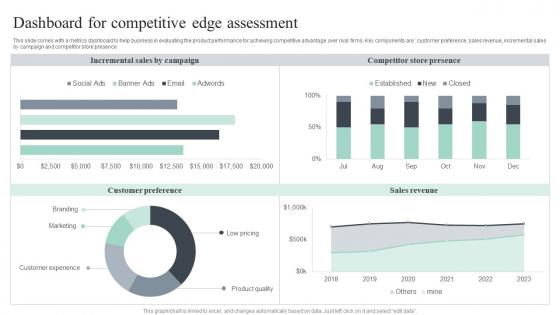
Dashboard For Competitive Edge Assessment Themes Pdf
This slide comes with a metrics dashboard to help business in evaluating the product performance for achieving competitive advantage over rival firms. Key components are customer preference, sales revenue, incremental sales by campaign and competitor store presence Pitch your topic with ease and precision using this Dashboard For Competitive Edge Assessment Themes Pdf. This layout presents information on Incremental Sales, Competitor Store Presence, Sales Revenue. It is also available for immediate download and adjustment. So, changes can be made in the color, design, graphics or any other component to create a unique layout. This slide comes with a metrics dashboard to help business in evaluating the product performance for achieving competitive advantage over rival firms. Key components are customer preference, sales revenue, incremental sales by campaign and competitor store presence
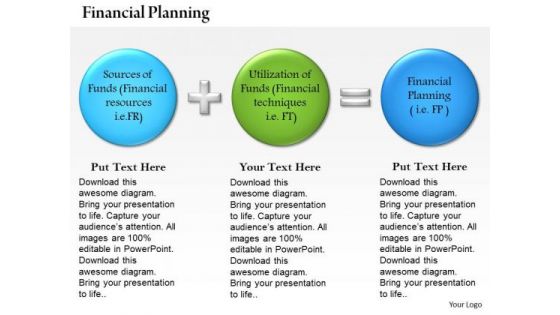
Business Framework Presentations Of Financial Planning PowerPoint Presentation
This image slide has been designed with sources of funds and utilization of funds of funds icons to depict financial planning. This image slide may be used in business, social and marketing presentations. Full fill your goals of making professional presentations using this image slide.
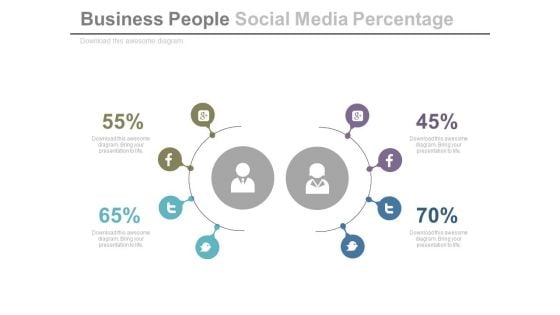
Ratio Of Social Media Users Powerpoint Slides
This PowerPoint template contains diagram of social media icons with percentage ratios. You may download this PPT slide design to display ratio of social media users. You can easily customize this template to make it more unique as per your need.
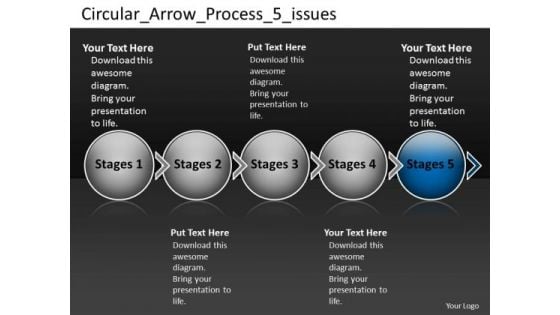
Circular Arrow Process 5 Issues Support Flow Chart PowerPoint Slides
We present our circular arrow process 5 issues support flow chart PowerPoint Slides. Use our Business PowerPoint Templates because, Marketing Strategy Business Template: - Maximizing sales of your product is the intended destination. Use our Circle Charts PowerPoint Templates because, the basic stages are in place, you need to build upon them with our PowerPoint templates. Use our Arrows PowerPoint Templates because, Business 3D Circular Puzzle: - Your business and plans for its growth consist of processes that are highly co-related. Use our Signs PowerPoint Templates because, Our Template designs are State of the Art. Use our Process and Flows PowerPoint Templates because, All elements of the venture are equally critical. Use these PowerPoint slides for presentations relating to abstract arrow blank business chart circular circulation concept conceptual diagram executive flow icon idea illustration linear management model organization procedure process progression resource stages steps strategy. The prominent colors used in the PowerPoint template are Blue, Gray, and White Structure your thoughts with our Circular Arrow Process 5 Issues Support Flow Chart PowerPoint Slides. Download without worries with our money back guaranteee.
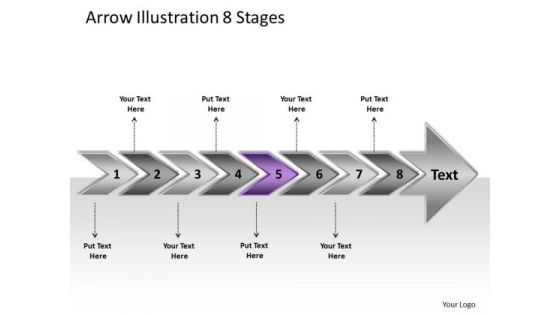
Arrow Illustration 8 Stages Process Flow Charts Examples PowerPoint Slides
We present our arrow illustration 8 stages process flow charts examples PowerPoint Slides. Use our Arrows PowerPoint Templates because, the plans are in your head, stage by stage, year by year. Use our Business PowerPoint Templates because, Marketing Strategy Business Template: - Maximizing sales of your product is the intended destination. Use our Shapes PowerPoint Templates because; explain the contribution of each of the elements and how they provide impetus to the next phase. Use our Finance PowerPoint Templates because, Bullet-point your thoughts and ideas to profitably accomplish every step of every stage along the way. Use our Process and Flows PowerPoint Templates because, Put them down and present them using our innovative templates. Use these PowerPoint slides for presentations relating to 3d arrow background bullet business chart checkmark chevron diagram drop eps10 financial five glass graphic gray icon illustration management point process project reflection set shadow stage text transparency vector white. The prominent colors used in the PowerPoint template are Purple, Gray, and Black Our Arrow Illustration 8 Stages Process Flow Charts Examples PowerPoint Slides are a complete customer delight. They deliver on every account.
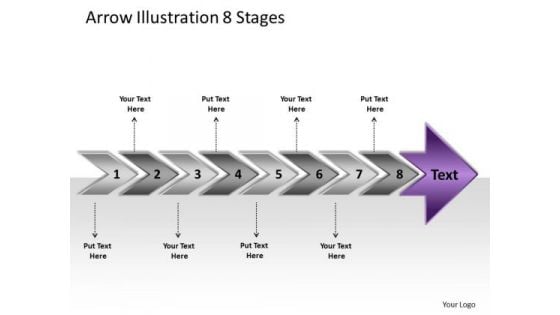
Arrow Illustration 8 Stages Make Flowchart PowerPoint Slides
We present our arrow illustration 8 stages make flowchart PowerPoint Slides. Use our Arrows PowerPoint Templates because, we provide the means to project your views. Use our Business PowerPoint Templates because, Marketing Strategy Business Template: - Maximizing sales of your product is the intended destination. Use our Shapes PowerPoint Templates because, they highlight the depth of your thought process. Use our Finance PowerPoint Templates because, Bullet-point your thoughts and ideas to profitably accomplish every step of every stage along the way. Use our Process and Flows PowerPoint Templates because, you understand the illness and its causes. Use these PowerPoint slides for presentations relating to 3d arrow background bullet business chart checkmark chevron diagram drop eps10 financial five glass graphic gray icon illustration management point process project reflection set shadow stage text transparency vector white. The prominent colors used in the PowerPoint template are Purple, Gray, and Black Arouse a committee with our Arrow Illustration 8 Stages Make Flowchart PowerPoint Slides. Just download, type and present.
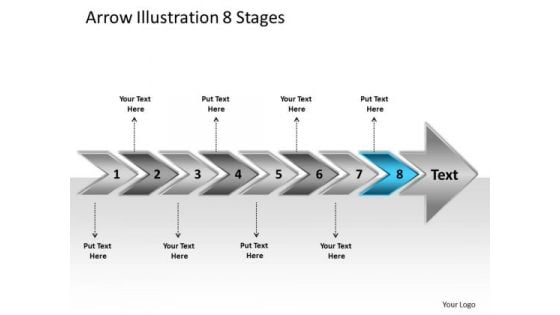
Arrow Illustration 8 Stages Online Flowchart PowerPoint Templates
We present our arrow illustration 8 stages online flowchart PowerPoint templates. Use our Arrows PowerPoint Templates because; Break it all down to Key Result Areas. Use our Business PowerPoint Templates because, you have what it takes to grow. Use our Shapes PowerPoint Templates because, Expound on how you plan to gain their confidence and assure them of continued and consistent excellence in quality of service. Use our Finance PowerPoint Templates because, Bullet-point your thoughts and ideas to profitably accomplish every step of every stage along the way. Use our Process and Flows PowerPoint Templates because, Activities which in themselves have many inherent business opportunities. Use these PowerPoint slides for presentations relating to 3d arrow background bullet business chart checkmark chevron diagram drop eps10 financial five glass graphic gray icon illustration management point process project reflection set shadow stage text transparency vector white. The prominent colors used in the PowerPoint template are Blue, Gray, and Black There are no mixed feelings about our Arrow Illustration 8 Stages Online Flowchart PowerPoint Templates. They are a definite asset for all.
Modifying Banking Functionalities Dashboard Tracking Customer Satisfaction Score Infographics PDF
This slide contains dashboard that depicts the overall customer satisfaction into quantitative form. Deliver an awe inspiring pitch with this creative enhancing financial institution operations dashboard tracking customer satisfaction score icons pdf bundle. Topics like dashboard tracking customer satisfaction score can be discussed with this completely editable template. It is available for immediate download depending on the needs and requirements of the user.
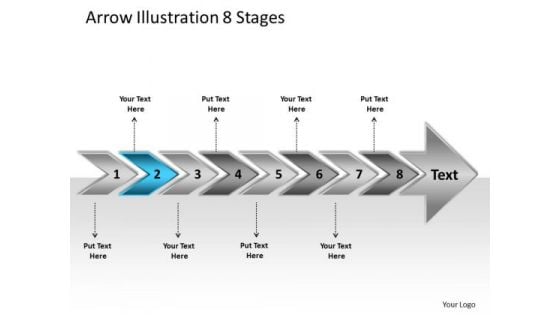
Arrow Illustration 8 Stages Business Flow Chart Slides PowerPoint
We present our arrow illustration 8 stages business flow chart Slides PowerPoint. Use our Arrows PowerPoint Templates because, the color coding of our templates are specifically designed to highlight you points. Use our Business PowerPoint Templates because, Now use this slide to bullet point your views. Use our Shapes PowerPoint Templates because; unravel the desired and essential elements of your overall strategy. Use our Finance PowerPoint Templates because, Goal Pie Chart Template: - You have a clear vision of the cake you want. Use our Process and Flows PowerPoint Templates because, you have the entire picture in mind. Use these PowerPoint slides for presentations relating to 3d arrow background bullet business chart checkmark chevron diagram drop eps10 financial five glass graphic gray icon illustration management point process project reflection set shadow stage text transparency vector white. The prominent colors used in the PowerPoint template are Blue, Gray, and Black Win trust with our Arrow Illustration 8 Stages Business Flow Chart Slides PowerPoint. You will come out on top.
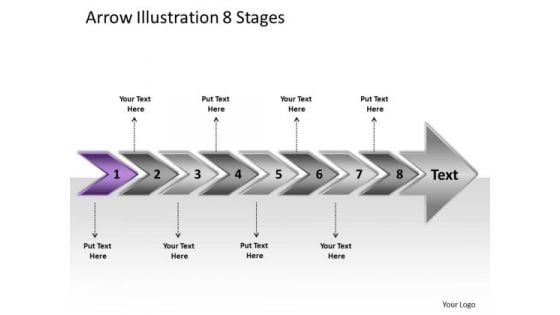
Arrow Illustration 8 Stages Flow Chart Slides PowerPoint
We present our arrow illustration 8 stages flow chart Slides PowerPoint. Use our Arrows PowerPoint Templates because, getting it done in time is the key to success. Use our Business PowerPoint Templates because; illustrate your plans on using the many social media modes available to inform society at large of the benefits of your product. Use our Shapes PowerPoint Templates because, our ready backdrops leave a lasting impression. Use our Finance PowerPoint Templates because, Present your views using our innovative slides and be assured of leaving a lasting impression. Use our Process and Flows PowerPoint Templates because, and keep you group steady in the top bracket. Use these PowerPoint slides for presentations relating to 3d arrow background bullet business chart checkmark chevron diagram drop eps10 financial five glass graphic gray icon illustration management point process project reflection set shadow stage text transparency vector white. The prominent colors used in the PowerPoint template are Purple, Gray, and Black Show them you are superior with our Arrow Illustration 8 Stages Flow Chart Slides PowerPoint. You'll always stay ahead of the game.
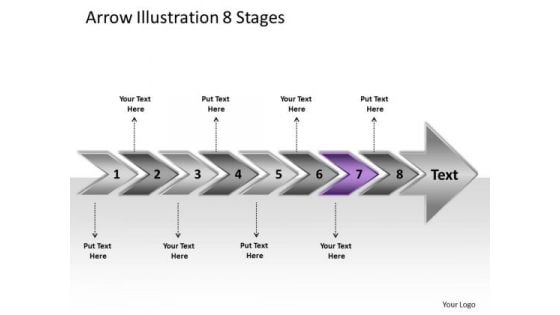
Arrow Illustration 8 Stages Ppt Flow Charting PowerPoint Slides
We present our arrow illustration 8 stages ppt flow charting PowerPoint Slides. Use our Arrows PowerPoint Templates because, to achieve sure shot success they need to come together at the right time, place and manner. Use our Business PowerPoint Templates because, Marketing Strategy Business Template: - Maximizing sales of your product is the intended destination. Use our Shapes PowerPoint Templates because; educate your team and the attention you have paid. Use our Finance PowerPoint Templates because, you understand the illness and its causes. Use our Process and Flows PowerPoint Templates because, Our PowerPoint templates give this step by step process to achieved the aim. Use these PowerPoint slides for presentations relating to 3d arrow background bullet business chart checkmark chevron diagram drop eps10 financial five glass graphic gray icon illustration management point process project reflection set shadow stage text transparency vector white. The prominent colors used in the PowerPoint template are Purple, Gray, and Black Tackle the issue in it's entirety. Put up the overall picture with our Arrow Illustration 8 Stages Ppt Flow Charting PowerPoint Slides.
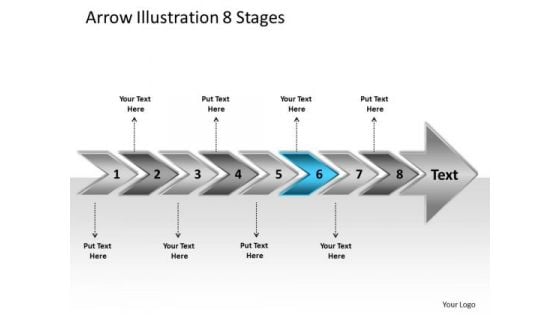
Arrow Illustration 8 Stages Business Process Flow Charts Examples PowerPoint Slides
We present our arrow illustration 8 stages business process flow charts examples PowerPoint Slides. Use our Arrows PowerPoint Templates because; now funnel your marketing strategies down the cone, stage by stage, refining as you go along. Use our Business PowerPoint Templates because; educate your staff on the means to provide the required support for speedy recovery. Use our Shapes PowerPoint Templates because, your foot is on the pedal and your company is purring along smoothly. Use our Finance PowerPoint Templates because, we provide the means to project your views. Use our Process and Flows PowerPoint Templates because, you have some exciting plans to spread goodwill among the underprivileged, Expound on your ideas and show to your colleagues how they can help others and in the process increase your Brand value. Use these PowerPoint slides for presentations relating to 3d arrow background bullet business chart checkmark chevron diagram drop eps10 financial five glass graphic gray icon illustration management point process project reflection set shadow stage text transparency vector white. The prominent colors used in the PowerPoint template are Blue, Gray, and Black Spread it out in equal doses. Get the portions right with our Arrow Illustration 8 Stages Business Process Flow Charts Examples PowerPoint Slides.

Annual Business Financial Summary Dashboard Themes PDF
This slide shows annual financial report dashboard of company to monitor yearly business performance. It includes various indicators such as revenue, net profits, costs and breakdown of cost. Showcasing this set of slides titled Annual Business Financial Summary Dashboard Themes PDF. The topics addressed in these templates are Revenue, Costs, Net Profit. All the content presented in this PPT design is completely editable. Download it and make adjustments in color, background, font etc. as per your unique business setting.
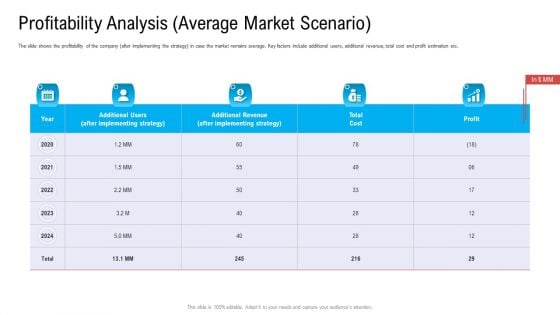
Profitability Analysis Average Market Scenario Ppt Diagram Graph Charts PDF
The slide shows the profitability of the company after implementing the strategy in case the market remains average. Key factors include additional users, additional revenue, total cost and profit estimation etc. Deliver an awe inspiring pitch with this creative profitability analysis average market scenario ppt diagram graph charts pdf bundle. Topics like implementing strategy, additional revenue, total cost, profit can be discussed with this completely editable template. It is available for immediate download depending on the needs and requirements of the user.
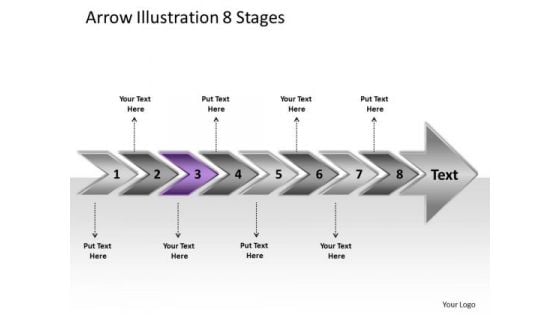
Arrow Illustration 8 Stages Open Source Flowchart PowerPoint Slides
We present our arrow illustration 8 stages open source flowchart PowerPoint Slides. Use our Arrows PowerPoint Templates because, coincidentally it always points to the top. Use our Business PowerPoint Templates because; now funnel your marketing strategies down the cone, stage by stage, refining as you go along. Use our Shapes PowerPoint Templates because, Amplify on your plans to have dedicated sub groups working on related but distinct tasks. Use our Finance PowerPoint Templates because, There are different paths to gain the necessary knowledge to achieved it. Use our Process and Flows PowerPoint Templates because; Take your team along by explaining your plans. Use these PowerPoint slides for presentations relating to 3d arrow background bullet business chart checkmark chevron diagram drop eps10 financial five glass graphic gray icon illustration management point process project reflection set shadow stage text transparency vector white. The prominent colors used in the PowerPoint template are Purple, Gray, and Black Get on a accelerated career track with our Arrow Illustration 8 Stages Open Source Flowchart PowerPoint Slides. They will make you look good.
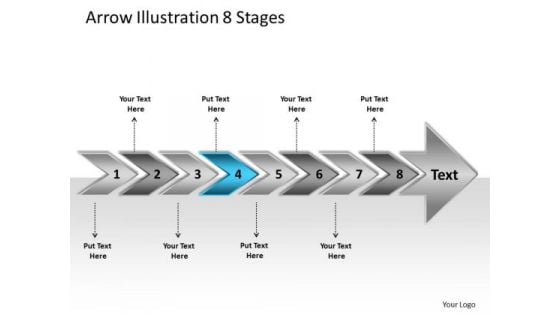
Arrow Illustration 8 Stages Visio Templates PowerPoint
We present our arrow illustration 8 stages vision templates PowerPoint. Use our Arrows PowerPoint Templates because, the basic stages are in place, you need to build upon them with our PowerPoint templates. Use our Business PowerPoint Templates because, Pinpoint the critical paths and areas in your process and set the timelines for their completion. Use our Shapes PowerPoint Templates because; anoint it with your really bright ideas. Use our Finance PowerPoint Templates because, Feel the buzz as they comprehend your plan to get the entire act together. Use our Process and Flows PowerPoint Templates because, Timelines Template: - Getting it done may not be enough. Use these PowerPoint slides for presentations relating to 3d arrow background bullet business chart checkmark chevron diagram drop eps10 financial five glass graphic gray icon illustration management point process project reflection set shadow stage text transparency vector white. The prominent colors used in the PowerPoint template are Blue, Gray, and Black Change the face of thinking in your company. Our Arrow Illustration 8 Stages Visio Templates PowerPoint will exhibit your expertise.
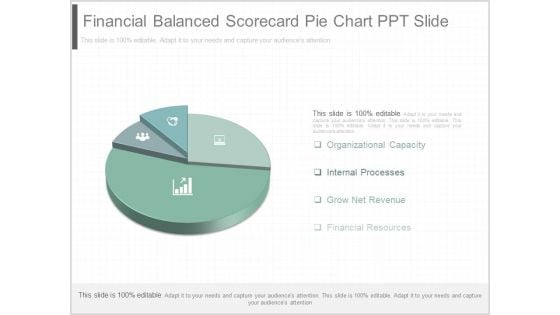
Financial Balanced Scorecard Pie Chart Ppt Slide
This is a financial balanced scorecard pie chart ppt slide. This is a four stage process. The stages in this process are organizational capacity, internal processes, grow net revenue, financial resources.
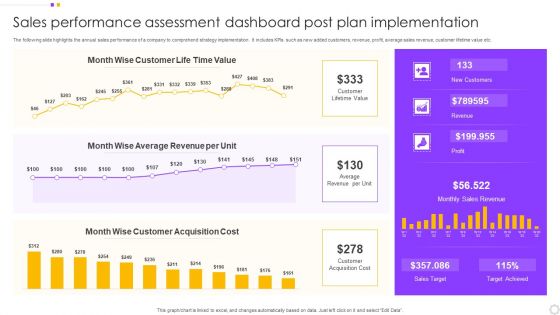
Sales Performance Assessment Dashboard Post Plan Implementation Introduction PDF
The following slide highlights the annual sales performance of a company to comprehend strategy implementation. It includes KPIs such as new added customers, revenue, profit, average sales revenue, customer lifetime value etc. Pitch your topic with ease and precision using this Sales Performance Assessment Dashboard Post Plan Implementation Introduction PDF. This layout presents information on Customer, Value, Average Revenue. It is also available for immediate download and adjustment. So, changes can be made in the color, design, graphics or any other component to create a unique layout.
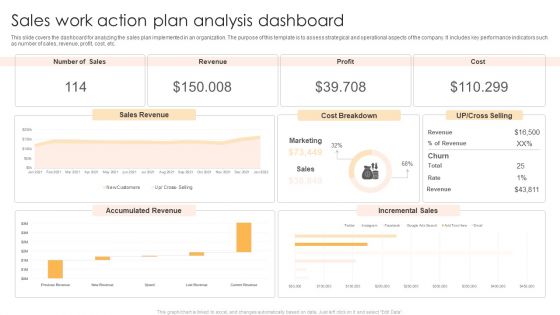
Sales Work Action Plan Analysis Dashboard Brochure PDF
This slide covers the dashboard for analyzing the sales plan implemented in an organization. The purpose of this template is to assess strategical and operational aspects of the company. It includes key performance indicators such as number of sales, revenue, profit, cost, etc. Showcasing this set of slides titled Sales Work Action Plan Analysis Dashboard Brochure PDF. The topics addressed in these templates are Sales Revenue, Cost Breakdown, Accumulated Revenue. All the content presented in this PPT design is completely editable. Download it and make adjustments in color, background, font etc. as per your unique business setting.
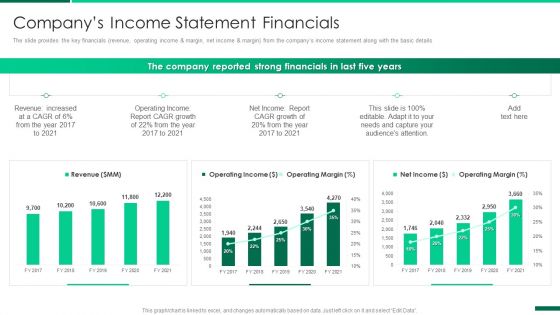
Corporate Profile IT Organization Companys Income Statement Financials Diagrams PDF
The slide provides the key financials revenue, operating income and margin, net income and margin from the companys income statement along with the basic details. Deliver an awe inspiring pitch with this creative corporate profile it organization companys income statement financials diagrams pdf bundle. Topics like revenue, operating income, operating margin, net income can be discussed with this completely editable template. It is available for immediate download depending on the needs and requirements of the user.
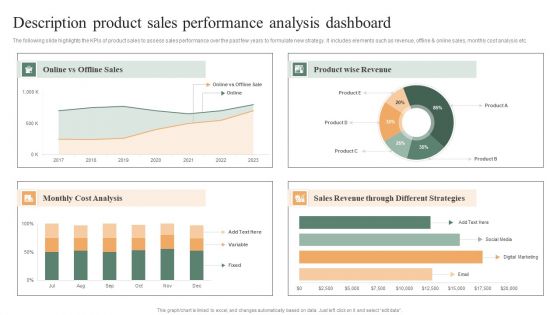
Description Product Sales Performance Analysis Dashboard Ppt PowerPoint Presentation File Samples PDF
The following slide highlights the KPIs of product sales to assess sales performance over the past few years to formulate new strategy. It includes elements such as revenue, offline and online sales, monthly cost analysis etc. Pitch your topic with ease and precision using this Description Product Sales Performance Analysis Dashboard Ppt PowerPoint Presentation File Samples PDF. This layout presents information on Product Wise Revenue, Monthly Cost Analysis, Sales Revenue, Different Strategies. It is also available for immediate download and adjustment. So, changes can be made in the color, design, graphics or any other component to create a unique layout.
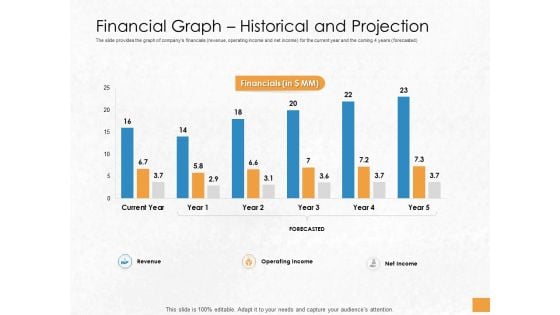
Convertible Debenture Funding Financial Graph Historical And Projection Ppt Professional Themes PDF
The slide provides the graph of companys financials revenue, operating income and net income for the current year and the coming 4 years forecasted. Deliver an awe-inspiring pitch with this creative convertible debenture funding financial graph historical and projection ppt professional themes pdf bundle. Topics like revenue, operating income, net income, forecasted, financials, current year can be discussed with this completely editable template. It is available for immediate download depending on the needs and requirements of the user.
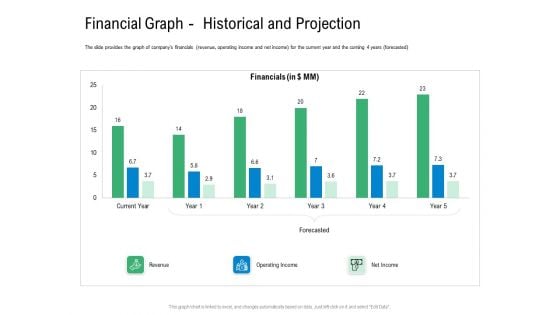
Convertible Preferred Stock Funding Pitch Deck Financial Graph Historical And Projection Themes PDF
The slide provides the graph of companys financials revenue, operating income and net income for the current year and the coming 4 years forecasted. Deliver an awe inspiring pitch with this creative convertible preferred stock funding pitch deck financial graph historical and projection themes pdf bundle. Topics like revenue, operating income, net income can be discussed with this completely editable template. It is available for immediate download depending on the needs and requirements of the user.
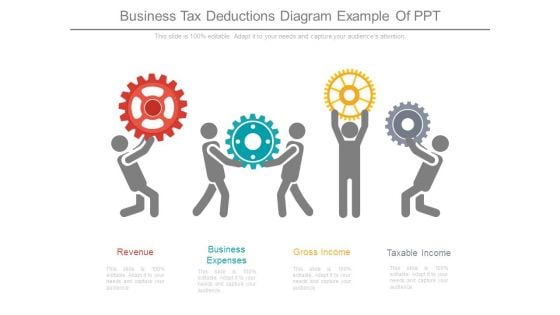
Business Tax Deductions Diagram Example Of Ppt
This is a business tax deductions diagram example of ppt. This is a four stage process. The stages in this process are revenue, business expenses, gross income, taxable income.
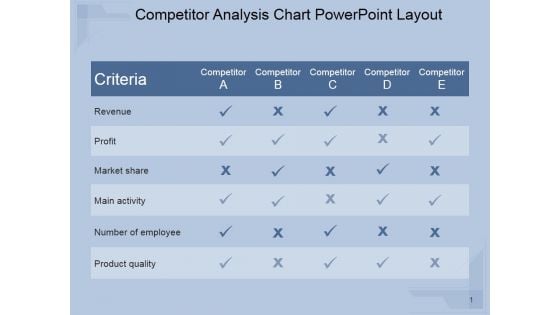
Competitor Analysis Chart Ppt PowerPoint Presentation Visuals
This is a competitor analysis chart ppt powerpoint presentation visuals. This is a five stage process. The stages in this process are revenue, profit, market share, main activity, number of employee, product quality.
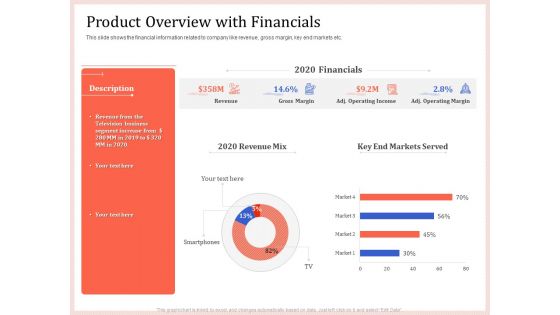
Pitch Deck To Raise Capital From Product Pooled Funding Product Overview With Financials Diagrams PDF
This slide shows the financial information related to company like revenue, gross margin, key end markets etc. Deliver and pitch your topic in the best possible manner with this pitch deck to raise capital from product pooled funding product overview with financials diagrams pdf. Use them to share invaluable insights on revenue, gross margin, operating income, operating margin and impress your audience. This template can be altered and modified as per your expectations. So, grab it now.
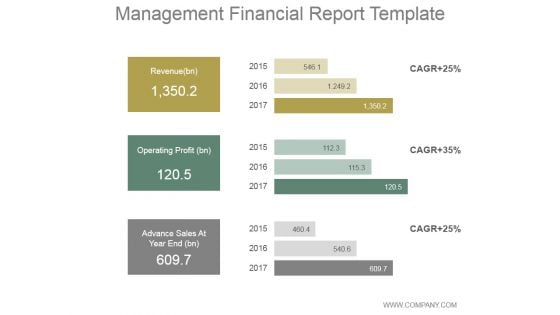
Management Financial Report Ppt PowerPoint Presentation Diagrams
This is a management financial report ppt powerpoint presentation diagrams. This is a three stage process. The stages in this process are revenue, operating profit, advance sales at year end.
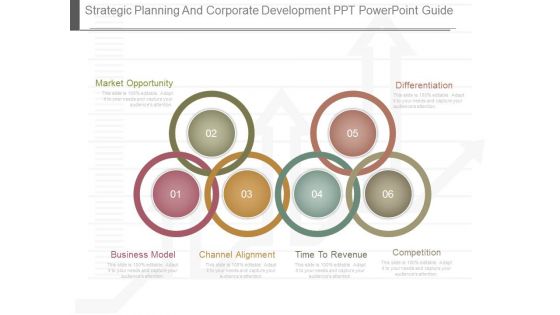
Strategic Planning And Corporate Development Ppt Powerpoint Guide
This is a strategic planning and corporate development ppt powerpoint guide. This is a six stage process. The stages in this process are market opportunity, business model, channel alignment, time to revenue, competition, differentiation.
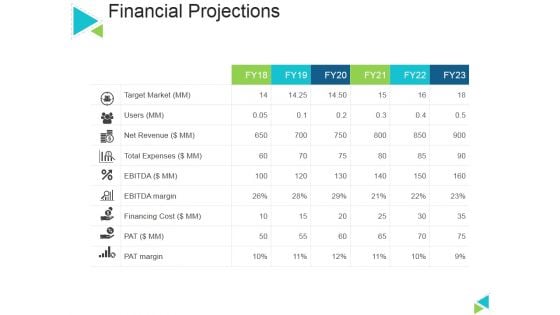
Financial Projections Ppt PowerPoint Presentation Model Diagrams
This is a financial projections ppt powerpoint presentation model diagrams. This is a six stage process. The stages in this process are target market, net revenue, ebitda margin, financing cost, pat margin.
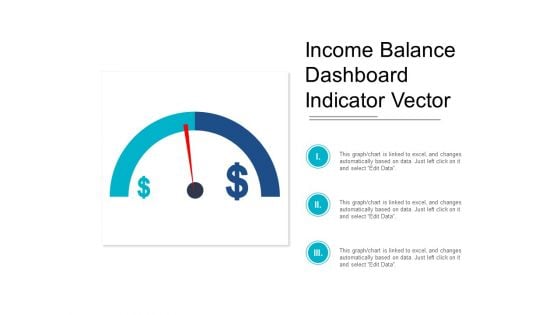
Income Balance Dashboard Indicator Vector Ppt PowerPoint Presentation Professional Diagrams
This is a income balance dashboard indicator vector ppt powerpoint presentation professional diagrams. This is a three stage process. The stages in this process are growth, increase sales, increase revenue.
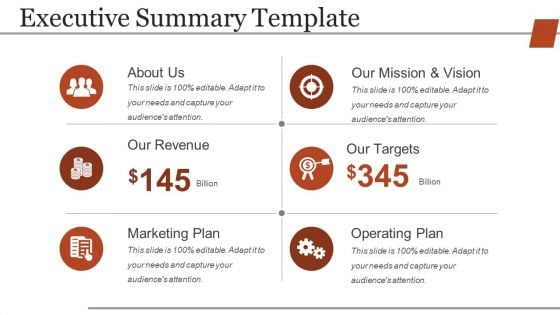
Executive Summary Template Ppt PowerPoint Presentation Slides Themes
This is a executive summary template ppt powerpoint presentation slides themes. This is a six stage process. The stages in this process are about us, our revenue, marketing plan, our mission and vision, our targets, operating plan.
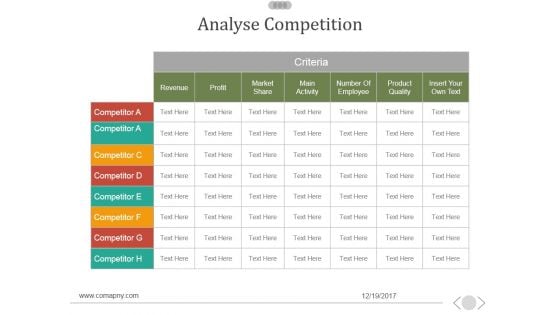
Analyse Competition Ppt PowerPoint Presentation Themes
This is a analyse competition ppt powerpoint presentation themes. This is a seven stage process. The stages in this process are profit, revenue, market share, main activity, number of employee.
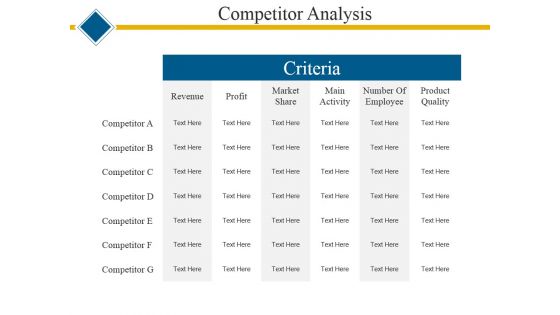
Competitor Analysis Ppt PowerPoint Presentation Professional Themes
This is a competitor analysis ppt powerpoint presentation professional themes. This is a six stage process. The stages in this process are revenue, profit, market share, main activity, number of employee, product quality.
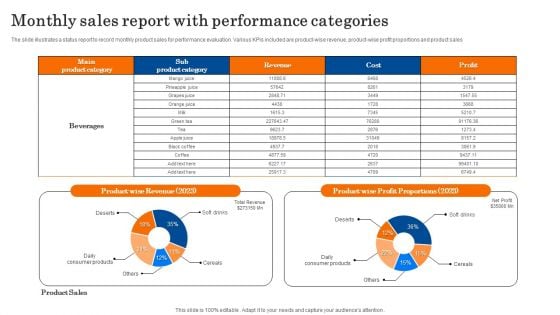
Monthly Sales Report With Performance Categories Diagrams PDF
The slide illustrates a status report to record monthly product sales for performance evaluation. Various KPIs included are product wise revenue, product-wise profit proportions and product sales. Showcasing this set of slides titled Monthly Sales Report With Performance Categories Diagrams PDF. The topics addressed in these templates are Revenue, Profit Proportions, Product Sales. All the content presented in this PPT design is completely editable. Download it and make adjustments in color, background, font etc. as per your unique business setting.
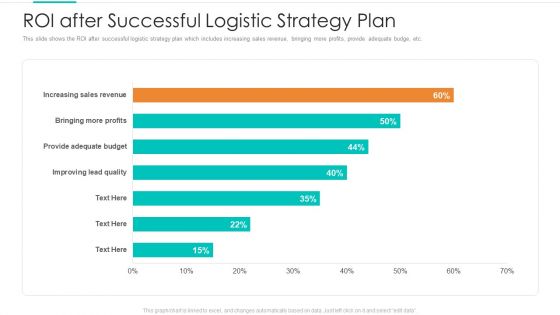
Planning Logistic Technique Superior Supply Chain Execution Roi After Successful Logistic Strategy Plan Themes PDF
This slide shows the ROI after successful logistic strategy plan which includes increasing sales revenue, bringing more profits, provide adequate budge, etc. Deliver an awe-inspiring pitch with this creative planning logistic technique superior supply chain execution roi after successful logistic strategy plan themes pdf bundle. Topics like sales revenue, profits, provide adequate budge can be discussed with this completely editable template. It is available for immediate download depending on the needs and requirements of the user.

 Home
Home