Icon Revenue
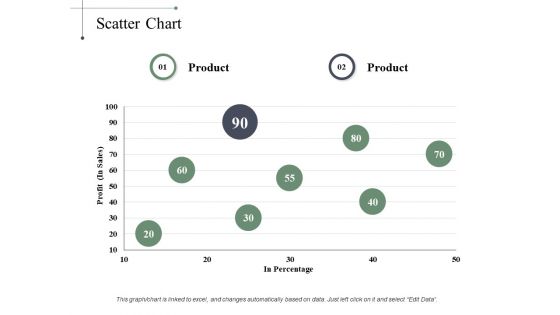
Scatter Chart Finance Ppt PowerPoint Presentation Ideas Show
This is a scatter chart finance ppt powerpoint presentation ideas show. This is a two stage process. The stages in this process are finance, marketing, analysis, business, investment.
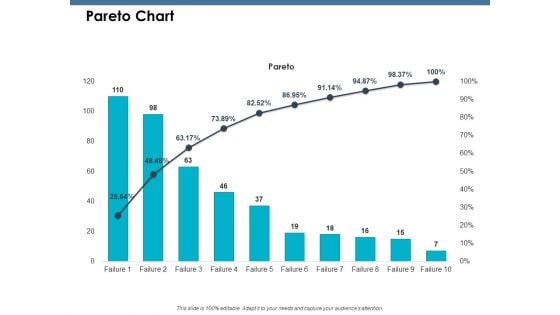
Pareto Chart Ppt PowerPoint Presentation Styles File Formats
This is a pareto chart ppt powerpoint presentation styles file formats. This is a ten stage process. The stages in this process are Product, Percentage, Business, Marketing.
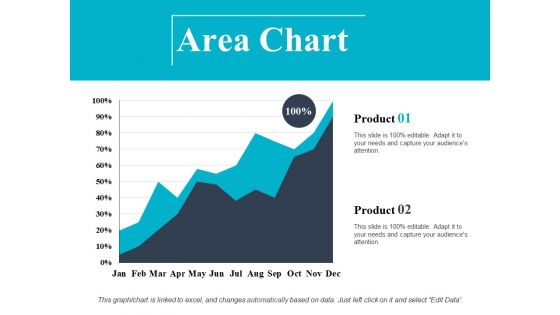
Area Chart Finance Ppt PowerPoint Presentation Slides Layout
This is a area chart finance ppt powerpoint presentation slides layout. This is a two stage process. The stages in this process are finance, marketing, management, investment, analysis.
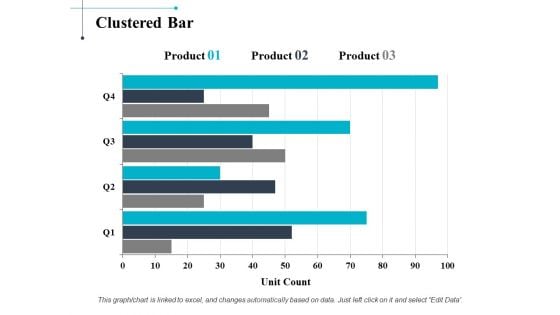
Clustered Bar Chart Ppt PowerPoint Presentation Professional Good
This is a clustered bar chart ppt powerpoint presentation professional good. This is a three stage process. The stages in this process are finance, marketing, management, investment, analysis.
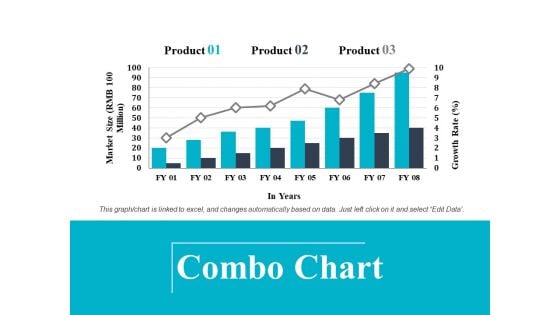
Combo Chart Ppt PowerPoint Presentation Visual Aids Files
This is a combo chart ppt powerpoint presentation visual aids files. This is a three stage process. The stages in this process are finance, marketing, management, investment, analysis.
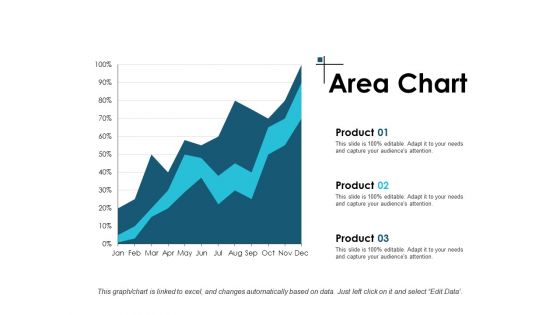
Area Chart Investment Ppt PowerPoint Presentation Infographics Summary
This is a area chart investment ppt powerpoint presentation infographics summary. This is a three stage process. The stages in this process are finance, marketing, management, investment, analysis.
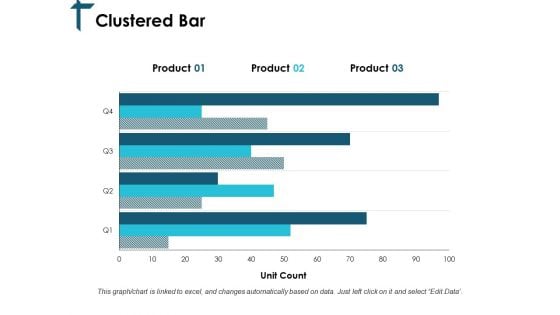
Clustered Bar Chart Ppt PowerPoint Presentation Summary Templates
This is a clustered bar chart ppt powerpoint presentation summary templates. This is a three stage process. The stages in this process are finance, marketing, management, investment, analysis.
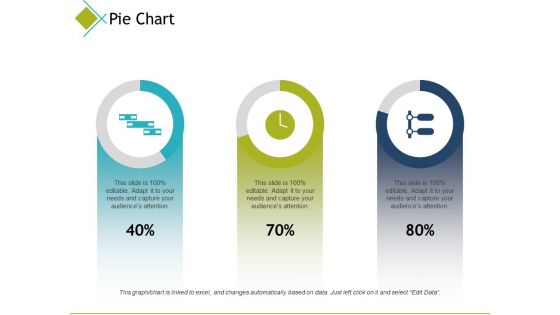
Pie Chart Finance Ppt PowerPoint Presentation Inspiration Introduction
This is a pie chart finance ppt powerpoint presentation inspiration introduction. This is a three stage process. The stages in this process are finance, marketing, analysis, business, investment.
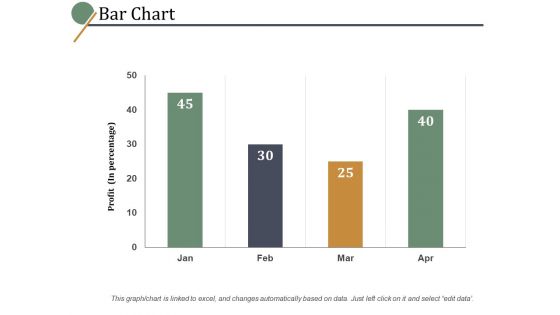
Bar Chart Slide Ppt PowerPoint Presentation Summary Example File
This is a bar chart slide ppt powerpoint presentation summary example file. This is a three stage process. The stages in this process are percentage, marketing, management, product.
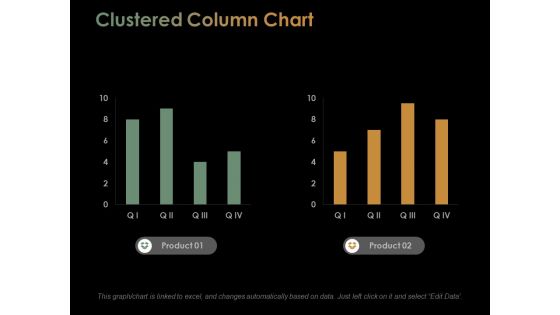
Clustered Column Chart Ppt PowerPoint Presentation Slides Information
This is a clustered column chart ppt powerpoint presentation slides information. This is a two stage process. The stages in this process are percentage, product, business, marketing.
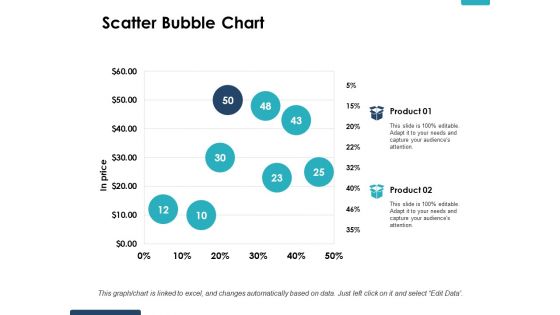
Scatter Bubble Chart Ppt PowerPoint Presentation Layouts Gridlines
This is a scatter bubble chart ppt powerpoint presentation layouts gridlines. This is a two stage process. The stages in this process are percentage, product, business, marketing.
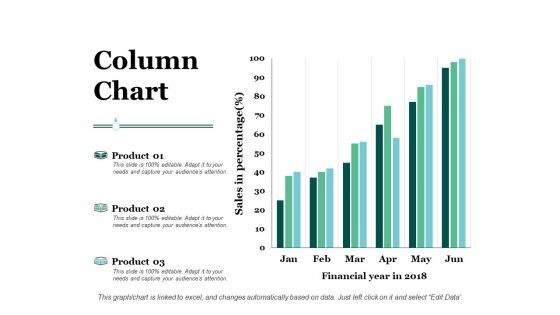
Column Chart Investment Ppt PowerPoint Presentation Professional Pictures
This is a column chart investment ppt powerpoint presentation professional pictures. This is a three stage process. The stages in this process are finance, analysis, business, investment, marketing.
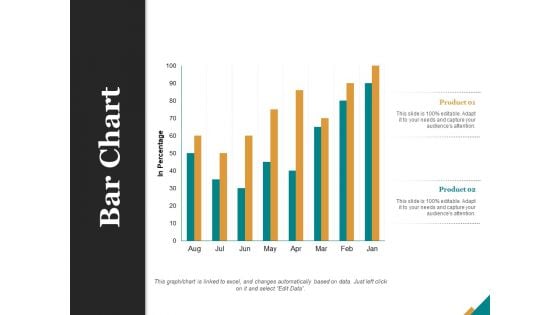
Bar Chart Finance Ppt PowerPoint Presentation Portfolio Model
This is a bar chart finance ppt powerpoint presentation portfolio model. This is a two stage process. The stages in this process are finance, marketing, management, investment, analysis.
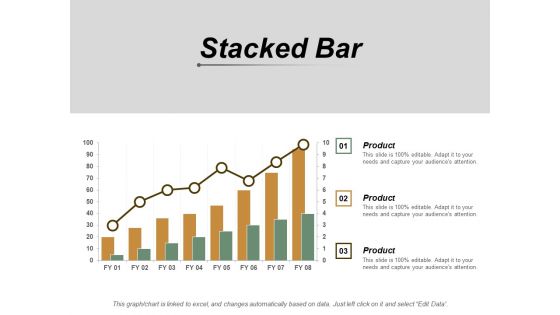
Stacked Bar Chart Ppt PowerPoint Presentation Gallery Outfit
This is a stacked bar chart ppt powerpoint presentation gallery outfit. This is a three stage process. The stages in this process are finance, marketing, management, investment, analysis.
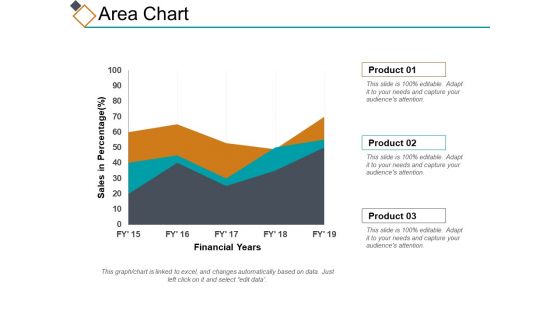
Area Chart Ppt PowerPoint Presentation File Design Inspiration
This is a area chart ppt powerpoint presentation file design inspiration. This is a three stage process. The stages in this process are percentage, product, business, management, marketing.
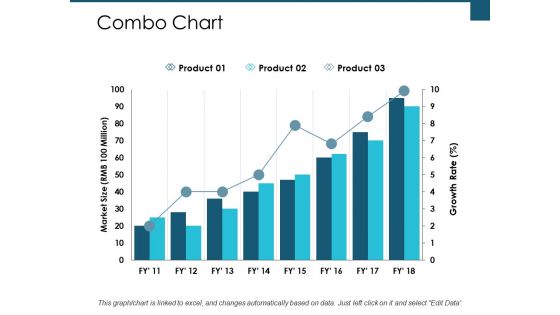
Combo Chart Finance Ppt PowerPoint Presentation Portfolio Templates
This is a combo chart finance ppt powerpoint presentation portfolio templates. This is a three stage process. The stages in this process are finance, analysis, business, investment, marketing.
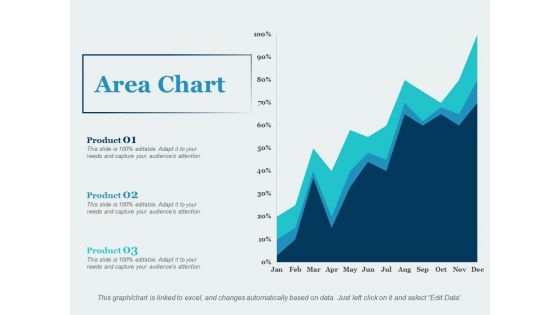
Area Chart Percentage Ppt PowerPoint Presentation Gallery Outline
This is a area chart percentage ppt powerpoint presentation gallery outline. This is a three stage process. The stages in this process are business, management, marketing, percentage, product.

Scatter Bubble Chart Ppt PowerPoint Presentation Outline Demonstration
This is a scatter bubble chart ppt powerpoint presentation outline demonstration. This is a three stage process. The stages in this process are percentage, product, management, marketing, business.
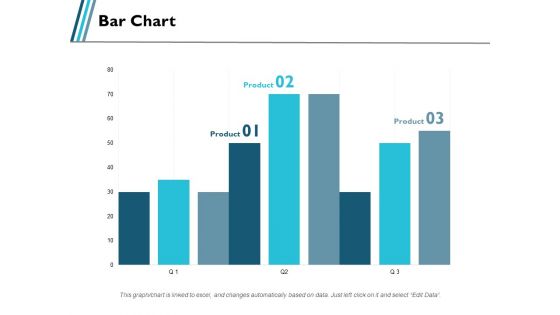
Bar Chart Product Ppt PowerPoint Presentation Portfolio Visuals
This is a bar chart product ppt powerpoint presentation portfolio visuals. This is a three stage process. The stages in this process are business, management, marketing, percentage, product.
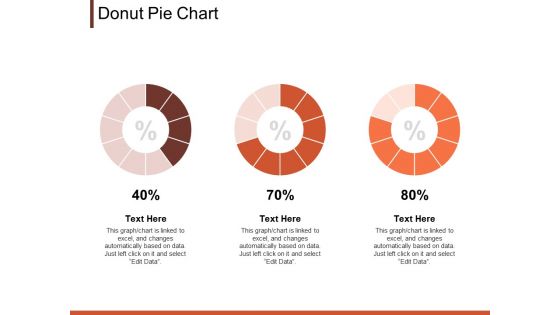
Donut Pie Chart Marketing Ppt PowerPoint Presentation Clipart
This is a donut pie chart marketing ppt powerpoint presentation clipart. This is a three stage process. The stages in this process are finance, analysis, business, investment, marketing.
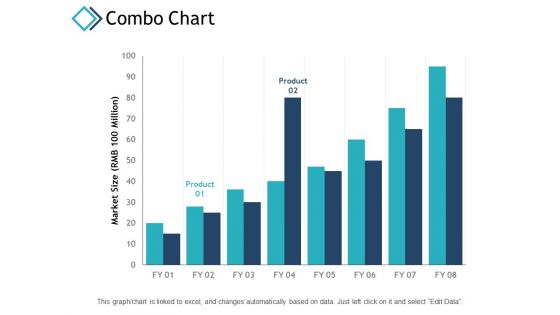
Combo Chart Finance Ppt PowerPoint Presentation Portfolio Gridlines
This is a combo chart finance ppt powerpoint presentation portfolio gridlines. This is a two stage process. The stages in this process are finance, analysis, business, investment, marketing.
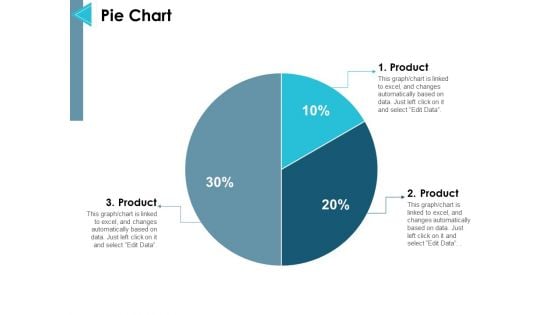
Pie Chart Finance Ppt PowerPoint Presentation Professional Styles
This is a pie chart finance ppt powerpoint presentation professional styles. This is a three stage process. The stages in this process are management, marketing, business, strategy, finance.
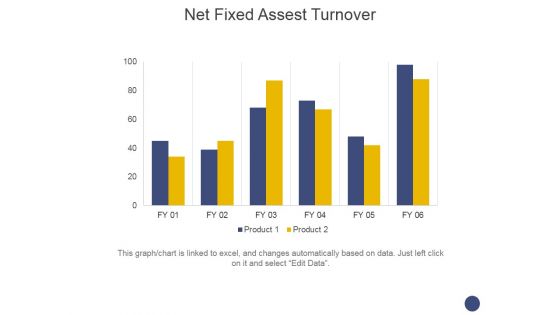
Net Fixed Assest Turnover Ppt PowerPoint Presentation Infographics Themes
This is a net fixed assest turnover ppt powerpoint presentation infographics themes. This is a two stage process. The stages in this process are turnover, business, marketing, management, finance.
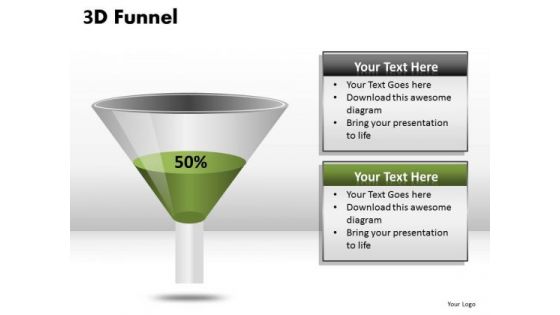
Half Full Funnel Diagram PowerPoint Templates
Half Full Funnel Diagram PowerPoint templates-These high quality powerpoint pre-designed slides and powerpoint templates have been carefully created by our professional team to help you impress your audience. All slides have been created and are 100% editable in powerpoint. Each and every property of any graphic - color, size, orientation, shading, outline etc. can be modified to help you build an effective powerpoint presentation. Any text can be entered at any point in the powerpoint template or slide. Simply DOWNLOAD, TYPE and PRESENT! These PowerPoint presentation slides can be used to represent themes relating to - Interpret plans with our Half Full Funnel Diagram PowerPoint Templates. Download without worries with our money back guaranteee.
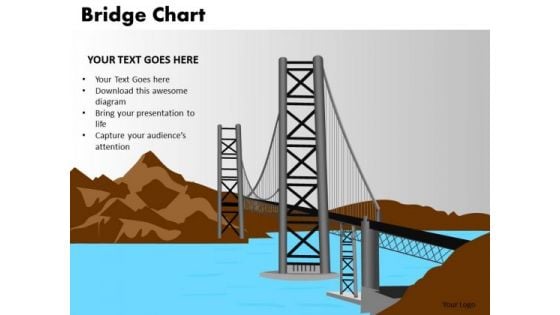
PowerPoint Backgrounds Company Bridge Chart Ppt Slides
PowerPoint Backgrounds Company Bridge Chart PPT Slides Business PPT templates-These high quality powerpoint pre-designed slides and powerpoint templates have been carefully created by our professional team to help you impress your audience. All slides have been created and are 100% editable in powerpoint. Each and every property of any graphic - color, size, orientation, shading, outline etc. can be modified to help you build an effective powerpoint presentation. Any text can be entered at any point in the powerpoint template or slide. Simply DOWNLOAD, TYPE and PRESENT! Question doubts with our PowerPoint Backgrounds Company Bridge Chart Ppt Slides. Download without worries with our money back guaranteee.
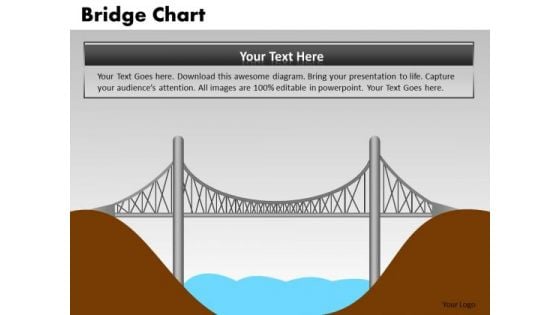
PowerPoint Slide Growth Bridge Chart Ppt Designs
PowerPoint Slide Growth Bridge Chart PPT Designs Business PPT templates-These high quality powerpoint pre-designed slides and powerpoint templates have been carefully created by our professional team to help you impress your audience. All slides have been created and are 100% editable in powerpoint. Each and every property of any graphic - color, size, orientation, shading, outline etc. can be modified to help you build an effective powerpoint presentation. Any text can be entered at any point in the powerpoint template or slide. Simply DOWNLOAD, TYPE and PRESENT! Guide your team with our PowerPoint Slide Growth Bridge Chart Ppt Designs. Download without worries with our money back guaranteee.
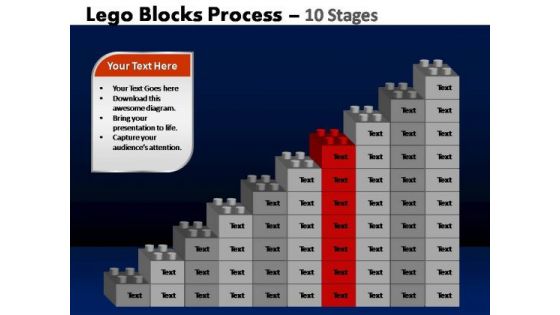
PowerPoint Slidelayout Chart Lego Blocks Ppt Slides
PowerPoint Slidelayout Chart Lego Blocks PPT Slides-These amazing PowerPoint pre-designed slides and PowerPoint templates have been carefully created by our team of experts to help you impress your audience. Our stunning collection of Powerpoint slides are 100% editable and can easily fit in any PowerPoint presentations. By using these animations and graphics in PowerPoint and you can easily make professional presentations. Any text can be entered at any point in the PowerPoint template or slide. Just DOWNLOAD our awesome PowerPoint templates and you are ready to go. Clarify doubts with our PowerPoint Slidelayout Chart Lego Blocks Ppt Slides. Download without worries with our money back guaranteee.
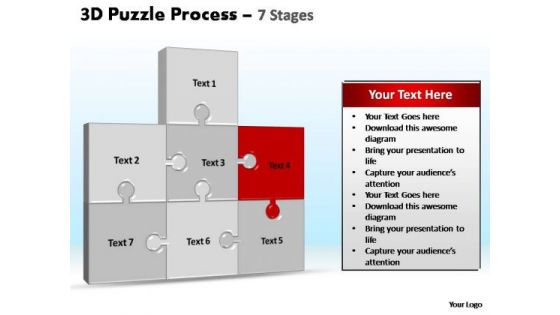
PowerPoint Backgrounds Chart Puzzle Process Ppt Design
PowerPoint_Backgrounds_Chart_puzzle_process_PPT_Design Power Point-These amazing PowerPoint pre-designed slides and PowerPoint templates have been carefully created by our team of experts to help you impress your audience. Our stunning collection of Powerpoint slides are 100% editable and can easily fit in any PowerPoint presentations. By using these animations and graphics in PowerPoint and you can easily make professional presentations. Any text can be entered at any point in the PowerPoint template or slide. Just DOWNLOAD our awesome PowerPoint templates and you are ready to go. Endure setbacks with our PowerPoint Backgrounds Chart Puzzle Process Ppt Design. Download without worries with our money back guaranteee.
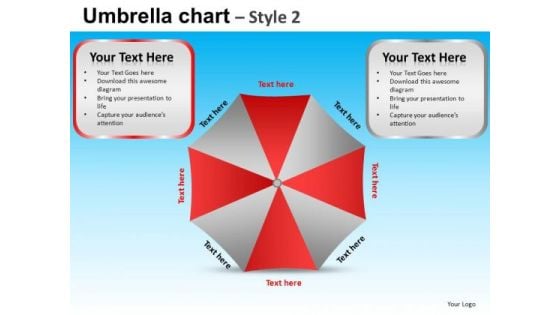
PowerPoint Template Corporate Success Targets Umbrella Chart Ppt Presentation Designs
PowerPoint Template Corporate Success Targets Umbrella Chart PPT Presentation Designs-These high quality, editable pre-designed powerpoint slides have been carefully created by our professional team to help you impress your audience. Each graphic in every slide is vector based and is 100% editable in powerpoint. Each and every property of any slide - color, size, shading etc can be modified to build an effective powerpoint presentation. Use these slides to convey complex business concepts in a simplified manner. Any text can be entered at any point in the powerpoint slide. Simply DOWNLOAD, TYPE and PRESENT! Locate problems with our PowerPoint Template Corporate Success Targets Umbrella Chart Ppt Presentation Designs. Download without worries with our money back guaranteee.
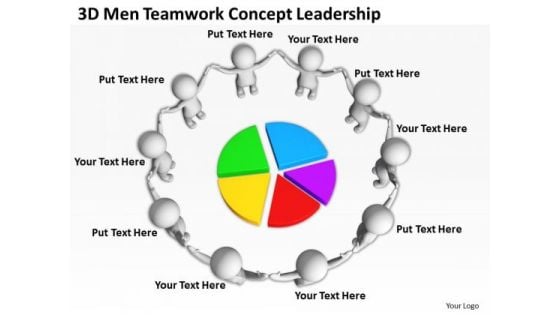
Business People Pictures Concept Leadership PowerPoint Templates Ppt Backgrounds For Slides
We present our business people pictures concept leadership PowerPoint templates PPT backgrounds for slides.Present our People PowerPoint Templates because Our PowerPoint Templates and Slides are like the strings of a tennis racquet. Well strung to help you serve aces. Use our Circle Charts PowerPoint Templates because Our PowerPoint Templates and Slides are effectively colour coded to prioritise your plans They automatically highlight the sequence of events you desire. Download our Business PowerPoint Templates because Our PowerPoint Templates and Slides are truly out of this world. Even the MIB duo has been keeping tabs on our team. Download and present our Puzzles or Jigsaws PowerPoint Templates because Our PowerPoint Templates and Slides offer you the widest possible range of options. Download our Shapes PowerPoint Templates because You can Hit a home run with our PowerPoint Templates and Slides. See your ideas sail into the minds of your audience.Use these PowerPoint slides for presentations relating to 3d, accounting, achievement, business, businesspeople, chart, communication,company, comparison, corporate, diagram, earn, forecast, future, gain, graph,graphic, group, grow, growth, guy, human, improve, improvement, increase,investment, isolated, job, man, measure, office, people, person, perspective, profit,progress, sign, small, staff, stat, success, symbol, team, teamwork, together, up,wealth, work. The prominent colors used in the PowerPoint template are White, Green, Blue. Our Business People Pictures Concept Leadership PowerPoint Templates Ppt Backgrounds For Slides create presentations that blow your audience away. With our money back guarantee you have nothing to lose.
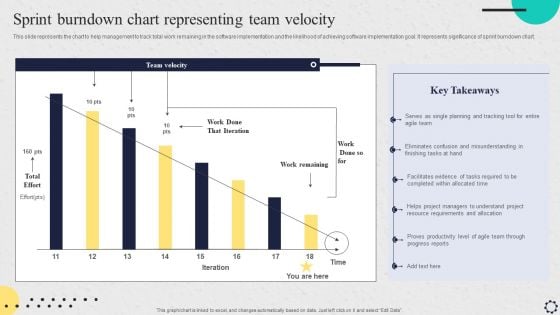
Software Implementation Strategy Sprint Burndown Chart Representing Team Velocity Brochure PDF
This slide represents the chart to help management to track total work remaining in the software implementation and the likelihood of achieving software implementation goal. It represents significance of sprint burndown chart. If your project calls for a presentation, then Slidegeeks is your go to partner because we have professionally designed, easy to edit templates that are perfect for any presentation. After downloading, you can easily edit Software Implementation Strategy Sprint Burndown Chart Representing Team Velocity Brochure PDF and make the changes accordingly. You can rearrange slides or fill them with different images. Check out all the handy templates.
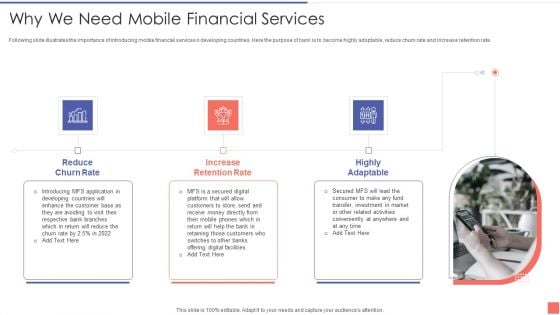
Providing Electronic Financial Services To Existing Consumers Why We Need Mobile Financial Services Themes PDF
Following slide illustrates the importance of introducing mobile financial services n developing countries. Here the purpose of bank is to become highly adoptable, reduce churn rate and increase retention rate. Presenting Providing Electronic Financial Services To Existing Consumers Why We Need Mobile Financial Services Themes PDF to provide visual cues and insights. Share and navigate important information on three stages that need your due attention. This template can be used to pitch topics like Developing, Application, Customers, Investment. In addtion, this PPT design contains high resolution images, graphics, etc, that are easily editable and available for immediate download.
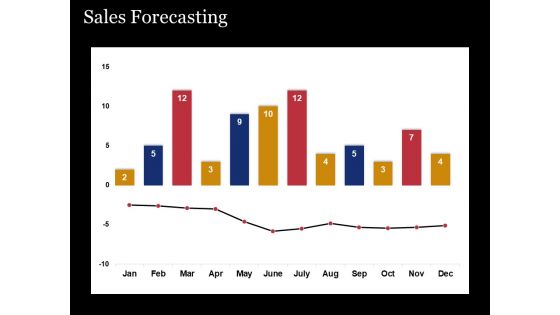
Sales Forecasting Template 2 Ppt PowerPoint Presentation Diagram Ppt
This is a sales forecasting template 2 ppt powerpoint presentation diagram ppt. This is a tweleve stage process. The stages in this process are finance, marketing, graph, business.
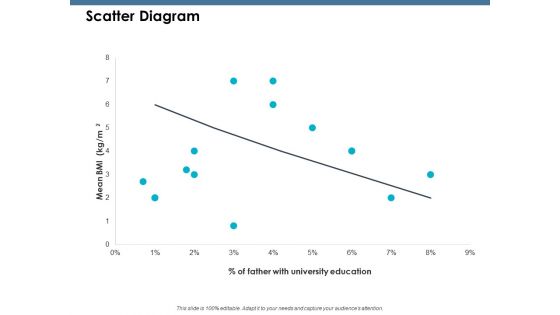
Scatter Diagram Ppt PowerPoint Presentation Pictures Graphics Design
This is a scatter diagram ppt powerpoint presentation pictures graphics design. This is a two stage process. The stages in this process are product, percentage, business, marketing.
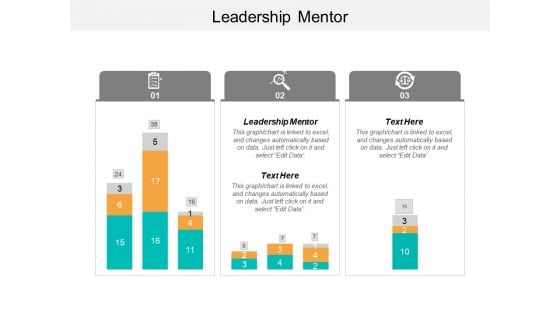
Leadership Mentor Ppt PowerPoint Presentation Diagram Ppt Cpb
This is a leadership mentor ppt powerpoint presentation diagram ppt cpb. This is a three stage process. The stages in this process are leadership mentor.
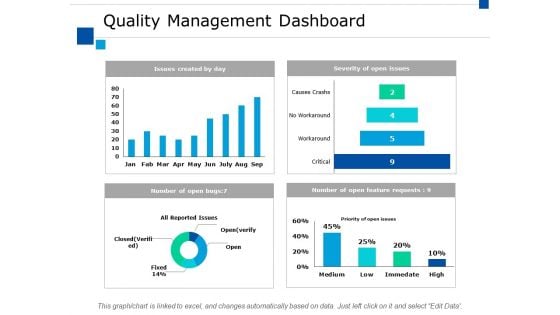
Quality Management Dashboard Ppt PowerPoint Presentation File Diagrams
This is a quality management dashboard ppt powerpoint presentation file diagrams. This is a four stage process. The stages in this process are finance, marketing, management, investment, analysis.
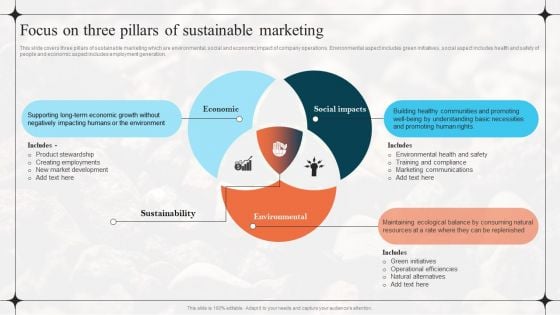
Diverting Attention From Conventional Focus On Three Pillars Of Sustainable Marketing Download PDF
This slide covers three pillars of sustainable marketing which are environmental, social and economic impact of company operations. Environmental aspect includes green initiatives, social aspect includes health and safety of people and economic aspect includes employment generation. Whether you have daily or monthly meetings, a brilliant presentation is necessary. Diverting Attention From Conventional Focus On Three Pillars Of Sustainable Marketing Download PDF can be your best option for delivering a presentation. Represent everything in detail using Diverting Attention From Conventional Focus On Three Pillars Of Sustainable Marketing Download PDF and make yourself stand out in meetings. The template is versatile and follows a structure that will cater to your requirements. All the templates prepared by Slidegeeks are easy to download and edit. Our research experts have taken care of the corporate themes as well. So, give it a try and see the results.
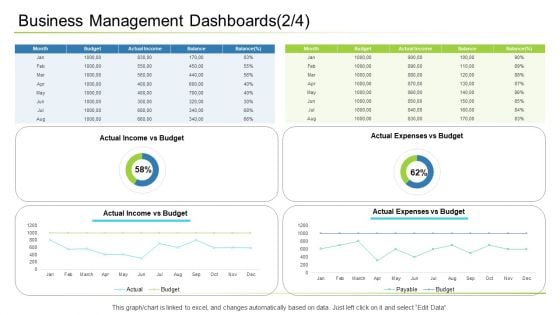
Business Management Dashboards Budget Ppt Diagram Lists PDF
Deliver and pitch your topic in the best possible manner with this business management dashboards budget ppt diagram lists pdf. Use them to share invaluable insights on budget, income, expenses and impress your audience. This template can be altered and modified as per your expectations. So, grab it now.
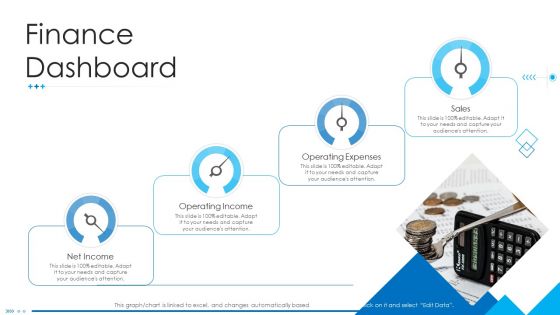
Business Scheme Management Synopsis Finance Dashboard Diagrams PDF
Deliver and pitch your topic in the best possible manner with this business scheme management synopsis finance dashboard diagrams pdf. Use them to share invaluable insights on operating, income, expenses, sales and impress your audience. This template can be altered and modified as per your expectations. So, grab it now.
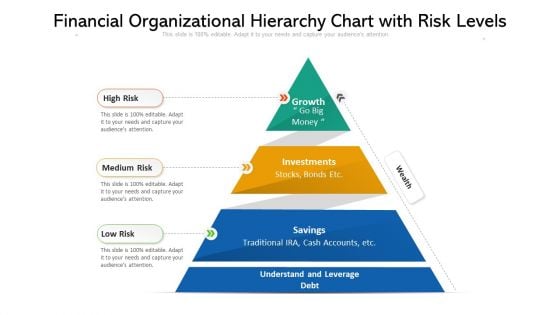
Financial Organizational Hierarchy Chart With Risk Levels Ppt PowerPoint Presentation Gallery Graphics Template PDF
Presenting financial organizational hierarchy chart with risk levels ppt powerpoint presentation gallery graphics template pdf to dispense important information. This template comprises three stages. It also presents valuable insights into the topics including growth, investments, wealth. This is a completely customizable PowerPoint theme that can be put to use immediately. So, download it and address the topic impactfully.
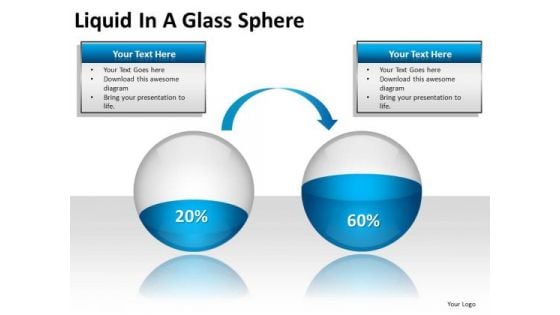
PowerPoint Themes Business Liquid Ppt Designs
PowerPoint Themes Business Liquid PPT Designs-These high quality powerpoint pre-designed slides and powerpoint templates have been carefully created by our professional team to help you impress your audience. All slides have been created and are 100% editable in powerpoint. Each and every property of any graphic - color, size, orientation, shading, outline etc. can be modified to help you build an effective powerpoint presentation. Any text can be entered at any point in the powerpoint template or slide. Simply DOWNLOAD, TYPE and PRESENT! Our content has been profitable for millions. Join the party with our PowerPoint Themes Business Liquid Ppt Designs. You'll always stay ahead of the game.
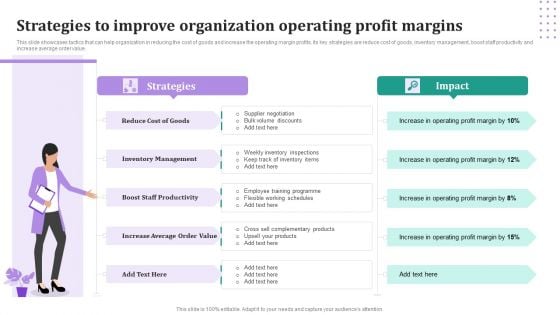
Strategies To Improve Organization Operating Profit Margins Summary PDF
This slide showcases tactics that can help organization in reducing the cost of goods and increase the operating margin profits. Its key strategies are reduce cost of goods, inventory management, boost staff productivity and increase average order value. Presenting Strategies To Improve Organization Operating Profit Margins Summary PDF to dispense important information. This template comprises one stages. It also presents valuable insights into the topics including Strategies, Reduce Cost Goods, Inventory Management, Boost Staff Productivity. This is a completely customizable PowerPoint theme that can be put to use immediately. So, download it and address the topic impactfully.
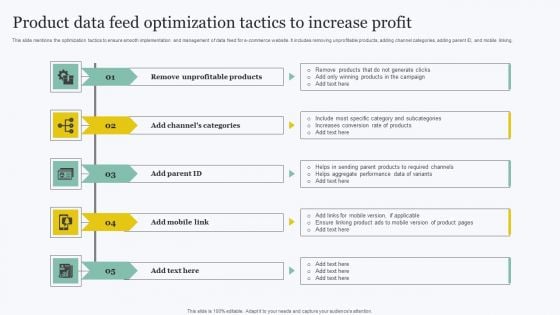
Product Data Feed Optimization Tactics To Increase Profit Inspiration PDF
This slide mentions the optimization tactics to ensure smooth implementation and management of data feed for e-commerce website. It includes removing unprofitable products, adding channel categories, adding parent ID, and mobile linking. Presenting Product Data Feed Optimization Tactics To Increase Profit Inspiration PDF to dispense important information. This template comprises five stages. It also presents valuable insights into the topics including Categories, Products, Profit. This is a completely customizable PowerPoint theme that can be put to use immediately. So, download it and address the topic impactfully.
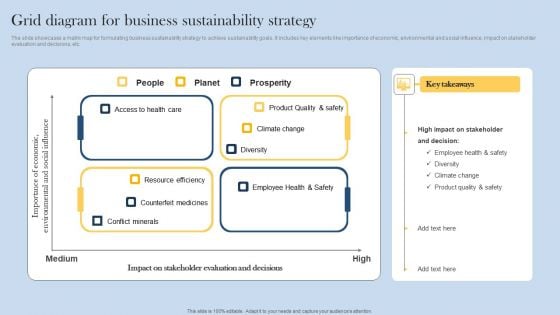
Grid Diagram For Business Sustainability Strategy Structure PDF
The slide showcases a matrix map for formulating business sustainability strategy to achieve sustainability goals. It includes key elements like importance of economic, environmental and social influence, impact on stakeholder evaluation and decisions, etc. Presenting Grid Diagram For Business Sustainability Strategy Structure PDF to dispense important information. This template comprises four stages. It also presents valuable insights into the topics including Employee Health Safety, Diversity, Climate Change. This is a completely customizable PowerPoint theme that can be put to use immediately. So, download it and address the topic impactfully.
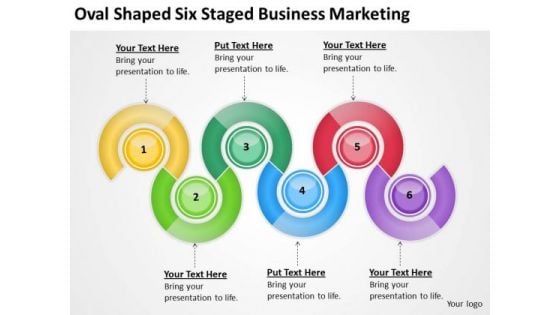
Shaped Six Staged Business Marketing Ppt Startup Plan Template PowerPoint Templates
We present our shaped six staged business marketing ppt startup plan template PowerPoint templates.Present our Business PowerPoint Templates because They will bring a lot to the table. Their alluring flavours will make your audience salivate. Use our Process and Flows PowerPoint Templates because Our PowerPoint Templates and Slides are created with admirable insight. Use them and give your group a sense of your logical mind. Download and present our Marketing PowerPoint Templates because Our PowerPoint Templates and Slides will fulfill your every need. Use them and effectively satisfy the desires of your audience. Download our Shapes PowerPoint Templates because Our PowerPoint Templates and Slides are topically designed to provide an attractive backdrop to any subject. Present our Flow Charts PowerPoint Templates because Our PowerPoint Templates and Slides will let you Clearly mark the path for others to follow.Use these PowerPoint slides for presentations relating to Personality, flow, diagram, process, business, star, model, segment, conscientiousness, green, segmented, psychology, extraversion, red, circle, shape, graph, illustration, chart, pointed, clipart, stages, clip, blue, info graphic, five, art . The prominent colors used in the PowerPoint template are Yellow, Green, Red. Perform admirably with our Shaped Six Staged Business Marketing Ppt Startup Plan Template PowerPoint Templates. Download without worries with our money back guaranteee.
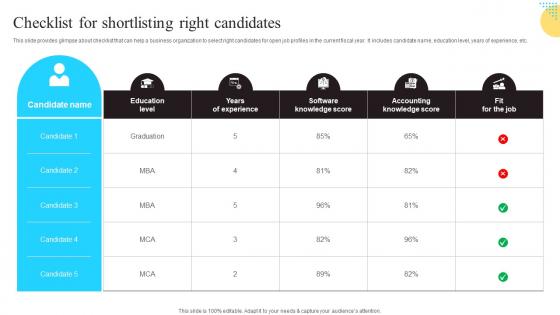
Checklist For Shortlisting Right Candidates Enhancing Workforce Productivity Using HR Themes Pdf
This slide provides glimpse about checklist that can help a business organization to select right candidates for open job profiles in the current fiscal year. It includes candidate name,education level,years of experience,etc.Want to ace your presentation in front of a live audience Our Checklist For Shortlisting Right Candidates Enhancing Workforce Productivity Using HR Themes Pdf can help you do that by engaging all the users towards you.. Slidegeeks experts have put their efforts and expertise into creating these impeccable powerpoint presentations so that you can communicate your ideas clearly. Moreover,all the templates are customizable,and easy-to-edit and downloadable. Use these for both personal and commercial use. This slide provides glimpse about checklist that can help a business organization to select right candidates for open job profiles in the current fiscal year. It includes candidate name, education level, years of experience, etc.
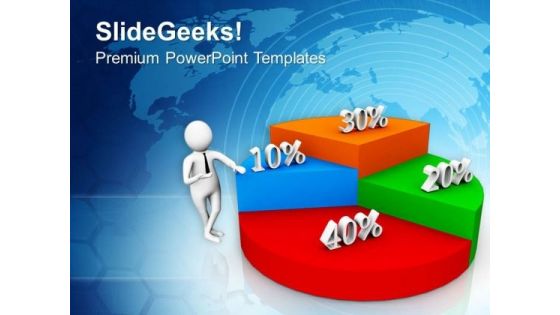
Business Man Explaining Profit Sharing Ratio PowerPoint Templates Ppt Backgrounds For Slides 0713
Motivate the disheartened with our Business Man Explaining Profit Sharing Ratio PowerPoint Templates PPT Backgrounds For Slides. Inspire them with the goodness in you. Discover decisive moments with our Pie Charts PowerPoint Templates. They help make that crucial difference. Our Finance PowerPoint Templates will help make your dreams come true. Your thoughts will weave the magic for you. Consider your promotion a surety with our Business Man Explaining Profit Sharing Ratio PowerPoint Templates Ppt Backgrounds For Slides 0713. You will come out on top.

Data Collection Scatter Diagram Ppt PowerPoint Presentation Gallery Graphics Example
This is a data collection scatter diagram ppt powerpoint presentation gallery graphics example. This is a three stage process. The stages in this process are line chart, finance, marketing, management, investment.
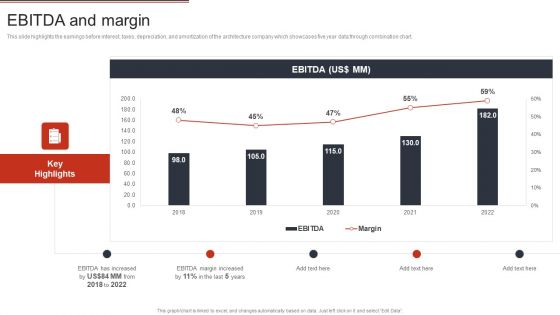
Building Design Firm Details Ebitda And Margin Ppt Professional Shapes PDF
This slide highlights the earnings before interest, taxes, depreciation, and amortization of the architecture company which showcases five year data through combination chart. Deliver and pitch your topic in the best possible manner with this Building Design Firm Details Ebitda And Margin Ppt Professional Shapes PDF. Use them to share invaluable insights on EBITDA Margin Increased, 2018 To 2020 and impress your audience. This template can be altered and modified as per your expectations. So, grab it now.
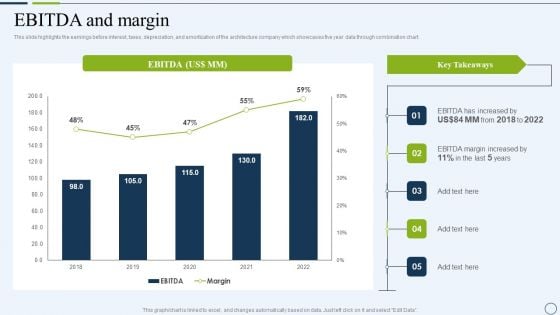
Commercial And Urban Architect Business Profile Ebitda And Margin Professional PDF
This slide highlights the earnings before interest, taxes, depreciation, and amortization of the architecture company which showcases five year data through combination chart. Deliver and pitch your topic in the best possible manner with this Commercial And Urban Architect Business Profile Ebitda And Margin Professional PDF. Use them to share invaluable insights on EBITDA And Margin and impress your audience. This template can be altered and modified as per your expectations. So, grab it now.
Commercial Construction And Architecture Firm Ebitda And Margin Mockup PDF
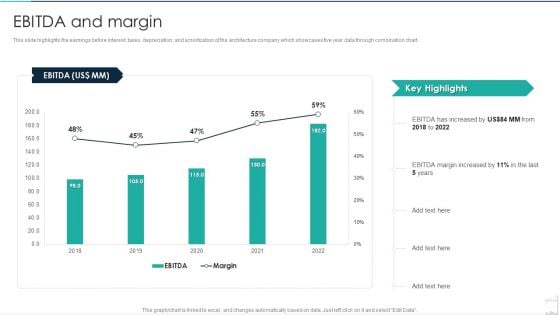
This slide highlights the earnings before interest, taxes, depreciation, and amortization of the architecture company which showcases five year data through combination chart. Deliver and pitch your topic in the best possible manner with this Commercial Construction And Architecture Firm Ebitda And Margin Mockup PDF. Use them to share invaluable insights on Ebitda And Margin and impress your audience. This template can be altered and modified as per your expectations. So, grab it now.
Business Diagram Drops For Financial Accounting And Reporting Presentation Template
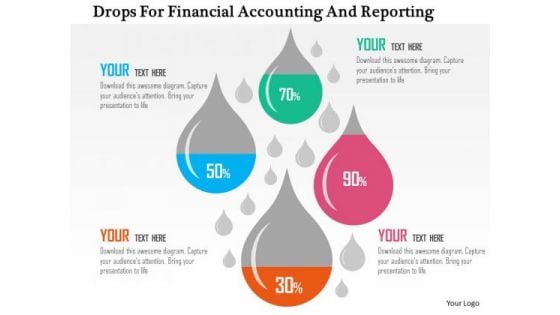
This business diagram has been designed with drops displaying financial ratios. Download this diagram to depict financial and accounting ratios. Use this slide to build quality presentations for your viewers.
Elix Incubator Venture Capital Funding Elixs Competitive Matrix Background PDF
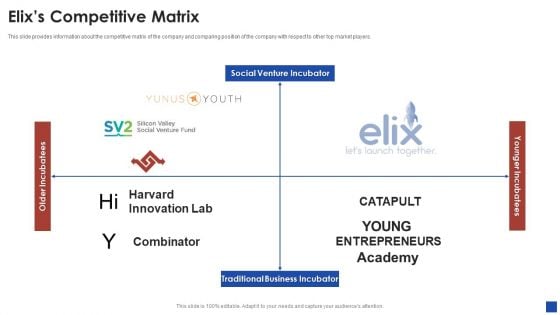
This slide provides information about the competitive matrix of the company and comparing position of the company with respect to other top market players. Presenting elix incubator venture capital funding elixs competitive matrix background pdf to provide visual cues and insights. Share and navigate important information on four stages that need your due attention. This template can be used to pitch topics like elixs competitive matrix. In addtion, this PPT design contains high resolution images, graphics, etc, that are easily editable and available for immediate download.
Cab Aggregator Venture Capital Funding Understanding Taxi Market Microsoft PDF
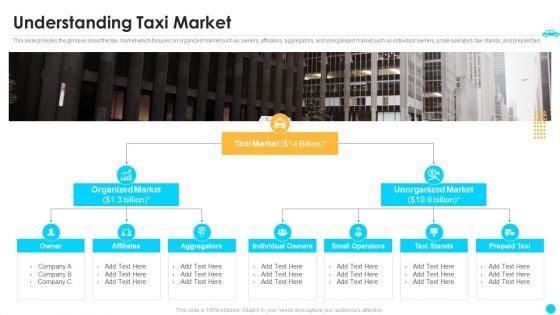
This slide provides the glimpse about the taxi market which focuses on organized market such as owners, affiliators, aggregators, and unorganized market such as individual owners, small operators, taxi stands, and prepaid taxi. This is a cab aggregator venture capital funding understanding taxi market microsoft pdf template with various stages. Focus and dispense information on two stages using this creative set, that comes with editable features. It contains large content boxes to add your information on topics like unorganized market, organized market, taxi market. You can also showcase facts, figures, and other relevant content using this PPT layout. Grab it now.
Determine IT Project Portfolio Management Tracking Dashboard Ppt Slides Pictures PDF
This slide provides information regarding IT project portfolio management tracking dashboard including details about allocated budget across portfolios, used budget percentage, estimated vs. actual cost, etc. Deliver an awe inspiring pitch with this creative determine it project portfolio management tracking dashboard ppt slides pictures pdf bundle. Topics like budget across portfolios, budget percentage, financials can be discussed with this completely editable template. It is available for immediate download depending on the needs and requirements of the user.
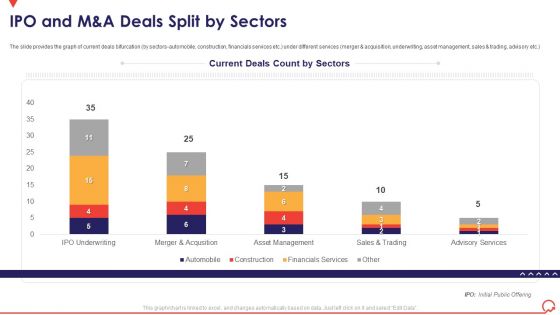
Pitch Book Capital Funding Deal IPO Pitchbook IPO And Manda Deals Split By Sectors Ideas PDF
The slide provides the graph of current deals bifurcation by sectors automobile, construction, financials services etc. under different services merger and acquisition, underwriting, asset management, sales and trading, advisory etc. Deliver and pitch your topic in the best possible manner with this pitch book capital funding deal ipo pitchbook ipo and manda deals split by sectors ideas pdf. Use them to share invaluable insights on ipo underwriting, merger and acqusition, asset management, sales and trading and impress your audience. This template can be altered and modified as per your expectations. So, grab it now.
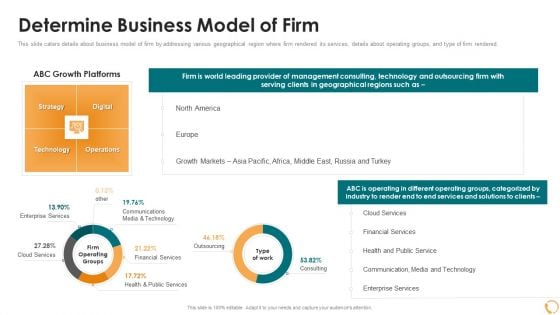
services sales capital investment pitch deck determine business model of firm pictures pdf
This slide caters details about business model of firm by addressing various geographical region where firm rendered its services, details about operating groups, and type of firm rendered. Deliver an awe inspiring pitch with this creative services sales capital investment pitch deck determine business model of firm pictures pdf bundle. Topics like enterprise services, cloud services, financial services, outsourcing, health and public services can be discussed with this completely editable template. It is available for immediate download depending on the needs and requirements of the user.
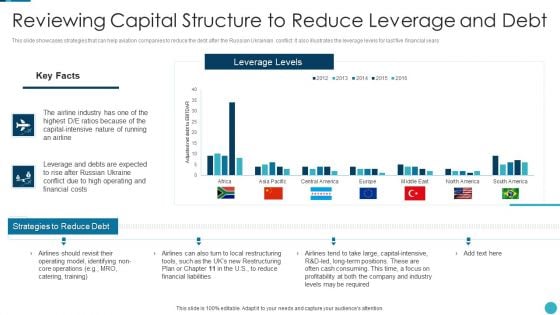
Russia Ukraine War Influence On Airline Sector Reviewing Capital Structure To Reduce Leverage Pictures PDF
This slide showcases strategies that can help aviation companies to reduce the debt after the Russian Ukrainian conflict. It also illustrates the leverage levels for last five financial years Deliver and pitch your topic in the best possible manner with this russia ukraine war influence on airline sector reviewing capital structure to reduce leverage pictures pdf Use them to share invaluable insights on strategies to reduce debt, leverage levels, restructuring tools and impress your audience. This template can be altered and modified as per your expectations. So, grab it now.

Income Pipeline Marketing Communications Ppt PowerPoint Presentation Complete Deck With Slides
This income pipeline marketing communications ppt powerpoint presentation complete deck with slides acts as backup support for your ideas, vision, thoughts, etc. Use it to present a thorough understanding of the topic. This PPT slideshow can be utilized for both in-house and outside presentations depending upon your needs and business demands. Entailing twelve slides with a consistent design and theme, this template will make a solid use case. As it is intuitively designed, it suits every business vertical and industry. All you have to do is make a few tweaks in the content or any other component to design unique presentations. The biggest advantage of this complete deck is that it can be personalized multiple times once downloaded. The color, design, shapes, and other elements are free to modify to add personal touches. You can also insert your logo design in this PPT layout. Therefore a well-thought and crafted presentation can be delivered with ease and precision by downloading this income pipeline marketing communications ppt powerpoint presentation complete deck with slides PPT slideshow.
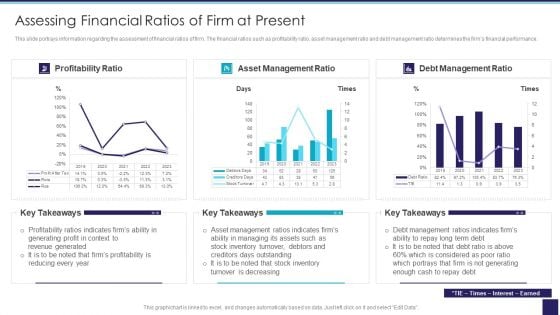
Organizational Issue Resolution Tool Assessing Financial Ratios Of Firm At Present Template PDF
This slide portrays information regarding the assessment of financial ratios of firm. The financial ratios such as profitability ratio, asset management ratio and debt management ratio determines the firms financial performance. Deliver and pitch your topic in the best possible manner with this Organizational Issue Resolution Tool Assessing Financial Ratios Of Firm At Present Template PDF. Use them to share invaluable insights on Profitability Ratio, Management Ratio, Assessing Financial and impress your audience. This template can be altered and modified as per your expectations. So, grab it now.
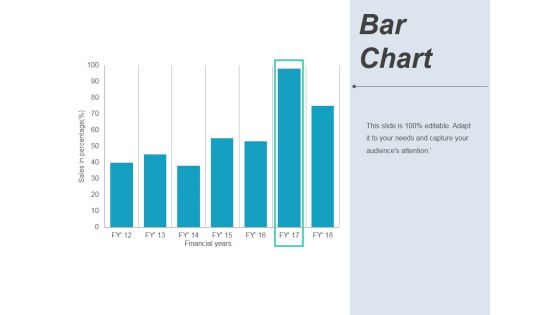
Bar Chart Ppt PowerPoint Presentation Pictures Background Image
This is a bar chart ppt powerpoint presentation pictures background image. This is a seven stage process. The stages in this process are financial years, sales in percentage, graph, business.
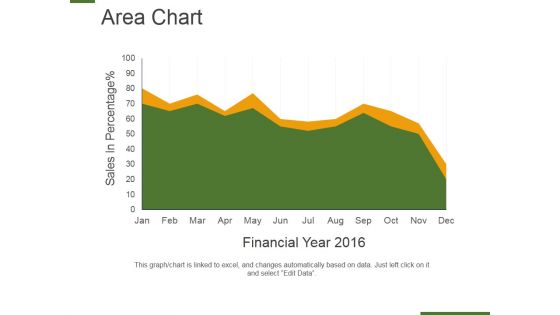
Area Chart Ppt PowerPoint Presentation Layouts Graphics Example
This is a area chart ppt powerpoint presentation layouts graphics example. This is a two stage process. The stages in this process are sales in percentage, financial year, business, marketing, presentation.
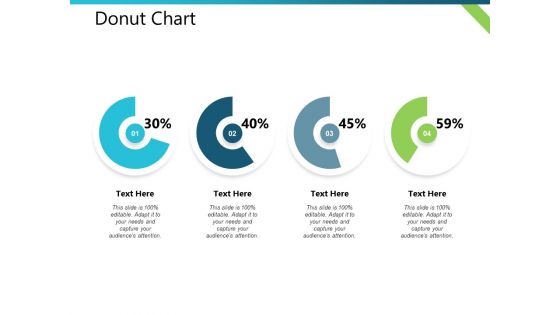
Donut Chart Distribution Plan Ppt PowerPoint Presentation Visual Aids Outline
This is a donut chart distribution plan ppt powerpoint presentation visual aids outline. This is a four stage process. The stages in this process are business, management, financial, marketing, strategy.
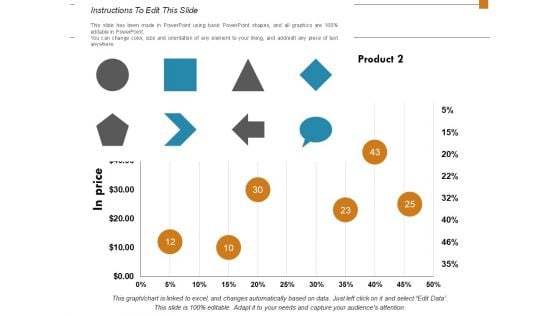
Scatter Bubble Chart Finance Ppt Powerpoint Presentation Layouts Summary
This is a scatter bubble chart finance ppt powerpoint presentation layouts summary. This is a two stage process. The stages in this process are financial, minimum, maximum, marketing, strategy.
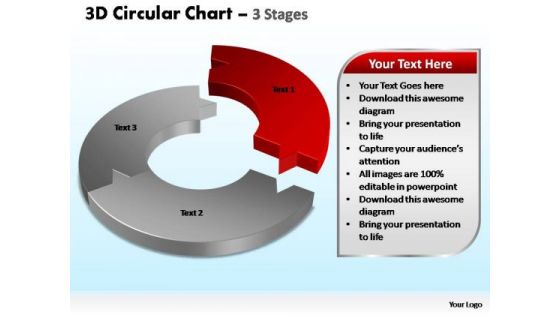
PowerPoint Slide Leadership Circular Chart Leadership
PowerPoint_Slide_Leadership_circular_chart_Leadership-The Circle of Life - a concept emmbedded in our minds and hence easy to comprehend. Life and Business is made up of processes comprising stages that flow from one to another. An excellent graphic to attract the attention of and understanding by your audience to improve earnings. Give a fillip to your campaign. Give it a fitting finale with our PowerPoint Slide Leadership Circular Chart Leadership.

PowerPoint Slidelayout Image Circular Chart Ppt Backgrounds
PowerPoint_Slidelayout_Image_circular_chart_PPT_Backgrounds-The Circle of Life - a concept emmbedded in our minds and hence easy to comprehend. Life and Business is made up of processes comprising stages that flow from one to another. An excellent graphic to attract the attention of and understanding by your audience to improve earnings. Put your best foot forward with our PowerPoint Slidelayout Image Circular Chart Ppt Backgrounds. You will appear that much better.
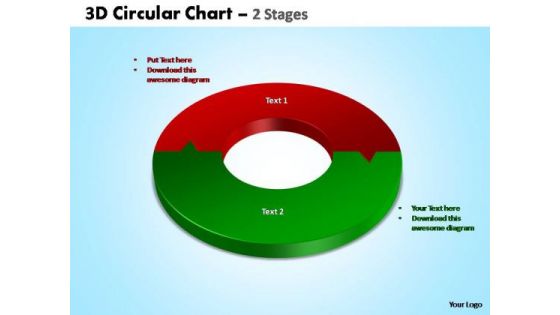
PowerPoint Slidelayout Image Circular Chart Ppt Presentation
PowerPoint_Slidelayout_Image_circular_chart_PPT_Presentation-The Circle of Life - a concept emmbedded in our minds and hence easy to comprehend. Life and Business is made up of processes comprising stages that flow from one to another. An excellent graphic to attract the attention of and understanding by your audience to improve earnings. Our PowerPoint Slidelayout Image Circular Chart Ppt Presentation will carry any burden. Be assured that they will take you far.
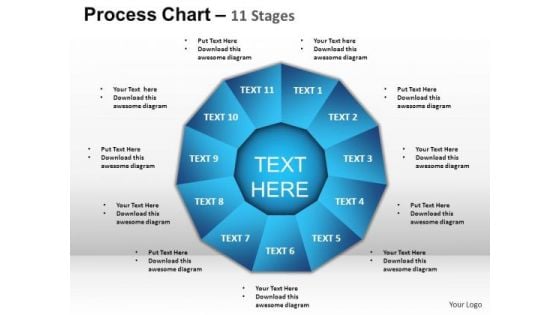
PowerPoint Templates Download Process Chart Ppt Slide
PowerPoint Templates Download process chart PPT Slide-The Circle of Life - a concept emmbedded in our minds and hence easy to comprehend. Life and Business is made up of processes comprising stages that flow from one to another. An excellent graphic to attract the attention of and understanding by your audience to improve earnings. Give them a big deal with our PowerPoint Templates Download Process Chart Ppt Slide. The audience will be unabashedly appreciative.
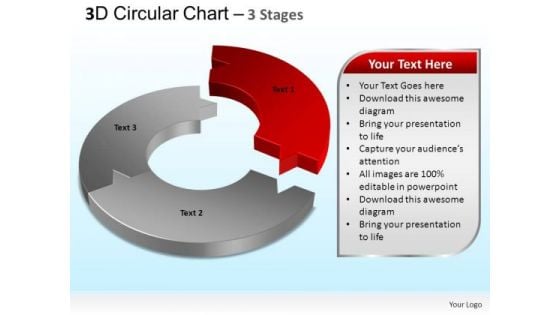
PowerPoint Templates Marketing Circular Chart Ppt Backgrounds
PowerPoint Templates Marketing circular chart PPT Backgrounds-The Circle of Life - a concept emmbedded in our minds and hence easy to comprehend. Life and Business is made up of processes comprising stages that flow from one to another. An excellent graphic to attract the attention of and understanding by your audience to improve earnings. Educate them on the actions required. Go through the drill with our PowerPoint Templates Marketing Circular Chart Ppt Backgrounds.
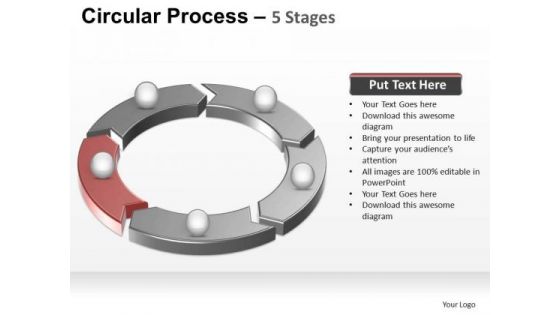
PowerPoint Layout Chart Circular Process Ppt Templates
PowerPoint Layout Chart Circular Process PPT Templates-The Circle of Life - a concept emmbedded in our minds and hence easy to comprehend. Life and Business is made up of processes comprising stages that flow from one to another. An excellent graphic to attract the attention of and understanding by your audience to improve earnings. Save time with our PowerPoint Layout Chart Circular Process Ppt Templates. You will come out on top.
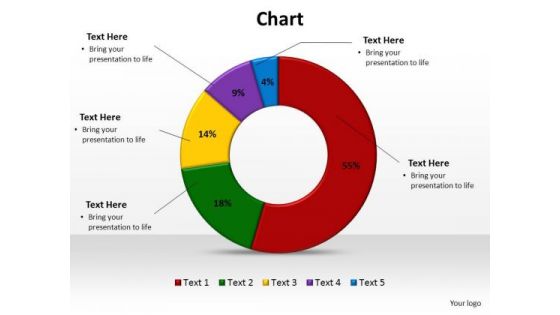
PowerPoint Layouts Image Chart Ppt Design
PowerPoint Layouts Image Chart PPT Design-The Circle of Life - a concept emmbedded in our minds and hence easy to comprehend. Life and Business is made up of processes comprising stages that flow from one to another. An excellent graphic to attract the attention of and understanding by your audience to improve earnings. Make them smell the coffee with our PowerPoint Layouts Image Chart Ppt Design. Help them come to the correct conclusion.
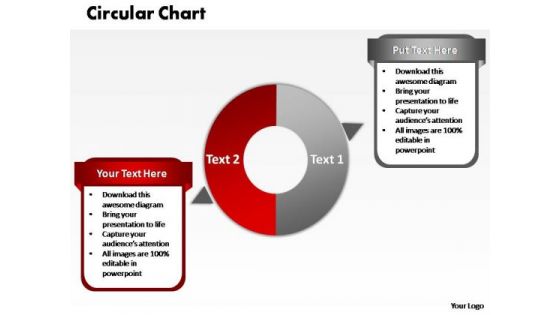
PowerPoint Slide Image Circular Chart Ppt Presentation
PowerPoint Slide Image Circular Chart PPT Presentation-The Circle of Life - a concept emmbedded in our minds and hence easy to comprehend. Life and Business is made up of processes comprising stages that flow from one to another. An excellent graphic to attract the attention of and understanding by your audience to improve earnings. Your ideas will click with our PowerPoint Slide Image Circular Chart Ppt Presentation. The audience will be in complete agreement.
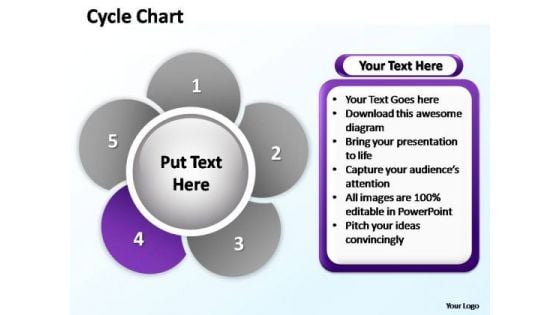
PowerPoint Designs Sales Cycle Chart Ppt Slides
PowerPoint_Designs_Sales_Cycle_Chart_PPT_Slides.pptx-The Circle of Life - a concept emmbedded in our minds and hence easy to comprehend. Life and Business is made up of processes comprising stages that flow from one to another. An excellent graphic to attract the attention of and understanding by your audience to improve earnings. Make a beautiful presentation with our PowerPoint Designs Sales Cycle Chart Ppt Slides. Just download, type and present.
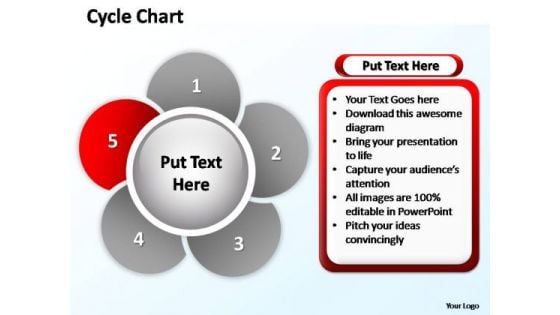
PowerPoint Layout Process Cycle Chart Ppt Backgrounds
PowerPoint_Layout_Process_Cycle_Chart_PPT_Backgrounds.pptx-The Circle of Life - a concept emmbedded in our minds and hence easy to comprehend. Life and Business is made up of processes comprising stages that flow from one to another. An excellent graphic to attract the attention of and understanding by your audience to improve earnings. Establish your credentials with our PowerPoint Layout Process Cycle Chart Ppt Backgrounds. They give you an air of authority.
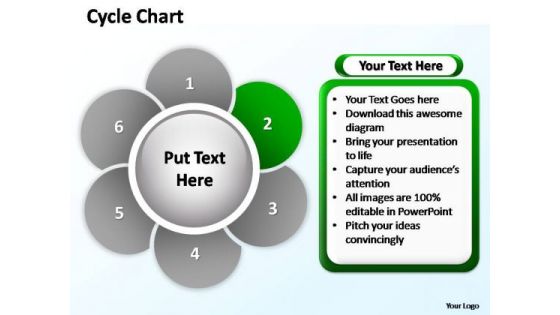
PowerPoint Layouts Success Cycle Chart Ppt Process
PowerPoint_Layouts_Success_Cycle_Chart__PPT_Process.pptx-The Circle of Life - a concept emmbedded in our minds and hence easy to comprehend. Life and Business is made up of processes comprising stages that flow from one to another. An excellent graphic to attract the attention of and understanding by your audience to improve earnings. Fight fair with our PowerPoint Layouts Success Cycle Chart Ppt Process. They adhere to the ethics of any battlefield.
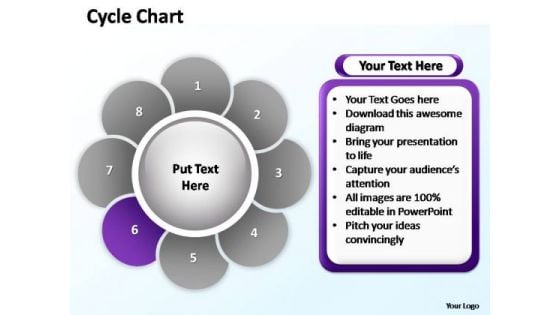
PowerPoint Presentation Company Cycle Chart Ppt Slide
PowerPoint_Presentation_Company_Cycle_Chart_PPT_Slide.pptx-The Circle of Life - a concept emmbedded in our minds and hence easy to comprehend. Life and Business is made up of processes comprising stages that flow from one to another. An excellent graphic to attract the attention of and understanding by your audience to improve earnings. Display visionary leadership with our PowerPoint Presentation Company Cycle Chart Ppt Slide. They will make you look good.
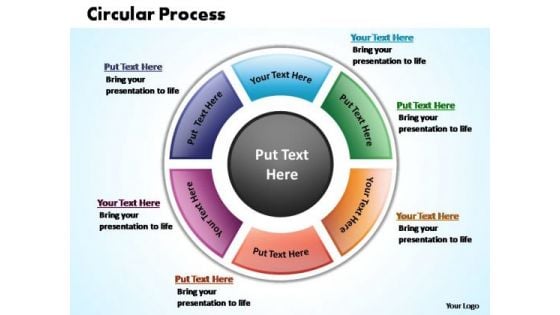
PowerPoint Process Chart Circular Process Ppt Template
PowerPoint Process Chart Circular Process PPT Template-The Circle of Life - a concept emmbedded in our minds and hence easy to comprehend. Life and Business is made up of processes comprising stages that flow from one to another. An excellent graphic to attract the attention of and understanding by your audience to improve earnings. Give a fillip to your campaign. Give it a fitting finale with our PowerPoint Process Chart Circular Process Ppt Template.
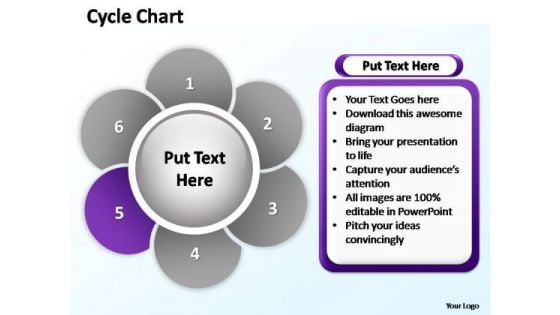
PowerPoint Process Editable Cycle Chart Ppt Template
PowerPoint Process Editable Cycle Chart PPT Template-The Circle of Life - a concept emmbedded in our minds and hence easy to comprehend. Life and Business is made up of processes comprising stages that flow from one to another. An excellent graphic to attract the attention of and understanding by your audience to improve earnings. Inform your audience with our PowerPoint Process Editable Cycle Chart Ppt Template. Make sure your presentation gets the attention it deserves.
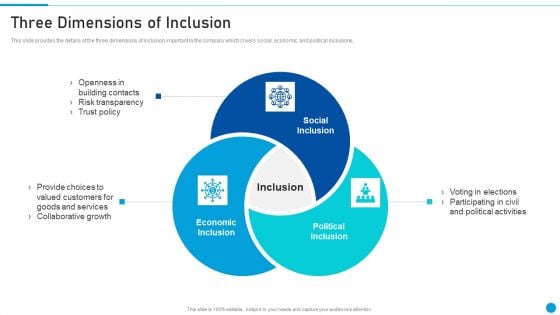
Embed Diversity And Inclusion Three Dimensions Of Inclusion Structure PDF
This slide provides the details of the three dimensions of inclusion important in the company which covers social, economic, and political inclusions. This is a Embed Diversity And Inclusion Three Dimensions Of Inclusion Structure PDF template with various stages. Focus and dispense information on three stages using this creative set, that comes with editable features. It contains large content boxes to add your information on topics like Social Inclusion, Economic Inclusion, Political Inclusion, Inclusion. You can also showcase facts, figures, and other relevant content using this PPT layout. Grab it now.
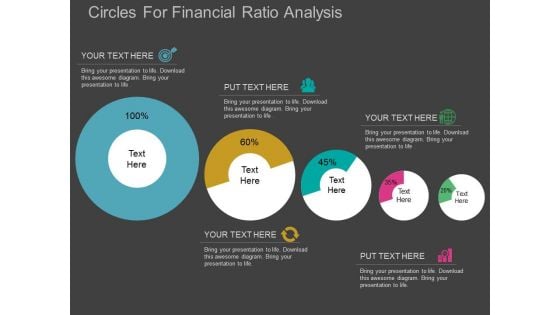
Circles For Financial Ratio Analysis Powerpoint Template
This PowerPoint diagram contains circles in upward trend. Download this diagram slide to display financial ratio analysis. This diagram is editable you can edit text, color, shade and style as per you need.
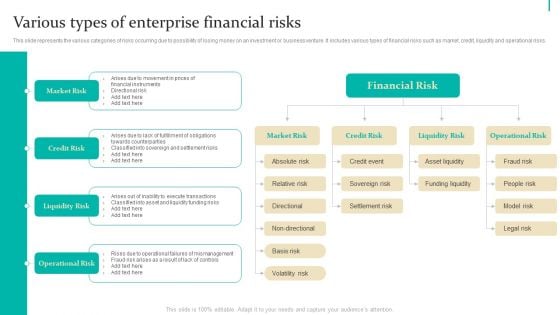
Enterprise Risk Management Various Types Of Enterprise Financial Risks Structure PDF
This slide represents the various categories of risks occurring due to possibility of losing money on an investment or business venture. It includes various types of financial risks such as market, credit, liquidity and operational risks. Slidegeeks is here to make your presentations a breeze with Enterprise Risk Management Various Types Of Enterprise Financial Risks Structure PDF With our easy-to-use and customizable templates, you can focus on delivering your ideas rather than worrying about formatting. With a variety of designs to choose from, youre sure to find one that suits your needs. And with animations and unique photos, illustrations, and fonts, you can make your presentation pop. So whether youre giving a sales pitch or presenting to the board, make sure to check out Slidegeeks first.

Ppt Assembly Of Business PowerPoint Presentation People With 3d Pie Chart Templates
PPT assembly of business powerpoint presentation people with 3d pie chart Templates-Diagrams for PowerPoint Circle arrow offer an elegant alternative to the boring bullet points used in Presentations. The items are professionally animated and are easily editable. This diagram is useful to show interrelated factors, give and take interaction etc.-PPT assembly of business powerpoint presentation people with 3d pie chart Templates-Adult, Art, Background, Business, Career, Chart, Communication, Concept, Conference, Corporate, Creative, Design, Economy, Executive, Finance, Group, Growth, Idea, Illustration, Leadership, Meeting, New, Occupation, Office, People, Person, Progress, Silhouette, Space, Speaking, Standing, Success Execute plans with our Ppt Assembly Of Business PowerPoint Presentation People With 3d Pie Chart Templates. Download without worries with our money back guaranteee.
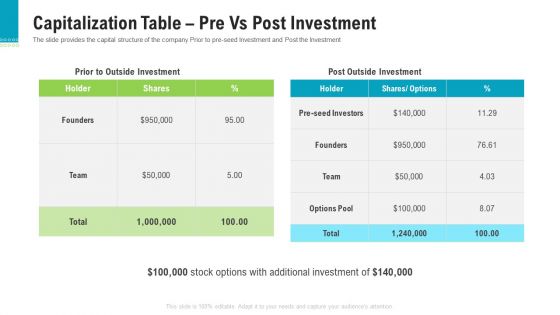
Investor Pitch Deck To Generate Capital From Pre Seed Round Capitalization Table Pre Vs Post Investment Diagrams PDF
The slide provides the capital structure of the company Prior to pre seed Investment and Post the Investment. Deliver an awe inspiring pitch with this creative investor pitch deck to generate capital from pre seed round capitalization table pre vs post investment diagrams pdf bundle. Topics like prior to outside investment, post outside investment, founders can be discussed with this completely editable template. It is available for immediate download depending on the needs and requirements of the user.
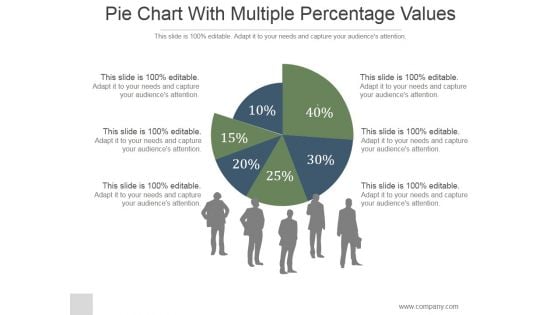
Pie Chart With Multiple Percentage Values Ppt PowerPoint Presentation Show
This is a pie chart with multiple percentage values ppt powerpoint presentation show. This is a six stage process. The stages in this process are pie, finance, people, silhouettes, communication.
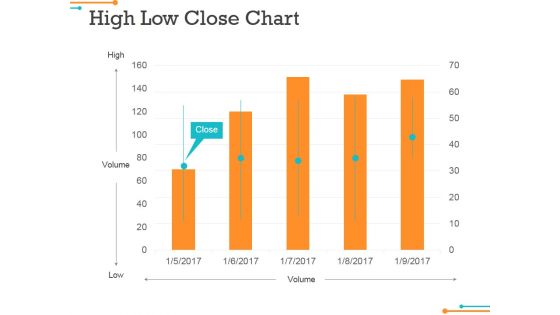
High Low Close Chart Ppt Powerpoint Presentation Gallery Slides
This is a high low close chart ppt powerpoint presentation gallery slides. This is a five stage process. The stages in this process are close, volume, high, low, graph.

Our Charts And Graphs Ppt PowerPoint Presentation File Visuals
This is a our charts and graphs ppt powerpoint presentation file visuals. This is a one stage process. The stages in this process are business, strategy, marketing, analysis, finance.

High Low Close Chart Ppt PowerPoint Presentation Inspiration Professional
This is a high low close chart ppt powerpoint presentation inspiration professional. This is a ten stage process. The stages in this process are business, strategy, analysis, planning, high, volume, low.
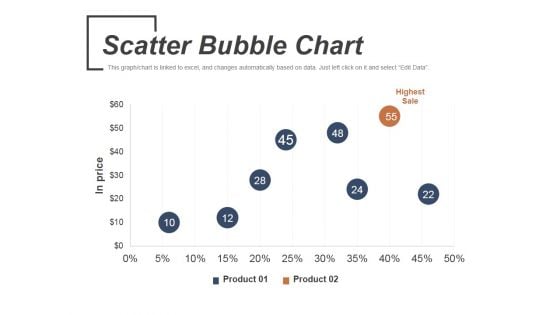
Scatter Bubble Chart Ppt PowerPoint Presentation Infographic Template Graphics
This is a scatter bubble chart ppt powerpoint presentation infographic template graphics. This is a two stage process. The stages in this process are highest sale, product, in price.
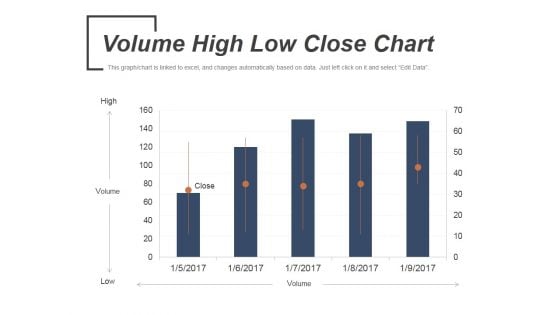
Volume High Low Close Chart Ppt PowerPoint Presentation Slides Portrait
This is a volume high low close chart ppt powerpoint presentation slides portrait. This is a five stage process. The stages in this process are volume, low, high, open, close.
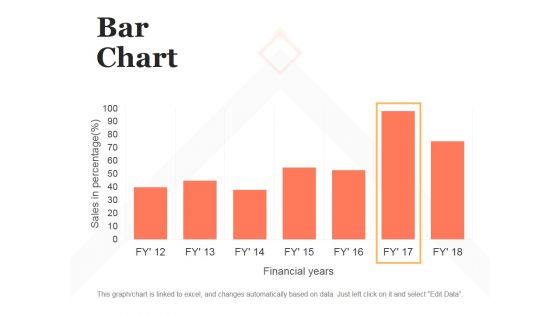
Bar Chart Ppt PowerPoint Presentation Infographic Template Brochure
This is a bar chart ppt powerpoint presentation infographic template brochure. This is a seven stage process. The stages in this process are bar graph, finance, marketing, strategy, analysis, business.
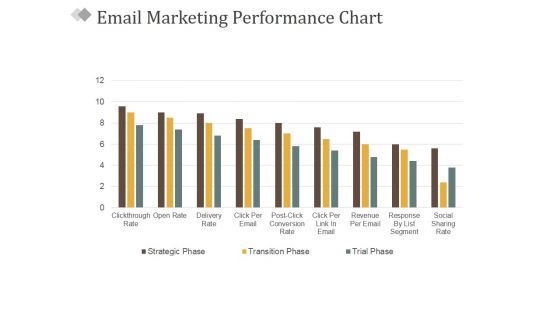
Email Marketing Performance Chart Ppt PowerPoint Presentation Gallery Elements
This is a email marketing performance chart ppt powerpoint presentation gallery elements. This is a nine stage process. The stages in this process are business, marketing, success, management, bar graph.
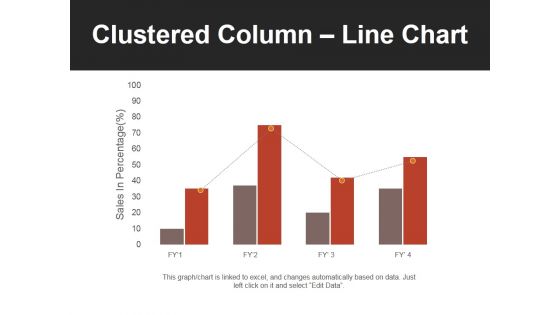
Clustered Column Line Chart Ppt PowerPoint Presentation Professional Slides
This is a clustered column line chart ppt powerpoint presentation professional slides. This is a four stage process. The stages in this process are bar, finance, business, marketing, growth.
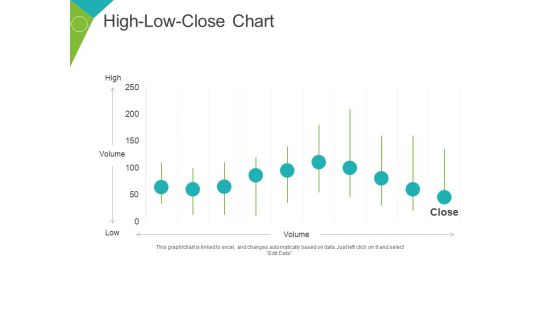
High Low Close Chart Ppt PowerPoint Presentation Layouts Guide
This is a high low close chart ppt powerpoint presentation layouts guide. This is a ten stage process. The stages in this process are high, volume, low, business, marketing, finance.
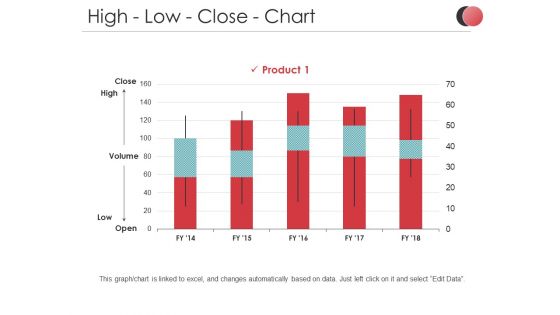
High Low Close Chart Ppt PowerPoint Presentation Ideas Brochure
This is a high low close chart ppt powerpoint presentation ideas brochure. This is a three stage process. The stages in this process are in percentage, product, business, marketing, finance.
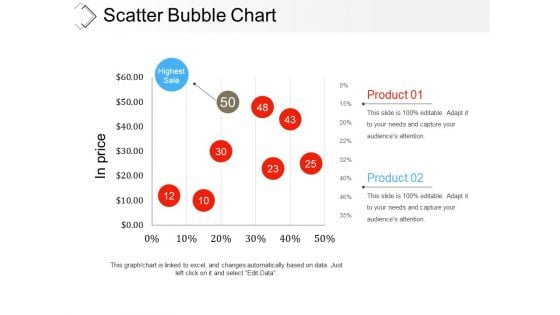
Scatter Bubble Chart Ppt PowerPoint Presentation Infographic Template Examples
This is a scatter bubble chart ppt powerpoint presentation infographic template examples. This is a two stage process. The stages in this process are highest sale, product, in price, finance, business.
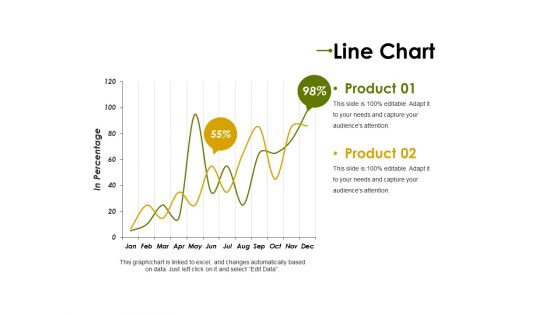
Line Chart Ppt PowerPoint Presentation Professional Clipart Images
This is a line chart ppt powerpoint presentation professional clipart images. This is a two stage process. The stages in this process are product, in percentage, graph, percentage, finance, business.
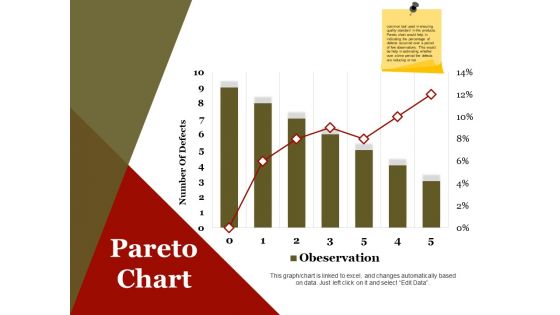
Pareto Chart Ppt PowerPoint Presentation Infographics Design Inspiration
This is a pareto chart ppt powerpoint presentation infographics design inspiration. This is a seven stage process. The stages in this process are number of defects, business, marketing, finance.
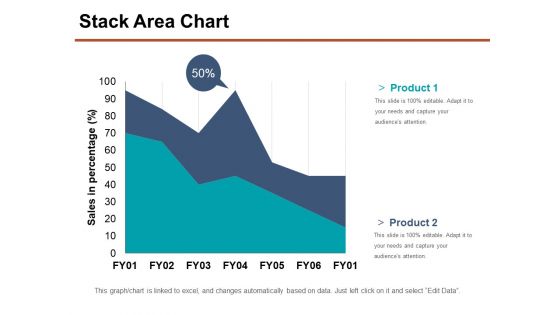
Stack Area Chart Ppt PowerPoint Presentation Show Samples
This is a stack area chart ppt powerpoint presentation show samples. This is a two stage process. The stages in this process are product, sales in percentage, business, marketing, percentage.
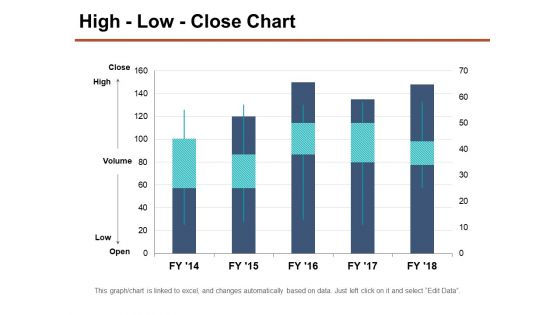
High Low Close Chart Ppt PowerPoint Presentation Layouts Objects
This is a high low close chart ppt powerpoint presentation layouts objects. This is a five stage process. The stages in this process are high, volume, low, business, marketing.
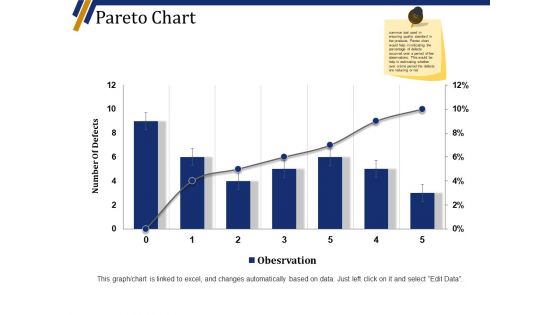
Pareto Chart Ppt PowerPoint Presentation File Infographic Template
This is a pareto chart ppt powerpoint presentation file infographic template. This is a six stage process. The stages in this process are number of defects, business, marketing, graph.
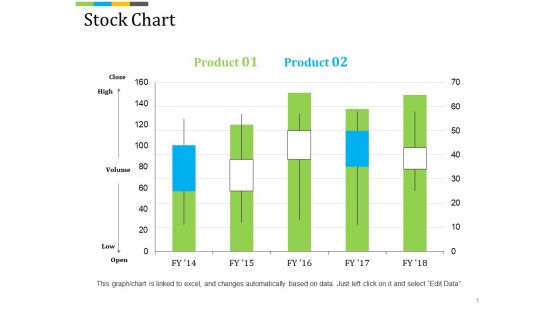
Stock Chart Ppt PowerPoint Presentation Professional Background Image
This is a stock chart ppt powerpoint presentation professional background image. This is a five stage process. The stages in this process are high, volume, low, finance, business, marketing.
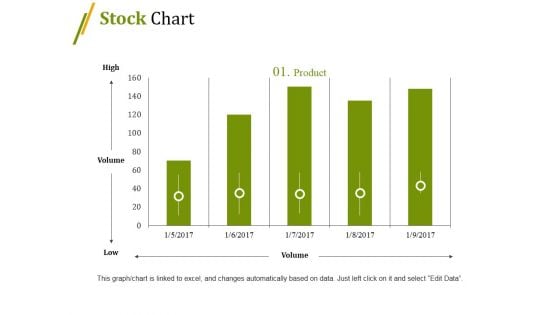
Stock Chart Ppt PowerPoint Presentation Summary File Formats
This is a stock chart ppt powerpoint presentation summary file formats. This is a five stage process. The stages in this process are high, volume, low, business, graph, finance.
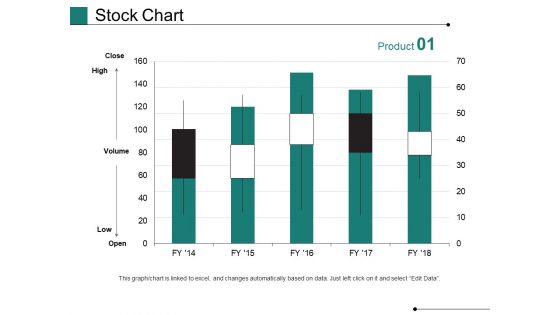
Stock Chart Ppt PowerPoint Presentation Pictures Graphics Design
This is a stock chart ppt powerpoint presentation pictures graphics design. This is a five stage process. The stages in this process are high, volume, low, business, marketing, graph.
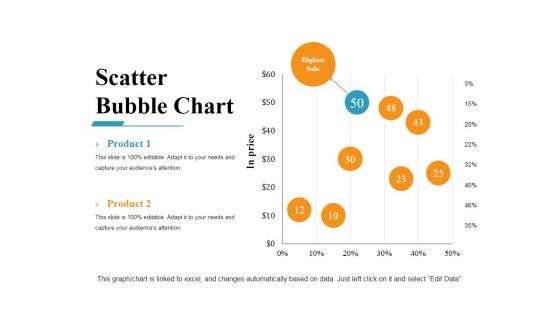
Scatter Bubble Chart Ppt PowerPoint Presentation Gallery Example Introduction
This is a scatter bubble chart ppt powerpoint presentation gallery example introduction. This is a eight stage process. The stages in this process are business, marketing, finance, bubble, scatter.
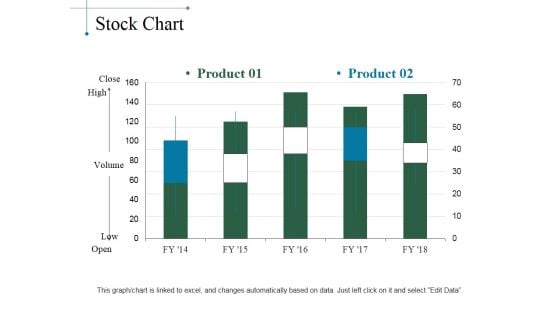
Stock Chart Ppt PowerPoint Presentation Layouts Designs Download
This is a stock chart ppt powerpoint presentation layouts designs download. This is a five stage process. The stages in this process are product, close, high, volume, low, open.
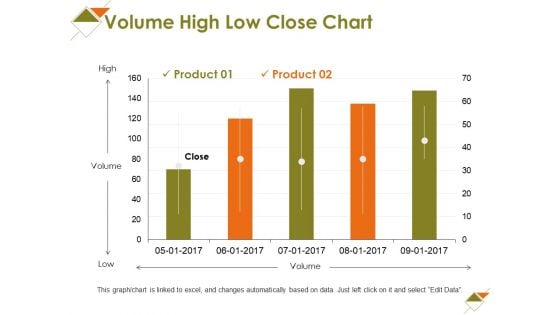
Volume High Low Close Chart Ppt PowerPoint Presentation Slides Styles
This is a volume high low close chart ppt powerpoint presentation slides styles. This is a two stage process. The stages in this process are high, volume, low, business, marketing.
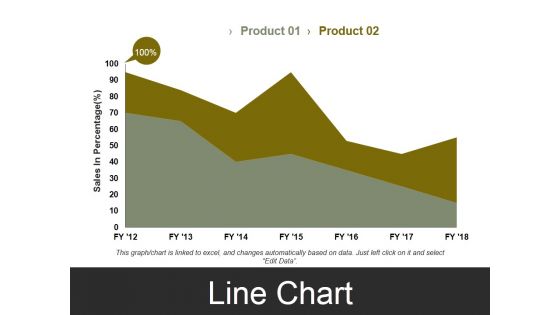
Line Chart Template 3 Ppt PowerPoint Presentation Styles Visual Aids
This is a line chart template 3 ppt powerpoint presentation styles visual aids. This is a two stage process. The stages in this process are sales in percentage, business, marketing, finance, graph.
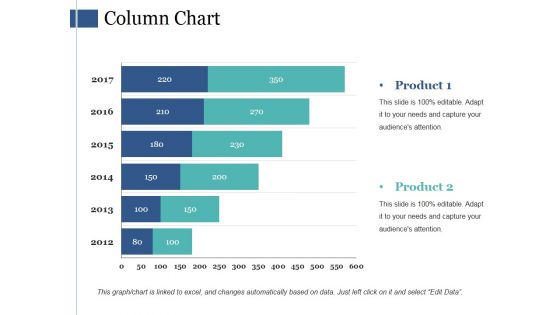
Column Chart Ppt PowerPoint Presentation Model Background Images
This is a column chart ppt powerpoint presentation model background images. This is a six stage process. The stages in this process are bar graph, marketing, finance, strategy, planning.
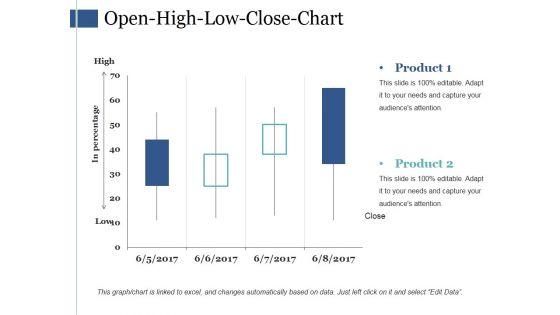
Open High Low Close Chart Ppt PowerPoint Presentation Styles Example
This is a open high low close chart ppt powerpoint presentation styles example. This is a four stage process. The stages in this process are business, marketing, finance, strategy, planning.
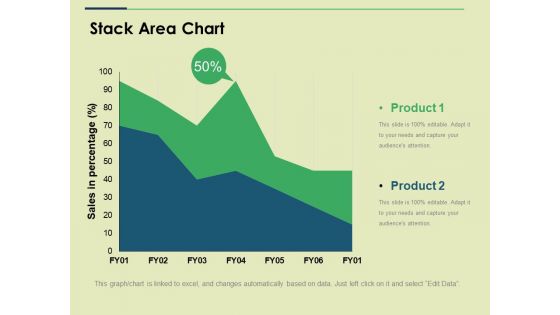
Stack Area Chart Ppt PowerPoint Presentation Show Slide
This is a stack area chart ppt powerpoint presentation show slide. This is a two stage process. The stages in this process are sales in percentage, business, marketing, strategy, graph.
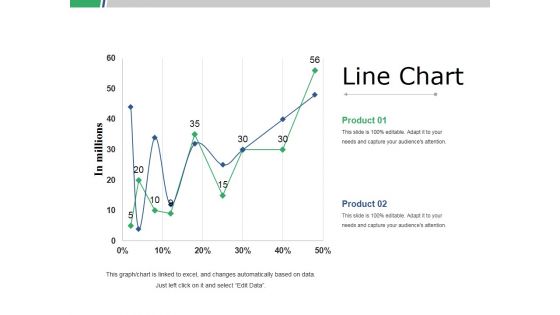
Line Chart Ppt PowerPoint Presentation Slides Graphics Template
This is a line chart ppt powerpoint presentation slides graphics template. This is a two stage process. The stages in this process are business, marketing, strategy, line graph, finance.
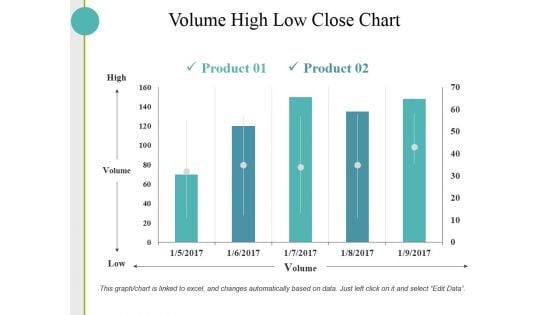
Volume High Low Close Chart Ppt PowerPoint Presentation Inspiration Skills
This is a volume high low close chart ppt powerpoint presentation inspiration skills. This is a two stage process. The stages in this process are high, volume, low, business.
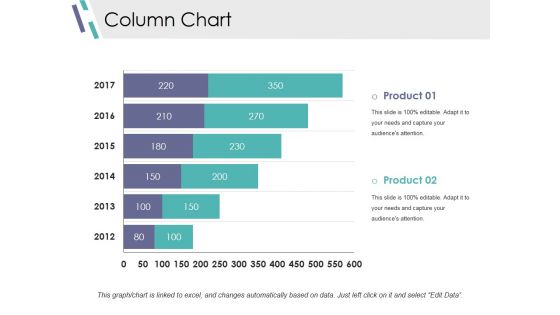
Column Chart Ppt PowerPoint Presentation Infographics Design Inspiration
This is a column chart ppt powerpoint presentation infographics design inspiration. This is a two stage process. The stages in this process are slide bar, marketing, strategy, finance, planning.
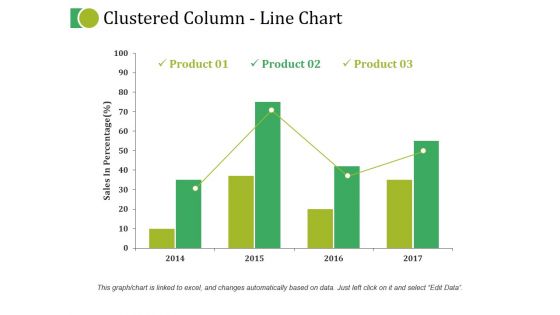
Clustered Column Line Chart Ppt PowerPoint Presentation Inspiration Graphics Pictures
This is a clustered column line chart ppt powerpoint presentation inspiration graphics pictures. This is a four stage process. The stages in this process are business, marketing, strategy, planning, finance.
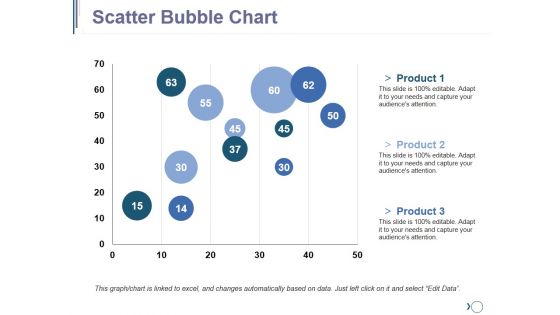
Scatter Bubble Chart Ppt PowerPoint Presentation Outline Graphics Pictures
This is a scatter bubble chart ppt powerpoint presentation outline graphics pictures. This is a three stage process. The stages in this process are finance, planning, business, marketing, strategy.
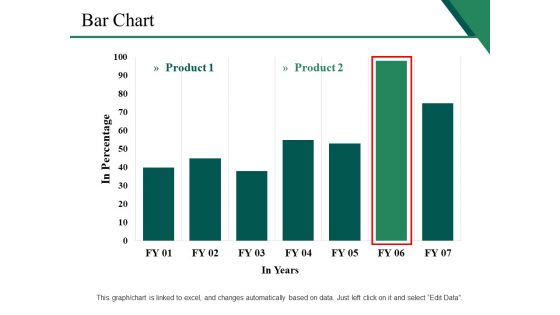
Bar Chart Ppt PowerPoint Presentation Inspiration Background Image
This is a bar chart ppt powerpoint presentation inspiration background image. This is a two stage process. The stages in this process are business, marketing, strategy, finance, in years, in percentage.
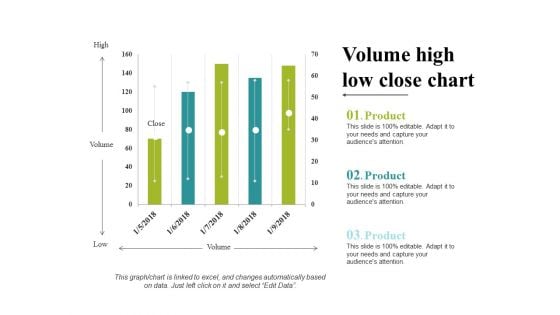
Volume High Low Close Chart Ppt PowerPoint Presentation Portfolio Clipart
This is a volume high low close chart ppt powerpoint presentation portfolio clipart. This is a five stage process. The stages in this process are business, marketing, strategy, planning, finance.
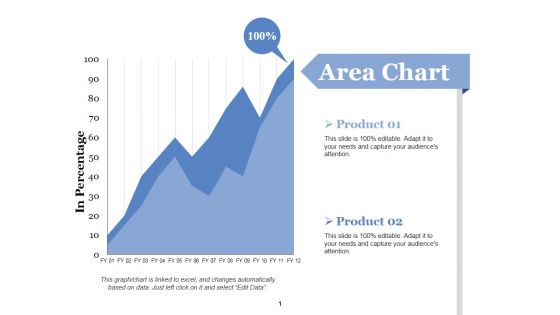
Area Chart Ppt PowerPoint Presentation Portfolio Graphics Design
This is a area chart ppt powerpoint presentation portfolio graphics design. This is a two stage process. The stages in this process are business, marketing, in percentage, graph, finance.
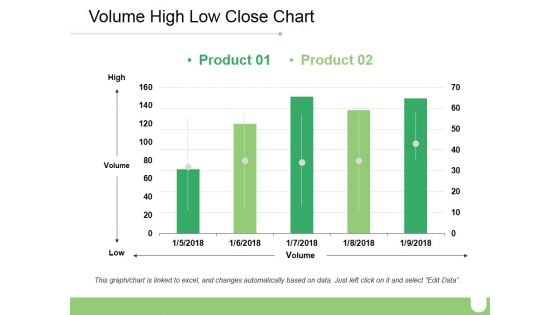
Volume High Low Close Chart Ppt PowerPoint Presentation Inspiration Brochure
This is a volume high low close chart ppt powerpoint presentation inspiration brochure. This is a two stage process. The stages in this process are business, high, volume, low, marketing.
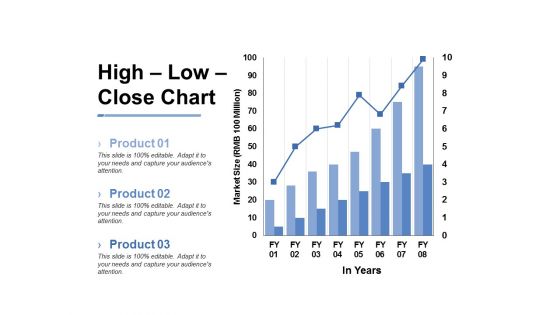
High Low Close Chart Ppt PowerPoint Presentation Inspiration Slide
This is a high low close chart ppt powerpoint presentation inspiration slide. This is a three stage process. The stages in this process are business, marketing, market size, in years, graph.

Column Chart Ppt PowerPoint Presentation Layouts Graphic Images
This is a column chart ppt powerpoint presentation layouts graphic images. This is a two stage process. The stages in this process are business, finance, years, graph, expenditure in, marketing.
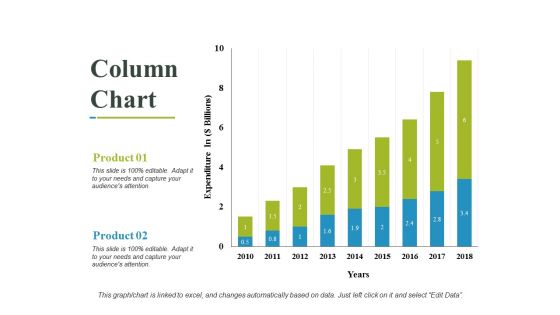
Column Chart Ppt PowerPoint Presentation Outline Design Ideas
This is a column chart ppt powerpoint presentation outline design ideas. This is a two stage process. The stages in this process are business, years, expenditure in, marketing, finance.
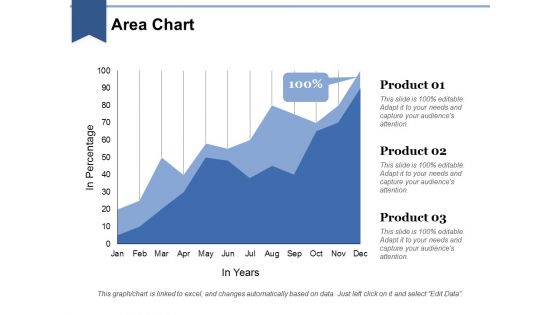
Area Chart Ppt PowerPoint Presentation Layouts Graphic Images
This is a area chart ppt powerpoint presentation layouts graphic images. This is a three stage process. The stages in this process are business, in years, marketing, in percentage, finance, graph.
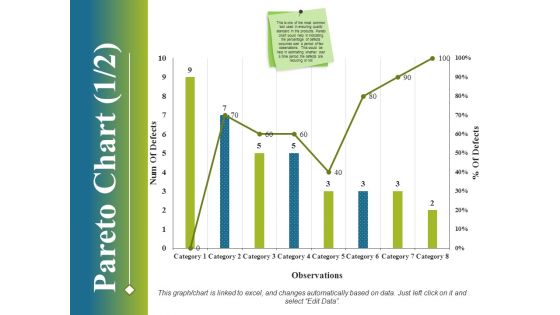
Pareto Chart Template 1 Ppt PowerPoint Presentation File Ideas
This is a pareto chart template 1 ppt powerpoint presentation file ideas. This is a eight stage process. The stages in this process are business, finance, marketing, strategy, analysis.
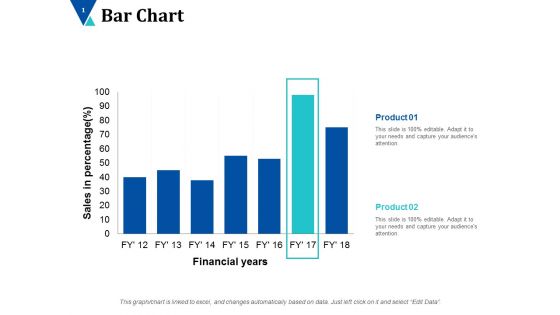
Bar Chart Finance Ppt PowerPoint Presentation Infographics Background Images
This is a bar chart finance ppt powerpoint presentation infographics background images. This is a seven stages process. The stages in this process are alpha testing, beta testing, full scale show.
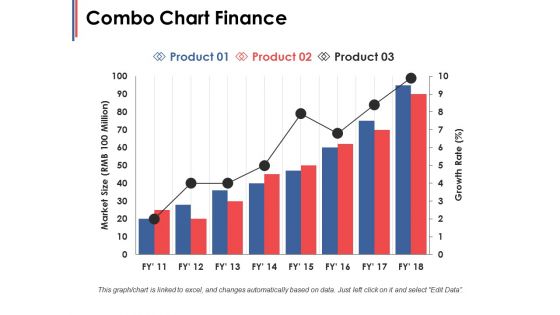
Combo Chart Finance Ppt PowerPoint Presentation Infographic Template Microsoft
This is a combo chart finance ppt powerpoint presentation infographic template microsoft. This is a three stage process. The stages in this process are finance, marketing, management, investment, analysis.
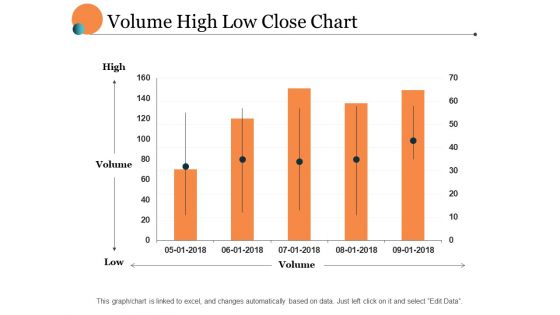
Volume High Low Close Chart Ppt PowerPoint Presentation Portfolio Layout
This is a volume high low close chart ppt powerpoint presentation portfolio layout. This is a five stage process. The stages in this process are finance, marketing, management, investment, analysis.
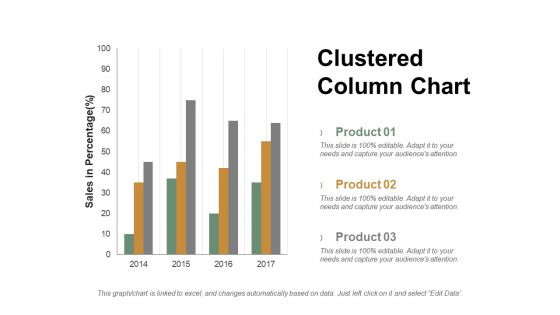
Clustered Column Chart Ppt PowerPoint Presentation Professional Ideas
This is a clustered column chart ppt powerpoint presentation professional ideas. This is a three stage process. The stages in this process are product, sales in percentage, column, years.
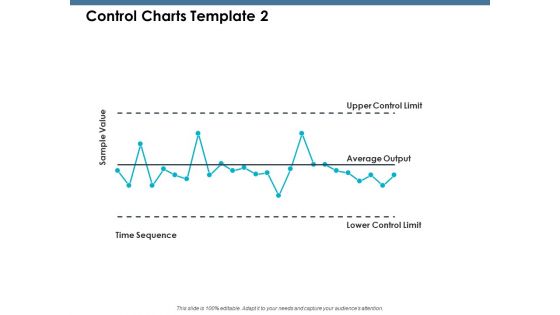
Control Charts Sample Value Ppt PowerPoint Presentation Infographics Demonstration
This is a control charts sample value ppt powerpoint presentation infographics demonstration. This is a five stage process. The stages in this process are product, percentage, marketing, business, management.
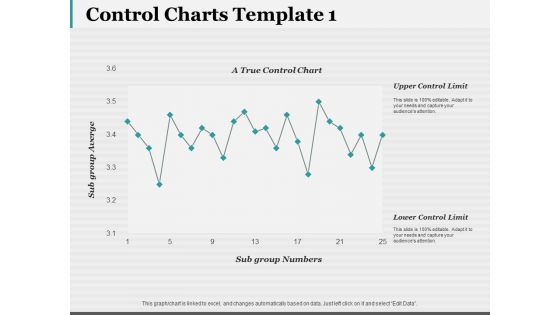
Control Charts Template 1 Ppt PowerPoint Presentation Show Graphics Design
This is a control charts template 1 ppt powerpoint presentation show graphics design. This is a one stage process. The stages in this process are business, finance, marketing, strategy, analysis.
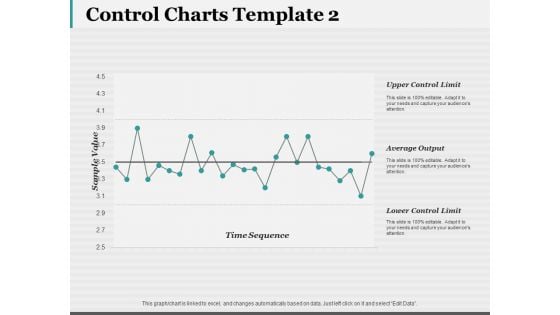
Control Charts Template 2 Ppt PowerPoint Presentation Slides Designs
This is a control charts template 2 ppt powerpoint presentation slides designs. This is a one stage process. The stages in this process are business, finance, marketing, strategy, analysis.
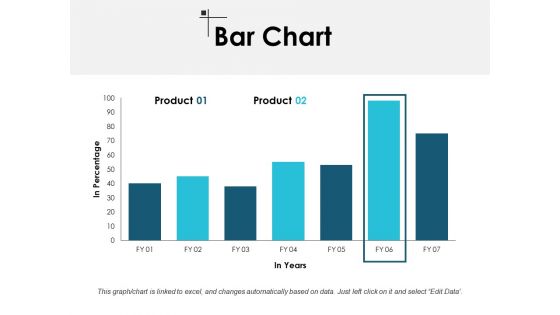
Bar Chart Finance Ppt PowerPoint Presentation Model Master Slide
This is a bar chart finance ppt powerpoint presentation model master slide. This is a two stage process. The stages in this process are finance, marketing, management, investment, analysis.
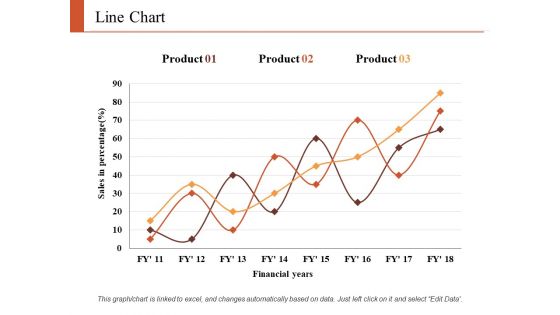
Line Chart Finance Ppt PowerPoint Presentation Infographic Template Graphics Tutorials
This is a line chart finance ppt powerpoint presentation infographic template graphics tutorials. This is a three stage process. The stages in this process are finance, marketing, analysis, business, investment.
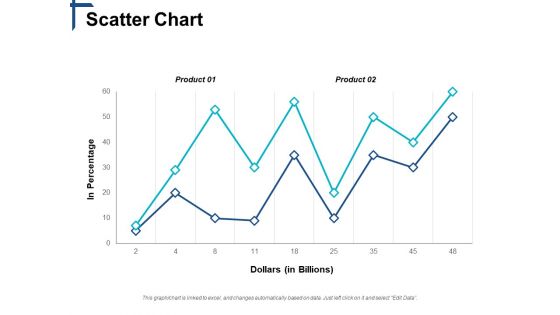
Scatter Chart Competitive Differentiation Ppt PowerPoint Presentation Show Slides
This is a scatter chart competitive differentiation ppt powerpoint presentation show slides. This is a two stage process. The stages in this process are business, management, marketing, strategy, sales.
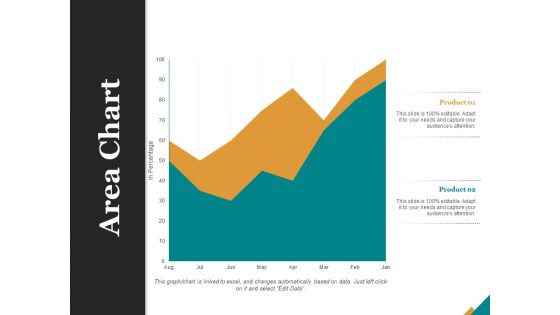
Area Chart Finance Ppt PowerPoint Presentation Summary Design Templates
This is a area chart finance ppt powerpoint presentation summary design templates. This is a two stage process. The stages in this process are finance, marketing, management, investment, analysis.
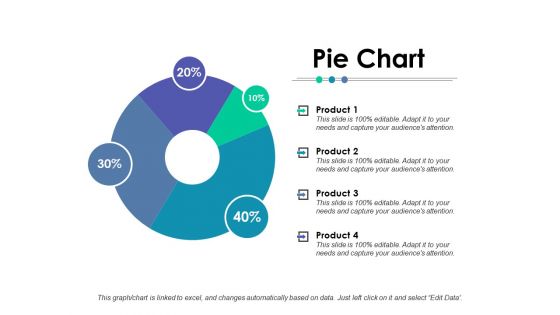
Pie Chart Finance Ppt PowerPoint Presentation Styles File Formats
This is a pie chart finance ppt powerpoint presentation styles file formats. This is a four stage process. The stages in this process are finance, analysis, business, investment, marketing.
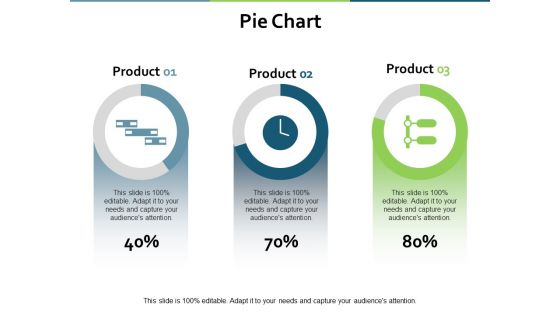
Pie Chart Marketing Finance Ppt PowerPoint Presentation Gallery Good
This is a pie chart marketing finance ppt powerpoint presentation gallery good. This is a three stage process. The stages in this process are finance, analysis, business, investment, marketing.
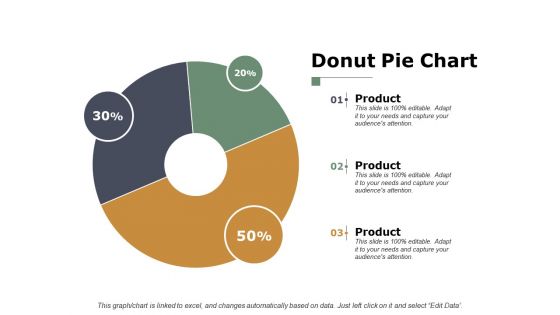
Donut Pie Chart Finance Ppt PowerPoint Presentation Inspiration Graphics
This is a donut pie chart finance ppt powerpoint presentation inspiration graphics. This is a three stage process. The stages in this process are finance, analysis, business, investment, marketing.
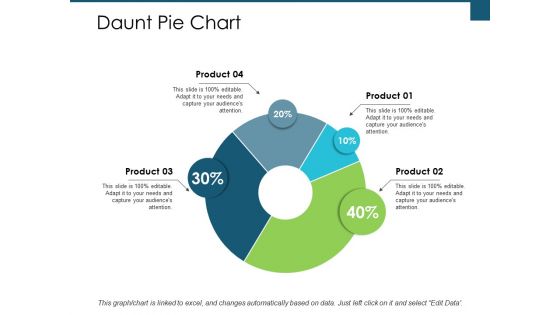
Daunt Pie Chart Investment Ppt PowerPoint Presentation Infographic Template Aids
This is a daunt pie chart investment ppt powerpoint presentation infographic template aids. This is a four stage process. The stages in this process are finance, analysis, business, investment, marketing.
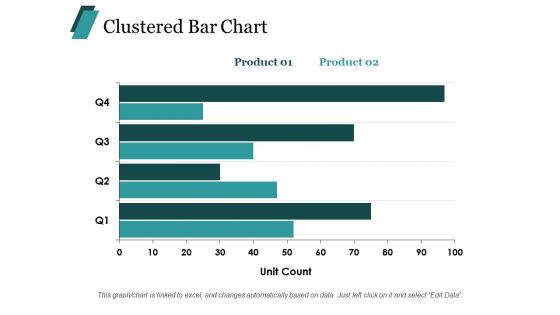
Clustered Bar Chart Finance Ppt PowerPoint Presentation Summary Layouts
This is a clustered bar chart finance ppt powerpoint presentation summary layouts. This is a two stage process. The stages in this process are finance, marketing, management, investment, analysis.
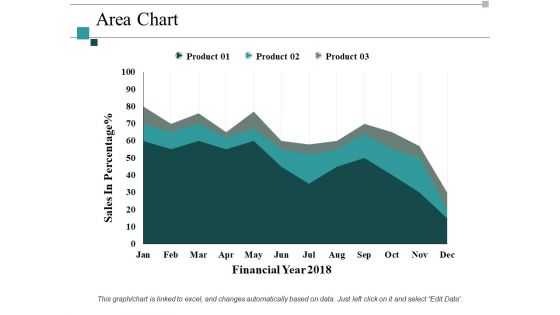
Area Chart Investment Ppt PowerPoint Presentation Summary Design Inspiration
This is a area chart investment ppt powerpoint presentation summary design inspiration. This is a three stage process. The stages in this process are finance, marketing, management, investment, analysis.
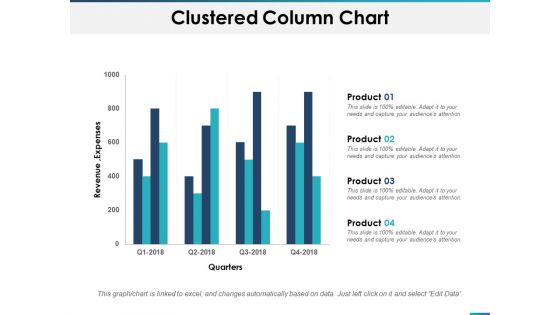
Clustered Column Chart Planning Ppt PowerPoint Presentation Portfolio Information
This is a clustered column chart planning ppt powerpoint presentation portfolio information. This is a four stage process. The stages in this process are finance, marketing, analysis, business, investment.
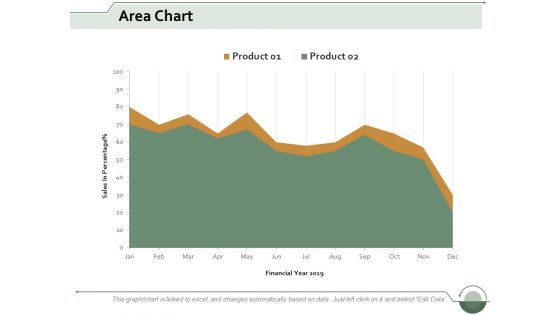
Area Chart Finance Ppt Powerpoint Presentation Infographic Template Clipart Images
This is a area chart finance ppt powerpoint presentation infographic template clipart images. This is a two stage process. The stages in this process are area bar, finance, marketing, management, analysis.
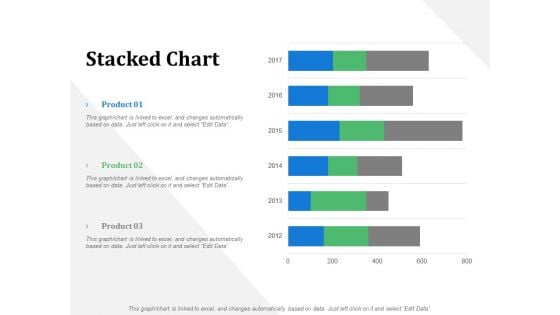
Stacked Chart Business Marketing Ppt PowerPoint Presentation File Design Ideas
This is a stacked chart business marketing ppt powerpoint presentation file design ideas. This is a three stage process. The stages in this process are business, management, marketing, product, percentage.
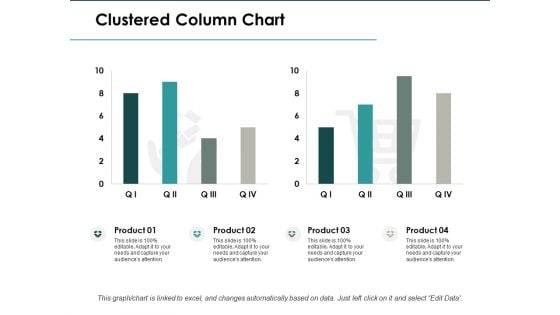
Clustered Column Chart Investment Ppt PowerPoint Presentation Infographic Template Clipart
This is a clustered column chart investment ppt powerpoint presentation infographic template clipart. This is a four stage process. The stages in this process are finance, analysis, business, investment, marketing.
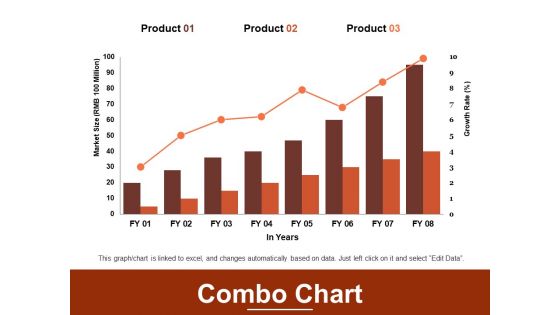
Combo Chart Finance Marketing Ppt PowerPoint Presentation File Guidelines
This is a combo chart finance marketing ppt powerpoint presentation file guidelines. This is a three stage process. The stages in this process are finance, analysis, business, investment, marketing.
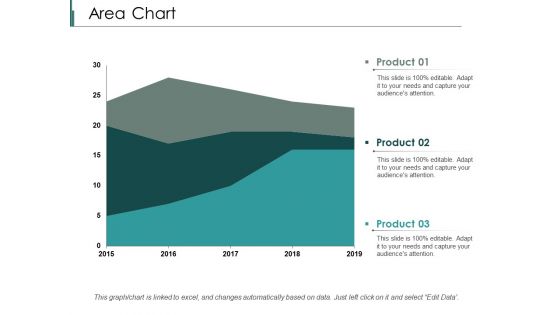
Area Chart Finance Ppt PowerPoint Presentation Styles Designs Download
This is a area chart finance ppt powerpoint presentation styles designs download. This is a three stage process. The stages in this process are finance, analysis, business, investment, marketing.
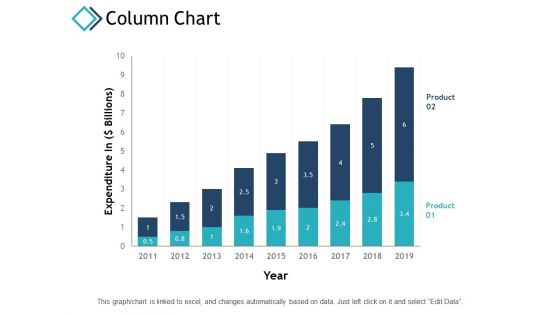
Column Chart Finance Investment Ppt PowerPoint Presentation Inspiration Template
This is a column chart finance investment ppt powerpoint presentation inspiration template. This is a two stage process. The stages in this process are finance, analysis, business, investment, marketing.
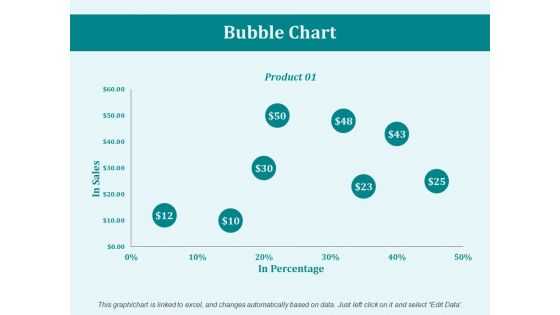
Bubble Chart Product Ppt PowerPoint Presentation Inspiration Design Ideas
This is a bubble chart product ppt powerpoint presentation inspiration design ideas. This is a one stage process. The stages in this process are business, management, marketing, product, percentage.
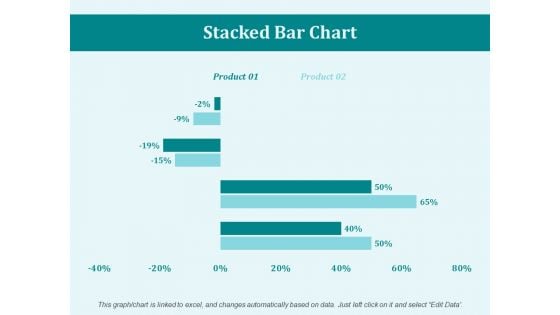
Stacked Bar Chart Percentage Ppt PowerPoint Presentation Portfolio Mockup
This is a stacked bar chart percentage ppt powerpoint presentation portfolio mockup. This is a two stage process. The stages in this process are business, marketing, management, percentage, product.
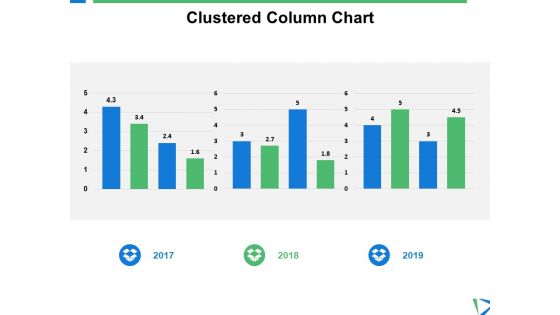
Clustered Column Chart Finance Ppt PowerPoint Presentation Gallery Styles
This is a clustered column chart finance ppt powerpoint presentation gallery styles. This is a three stage process. The stages in this process are finance, analysis, business, investment, marketing.
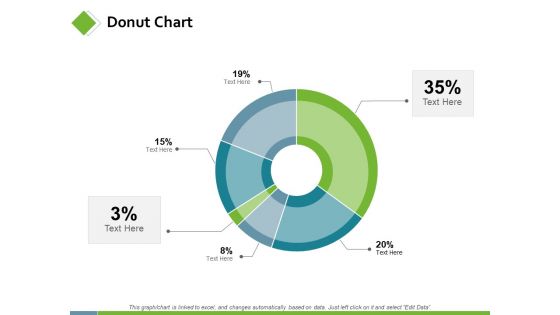
Donut Chart Marketing Planning Ppt PowerPoint Presentation Model Slideshow
This is a donut chart marketing planning ppt powerpoint presentation model slideshow. This is a six stage process. The stages in this process are finance, analysis, business, investment, marketing.
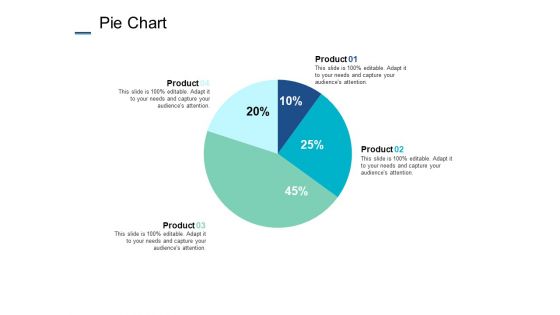
Pie Chart Finance Marketing Ppt PowerPoint Presentation Styles Outfit
This is a pie chart finance marketing ppt powerpoint presentation styles outfit. This is a four stage process. The stages in this process are finance, analysis, business, investment, marketing.

Bubble Chart Percentage Ppt PowerPoint Presentation File Layouts
This is a bubble chart percentage ppt powerpoint presentation file layouts. This is a two stage process. The stages in this process are finance, marketing, management, investment, product, percentage.
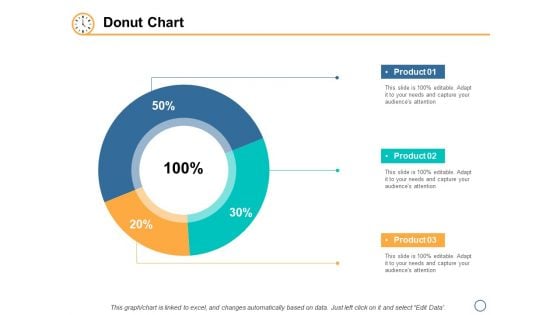
Pie Chart Marketing Finance Ppt PowerPoint Presentation File Guidelines
This is a pie chart marketing finance ppt powerpoint presentation file guidelines. This is a three stage process. The stages in this process are finance, analysis, business, investment, marketing.
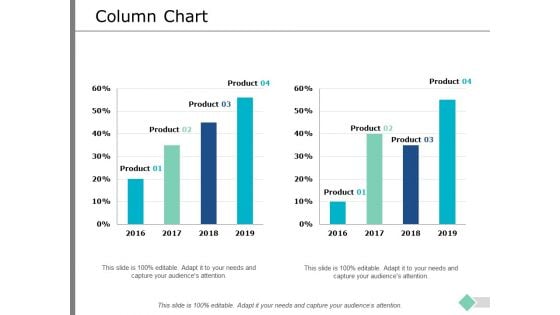
Column Chart Marketing Finance Ppt PowerPoint Presentation Infographic Template Rules
This is a column chart marketing finance ppt powerpoint presentation infographic template rules. This is a two stage process. The stages in this process are finance, analysis, business, investment, marketing.
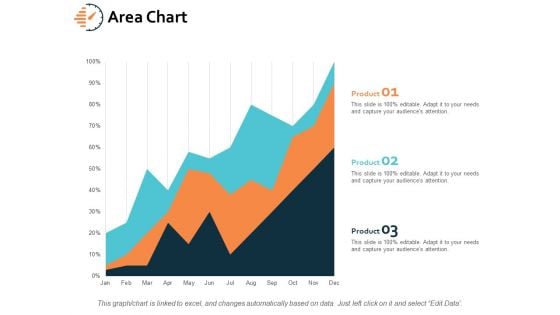
Area Chart Finance Marketing Ppt PowerPoint Presentation Gallery Graphics Design
This is a area chart finance marketing ppt powerpoint presentation gallery graphics design. This is a three stage process. The stages in this process are finance, analysis, business, investment, marketing.
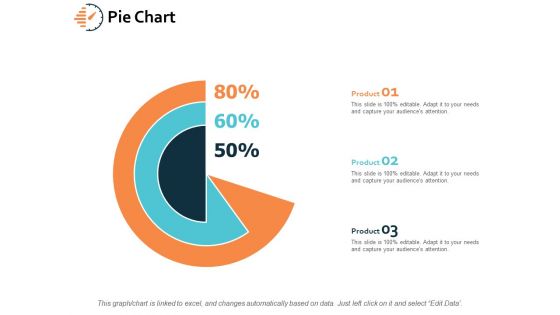
Pie Chart Investment Finance Ppt PowerPoint Presentation File Influencers
This is a pie chart investment finance ppt powerpoint presentation file influencers. This is a three stage process. The stages in this process are finance, analysis, business, investment, marketing.
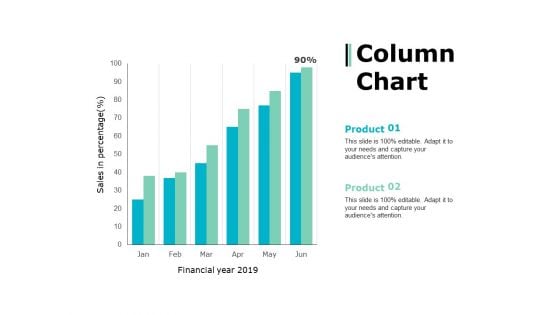
Column Chart Marketing Strategy Ppt PowerPoint Presentation Layouts Slide Portrait
This is a column chart marketing strategy ppt powerpoint presentation layouts slide portrait. This is a two stage process. The stages in this process are percentage, product, business, management, marketing.
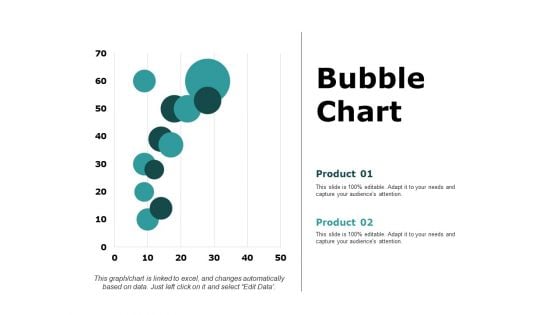
Bubble Chart Percentage Product Ppt PowerPoint Presentation Ideas Aids
This is a bubble chart percentage product ppt powerpoint presentation ideas aids. This is a two stage process. The stages in this process are business, management, marketing, percentage, product.
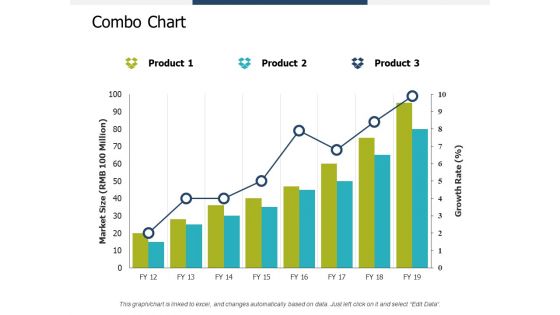
Combo Chart Investment Ppt PowerPoint Presentation Summary Infographic Template
This is a combo chart investment ppt powerpoint presentation summary infographic template. This is a three stage process. The stages in this process are finance, analysis, business, investment, marketing.
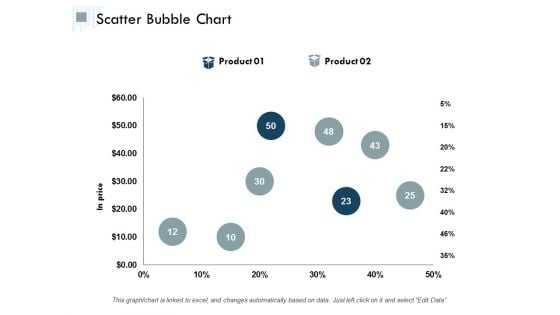
Scatter Bubble Chart Ppt PowerPoint Presentation Infographic Template Graphics Design
This is a scatter bubble chart ppt powerpoint presentation infographic template graphics design. This is a two stage process. The stages in this process are finance, analysis, business, investment, marketing.
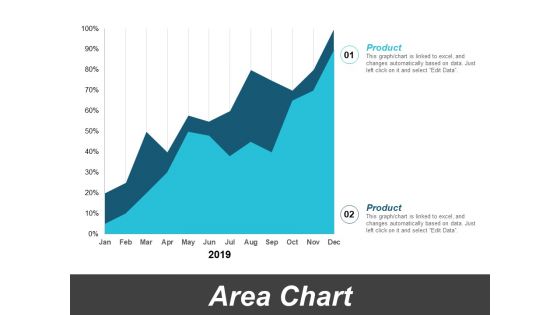
Area Chart Marketing Finance Ppt PowerPoint Presentation Ideas Elements
This is a area chart marketing finance ppt powerpoint presentation ideas elements. This is a two stage process. The stages in this process are finance, analysis, business, investment, marketing.
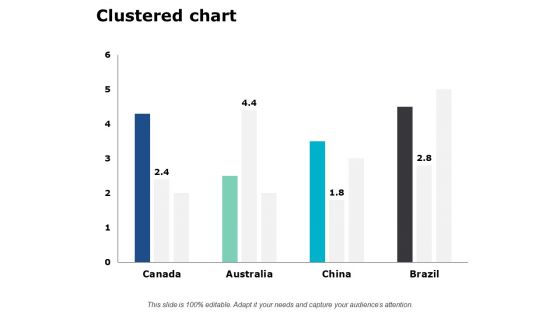
Clustered Chart Finance Marketing Ppt PowerPoint Presentation Layouts Outfit
This is a clustered chart finance marketing ppt powerpoint presentation layouts outfit. This is a four stage process. The stages in this process are finance, analysis, business, investment, marketing.

Bar Chart Finance Marketing Ppt PowerPoint Presentation File Good
This is a bar chart finance marketing ppt powerpoint presentation file good. This is a three stage process. The stages in this process are finance, marketing, management, investment, analysis.
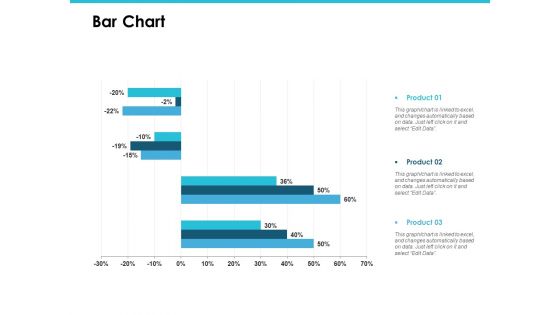
Bar Chart Management Investment Ppt PowerPoint Presentation File Rules
This is a bar chart management investment ppt powerpoint presentation file rules. This is a three stage process. The stages in this process are finance, marketing, management, investment, analysis.
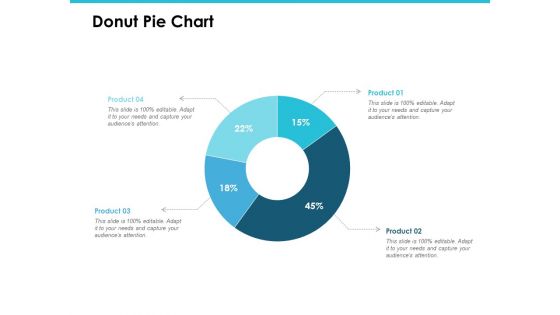
Donut Pie Chart Investment Analysis Ppt PowerPoint Presentation Gallery Introduction
This is a donut pie chart investment analysis ppt powerpoint presentation gallery introduction. This is a four stage process. The stages in this process are finance, marketing, management, investment, analysis.
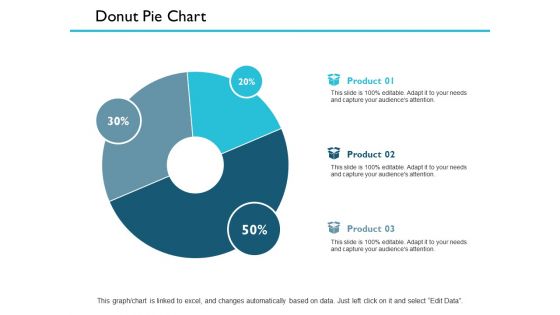
Donut Pie Chart Finance Ppt PowerPoint Presentation Outline Smartart
This is a donut pie chart finance ppt powerpoint presentation outline smartart. This is a three stage process. The stages in this process are management, marketing, business, strategy, finance.
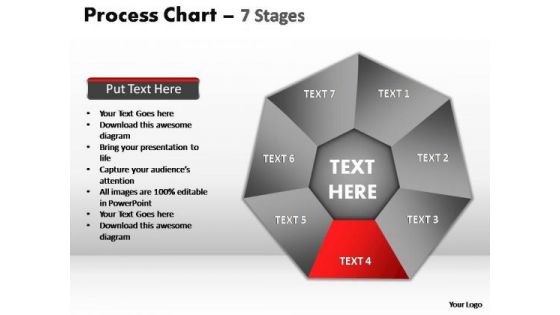
PowerPoint Slide Designs Teamwork Process Chart Ppt Backgrounds
PowerPoint Slide Designs Teamwork process chart PPT Backgrounds-These Fabulous PowerPoint slides and PowerPoint templates have been delicately designed by our professional team to leave long-lasting impressions on your audiences Perfect your presentations with our PowerPoint Slide Designs Teamwork Process Chart Ppt Backgrounds. Download without worries with our money back guaranteee.
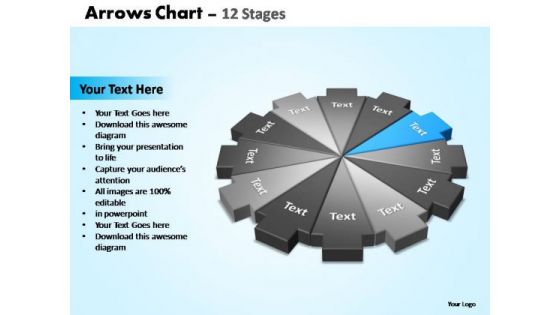
PowerPoint Template Leadership Arrows Chart Ppt Design Slides
PowerPoint_Template_Leadership_Arrows_Chart_PPT_Design_Slides-Explore the various directions and layers existing in your in your plans and processes. Unravel the desired and essential elements of your overall strategy. Explain the relevance of the different layers and stages and directions in getting down to your core competence, ability and desired result.-These amazing PowerPoint pre-designed slides and PowerPoint templates have been carefully created by our team of experts to help you impress your audience. Our stunning collection of Powerpoint slides are 100% editable and can easily fit in any PowerPoint presentations. By using these animations and graphics in PowerPoint and you can easily make professional presentations. Any text can be entered at any point in the PowerPoint template or slide. Just DOWNLOAD our awesome PowerPoint templates and you are ready to go. Regain control with our PowerPoint Template Leadership Arrows Chart Ppt Design Slides. Download without worries with our money back guaranteee.
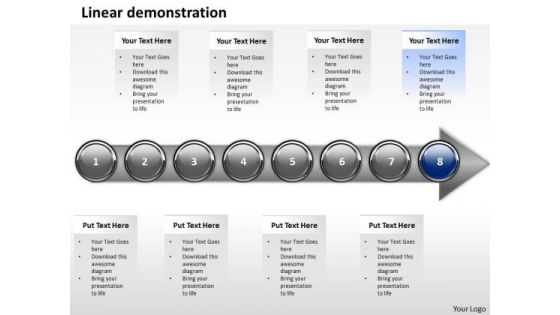
Ppt Linear Demonstration Of Marketing Process Using 8 State Diagram PowerPoint Templates
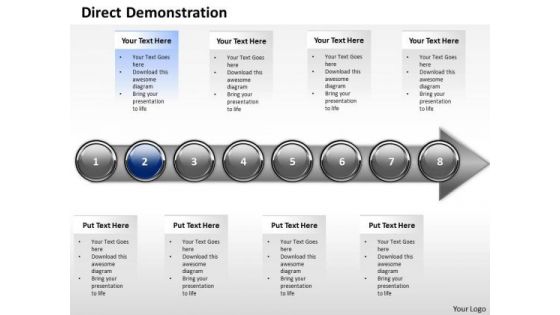
PPT linear demonstration of marketing process using 8 state diagram PowerPoint Templates-Use This Linearly Demonstrated PowerPoint Diagram having eight stages displaying as a circular boxes on the arrow pointing towards east direction. It signifies the completion of the procedure and attaining success.-PPT linear demonstration of marketing process using 8 state diagram PowerPoint Templates-Advertising, Arrow, Background, Banner, Blue, Bookmark, Card, Choice, Concept, Creative, Design, Direction, Flow, Illustration, Infographic, Instruction, Label, Layout, Manual, Marketing, Modern, Next, Number, Offer, One, Options, Order, Page, Paper, Pointer, Process, Product, Promotion, Sequence, Simple, Special, Step, Symbol, Tab, Tag, Template, Three, Tutorial, Two, Vector, Version, Web, Webdesign, Website Counsel teams with our Ppt Linear Demonstration Of Marketing Process Using 8 State Diagram PowerPoint Templates. Download without worries with our money back guaranteee.
Ppt Linear Description Of Banking Process Using 8 State Diagram Stage 2 PowerPoint Templates
PPT linear description of banking process using 8 state diagram stage 2 PowerPoint Templates-This diagram helps to determine your targets and you can sequence them as per your priorities. Educate your listeners on the relevance and importance of each one as per your plan.-PPT linear description of banking process using 8 state diagram stage 2 PowerPoint Templates-Advertising, Arrow, Background, Banner, Blue, Bookmark, Card, Choice, Concept, Creative, Design, Direction, Flow, Illustration, Infographic, Instruction, Label, Layout, Manual, Marketing, Modern, Next, Number, Offer, One, Options, Order, Page, Paper, Pointer, Process, Product, Promotion, Sequence, Simple, Special, Step, Symbol, Tab, Tag, Template, Three, Tutorial, Two, Vector, Version, Web, Webdesign, Website Pioneer changes with our Ppt Linear Description Of Banking Process Using 8 State Diagram Stage 2 PowerPoint Templates. Download without worries with our money back guaranteee.
Data Collection Scatter Diagram Ppt PowerPoint Presentation Good
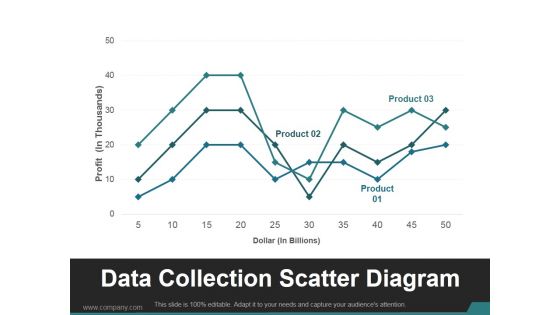
This is a data collection scatter diagram ppt powerpoint presentation good. This is a three stage process. The stages in this process are product, business, marketing, finance, data collection.
Data Collection Scatter Diagram Ppt PowerPoint Presentation Summary Deck
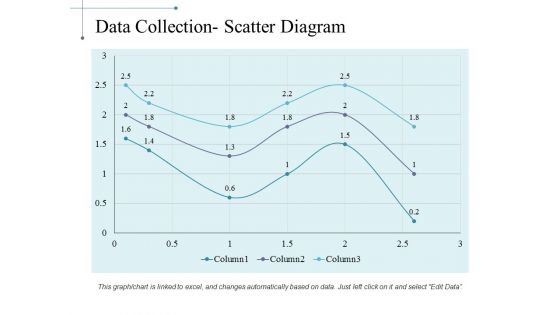
This is a data collection scatter diagram ppt powerpoint presentation summary deck. This is a three stage process. The stages in this process are business, marketing, strategy, finance, analysis.
Data Collection Scatter Diagram Ppt PowerPoint Presentation Professional Smartart
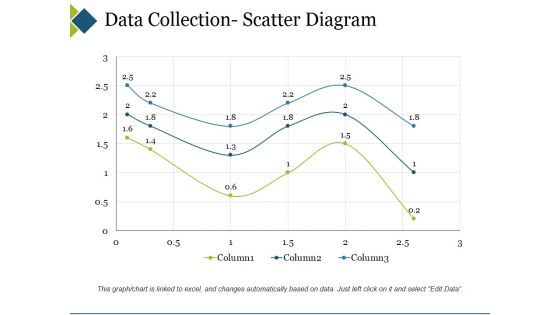
This is a data collection scatter diagram ppt powerpoint presentation professional smartart. This is a three stage process. The stages in this process are business, marketing, finance, graph, strategy.
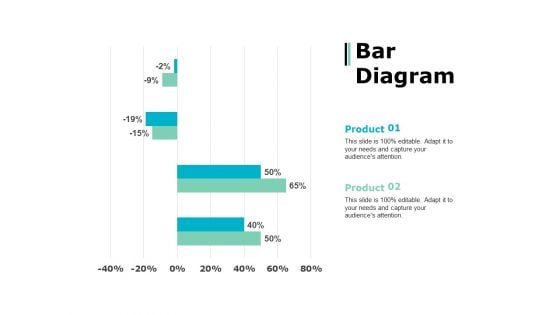
Bar Diagram Percentage Product Ppt PowerPoint Presentation Show Topics
This is a bar diagram percentage product ppt powerpoint presentation show topics. This is a two stage process. The stages in this process are percentage, product, business, management, marketing.

Guide To Corporate Financial Growth Plan Ppt Powerpoint Presentation Complete Deck
This presentation slide from our repository helps you draw design a business idea that address the audiences pain points and simplifies their experience. This Guide To Corporate Financial Growth Plan Ppt Powerpoint Presentation Complete Deckprovides a comprehensive yet-easy-to comprehend document to draw attention to your value proposition. Help audience navigate your business with this seventy five-slide complete deck. Draw an actionable customer service flow chart to win and retain your customers back. The presentation template is also equipped to do this with its 100 precent editable and customizable capability. Download now. Our Guide To Corporate Financial Growth Plan Ppt Powerpoint Presentation Complete Deck are topically designed to provide an attractive backdrop to any subject. Use them to look like a presentation pro.

Insurance Firm Start Up Financial Report Ppt Powerpoint Presentation Complete Deck With Slides
With well-researched insights and carefully-constructed design, this Insurance Firm Start Up Financial Report Ppt Powerpoint Presentation Complete Deck With Slides is all that you need for your next business meeting with clients and win them over. Add your data to graphs, charts, and tables that are already ready to display it with stunning visuals and help your audience recall your work. With this PPT Complete Deck, you will be able to display your knowledge of the subject as well as your skills as a communicator. Share your ideas and make an impact on the audience with this PowerPoint Layout and ensure that you are known as a presentation professional. Download this PPT Template Bundle to create the most interesting presentation anyone has ever seen. Our Insurance Firm Start Up Financial Report Ppt Powerpoint Presentation Complete Deck With Slides are topically designed to provide an attractive backdrop to any subject. Use them to look like a presentation pro.
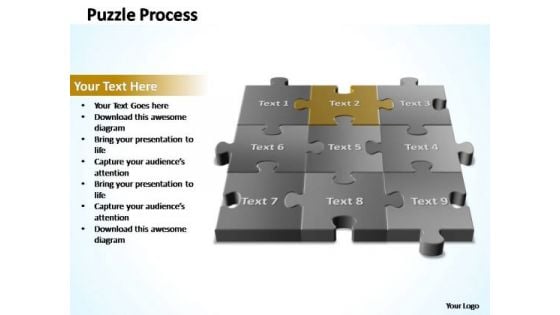
PowerPoint Templates Diagram 3d Puzzle Process Ppt Slides
PowerPoint templates Diagram 3D Puzzle Process PPT Slides-Puzzle diagram is a visual tool that allows you to create and visualize a sales process. -PowerPoint templates Diagram 3D Puzzle Process PPT Slides Acquire success with our PowerPoint Templates Diagram 3d Puzzle Process Ppt Slides. Download without worries with our money back guaranteee.

Client Testimonials Financial Analytics Platform Investor Elevator Pitch Deck
This slide focuses on client testimonials that help companies improve their performance using our products and services. It includes testimonials from two companies such as upgrade, and redwood trust. Retrieve professionally designed Client Testimonials Financial Analytics Platform Investor Elevator Pitch Deck to effectively convey your message and captivate your listeners. Save time by selecting pre-made slideshows that are appropriate for various topics, from business to educational purposes. These themes come in many different styles, from creative to corporate, and all of them are easily adjustable and can be edited quickly. Access them as PowerPoint templates or as Google Slides themes. You do not have to go on a hunt for the perfect presentation because Slidegeeks got you covered from everywhere. This slide focuses on client testimonials that help companies improve their performance using our products and services. It includes testimonials from two companies such as upgrade, and redwood trust.

 Home
Home