Icons Section
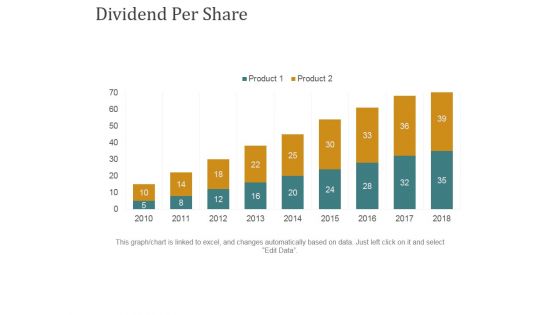
Dividend Per Share Ppt PowerPoint Presentation Summary Rules
This is a dividend per share ppt powerpoint presentation summary rules. This is a nine stage process. The stages in this process are business, bar graph, finance, marketing, strategy, growth.
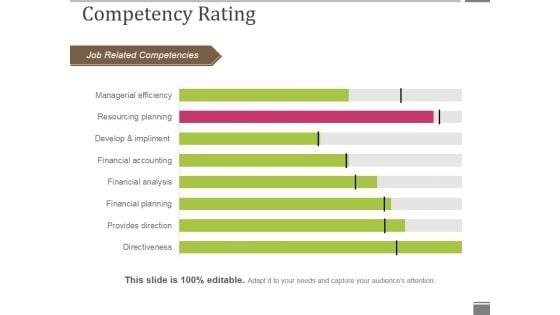
Competency Rating Template 1 Ppt PowerPoint Presentation Outline Smartart
This is a competency rating template 1 ppt powerpoint presentation outline smartart. This is a eight stage process. The stages in this process are job related competencies, competency rating, bar graph, business, marketing.
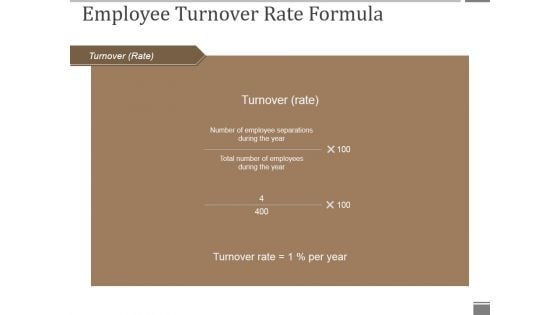
Employee Turnover Rate Formula Ppt PowerPoint Presentation Pictures Aids
This is a employee turnover rate formula ppt powerpoint presentation pictures aids. This is a five stage process. The stages in this process are employee turnover, rate of tune over, business, marketing, bar graph.

Staff Acquisition Cost Cost Per Hire Ppt PowerPoint Presentation Styles Guidelines
This is a staff acquisition cost cost per hire ppt powerpoint presentation styles guidelines. This is a seven stage process. The stages in this process are cost per hire, bar graph, business, marketing, planning.
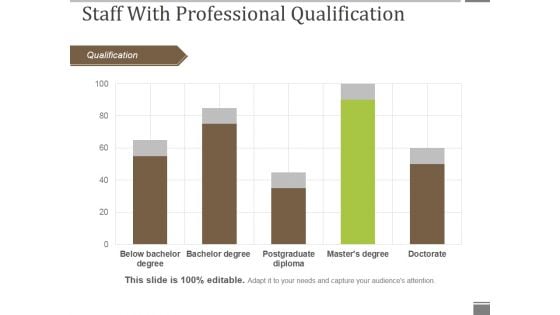
Staff With Professional Qualification Ppt PowerPoint Presentation Gallery Graphics Pictures
This is a staff with professional qualification ppt powerpoint presentation gallery graphics pictures. This is a five stage process. The stages in this process are qualification, bar graph, business, marketing, success.
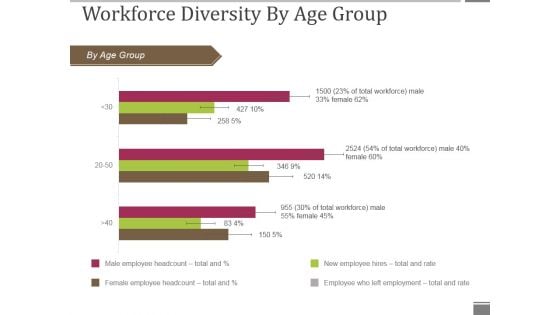
Workforce Diversity By Age Group Ppt PowerPoint Presentation Visual Aids Gallery
This is a workforce diversity by age group ppt powerpoint presentation visual aids gallery. This is a three stage process. The stages in this process are by age group, bar graph, business, marketing, presentation.
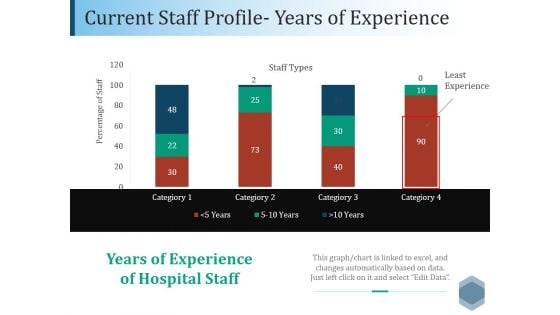
Current Staff Profile Years Of Experience Ppt PowerPoint Presentation File Graphics Tutorials
This is a current staff profile years of experience ppt powerpoint presentation file graphics tutorials. This is a four stage process. The stages in this process are business, marketing, strategy, finance, bar.
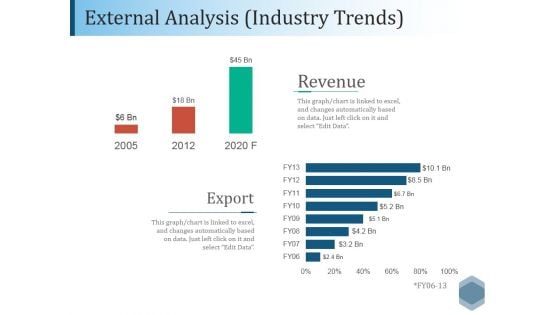
External Analysis Industry Trends Ppt PowerPoint Presentation File Outfit
This is a external analysis industry trends ppt powerpoint presentation file outfit. This is a two stage process. The stages in this process are revenue, export, bar, finance, analysis.
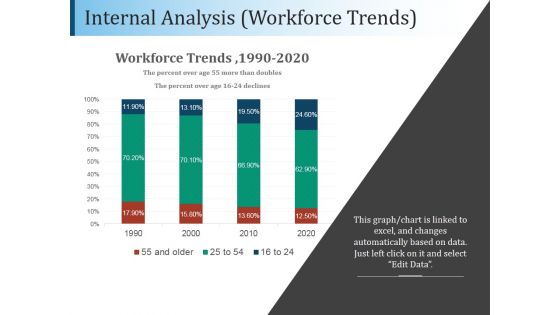
Internal Analysis Workforce Trends Ppt PowerPoint Presentation Example
This is a internal analysis workforce trends ppt powerpoint presentation example. This is a four stage process. The stages in this process are workforce trends, business, marketing, bar, finance.
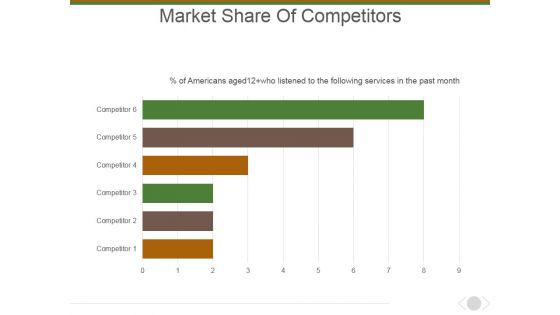
Market Share Of Competitors Ppt PowerPoint Presentation Layouts Picture
This is a market share of competitors ppt powerpoint presentation layouts picture. This is a six stage process. The stages in this process are marketing, business, management, bar graph, presentation.
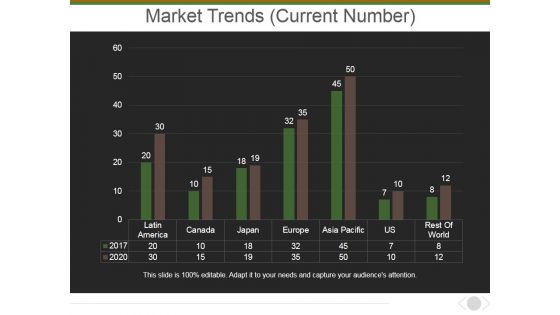
Market Trends Current Number Ppt PowerPoint Presentation Outline Rules
This is a market trends current number ppt powerpoint presentation outline rules. This is a seven stage process. The stages in this process are market, bar graph, business, country, planning.
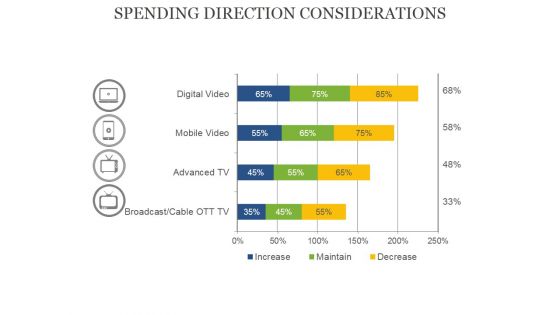
Spending Direction Considerations Ppt PowerPoint Presentation Portfolio Graphics Template
This is a spending direction considerations ppt powerpoint presentation portfolio graphics template. This is a four stage process. The stages in this process are bar graph, business, presentation, percentage, finance.
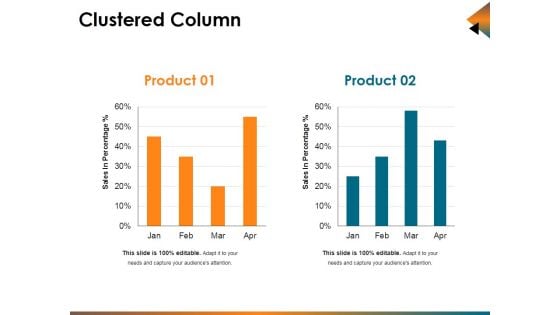
Clustered Column Ppt PowerPoint Presentation Infographic Template Background Designs
This is a clustered column ppt powerpoint presentation infographic template background designs. This is a two stage process. The stages in this process are sales in percentage, bar, business, marketing, planning.
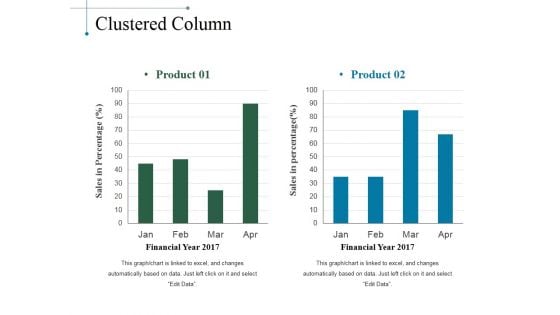
Clustered Column Ppt PowerPoint Presentation Slides Smartart
This is a clustered column ppt powerpoint presentation slides smartart. This is a two stage process. The stages in this process are product, sales in percentage, financial year, bar graph.
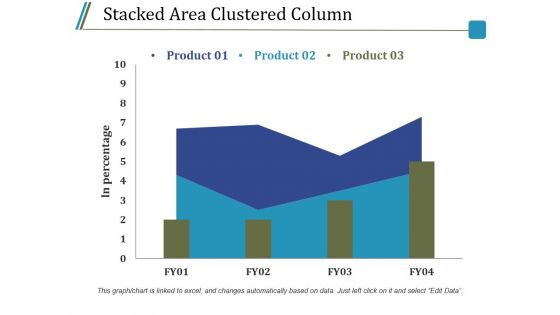
Stacked Area Clustered Column Ppt PowerPoint Presentation Model Guidelines
This is a stacked area clustered column ppt powerpoint presentation model guidelines. This is a three stage process. The stages in this process are product, in percentage, bar graph, growth, success.
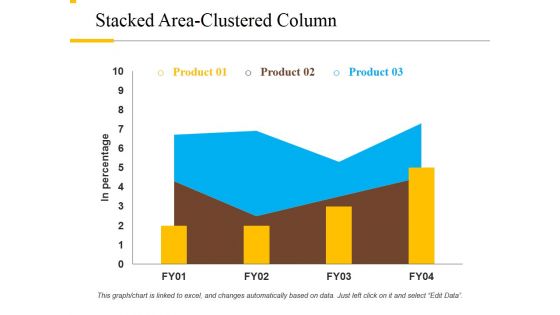
Stacked Area Clustered Column Ppt PowerPoint Presentation File Background Designs
This is a stacked area clustered column ppt powerpoint presentation file background designs. This is a three stage process. The stages in this process are product, in percentage, growth, success, bar graph.
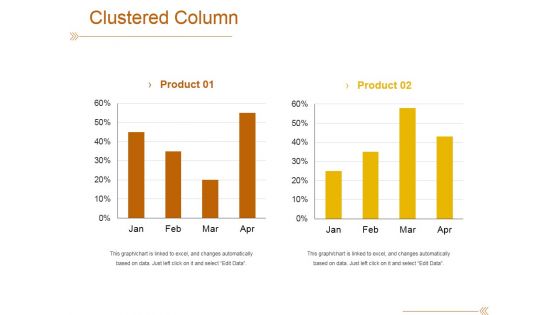
Clustered Column Template 1 Ppt PowerPoint Presentation Outline File Formats
This is a clustered column template 1 ppt powerpoint presentation outline file formats. This is a two stage process. The stages in this process are product, bar graph, success, growth, finance.
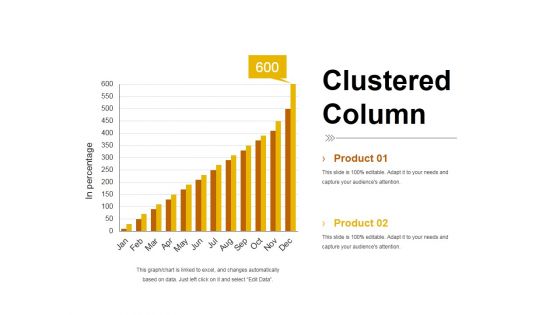
Clustered Column Template 2 Ppt PowerPoint Presentation Summary Smartart
This is a clustered column template 2 ppt powerpoint presentation summary smartart. This is a two stage process. The stages in this process are product, bar graph, in percentage, clustered column, growth.
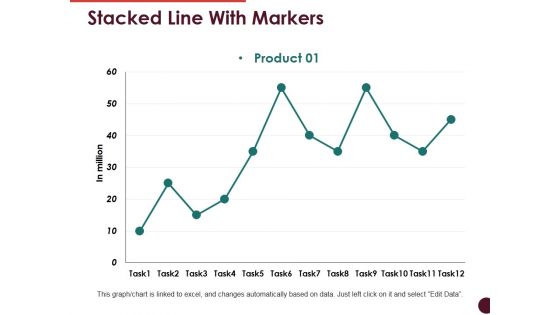
Stacked Line With Markers Ppt PowerPoint Presentation Show Templates
This is a stacked line with markers ppt powerpoint presentation show templates. This is a one stage process. The stages in this process are product, bar graph, growth, success, business.
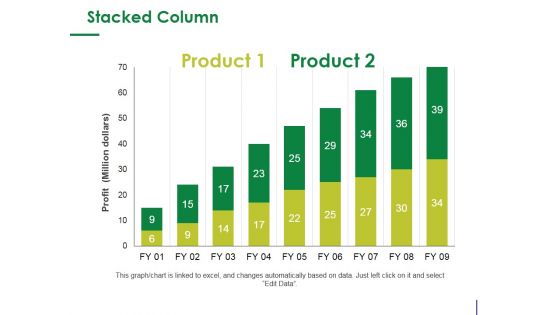
Stacked Column Ppt PowerPoint Presentation Infographic Template Design Ideas
This is a stacked column ppt powerpoint presentation infographic template design ideas. This is a two stage process. The stages in this process are product, profit, bar graph, growth, success.
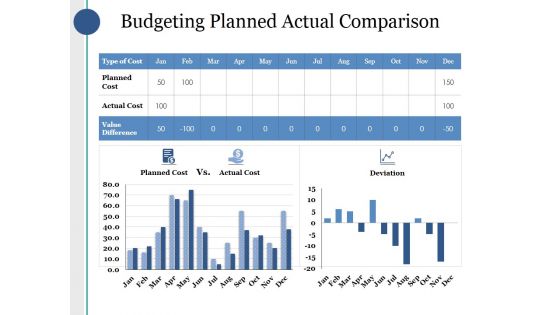
Budgeting Planned Actual Comparison Ppt PowerPoint Presentation Portfolio Background
This is a budgeting planned actual comparison ppt powerpoint presentation portfolio background. This is a three stage process. The stages in this process are planned cost, actual cost, value difference, deviation, bar graph.
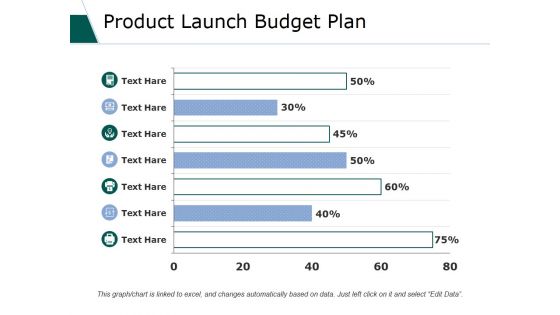
Product Launch Budget Plan Ppt PowerPoint Presentation File Formats
This is a product launch budget plan ppt powerpoint presentation file formats. This is a seven stage process. The stages in this process are business, marketing, strategy, planning, bar graph.
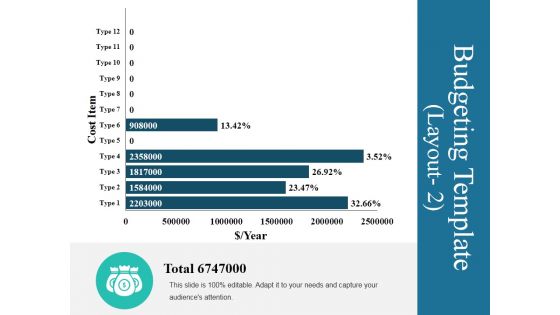
Budgeting Template 3 Ppt PowerPoint Presentation Visual Aids Model
This is a budgeting template 3 ppt powerpoint presentation visual aids model. This is a five stage process. The stages in this process are bar graph, business, marketing, finance, planning.
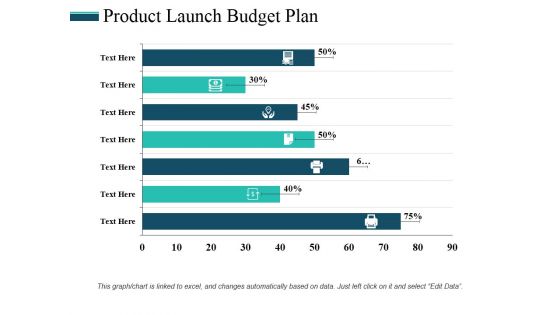
Product Launch Budget Plan Ppt PowerPoint Presentation Professional Rules
This is a product launch budget plan ppt powerpoint presentation professional rules. This is a seven stage process. The stages in this process are bar graph, finance, business, marketing, planning.
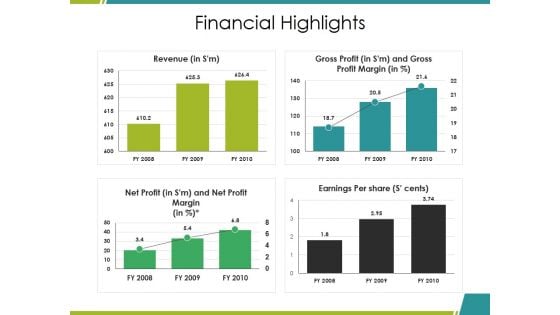
Financial Highlights Ppt PowerPoint Presentation Ideas Graphics Download
This is a financial highlights ppt powerpoint presentation ideas graphics download. This is a four stage process. The stages in this process are revenue, gross profit, net profit, earnings per share, bar graph.
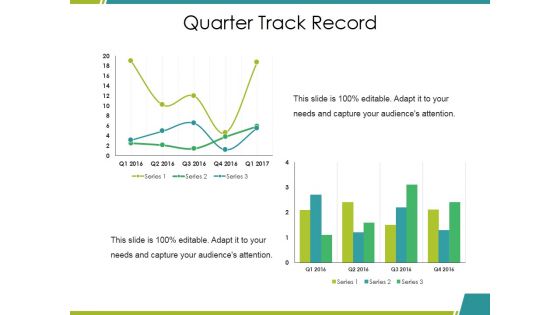
Quarter Track Record Ppt PowerPoint Presentation File Clipart Images
This is a quarter track record ppt powerpoint presentation file clipart images. This is a two stage process. The stages in this process are bar graph, growth, success, business, marketing.
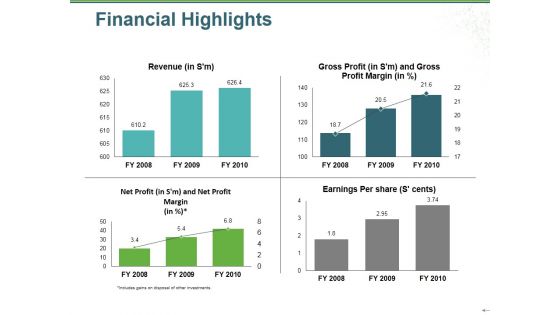
Financial Highlights Ppt PowerPoint Presentation Gallery Graphics Example
This is a financial highlights ppt powerpoint presentation gallery graphics example. This is a four stage process. The stages in this process are revenue, gross profit, net profit, earnings per share, bar graph.
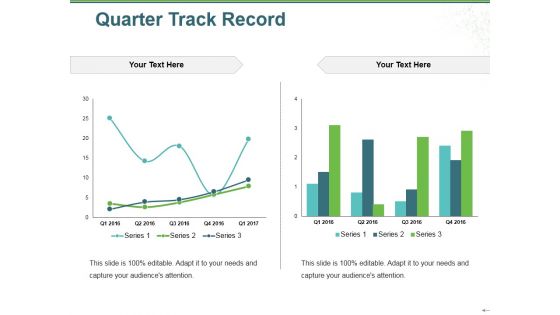
Quarter Track Record Ppt PowerPoint Presentation Gallery Images
This is a quarter track record ppt powerpoint presentation gallery images. This is a two stage process. The stages in this process are series, bar graph, growth, success, business.
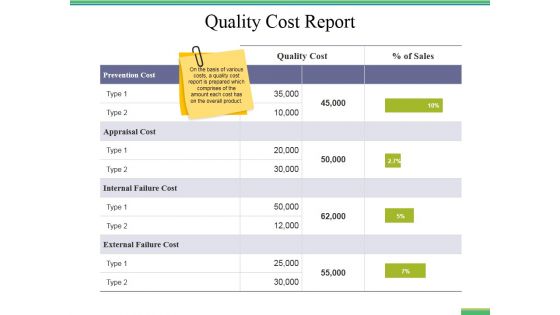
Quality Cost Report Ppt PowerPoint Presentation Styles Infographic Template
This is a quality cost report ppt powerpoint presentation styles infographic template. This is a five stage process. The stages in this process are business, finance, marketing, strategy, bar graph, analysis.
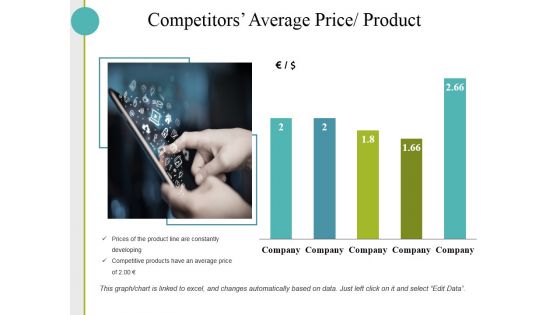
Competitors Average Price Product Ppt PowerPoint Presentation Inspiration Templates
This is a competitors average price product ppt powerpoint presentation inspiration templates. This is a five stage process. The stages in this process are business, finance, analysis, growth, investment, bar graph.
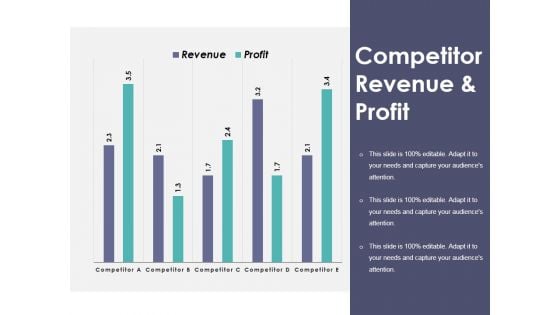
Competitor Revenue And Profit Ppt PowerPoint Presentation Outline Elements
This is a competitor revenue and profit ppt powerpoint presentation outline elements. This is a five stage process. The stages in this process are bar graph, marketing, strategy, finance, planning.
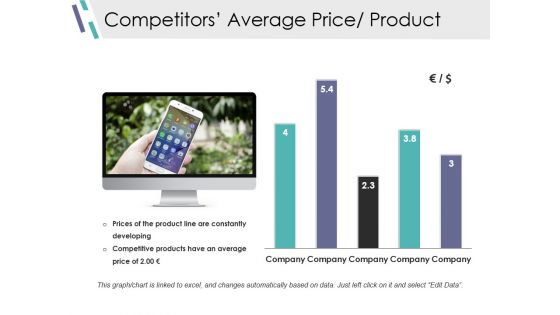
Competitors Average Price Product Ppt PowerPoint Presentation File Show
This is a competitors average price product ppt powerpoint presentation file show. This is a two stage process. The stages in this process are bar graph, marketing, strategy, finance, planning.
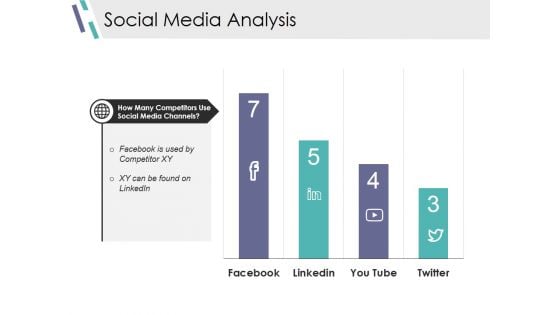
Social Media Analysis Ppt PowerPoint Presentation Model Portfolio
This is a social media analysis ppt powerpoint presentation model portfolio. This is a four stage process. The stages in this process are bar graph, marketing, strategy, finance, planning.
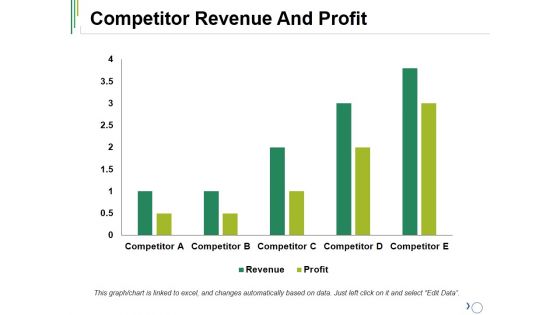
Competitor Revenue And Profit Ppt PowerPoint Presentation Layouts Vector
This is a competitor revenue and profit ppt powerpoint presentation layouts vector. This is a five stage process. The stages in this process are competitor, profit, revenue, bar graph, success.
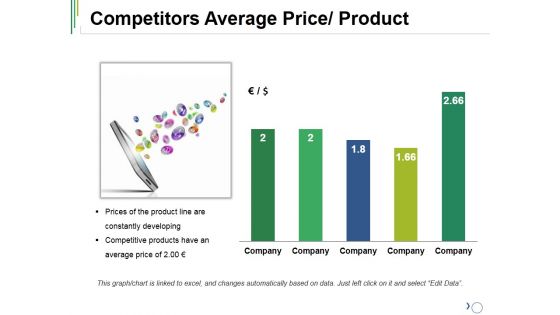
Competitors Average Price Product Ppt PowerPoint Presentation Layouts Infographic Template
This is a competitors average price product ppt powerpoint presentation layouts infographic template. This is a five stage process. The stages in this process are company, bar graph, success, growth, business.
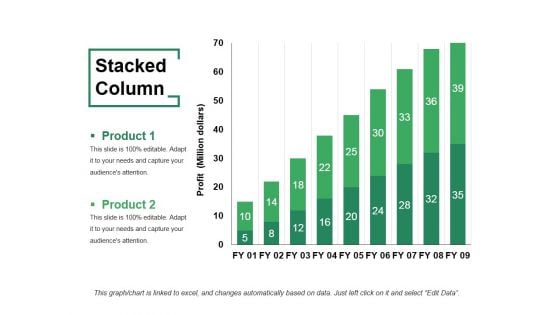
Stacked Column Ppt PowerPoint Presentation Layouts Example
This is a stacked column ppt powerpoint presentation layouts example. This is a two stage process. The stages in this process are product, stacked column, bar graph, growth, success.
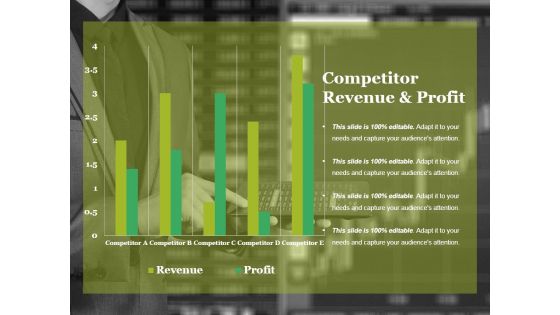
Competitor Revenue And Profit Ppt PowerPoint Presentation Model Templates
This is a competitor revenue and profit ppt powerpoint presentation model templates. This is a five stage process. The stages in this process are revenue, profit, competitor, bar graph, business.
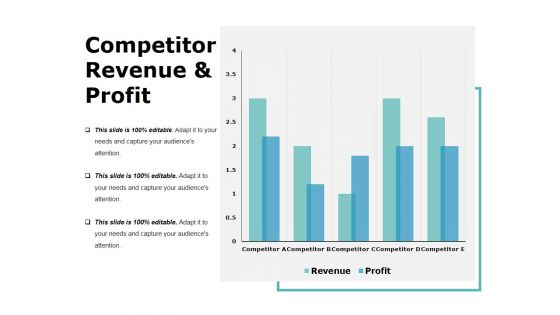
Competitor Revenue And Profit Template 1 Ppt PowerPoint Presentation Layouts Display
This is a competitor revenue and profit template 1 ppt powerpoint presentation layouts display. This is a five stage process. The stages in this process are business, bar graph, finance, marketing, analysis.
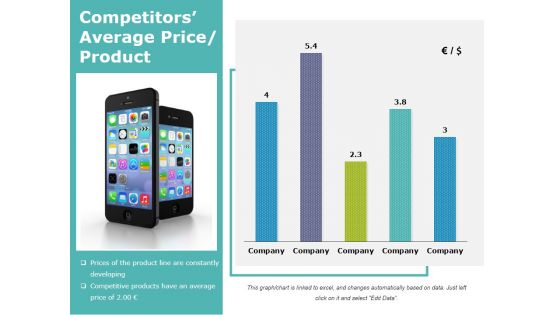
Competitors Average Price Product Ppt PowerPoint Presentation Ideas Layouts
This is a competitors average price product ppt powerpoint presentation ideas layouts. This is a five stage process. The stages in this process are business, bar graph, finance, marketing, analysis.
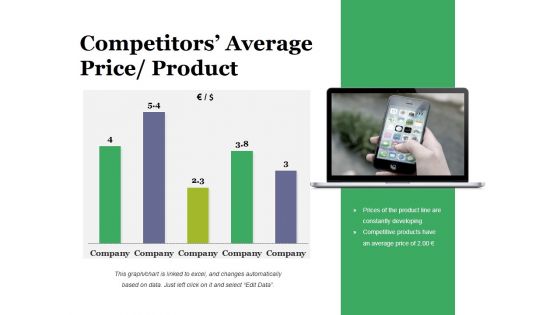
Competitors Average Price Product Ppt PowerPoint Presentation Styles Ideas
This is a competitors average price product ppt powerpoint presentation styles ideas. This is a five stage process. The stages in this process are business, bar graph, finance, marketing, strategy, analysis.
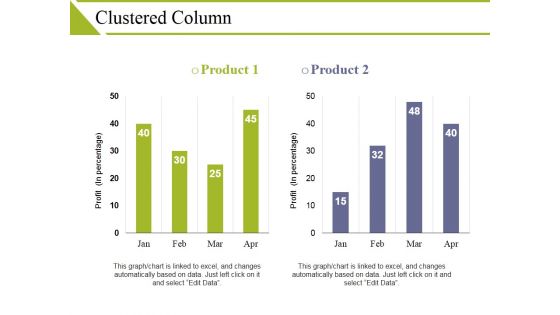
Clustered Column Ppt PowerPoint Presentation Visual Aids Show
This is a clustered column ppt powerpoint presentation visual aids show. This is a two stage process. The stages in this process are product, profit, business, bar graph, finance.
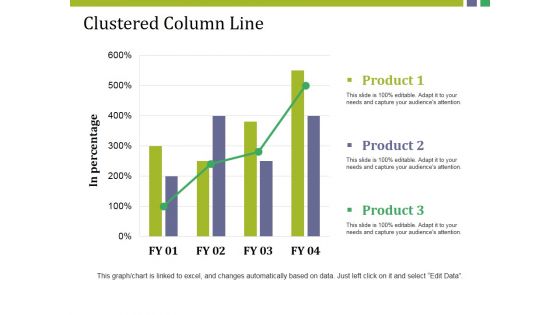
Clustered Column Line Ppt PowerPoint Presentation Pictures Example
This is a clustered column line ppt powerpoint presentation pictures example. This is a three stage process. The stages in this process are product, in percentage, bar graph, growth, success.
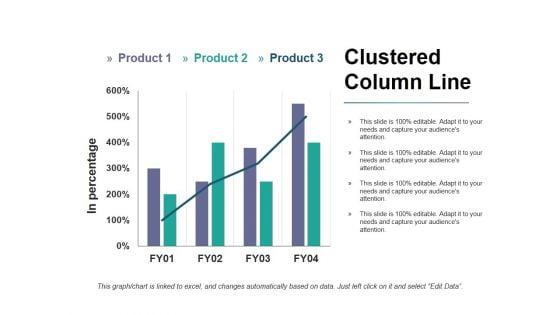
Clustered Column Line Ppt PowerPoint Presentation Infographic Template Pictures
This is a clustered column line ppt powerpoint presentation infographic template pictures. This is a three stage process. The stages in this process are product, in percentage, bar graph, growth, success.
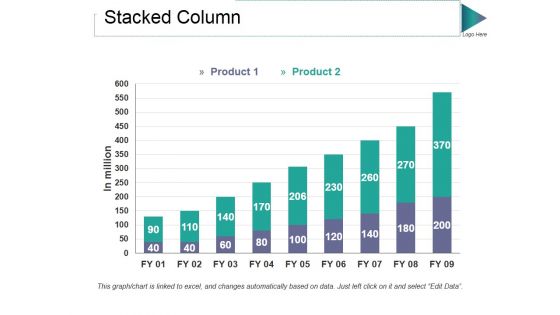
Stacked Column Ppt PowerPoint Presentation Styles Graphic Tips
This is a stacked column ppt powerpoint presentation styles graphic tips. This is a two stage process. The stages in this process are product, in million, bar graph, growth, success.
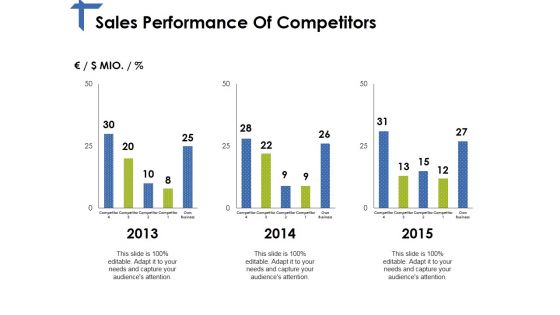
Sales Performance Of Competitors Ppt PowerPoint Presentation Layouts Elements
This is a sales performance of competitors ppt powerpoint presentation layouts elements. This is a three stage process. The stages in this process are years, bar graph, finance, business, marketing.
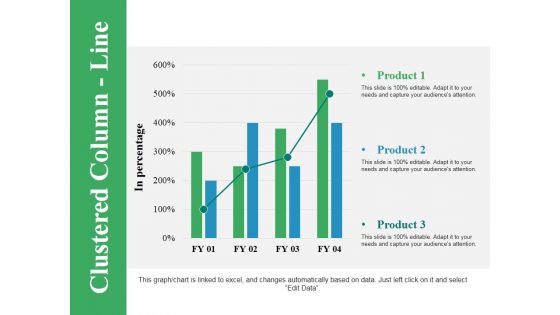
Clustered Column Line Ppt PowerPoint Presentation Pictures Model
This is a clustered column line ppt powerpoint presentation pictures model. This is a three stage process. The stages in this process are bar graph, finance, marketing, strategy, business.
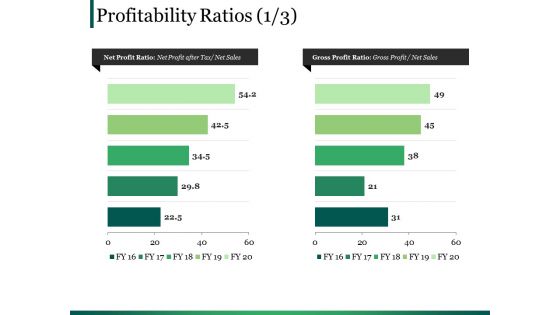
Profitability Ratios Template 1 Ppt PowerPoint Presentation Portfolio Display
This is a profitability ratios template 1 ppt powerpoint presentation portfolio display. This is a two stage process. The stages in this process are business, marketing, bar, finance, planning.
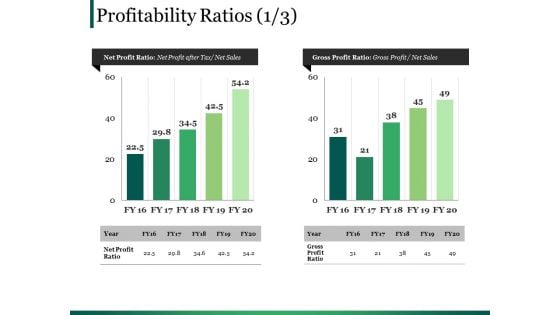
Profitability Ratios Template 2 Ppt PowerPoint Presentation Summary Graphics
This is a profitability ratios template 2 ppt powerpoint presentation summary graphics. This is a two stage process. The stages in this process are business, marketing, bar, finance, planning.
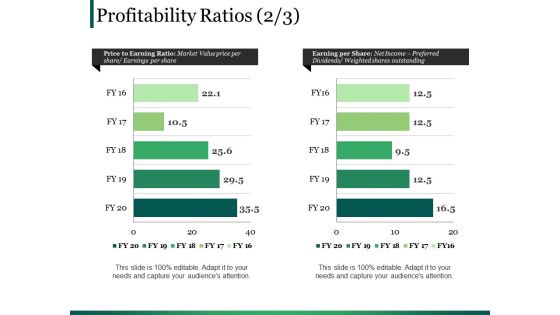
Profitability Ratios Template 3 Ppt PowerPoint Presentation Slides Good
This is a profitability ratios template 3 ppt powerpoint presentation slides good. This is a two stage process. The stages in this process are business, marketing, bar, finance, planning.
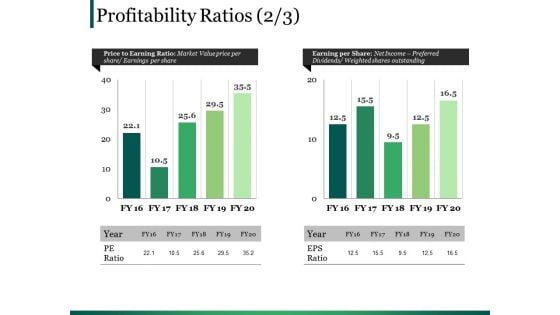
Profitability Ratios Template 4 Ppt PowerPoint Presentation Infographic Template Clipart Images
This is a profitability ratios template 4 ppt powerpoint presentation infographic template clipart images. This is a two stage process. The stages in this process are business, marketing, bar, finance, planning.
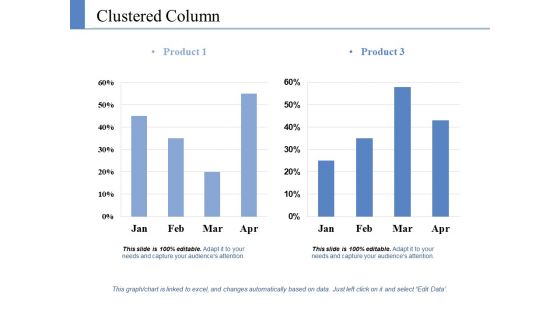
Clustered Column Ppt PowerPoint Presentation Pictures Graphics Template
This is a clustered column ppt powerpoint presentation pictures graphics template. This is a two stage process. The stages in this process are product, growth, success, business, bar graph.
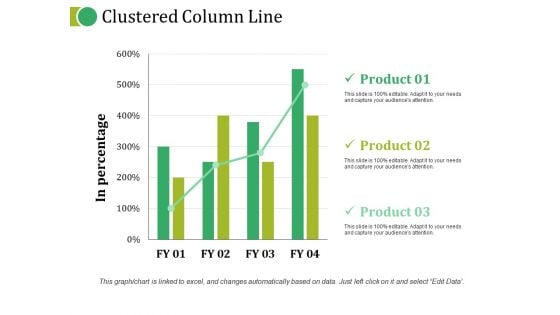
Clustered Column Line Ppt PowerPoint Presentation Topics
This is a clustered column line ppt powerpoint presentation topics. This is a three stage process. The stages in this process are product, in percentage, growth, bar graph, business.
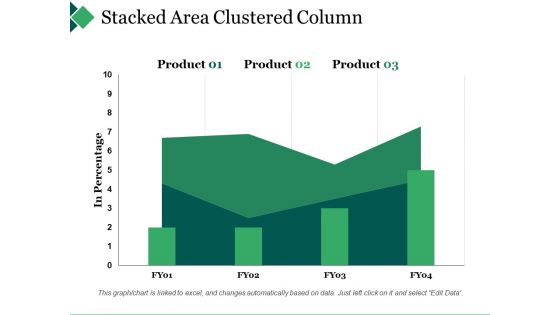
Stacked Area Clustered Column Ppt PowerPoint Presentation Gallery Gridlines
This is a stacked area clustered column ppt powerpoint presentation gallery gridlines. This is a three stage process. The stages in this process are bar graph, product, in percentage.
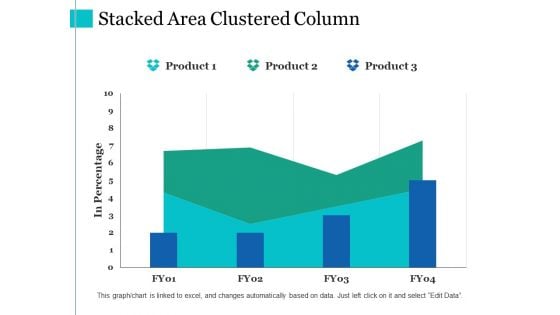
Stacked Area Clustered Column Ppt PowerPoint Presentation Summary Slides
This is a stacked area clustered column ppt powerpoint presentation summary slides. This is a three stage process. The stages in this process are product, in percentage, financial year, bar graph.
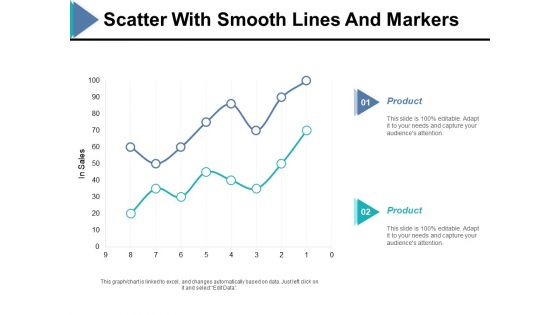
Scatter With Smooth Lines And Markers Ppt PowerPoint Presentation Ideas Example
This is a scatter with smooth lines and markers ppt powerpoint presentation ideas example. This is a two stage process. The stages in this process are in sales, finance, bar graph, product, business.
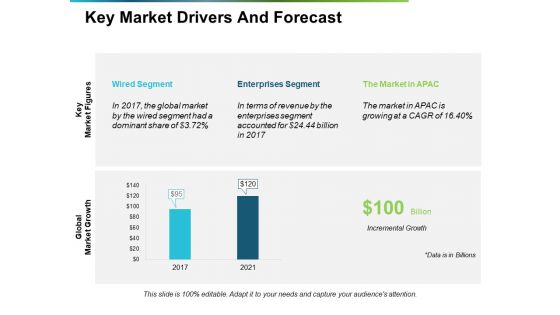
Key Market Drivers And Forecast Ppt PowerPoint Presentation Summary Templates
This is a key market drivers and forecast ppt powerpoint presentation summary templates. This is a two stage process. The stages in this process are key market drivers, forecast, growth, bar graph, business.
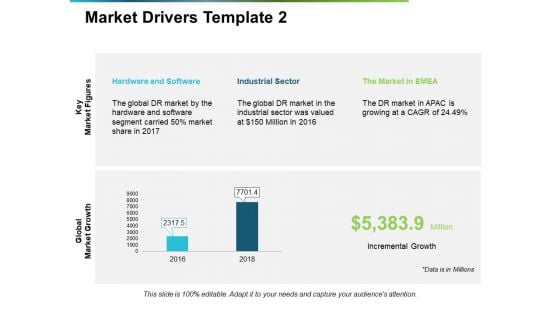
Market Drivers Hardware And Software Ppt PowerPoint Presentation Inspiration Graphics Design
This is a market drivers hardware and software ppt powerpoint presentation inspiration graphics design. This is a two stage process. The stages in this process are key market drivers, forecast, growth, bar graph, business.
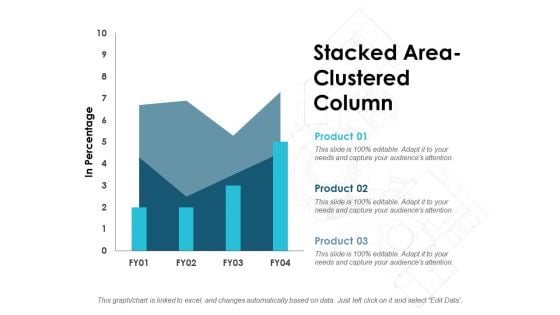
Stacked Area Clustered Column Ppt PowerPoint Presentation Summary Portfolio
This is a stacked area clustered column ppt powerpoint presentation summary portfolio. This is a three stage process. The stages in this process are stacked bar, finance, marketing, management, analysis.
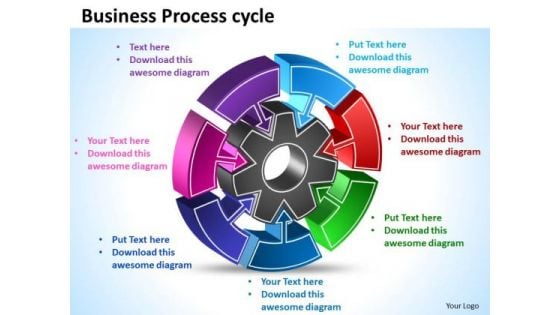
Business Process PowerPoint Templates Business 7 Adjoining Circular Business Chart Ppt Slides
Business Process PowerPoint Templates Business 7 Adjoining Circular Business Chart PPT Slides-Display with these puzzle pieces coherences, process steps, sequences, subareas and workflows. An excellent graphics that help you convey your ideas successfully - no matter what they are.-Business Process PowerPoint Templates Business 7 Adjoining Circular Business Chart PPT Slides Address the conference with elan. Our Business Process PowerPoint Templates Business 7 Adjoining Circular Business Chart Ppt Slides will give your confidence a boost.
Effect For Business Planning Process Ppt Financial PowerPoint Templates
We present our effect for business planning process ppt financial PowerPoint templates.Download our Business PowerPoint Templates because Timeline crunches are a fact of life. Meet all deadlines using our PowerPoint Templates and Slides. Download and present our Flow Charts PowerPoint Templates because Our PowerPoint Templates and Slides will let you Hit the right notes. Watch your audience start singing to your tune. Present our Process and Flows PowerPoint Templates because It will Raise the bar of your Thoughts. They are programmed to take you to the next level. Download and present our Marketing PowerPoint Templates because Our PowerPoint Templates and Slides are aesthetically designed to attract attention. We gaurantee that they will grab all the eyeballs you need. Present our Shapes PowerPoint Templates because Our PowerPoint Templates and Slides are aesthetically designed to attract attention. We gaurantee that they will grab all the eyeballs you need.Use these PowerPoint slides for presentations relating to Star, event, shape, decoration, concept, sign, prize, success, holiday, bright, symbol, festive, celebration, graphic,decor, glare, glow, four, favorite, voting, season, object, decorative, shiny, rating, metallic, web, design, quality, reward, award, shinning, single, jewel, beam, product, metal, dimensional, planning, process. The prominent colors used in the PowerPoint template are Blue light, White, Gray. Sharpen your strategy with our Effect For Business Planning Process Ppt Financial PowerPoint Templates. You will come out on top.

 Home
Home