Improvement Chart
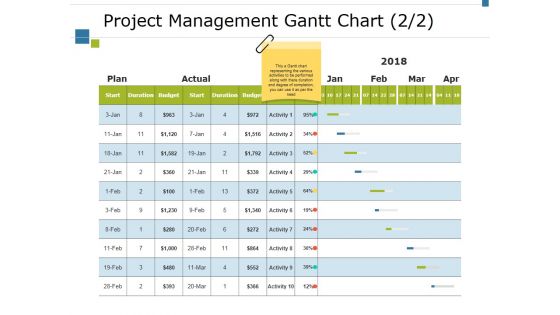
Project Management Gantt Chart Template 1 Ppt PowerPoint Presentation File Design Ideas
This is a project management gantt chart template 1 ppt powerpoint presentation file design ideas. This is a five stage process. The stages in this process are actual, plan, activity, budget, duration.

Project Management Gantt Chart Finance Ppt PowerPoint Presentation File Layout Ideas
This is a project management gantt chart finance ppt powerpoint presentation file layout ideas. This is a three stage process. The stages in this process are business, planning, strategy, marketing, management.
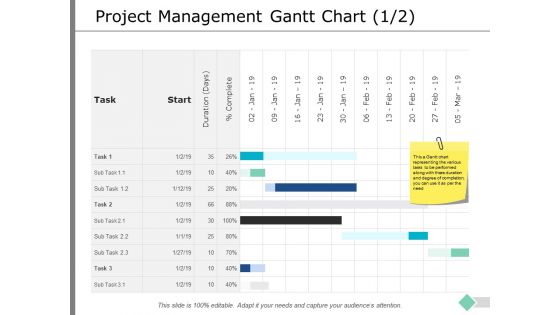
Project Management Gantt Chart Business Ppt PowerPoint Presentation Inspiration Layout Ideas
This is a project management gantt chart business ppt powerpoint presentation inspiration layout ideas. This is a nine stage process. The stages in this process are business, planning, strategy, marketing, management.
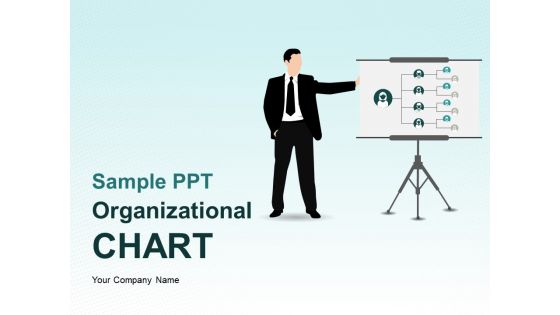
Sample PPT Organizational Chart Ppt PowerPoint Presentation Complete Deck With Slides
This is a sample ppt organizational chart ppt powerpoint presentation complete deck with slides. This is a one stage process. The stages in this process are business, management, planning, strategy, marketing.

Losers Gainers Chart Arrows Business PowerPoint Templates And PowerPoint Themes 1012
Create visually stunning Microsoft office PPT Presentations with our above template which contains an image of Losers and Gainers chart arrows. This image depicts the concept of stock market. It is a useful captivating tool concieved to enable you to define your message in your Business and Marketing PPT presentations. Deliver amazing presentations to mesmerize your audience. Exercise options with our Losers Gainers Chart Arrows Business PowerPoint Templates And PowerPoint Themes 1012. Find answers to multiple challenges.
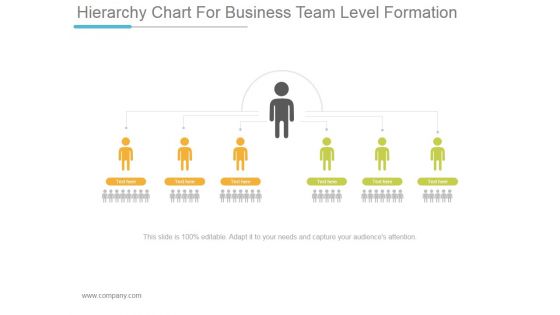
Hierarchy Chart For Business Team Level Formation Ppt PowerPoint Presentation Files
This is a hierarchy chart for business team level formation ppt powerpoint presentation files. This is a six stage process. The stages in this process are business, strategy, marketing, management, communication.
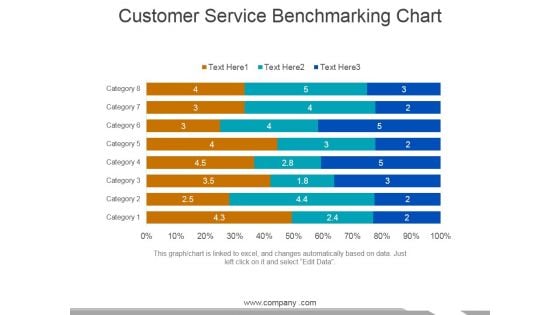
Customer Service Benchmarking Chart Ppt PowerPoint Presentation Infographic Template Graphics Tutorials
This is a customer service benchmarking chart ppt powerpoint presentation infographic template graphics tutorials. This is a eight stage process. The stages in this process are category, business, marketing, management.
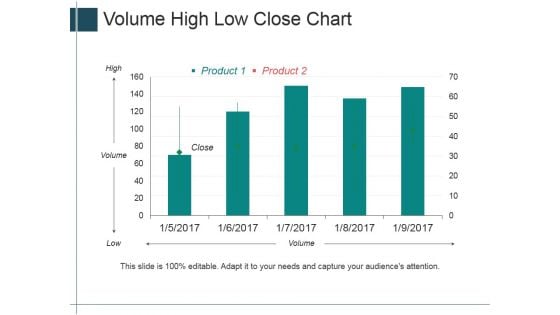
Volume High Low Close Chart Ppt PowerPoint Presentation Summary Layout Ideas
This is a volume high low close chart ppt powerpoint presentation summary layout ideas. This is a five stage process. The stages in this process are high, volume, low, close, product.
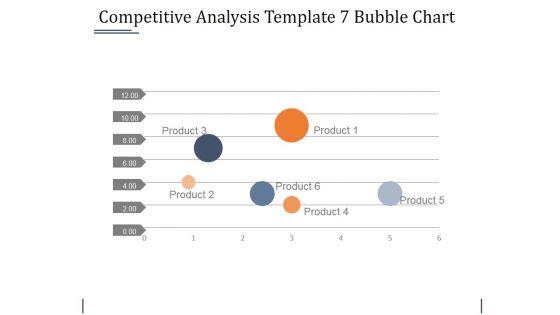
Competitive Analysis Template 7 Bubble Chart Ppt PowerPoint Presentation Summary Guidelines
This is a competitive analysis template 7 bubble chart ppt powerpoint presentation summary guidelines. This is a six stage process. The stages in this process are business, bubble, management, strategy, marketing.
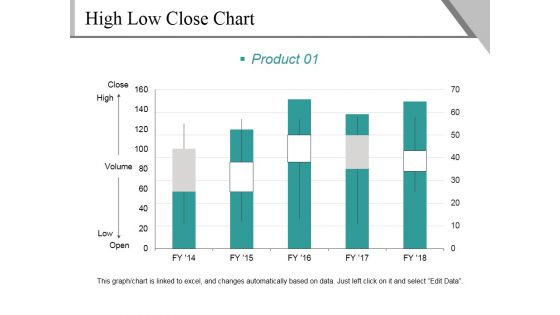
High Low Close Chart Template 1 Ppt PowerPoint Presentation Infographics Graphics Design
This is a high low close chart template 1 ppt powerpoint presentation infographics graphics design. This is a five stage process. The stages in this process are close, high, volume, low, open, product.
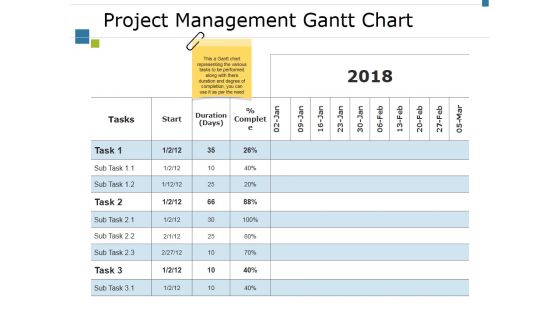
Project Management Gantt Chart Template 2 Ppt PowerPoint Presentation Pictures Outfit
This is a project management gantt chart template 2 ppt powerpoint presentation pictures outfit. This is a three stage process. The stages in this process are start, duration, task, complete, sub task.
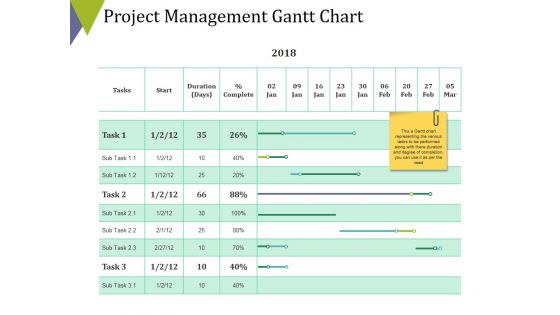
Project Management Gantt Chart Template 1 Ppt PowerPoint Presentation Show Professional
This is a project management gantt chart template 1 ppt powerpoint presentation show professional. This is a nine stage process. The stages in this process are table, business, strategy, compare, marketing.
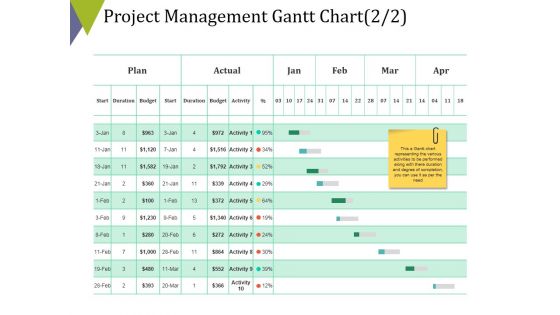
Project Management Gantt Chart Template 2 Ppt PowerPoint Presentation Pictures Model
This is a project management gantt chart template 2 ppt powerpoint presentation pictures model. This is a four stage process. The stages in this process are table, business, strategy, compare, marketing.
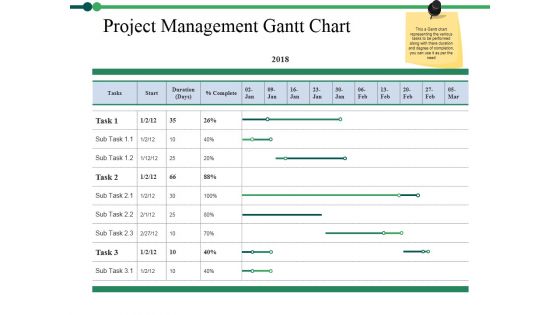
Project Management Gantt Chart Template 1 Ppt PowerPoint Presentation Professional Skills
This is a project management gantt chart template 1 ppt powerpoint presentation professional skills. This is a three stage process. The stages in this process are compare, business, marketing, table, strategy.
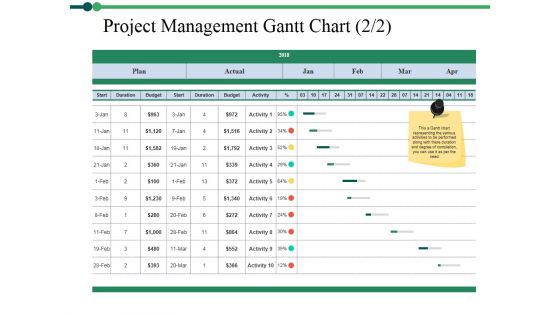
Project Management Gantt Chart Template 2 Ppt PowerPoint Presentation Layouts Smartart
This is a project management gantt chart template 2 ppt powerpoint presentation layouts smartart. This is a four stage process. The stages in this process are compare, business, marketing, table, strategy.
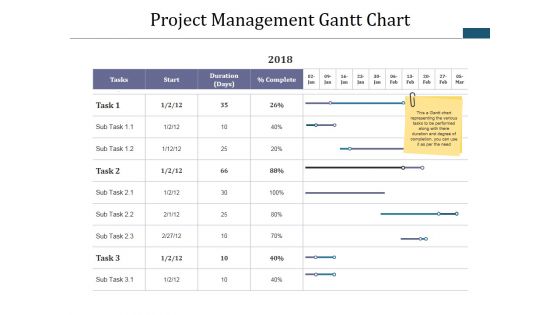
Project Management Gantt Chart Template 1 Ppt PowerPoint Presentation Infographics Tips
This is a project management gantt chart template 1 ppt powerpoint presentation infographics tips. This is a four stage process. The stages in this process are table, business, marketing, strategy, compare.
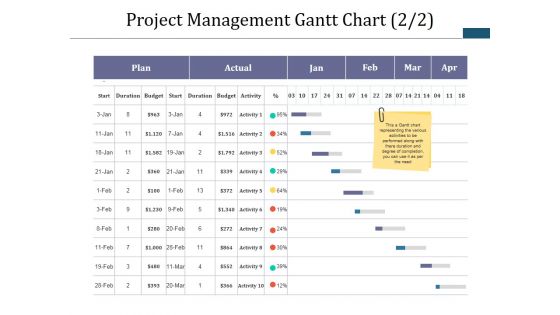
Project Management Gantt Chart Template 2 Ppt PowerPoint Presentation Infographic Template Master Slide
This is a project management gantt chart template 2 ppt powerpoint presentation infographic template master slide. This is a five stage process. The stages in this process are table, business, marketing, strategy, compare.
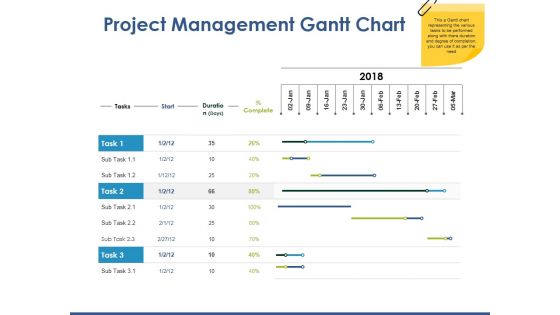
Project Management Gantt Chart Template 1 Ppt PowerPoint Presentation Professional Example File
This is a project management gantt chart template 1 ppt powerpoint presentation professional example file. This is a three stage process. The stages in this process are compare, business, strategy, marketing, table.
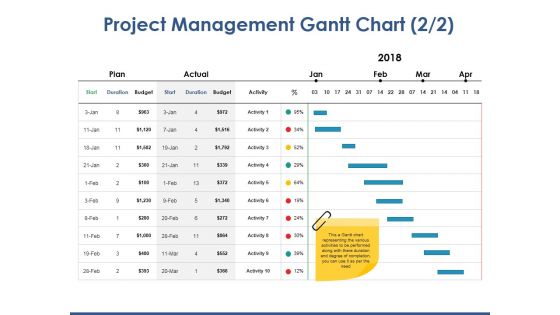
Project Management Gantt Chart Template 2 Ppt PowerPoint Presentation Inspiration Gallery
This is a project management gantt chart template 2 ppt powerpoint presentation inspiration gallery. This is a four stage process. The stages in this process are compare, table, business, strategy, marketing.
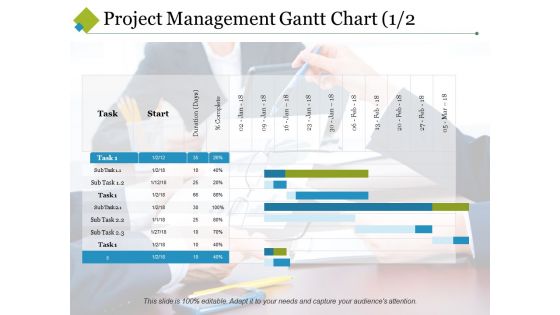
Project Management Gantt Chart Template 1 Ppt PowerPoint Presentation Visual Aids Summary
This is a project management gantt chart template 1 ppt powerpoint presentation visual aids summary. This is a two stage process. The stages in this process are start, task, sub task, duration, complete.
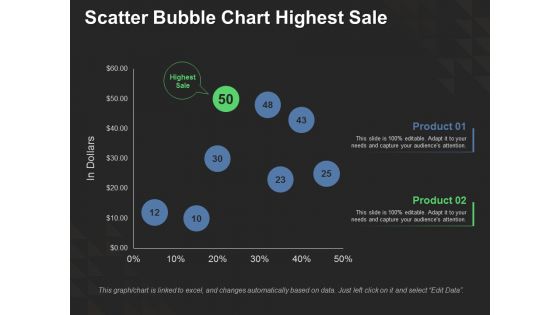
Scatter Bubble Chart Highest Sale Ppt PowerPoint Presentation Show Slide Download
This is a scatter bubble chart highest sale ppt powerpoint presentation show slide download. This is a two stage process. The stages in this process are finance, investment, analysis, business, marketing.
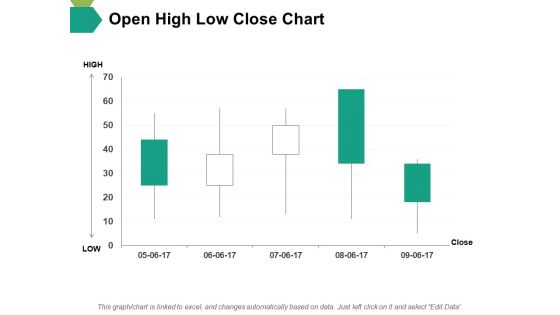
Open High Low Close Chart Ppt PowerPoint Presentation Slides File Formats
This is a open high low close chart ppt powerpoint presentation slides file formats. This is a five stage process. The stages in this process are open, high, low, close, finance.
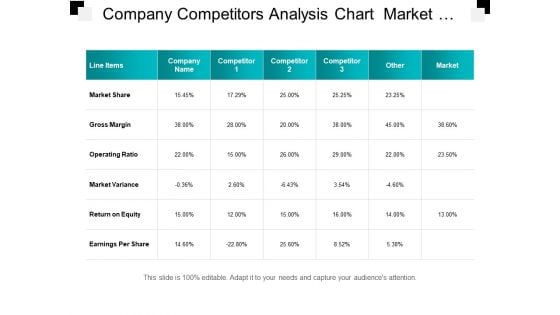
Company Competitors Analysis Chart Market Share And Return On Equity Ppt PowerPoint Presentation Picture
This is a company competitors analysis chart market share and return on equity ppt powerpoint presentation picture. This is a seven stage process. The stages in this process are competitive analysis, benchmark competition, competition landscape.
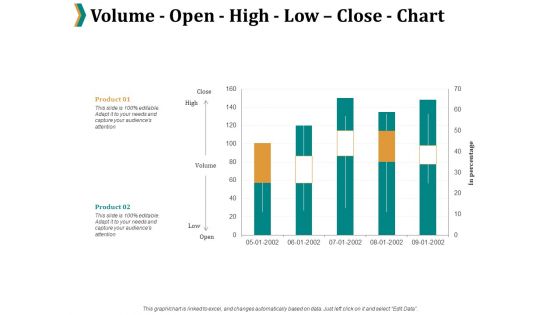
Volume Open High Low Close Chart Ppt PowerPoint Presentation Professional Maker
This is a volume open high low close chart ppt powerpoint presentation professional maker. This is a two stage process. The stages in this process are percentage, product, marketing.
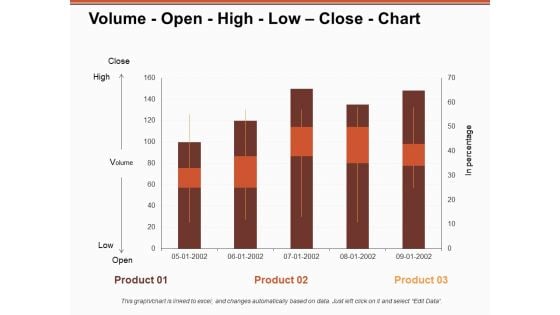
Volume Open High Low Close Chart Ppt PowerPoint Presentation Model Inspiration
This is a volume open high low close chart ppt powerpoint presentation model inspiration. This is a three stage process. The stages in this process are business, management, strategy, marketing, sales.
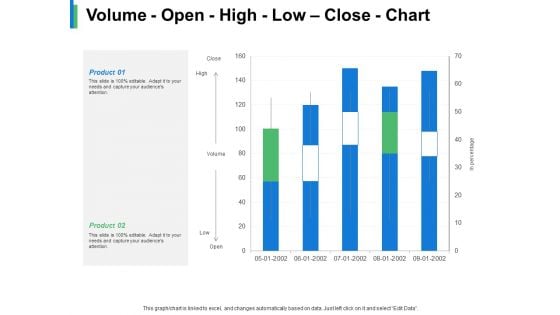
Volume Open High Low Close Chart Product Ppt PowerPoint Presentation Gallery Example
This is a volume open high low close chart product ppt powerpoint presentation gallery example. This is a two stage process. The stages in this process are business, management, strategy, marketing, sales.
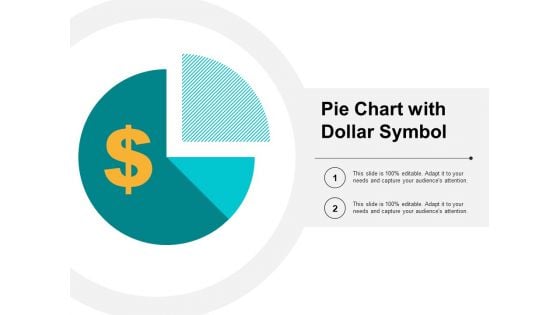
Pie Chart With Dollar Symbol Ppt PowerPoint Presentation Infographic Template Graphics Design
This is a pie chart with dollar symbol ppt powerpoint presentation infographic template graphics design. This is a two stage process. The stages in this process are sectioned circle, segmented circle, partitioned circle.
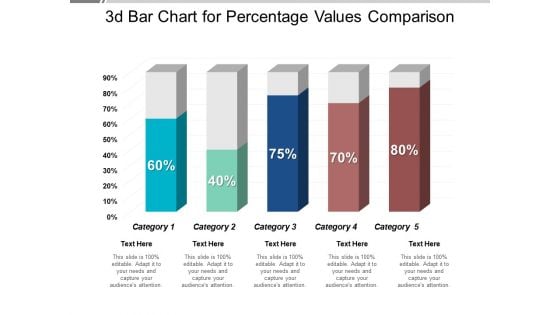
3D Bar Chart For Percentage Values Comparison Ppt PowerPoint Presentation Professional Visual Aids
This is a 3d bar chart for percentage values comparison ppt powerpoint presentation professional visual aids. This is a five stage process. The stages in this process are art, colouring, paint brush.
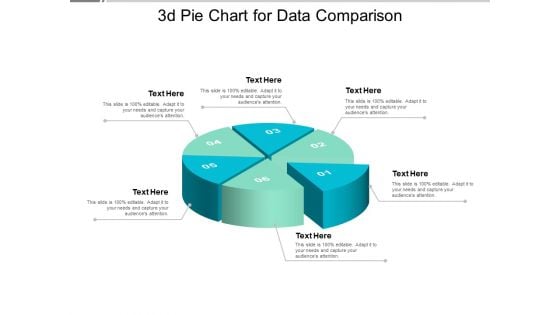
3D Pie Chart For Data Comparison Ppt PowerPoint Presentation Model Design Ideas
This is a 3d pie chart for data comparison ppt powerpoint presentation model design ideas. This is a six stage process. The stages in this process are art, colouring, paint brush.

Column Chart Employee Value Proposition Ppt PowerPoint Presentation Slides Graphics Design
This is a column chart employee value proposition ppt powerpoint presentation slides graphics design. This is a two stage process. The stages in this process are business, management, strategy, analysis, marketing.
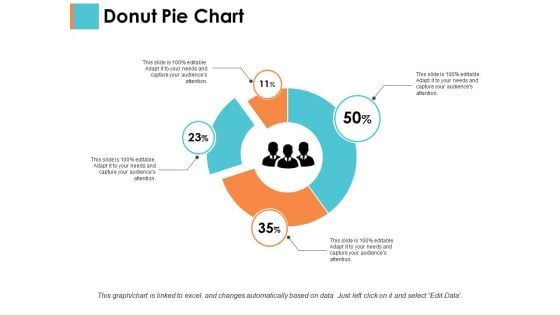
Donut Pie Chart Sample Budget Ppt Ppt PowerPoint Presentation Layouts Styles
This is a donut pie chart sample budget ppt ppt powerpoint presentation layouts styles. This is a four stage process. The stages in this process are business, management, strategy, analysis, marketing.
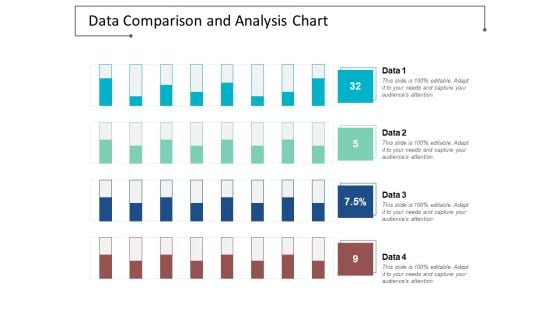
Data Comparison And Analysis Chart Ppt Powerpoint Presentation File Background Images
This is a data comparison and analysis chart ppt powerpoint presentation file background images. This is a four stage process. The stages in this process are data presentation, content presentation, information presentation.
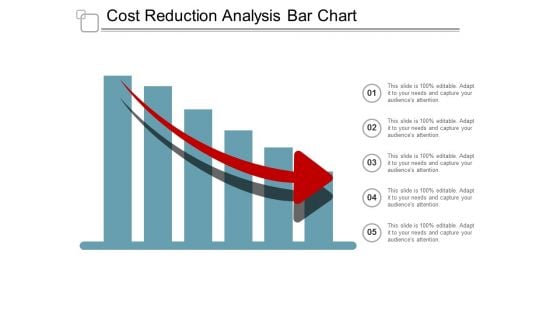
Cost Reduction Analysis Bar Chart Ppt Powerpoint Presentation File Graphics Design
This is a cost reduction analysis bar chart ppt powerpoint presentation file graphics design. This is a five stage process. The stages in this process are data analysis, data science, information science.
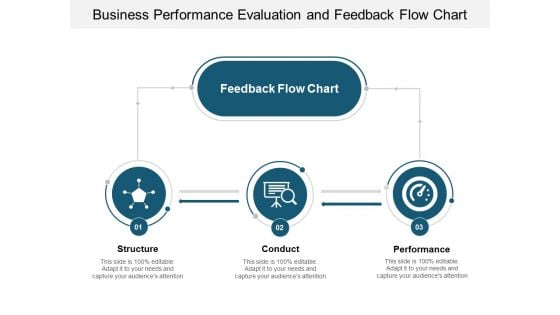
Business Performance Evaluation And Feedback Flow Chart Ppt Powerpoint Presentation Model Example Topics
This is a business performance evaluation and feedback flow chart ppt powerpoint presentation model example topics. This is a three stage process. The stages in this process are performance management, structure conduct performance, performance review and analysis.
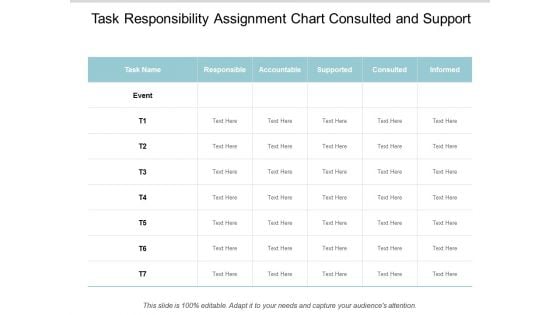
Task Responsibility Assignment Chart Consulted And Support Ppt Powerpoint Presentation Styles Background
This is a task responsibility assignment chart consulted and support ppt powerpoint presentation styles background. This is a seven stage process. The stages in this process are authority matrix, responsibility matrix, leadership matrix.
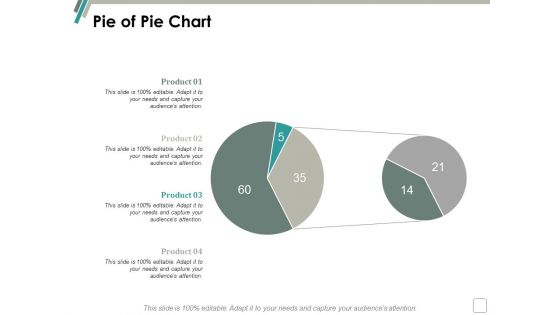
Pie Of Pie Chart Finance Ppt Powerpoint Presentation File Design Templates
This is a pie of pie chart finance ppt powerpoint presentation file design templates. This is a four stage process. The stages in this process are finance, marketing, management, investment, analysis.
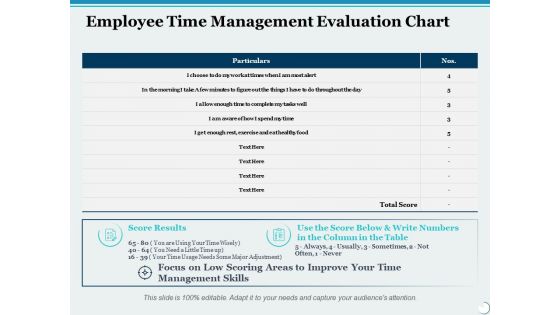
Employee Time Management Evaluation Chart Ppt PowerPoint Presentation File Graphic Images
This is a employee time management evaluation chart ppt powerpoint presentation file graphic images. This is a two stage process. The stages in this process are compare, business, management, marketing.

Bar Chart With Magnifying Glass For Financial Analysis Ppt Powerpoint Presentation Infographics Designs Download
This is a bar chart with magnifying glass for financial analysis ppt powerpoint presentation infographics designs download. This is a three stage process. The stages in this process are business metrics, business kpi, business dashboard.
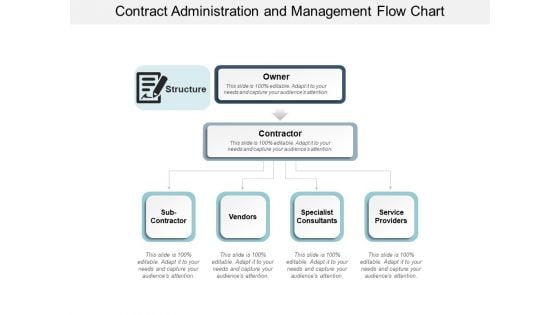
Contract Administration And Management Flow Chart Ppt Powerpoint Presentation File Backgrounds
This is a contract administration and management flow chart ppt powerpoint presentation file backgrounds. This is a four stage process. The stages in this process are contract structure, contract framework, contract model.
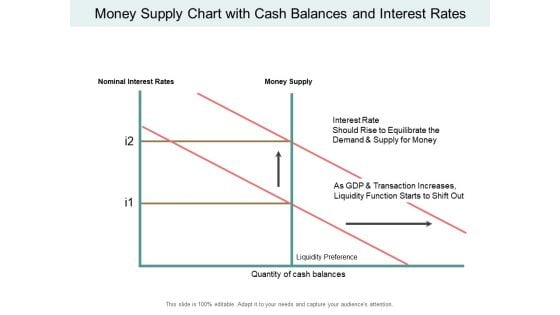
Money Supply Chart With Cash Balances And Interest Rates Ppt PowerPoint Presentation Inspiration Background Images
This is a money supply chart with cash balances and interest rates ppt powerpoint presentation inspiration background images. This is a two stage process. The stages in this process are liquidity, cash assets, solvency.
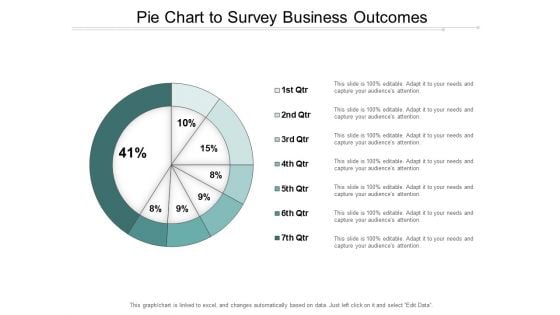
Pie Chart To Survey Business Outcomes Ppt Powerpoint Presentation Infographic Template Gridlines
This is a pie chart to survey business outcomes ppt powerpoint presentation infographic template gridlines. This is a seven stage process. The stages in this process are business outcomes, business results, business output.

Donut Chart Finance Marketing Ppt Powerpoint Presentation Infographics Skills Ppt Powerpoint Presentation File Skills
This is a donut chart finance marketing ppt powerpoint presentation infographics skills ppt powerpoint presentation file skills. This is a four stage process. The stages in this process are finance, marketing, management, investment, analysis.
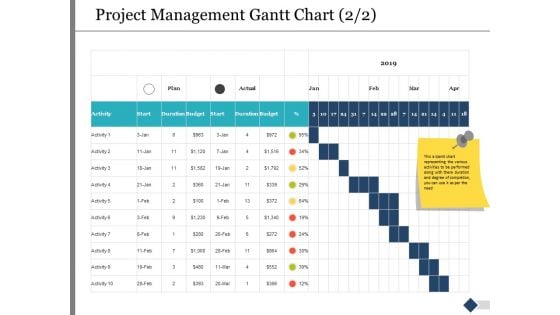
Project Management Gantt Chart Activity Ppt PowerPoint Presentation Model Background Designs
This is a project management gantt chart activity ppt powerpoint presentation model background designs. This is a three stage process. The stages in this process are marketing, business, management, compare.
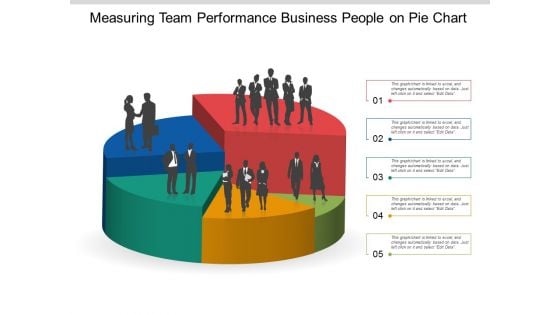
Measuring Team Performance Business People On Pie Chart Ppt Powerpoint Presentation Gallery Smartart
This is a measuring team performance business people on pie chart ppt powerpoint presentation gallery smartart. This is a five stage process. The stages in this process are team performance, member performance, group performance.
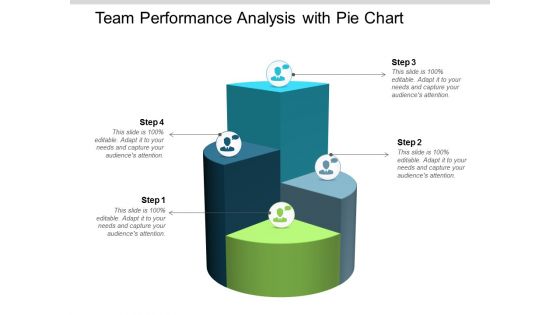
Team Performance Analysis With Pie Chart Ppt Powerpoint Presentation Infographic Template Slideshow
This is a team performance analysis with pie chart ppt powerpoint presentation infographic template slideshow. This is a four stage process. The stages in this process are team performance, member performance, group performance.

Comparison Chart Return On Capital Employed Ppt PowerPoint Presentation Portfolio Templates
This is a comparison chart return on capital employed ppt powerpoint presentation portfolio templates. This is a two stage process. The stages in this process are accounting ratio, roce, return on capital employed.
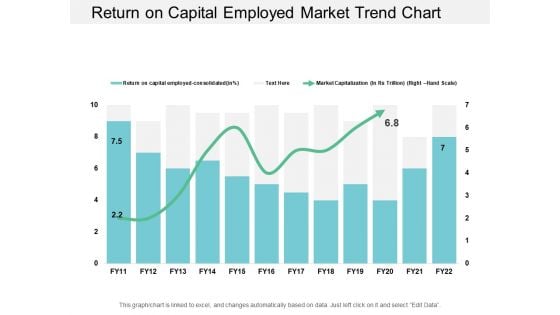
Return On Capital Employed Market Trend Chart Ppt PowerPoint Presentation Styles Examples
This is a return on capital employed market trend chart ppt powerpoint presentation styles examples. This is a two stage process. The stages in this process are accounting ratio, roce, return on capital employed.
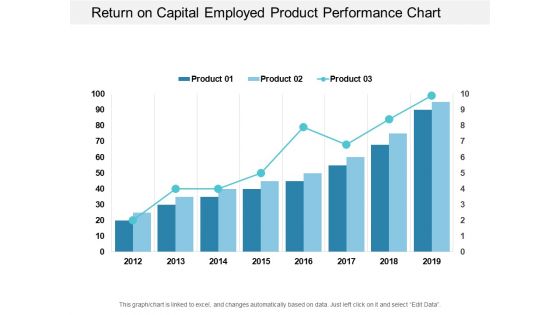
Return On Capital Employed Product Performance Chart Ppt PowerPoint Presentation Portfolio Visuals
This is a return on capital employed product performance chart ppt powerpoint presentation portfolio visuals. This is a three stage process. The stages in this process are accounting ratio, roce, return on capital employed.
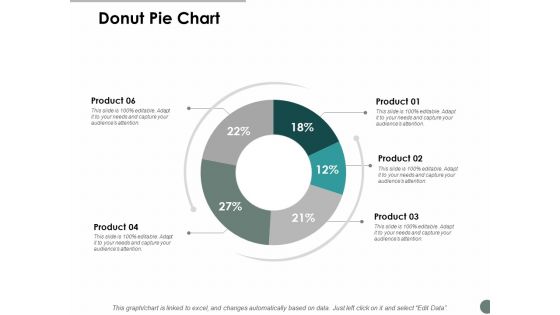
Donut Pie Chart Marketing Ppt Powerpoint Presentation Infographic Template Graphics Template
This is a donut pie chart marketing ppt powerpoint presentation infographic template graphics template. This is a six stage process. The stages in this process are finance, marketing, management, investment, analysis.
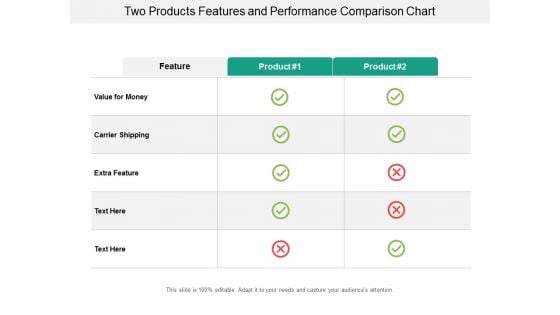
Two Products Features And Performance Comparison Chart Ppt Powerpoint Presentation Ideas Layout Ideas
This is a two products features and performance comparison chart ppt powerpoint presentation ideas layout ideas. This is a two stage process. The stages in this process are product differentiation, product comparison, brand differentiation.
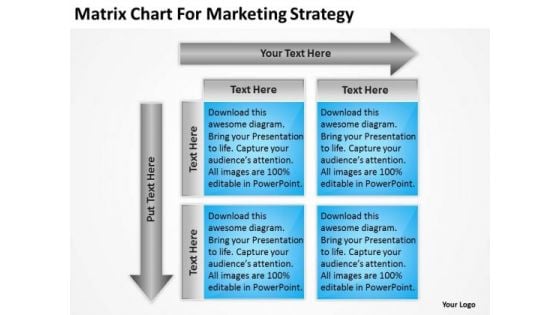
Matrix Chart For Marketing Strategy Ppt Business Proposal Examples PowerPoint Slides
Analyse ailments on our matrix chart for marketing strategy ppt business proposal examples PowerPoint Slides. Bring out the thinking doctor in you. Dock your thoughts with our Boxes Powerpoint templates. They will launch them into orbit. Get out of the dock with our Arrows Powerpoint templates. Your mind will be set free. Get classy with our Matrix Chart For Marketing Strategy Ppt Business Proposal Examples PowerPoint Slides. They ensure A-list clients.
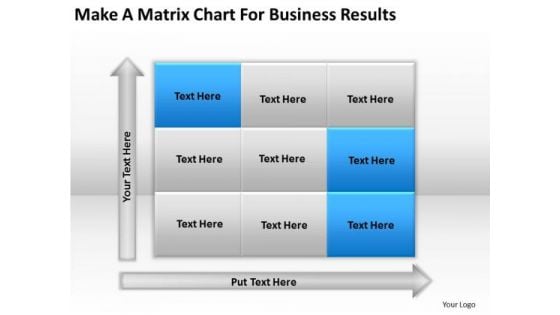
Make Matrix Chart For Business Results Ppt Realtor Plan PowerPoint Templates
However dull the topic maybe. Our make matrix chart for business results ppt realtor plan PowerPoint templates will arouse interest. Ask for assistance from our Boxes Powerpoint templates. You will be duly satisfied. Dump your doubt in the trash bin. Get certitude with our Arrows Powerpoint templates. Bend it better with our Make Matrix Chart For Business Results Ppt Realtor Plan PowerPoint Templates. Your thoughts will hit the correct curve.
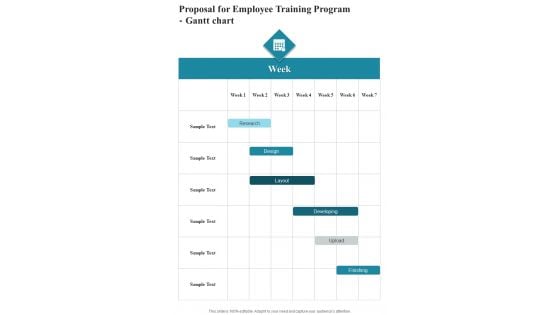
Proposal For Employee Training Program Gantt Chart One Pager Sample Example Document
Presenting you an exemplary Proposal For Employee Training Program Gantt Chart One Pager Sample Example Document. Our one-pager comprises all the must-have essentials of an inclusive document. You can edit it with ease, as its layout is completely editable. With such freedom, you can tweak its design and other elements to your requirements. Download this Proposal For Employee Training Program Gantt Chart One Pager Sample Example Document brilliant piece now.
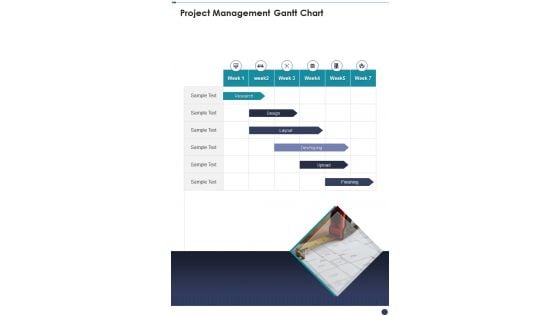
Entrepreneurship Skill Program Proposal Project Management Gantt Chart One Pager Sample Example Document
Presenting you an exemplary Entrepreneurship Skill Program Proposal Project Management Gantt Chart One Pager Sample Example Document. Our one pager comprises all the must have essentials of an inclusive document. You can edit it with ease, as its layout is completely editable. With such freedom, you can tweak its design and other elements to your requirements. Download this Entrepreneurship Skill Program Proposal Project Management Gantt Chart One Pager Sample Example Document brilliant piece now.

Gantt Chart For Television Program Sponsorship Proposal One Pager Sample Example Document
Presenting you an exemplary Gantt Chart For Television Program Sponsorship Proposal One Pager Sample Example Document. Our one-pager comprises all the must-have essentials of an inclusive document. You can edit it with ease, as its layout is completely editable. With such freedom, you can tweak its design and other elements to your requirements. Download this Gantt Chart For Television Program Sponsorship Proposal One Pager Sample Example Document brilliant piece now.
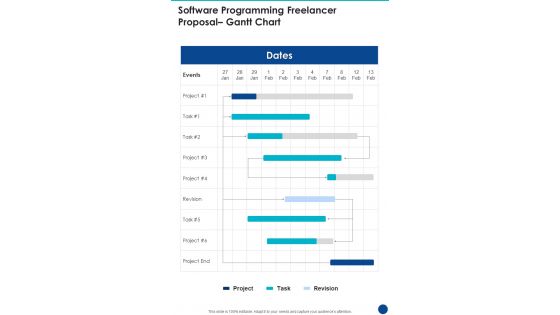
Software Programming Freelancer Proposal Gantt Chart One Pager Sample Example Document
Presenting you an exemplary Software Programming Freelancer Proposal Gantt Chart One Pager Sample Example Document. Our one-pager comprises all the must-have essentials of an inclusive document. You can edit it with ease, as its layout is completely editable. With such freedom, you can tweak its design and other elements to your requirements. Download this Software Programming Freelancer Proposal Gantt Chart One Pager Sample Example Document brilliant piece now.
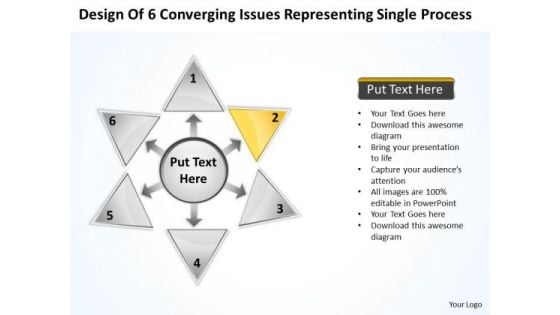
Of 6 Converging Issues Representing Single Process Circular Spoke Chart PowerPoint Slides
We present our of 6 converging issues representing single process Circular Spoke Chart PowerPoint Slides.Present our Shapes PowerPoint Templates because clarity of thought has been the key to your growth. Present our Business PowerPoint Templates because the great Bald headed Eagle embodies your personality. the eagle eye to seize upon the smallest of opportunities. Download our Arrows PowerPoint Templates because they will Amplify your thoughts via our appropriate templates. Use our Symbol PowerPoint Templates because your marketing strategies can funnel down to the cone, stage by stage, refining as you go along. Download our Signs PowerPoint Templates because you know Coincidentally it will always point to the top.Use these PowerPoint slides for presentations relating to 3d, Abstract, Arrow, Business, Chart, Circle, Circular, Collection, Color, Continuity, Cycle, Decoration, Design, Diagram, Dimensional, Direction, Element, Flow, Glossy, Graph, Icon, Illustration, Isolated, Modern, Motion, Movement, Pattern, Pie, Recycling, Repetition, Report, Ring, Round, Scheme, Section, Set, Shape, Shiny, Sign, Slice, Spinning, Symbol. The prominent colors used in the PowerPoint template are Yellow, Gray, Black. Use our of 6 converging issues representing single process Circular Spoke Chart PowerPoint Slides are Second to none. We assure you our Arrow PowerPoint templates and PPT Slides are Enchanting. People tell us our of 6 converging issues representing single process Circular Spoke Chart PowerPoint Slides are Efficient. PowerPoint presentation experts tell us our Chart PowerPoint templates and PPT Slides are Excellent. PowerPoint presentation experts tell us our of 6 converging issues representing single process Circular Spoke Chart PowerPoint Slides will get their audience's attention. Use our Circle PowerPoint templates and PPT Slides are Amazing. With our Of 6 Converging Issues Representing Single Process Circular Spoke Chart PowerPoint Slides you'll more than break even. Add to the entries in the credit column.
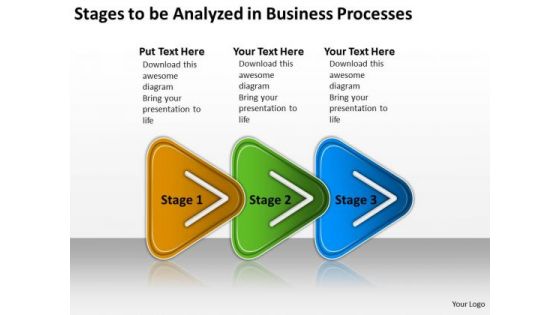
Be Analyzed In Business PowerPoint Theme Processes Flow Chart Creator Online Templates
We present our be analyzed in business powerpoint theme processes flow chart creator online templates.Download our Arrows PowerPoint Templates because our PowerPoint templates give this step by step process to acheive the aim. Download our Marketing PowerPoint Templates because networking is an imperative in todays world. You need to access the views of others. Similarly you need to give access to them of your abilities. Download our Success PowerPoint Templates because your quest has taken you well onto the path of success. Present our Process and Flows PowerPoint Templates because clear thnking is your strength, transmit your thoughts to your eager team. Use our Business PowerPoint Templates because the fruits of your labour are beginning to show.Enlighten them on the great plans you have for their enjoyment.Use these PowerPoint slides for presentations relating to Abstract, Arrow, Arrows, Business, Chart, Design, Development, Diagram, Direction, Element, Flow, Flowchart, Graph, Linear, Management, Model, Motion, Organization, Plan, Process, Program, Section, Segment, Set, Sign, Solution, Strategy, Symbol, Technology. The prominent colors used in the PowerPoint template are Blue, Green, Yellow. Customers tell us our be analyzed in business powerpoint theme processes flow chart creator online templates are Precious. The feedback we get is that our Chart PowerPoint templates and PPT Slides are Wistful. Professionals tell us our be analyzed in business powerpoint theme processes flow chart creator online templates are Second to none. People tell us our Arrows PowerPoint templates and PPT Slides are Tranquil. Customers tell us our be analyzed in business powerpoint theme processes flow chart creator online templates are Colorful. Professionals tell us our Diagram PowerPoint templates and PPT Slides are Dynamic. Beat the crowd with our Be Analyzed In Business PowerPoint Theme Processes Flow Chart Creator Online Templates. You will come out on top.
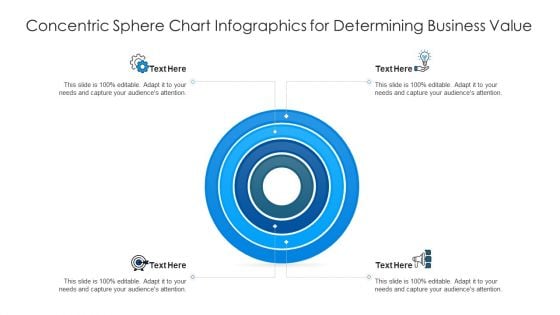
Concentric Sphere Chart Infographics For Determining Business Value Ppt Professional Template PDF
Persuade your audience using this concentric sphere chart infographics for determining business value ppt professional template pdf. This PPT design covers four stages, thus making it a great tool to use. It also caters to a variety of topics including concentric sphere chart infographics for determining business value. Download this PPT design now to present a convincing pitch that not only emphasizes the topic but also showcases your presentation skills.
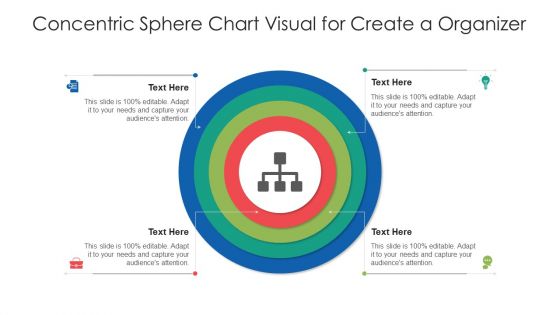
Concentric Sphere Chart Visual For Create A Organizer Ppt Infographic Template Example File
Persuade your audience using this concentric sphere chart visual for create a organizer ppt infographic template example file. This PPT design covers four stages, thus making it a great tool to use. It also caters to a variety of topics including concentric sphere chart visual for create a organizer. Download this PPT design now to present a convincing pitch that not only emphasizes the topic but also showcases your presentation skills.


 Continue with Email

 Home
Home


