Improvement Chart
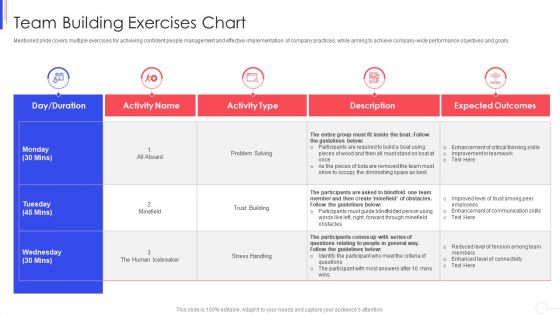
Strategy To Improve Team Proficiency Team Building Exercises Chart Mockup PDF
Following slide depicts key team building exercises including round tables, concentration activities and the human knot challenge to build leadership skills, enhancing team bonding and hone problem solving skills etc. Deliver and pitch your topic in the best possible manner with this strategy to improve team proficiency team building exercises chart mockup pdf. Use them to share invaluable insights on team building exercises chart and impress your audience. This template can be altered and modified as per your expectations. So, grab it now.
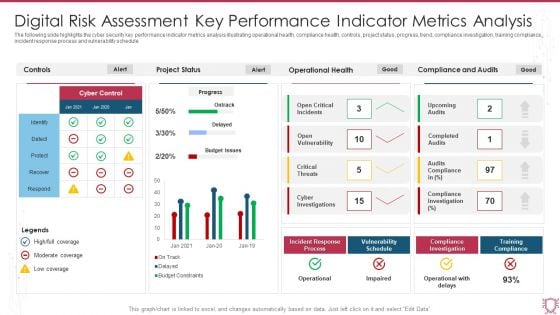
Digital Risk Assessment Key Performance Indicator Metrics Analysis Infographics PDF
The following slide highlights the cyber security key performance indicator metrics analysis illustrating operational health, compliance health, controls, project status, progress, trend, compliance investigation, training compliance, incident response process and vulnerability schedule. Showcasing this set of slides titled Digital Risk Assessment Key Performance Indicator Metrics Analysis Infographics PDF. The topics addressed in these templates are Project Status, Operational Health, Compliance And Audits. All the content presented in this PPT design is completely editable. Download it and make adjustments in color, background, font etc. as per your unique business setting.
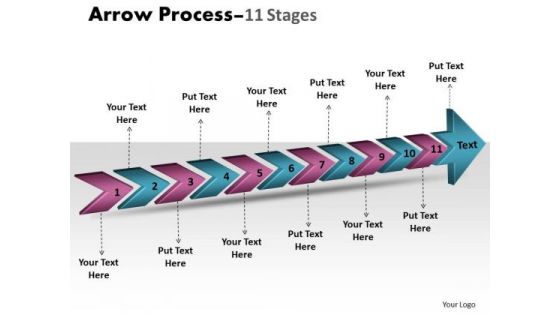
Marketing Diagram 3d Arrow Process 11 Stages Sales Diagram
Be The Doer With Our Marketing Diagram 3D Arrow Process 11 Stages Sales Diagram Powerpoint Templates. Put Your Thoughts Into Practice.
Icons Slide For Data Center Services Contractor Bid Proposal One Pager Sample Example Document
Presenting you an exemplary Icons Slide For Data Center Services Contractor Bid Proposal One Pager Sample Example Document. Our one-pager comprises all the must-have essentials of an inclusive document. You can edit it with ease, as its layout is completely editable. With such freedom, you can tweak its design and other elements to your requirements. Download this Icons Slide For Data Center Services Contractor Bid Proposal One Pager Sample Example Document brilliant piece now.
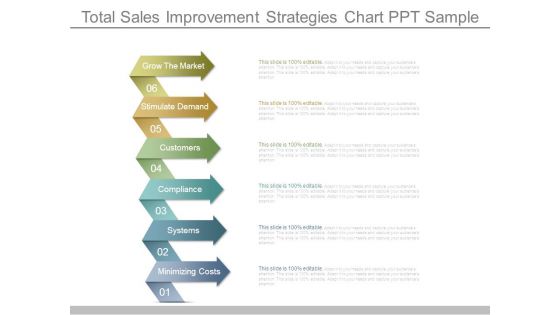
Total Sales Improvement Strategies Chart Ppt Sample
This is a total sales improvement strategies chart ppt sample. This is a six stage process. The stages in this process are grow the market, stimulate demand, customers, compliance, systems, minimizing costs.
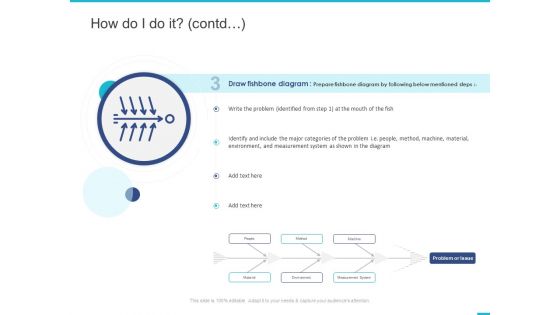
Fishbone Ishikawa Cause And Effect Analysis How Do I Do It Contd Material Ppt PowerPoint Presentation Model Picture PDF
Presenting this set of slides with name fishbone ishikawa cause and effect analysis how do i do it contd material ppt powerpoint presentation model picture pdf. This is a one stage process. The stages in this process are draw fishbone diagram, problem, measurement system, material. This is a completely editable PowerPoint presentation and is available for immediate download. Download now and impress your audience.
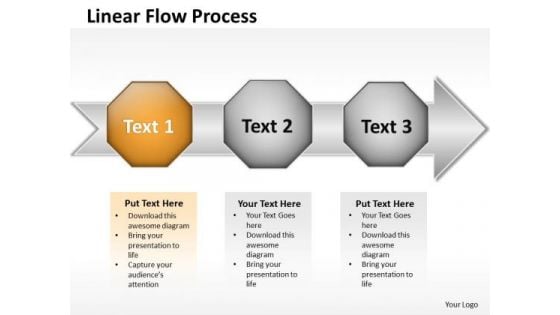
Ppt Linear Flow PowerPoint Theme Arrow Process Create Macro Templates
PPT linear flow powerpoint theme arrow process create macro Templates-This PowerPoint slide is a linear flow diagram that displays the sequence of work steps that make up a process. This tool can help identify rework and redundant or unnecessary steps within a process.-PPT linear flow powerpoint theme arrow process create macro Templates-3d, Advertisement, Advertising, Arrow, Border, Business, Circles, Collection, Customer, Design, Element, Icon, Idea, Illustration, Info, Information, Isolated, Label, Light, Location, Needle, New, Notification, Notify, Point, Pointer, Promotion, Role, Rounded Our Ppt Linear Flow PowerPoint Theme Arrow Process Create Macro Templates will ensure your ideas are presented well. You will be glad you tried us out.

MOST Analysis Technique For Business Analysis Summary PDF
Following slide shows use of MOST analysis that assure alignment of company objectives with other influencing factors. It includes elements such as mission, objectives, strategy and tactics. Create an editable MOST Analysis Technique For Business Analysis Summary PDF that communicates your idea and engages your audience. Whether you are presenting a business or an educational presentation, pre-designed presentation templates help save time. MOST Analysis Technique For Business Analysis Summary PDF is highly customizable and very easy to edit, covering many different styles from creative to business presentations. Slidegeeks has creative team members who have crafted amazing templates. So, go and get them without any delay.
Improvement Steps Chart Presentation Images
This is a improvement steps chart presentation images. This is a five stage process. The stages in this process are presentation, marketing, strategy, management.
Business Quality Improvement Chart Icon With Arrow Graphics PDF
Persuade your audience using this Business Quality Improvement Chart Icon With Arrow Graphics PDF This PPT design covers one stage, thus making it a great tool to use. It also caters to a variety of topics including Business Quality, Improvement Chart, Icon With Arrow Download this PPT design now to present a convincing pitch that not only emphasizes the topic but also showcases your presentation skills.
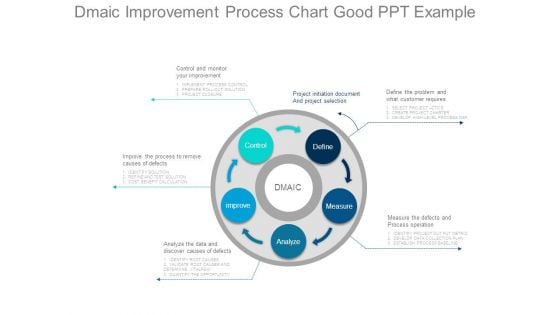
Dmaic Improvement Process Chart Good Ppt Example
This is a dmaic improvement process chart good ppt example. This is a five stage process. The stages in this process are dmaic, control, improve, analyze, measure, define, control and monitor your improvement, project initiation document and project selection, define the problem and what customer requires, improve the process to remove causes of defects, analyze the data and discover causes of defects, measure the defects and process operation, implement process control, prepare roll out solution, project closure, select project ctos, create project charter, develop high level process map, identify solution, refine and test solution, cost benefit calculation, identify root causes, validate root causes and determine vitalfew, quantify the opportunity, identify project out put metric, develop data collection plan, establish process baseline.
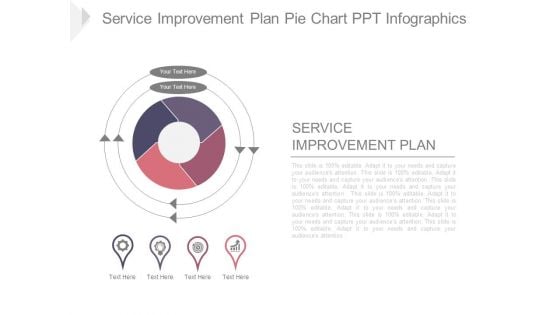
Service Improvement Plan Pie Chart Ppt Infographics
This is a service improvement plan pie chart ppt infographics. This is a four stage process. The stages in this process are service improvement plan, business, strategy, marketing, management.
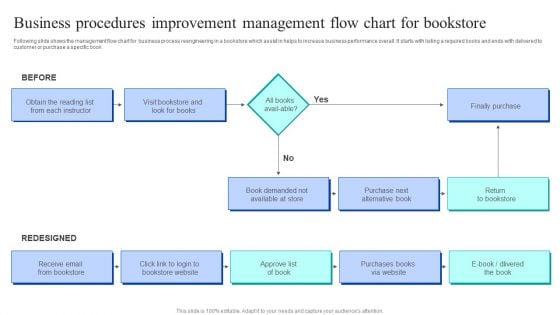
Business Procedures Improvement Management Flow Chart For Bookstore Sample PDF
Following slide shows the management flow chart for business process reengineering in a bookstore which assist in helps to increase business performance overall .It starts with listing a required books and ends with delivered to customer or purchase a specific book. Presenting Business Procedures Improvement Management Flow Chart For Bookstore Sample PDF to dispense important information. This template comprises one stages. It also presents valuable insights into the topics including Book Demanded, Next Alternative Book, Return Bookstore. This is a completely customizable PowerPoint theme that can be put to use immediately. So, download it and address the topic impactfully.
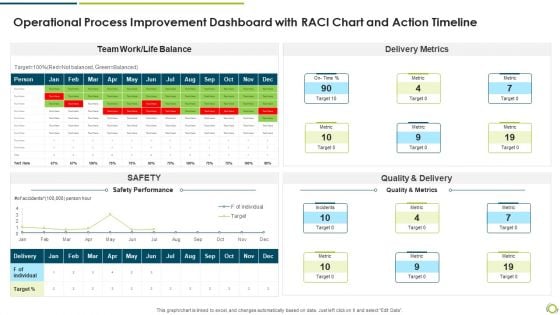
Operational Process Improvement Dashboard With RACI Chart And Action Timeline Themes PDF
Deliver an awe inspiring pitch with this creative operational process improvement dashboard with raci chart and action timeline themes pdf bundle. Topics like quality and delivery, delivery metrics, safety performance can be discussed with this completely editable template. It is available for immediate download depending on the needs and requirements of the user.
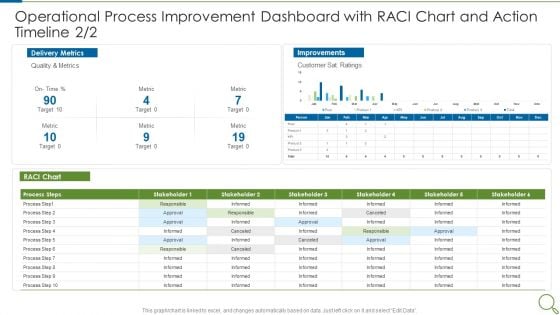
Operational Process Improvement Dashboard With RACI Chart And Action Timeline Metric Designs PDF
Deliver an awe inspiring pitch with this creative operational process improvement dashboard with raci chart and action timeline metric designs pdf bundle. Topics like metric, target, quality, customer can be discussed with this completely editable template. It is available for immediate download depending on the needs and requirements of the user.
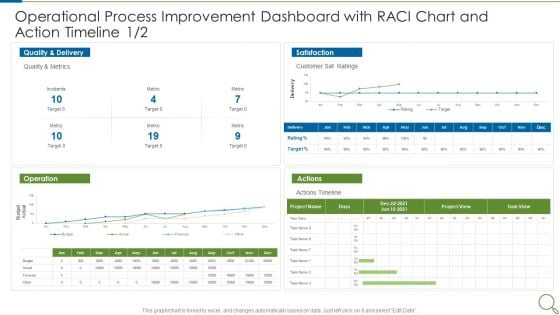
Operational Process Improvement Dashboard With RACI Chart And Action Timeline Target Summary PDF
Deliver and pitch your topic in the best possible manner with this operational process improvement dashboard with raci chart and action timeline target summary pdf. Use them to share invaluable insights on quality, metrics, customer and impress your audience. This template can be altered and modified as per your expectations. So, grab it now.
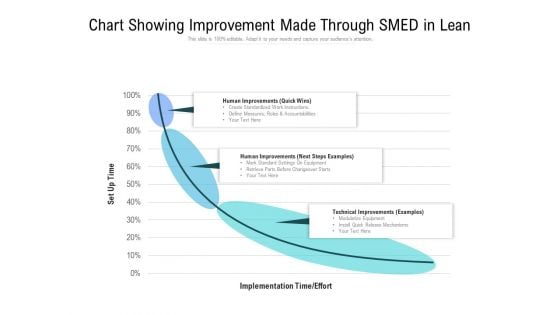
Chart Showing Improvement Made Through SMED In Lean Ppt PowerPoint Presentation Gallery Graphics Download PDF
Presenting chart showing improvement made through smed in lean ppt powerpoint presentation gallery graphics download pdf to dispense important information. This template comprises three stages. It also presents valuable insights into the topics including human improvements, technical, implementation. This is a completely customizable PowerPoint theme that can be put to use immediately. So, download it and address the topic impactfully.
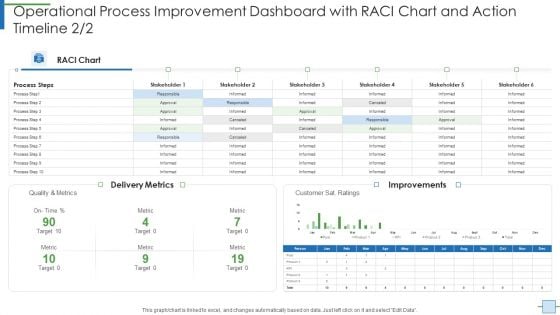
Operational Process Improvement Dashboard With RACI Chart And Action Timeline Matrix Guidelines PDF
Deliver and pitch your topic in the best possible manner with this operational process improvement dashboard with raci chart and action timeline matrix guidelines pdf. Use them to share invaluable insights on delivery metrics, target, customer and impress your audience. This template can be altered and modified as per your expectations. So, grab it now.
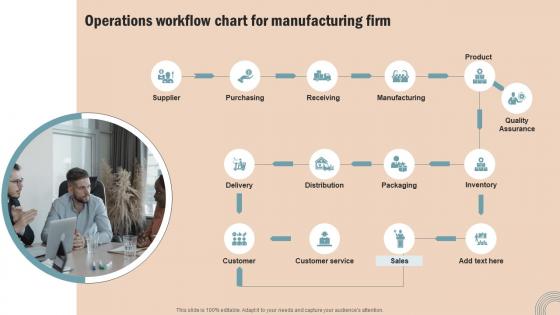
Operations Workflow Chart Operations Strategy Improve Business Productivity Slides Pdf
Presenting this PowerPoint presentation, titled Operations Workflow Chart Operations Strategy Improve Business Productivity Slides Pdf, with topics curated by our researchers after extensive research. This editable presentation is available for immediate download and provides attractive features when used. Download now and captivate your audience. Presenting this Operations Workflow Chart Operations Strategy Improve Business Productivity Slides Pdf. Our researchers have carefully researched and created these slides with all aspects taken into consideration. This is a completely customizable Operations Workflow Chart Operations Strategy Improve Business Productivity Slides Pdf that is available for immediate downloading. Download now and make an impact on your audience. Highlight the attractive features available with our PPTs. Our Operations Workflow Chart Operations Strategy Improve Business Productivity Slides Pdf are topically designed to provide an attractive backdrop to any subject. Use them to look like a presentation pro.
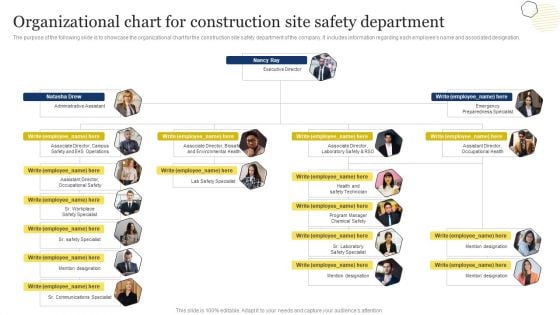
Improvement Of Safety Performance At Construction Site Organizational Chart For Construction Slides PDF
The purpose of the following slide is to showcase the organizational chart for the construction site safety department of the company. It includes information regarding each employees name and associated designation. This Improvement Of Safety Performance At Construction Site Organizational Chart For Construction Slides PDF is perfect for any presentation, be it in front of clients or colleagues. It is a versatile and stylish solution for organizing your meetings. The Improvement Of Safety Performance At Construction Site Organizational Chart For Construction Slides PDF features a modern design for your presentation meetings. The adjustable and customizable slides provide unlimited possibilities for acing up your presentation. Slidegeeks has done all the homework before launching the product for you. So, dont wait, grab the presentation templates today
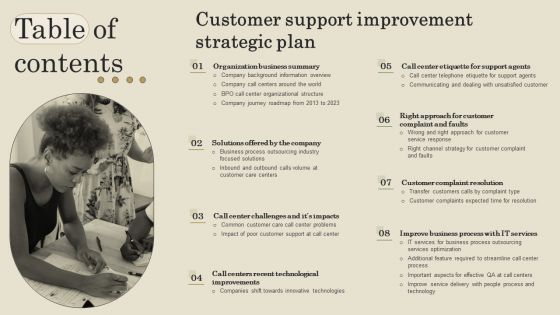
Table Of Contents Customer Support Improvement Strategic Plan Ppt PowerPoint Presentation Diagram Graph Charts PDF
Coming up with a presentation necessitates that the majority of the effort goes into the content and the message you intend to convey. The visuals of a PowerPoint presentation can only be effective if it supplements and supports the story that is being told. Keeping this in mind our experts created Table Of Contents Customer Support Improvement Strategic Plan Ppt PowerPoint Presentation Diagram Graph Charts PDF to reduce the time that goes into designing the presentation. This way, you can concentrate on the message while our designers take care of providing you with the right template for the situation.
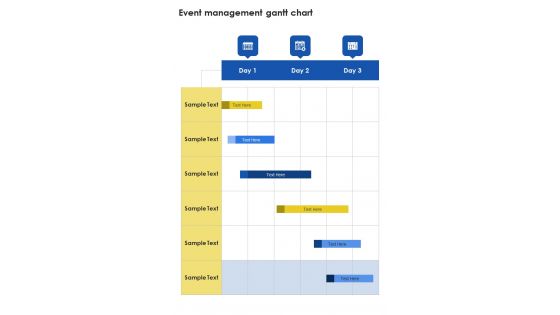
Contractors Bid Proposal For Organizing Exhibitions Event Management Gantt Chart One Pager Sample Example Document
Presenting you an exemplary Contractors Bid Proposal For Organizing Exhibitions Event Management Gantt Chart One Pager Sample Example Document. Our one-pager comprises all the must-have essentials of an inclusive document. You can edit it with ease, as its layout is completely editable. With such freedom, you can tweak its design and other elements to your requirements. Download this Contractors Bid Proposal For Organizing Exhibitions Event Management Gantt Chart One Pager Sample Example Document brilliant piece now.

Improving Corporate Performance KPI Dashboard To Track Risk Events Sample PDF
This slide displays KPI dashboard that can be used by a firm to track multiple risk events. Metrics covered in the dashboard are residual risks by period and risk category by total risk rating. Are you in need of a template that can accommodate all of your creative concepts This one is crafted professionally and can be altered to fit any style. Use it with Google Slides or PowerPoint. Include striking photographs, symbols, depictions, and other visuals. Fill, move around, or remove text boxes as desired. Test out color palettes and font mixtures. Edit and save your work, or work with colleagues. Download Improving Corporate Performance KPI Dashboard To Track Risk Events Sample PDF and observe how to make your presentation outstanding. Give an impeccable presentation to your group and make your presentation unforgettable.
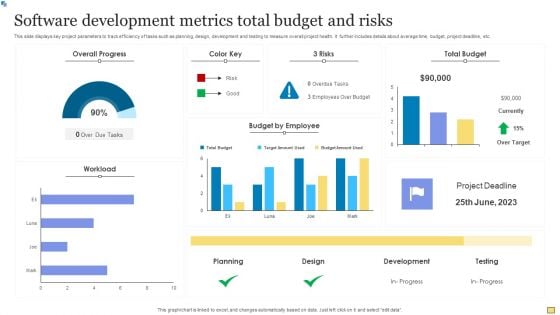
Software Development Metrics Total Budget And Risks Summary PDF
This slide displays key project parameters to track efficiency of tasks such as planning, design, development and testing to measure overall project health. It further includes details about average time, budget, project deadline, etc. Showcasing this set of slides titled Software Development Metrics Total Budget And Risks Summary PDF. The topics addressed in these templates are Overall Progress, Workload Employee, Total Budget. All the content presented in this PPT design is completely editable. Download it and make adjustments in color, background, font etc. as per your unique business setting.
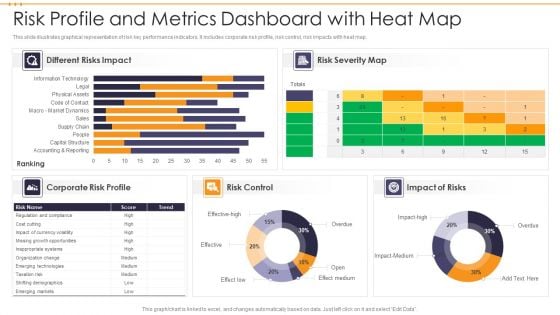
Risk Profile And Metrics Dashboard With Heat Map Brochure PDF
This slide illustrates graphical representation of risk key performance indicators. It includes corporate risk profile, risk control, risk impacts with heat map. Showcasing this set of slides titled Risk Profile And Metrics Dashboard With Heat Map Brochure PDF. The topics addressed in these templates are Risk Control, Impact Of Risks, Risk Severity Map. All the content presented in this PPT design is completely editable. Download it and make adjustments in color, background, font etc. as per your unique business setting.
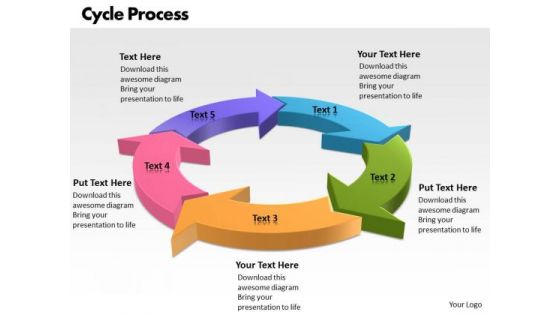
Ppt Factors Of Cycle Communication Process PowerPoint Presentation 5 Stages Templates
PPT factors of cycle communication process powerpoint presentation 5 stages Templates-Use this PowerPoint Diagram to explain the cycle process for communication purpose. It shows five stages attached to each other to form an interconnected Mechanism. It symbolizes affiliation, affinity, alliance, association, connection etc.-PPT factors of cycle communication process powerpoint presentation 5 stages Templates-Cycle, Process, 5 Stages, Arrows, Background, Beautiful, Bright, Business, Circle, Collection, Color, Colorful, Concentric, Concept, Element, Graphic, Green, Group, Icon, Illustration, Image, Render, Round, Sample, Shape, Solution, Style, Success, Symbol, Technology, Wheel Exceed expectations with our Ppt Factors Of Cycle Communication Process PowerPoint Presentation 5 Stages Templates. You will come out on top.
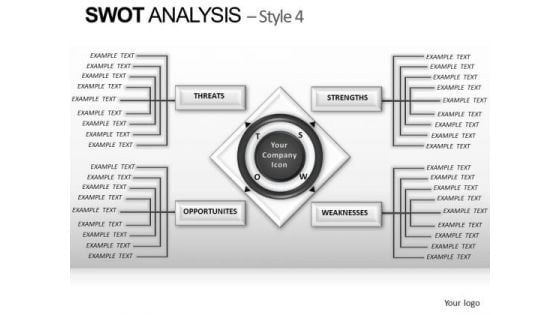
PowerPoint Template Marketing Swot Analysis Ppt Layouts
PowerPoint Template Marketing SWOT Analysis PPT Layouts.pptx-These high quality powerpoint pre-designed slides and powerpoint templates have been carefully created by our professional team to help you impress your audience. All slides have been created and are 100% editable in powerpoint. Each and every property of any graphic - color, size, orientation, shading, outline etc. can be modified to help you build an effective powerpoint presentation. Any text can be entered at any point in the powerpoint template or slide. Simply DOWNLOAD, TYPE and PRESENT! Get down to business fast. Put down the accelerator with our PowerPoint Template Marketing Swot Analysis Ppt Layouts.
Portfolio Management Process Ppt PowerPoint Presentation Icon
This is a portfolio management process ppt powerpoint presentation icon. This is a five stage process. The stages in this process are define, analyze, control, improve, measure.
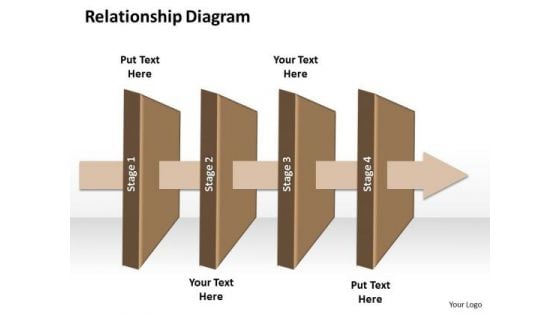
Ppt Linear Process Business PowerPoint Theme Relationship Diagram Templates
PPT linear process business powerpoint theme relationship diagram Templates-This PowerPoint Diagram shows you the Linear Series of five stages through an arrow. It shows the Successive concepts to be explained together in one process. You can change color, size and orientation of any icon to your liking.-PPT linear process business powerpoint theme relationship diagram Templates-3d, Air, Arrow, Art, Business, Chart, Clip, Clipart, Cooling, Diagram, Drip, Drop, Dry, Energy, Eps10, Evaporate, Evaporating, Evaporation, Graphic, Heat, Icon, Illustration, Isolated, Isometric, Layers, Material, Moisture, Process Put the audience firmly in your favour. Extract their appreciation with our Ppt Linear Process Business PowerPoint Theme Relationship Diagram Templates.
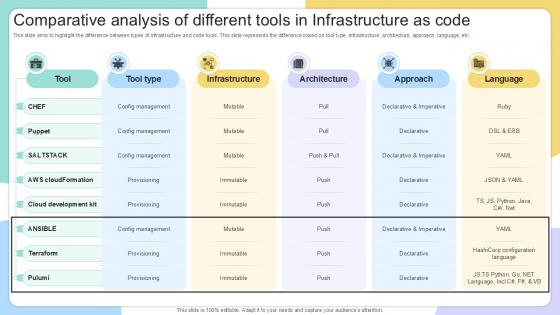
Comparative Analysis Of Different IAC Tools For Performance Analysis PPT PowerPoint
This slide aims to highlight the difference between types of infrastructure and code tools. This slide represents the difference based on tool type, infrastructure, architecture, approach, language, etc. If you are looking for a format to display your unique thoughts, then the professionally designed Comparative Analysis Of Different IAC Tools For Performance Analysis PPT PowerPoint is the one for you. You can use it as a Google Slides template or a PowerPoint template. Incorporate impressive visuals, symbols, images, and other charts. Modify or reorganize the text boxes as you desire. Experiment with shade schemes and font pairings. Alter, share or cooperate with other people on your work. Download Comparative Analysis Of Different IAC Tools For Performance Analysis PPT PowerPoint and find out how to give a successful presentation. Present a perfect display to your team and make your presentation unforgettable. This slide aims to highlight the difference between types of infrastructure and code tools. This slide represents the difference based on tool type, infrastructure, architecture, approach, language, etc.
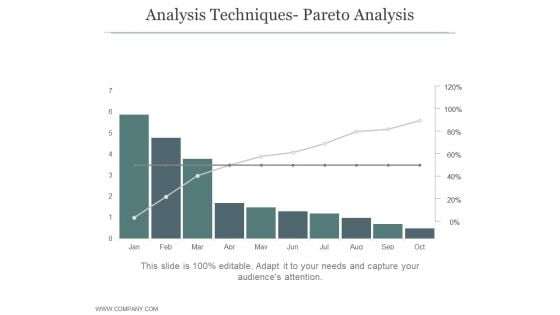
Analysis Techniques Pareto Analysis Ppt PowerPoint Presentation Example
This is a analysis techniques pareto analysis ppt powerpoint presentation example. This is a ten stage process. The stages in this process are business, strategy, bar graph, line graph, process.
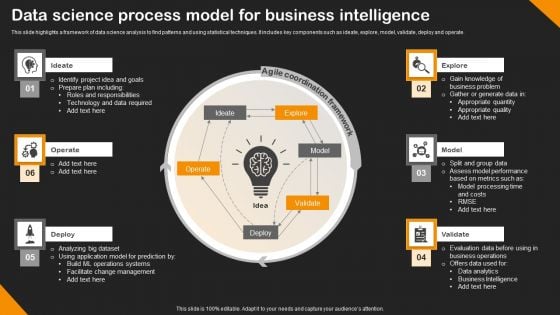
Data Science Process Model For Business Intelligence Infographics PDF
This slide highlights a framework of data science analysis to find patterns and using statistical techniques. It includes key components such as ideate, explore, model, validate, deploy and operate. Presenting Data Science Process Model For Business Intelligence Infographics PDF to dispense important information. This template comprises six stages. It also presents valuable insights into the topics including Operate, Deploy, Validate. This is a completely customizable PowerPoint theme that can be put to use immediately. So, download it and address the topic impactfully.
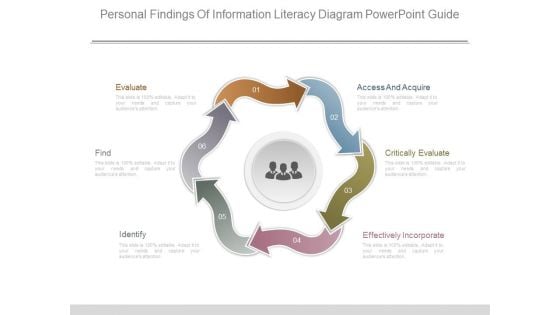
Personal Findings Of Information Literacy Diagram Powerpoint Guide
This is a personal findings of information literacy diagram powerpoint guide. This is a six stage process. The stages in this process are evaluate, find, identify, effectively incorporate, critically evaluate, access and acquire.
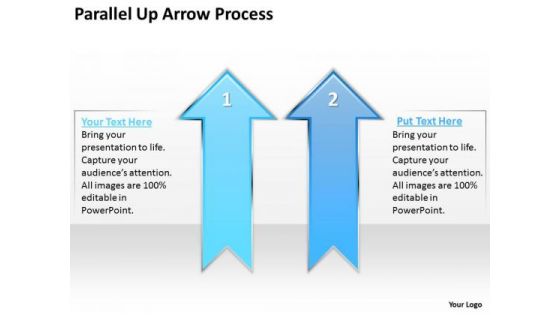
Business Diagram Parallel Up Arrow Process Consulting Diagram
Document The Process On Our Business Diagram Parallel Up Arrow Process Consulting Diagram Powerpoint Templates. Make A Record Of Every Detail.
Icons Slide For Sell Side Confidential Information Memorandum CIM Pitch Book Sample PDF
Introducing our well designed icons slide for sell side confidential information memorandum cim pitch book sample pdf set of slides. The slide displays editable icons to enhance your visual presentation. The icons can be edited easily. So customize according to your business to achieve a creative edge. Download and share it with your audience.
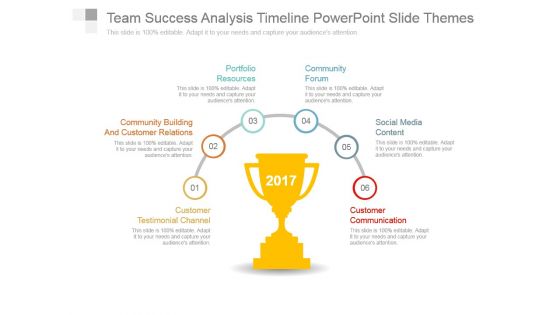
Team Success Analysis Timeline Powerpoint Slide Themes
This is a team success analysis timeline powerpoint slide themes. This is a six stage process. The stages in this process are customer testimonial channel, community building and customer relations, portfolio resources, community forum, social media content, customer communication.
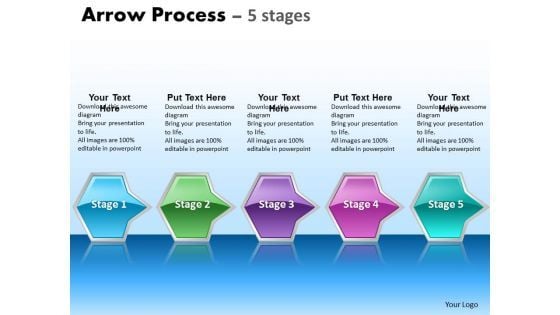
Mba Models And Frameworks Arrow Process 5 Stages Business Diagram
Knock On The Door To Success With Our MBA Models And Frameworks Arrow Process 5 Stages Business Diagram Powerpoint Templates. Be Assured Of Gaining Entry.
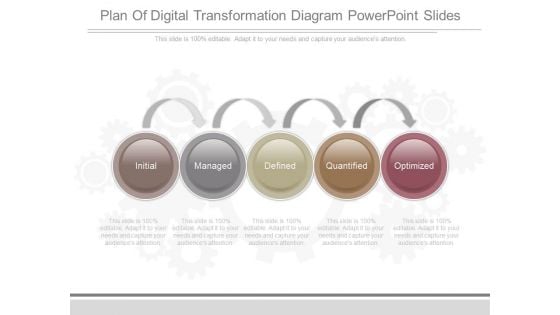
Plan Of Digital Transformation Diagram Powerpoint Slides
This is a plan of digital transformation diagram powerpoint slides. This is a five stage process. The stages in this process are initial, managed, defined, quantified, optimized.
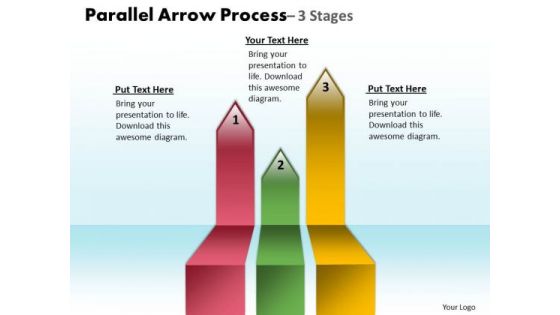
Strategy Diagram Parallel Arrow Process 3 Stages Business Cycle Diagram
Our Strategy Diagram Parallel Arrow Process 3 Stages Business Cycle Diagram Powerpoint Templates Enjoy Drama. They Provide Entertaining Backdrops.
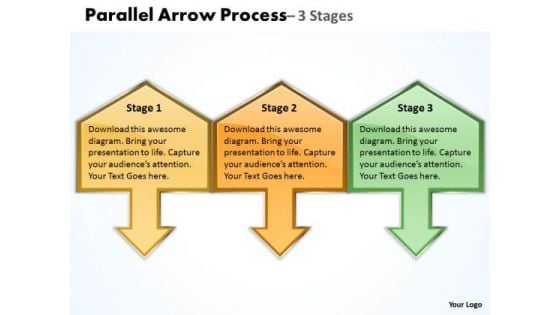
Strategy Diagram Parallel Arrow Process Business Cycle Diagram
Break The Deadlock With Our Strategy Diagram Parallel Arrow Process Business Cycle Diagram Powerpoint Templates. Let The Words Start To Flow.

Strategy Diagram Arrow Process 7 Stages Sales Diagram
Place The Orders With Your Thoughts. Our Strategy Diagram Arrow Process 7 Stages Sales DiagramPowerpoint Templates Know The Drill.
Marketing Diagram Linear Arrow Process 2 Stages
Your Listeners Will Never Doodle. Our Marketing Diagram Linear Arrow Process 2 Stages Powerpoint Templates Will Hold Their Concentration. Do The One Thing With Your Thoughts. Uphold Custom With Our Marketing Diagram Linear Arrow Process 2 Stages Powerpoint Templates.
Business Diagram 3d Arrow Process 2 Stages
Our Business Diagram 3D Arrow Process 2 Stages Powerpoint Templates Team Are A Dogged Lot. They Keep At It Till They Get It Right.
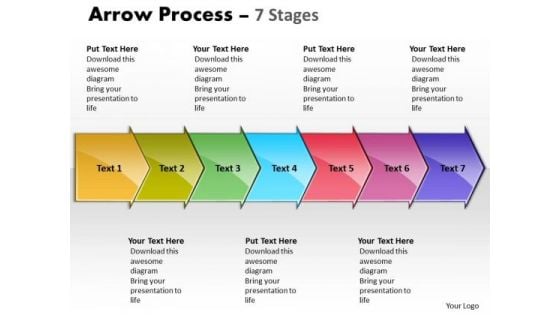
Strategic Management Arrow Process 7 Stages Strategy Diagram
Draw It Out On Our Strategic Management Arrow Process 7 Stages Strategy Diagram Powerpoint Templates. Provide Inspiration To Your Colleagues.
Continuous Steps Arrow Process Ppt PowerPoint Presentation Icon Visuals
This is a continuous steps arrow process ppt powerpoint presentation icon visuals. This is a five stage process. The stages in this process are circular, continuity, continuum.
Strategic Management Arrow Process 2 Stages
Plan For All Contingencies With Our Strategic Management Arrow Process 2 Stages Powerpoint Templates. Douse The Fire Before It Catches. Generate Camaraderie With Our Strategic Management Arrow Process 2 Stages Powerpoint Templates. Good Wishes Will Come Raining Down.
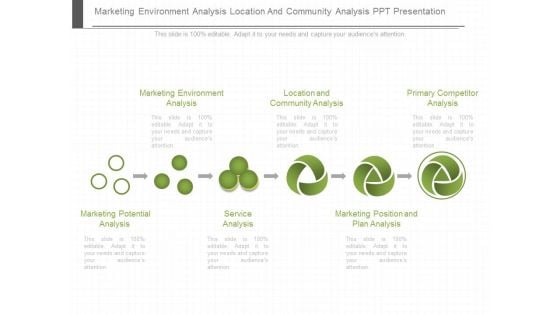
Marketing Environment Analysis Location And Community Analysis Ppt Presentation
This is a marketing environment analysis location and community analysis ppt presentation. This is a six stage process. The stages in this process are marketing environment analysis, location and community analysis, primary competitor analysis, marketing potential analysis, service analysis, marketing position and plan analysis.
Icons Slide Residential Building Cleansing Services Contractor Bid Proposal One Pager Sample Example Document
Presenting you an exemplary Icons Slide Residential Building Cleansing Services Contractor Bid Proposal One Pager Sample Example Document. Our one-pager comprises all the must-have essentials of an inclusive document. You can edit it with ease, as its layout is completely editable. With such freedom, you can tweak its design and other elements to your requirements. Download this Icons Slide Residential Building Cleansing Services Contractor Bid Proposal One Pager Sample Example Document brilliant piece now.
Contractors Bid For Voip Services Icons Slide For Contractors Bid Proposal One Pager Sample Example Document
Presenting you an exemplary Contractors Bid For Voip Services Icons Slide For Contractors Bid Proposal One Pager Sample Example Document Our one pager comprises all the must have essentials of an inclusive document. You can edit it with ease, as its layout is completely editable. With such freedom, you can tweak its design and other elements to your requirements. Download this Contractors Bid For Voip Services Icons Slide For Contractors Bid Proposal One Pager Sample Example Document brilliant piece now.
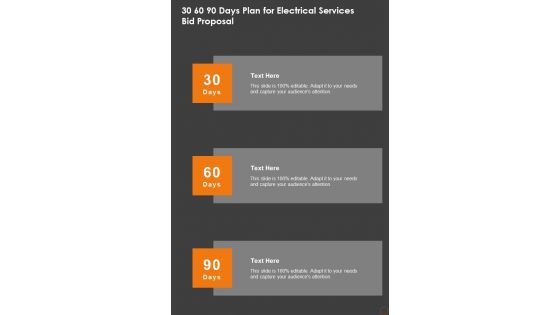
30 60 90 Days Plan For Electrical Services Bid Proposal One Pager Sample Example Document
Presenting you an exemplary 30 60 90 Days Plan For Electrical Services Bid Proposal One Pager Sample Example Document. Our one-pager comprises all the must-have essentials of an inclusive document. You can edit it with ease, as its layout is completely editable. With such freedom, you can tweak its design and other elements to your requirements. Download this 30 60 90 Days Plan For Electrical Services Bid Proposal One Pager Sample Example Document brilliant piece now.
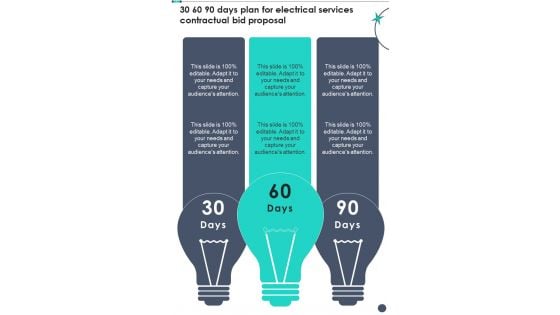
30 60 90 Days Plan For Electrical Services Contractual Bid Proposal One Pager Sample Example Document
Presenting you an exemplary 30 60 90 Days Plan For Electrical Services Contractual Bid Proposal One Pager Sample Example Document. Our one pager comprises all the must have essentials of an inclusive document. You can edit it with ease, as its layout is completely editable. With such freedom, you can tweak its design and other elements to your requirements. Download this 30 60 90 Days Plan For Electrical Services Contractual Bid Proposal One Pager Sample Example Document brilliant piece now.
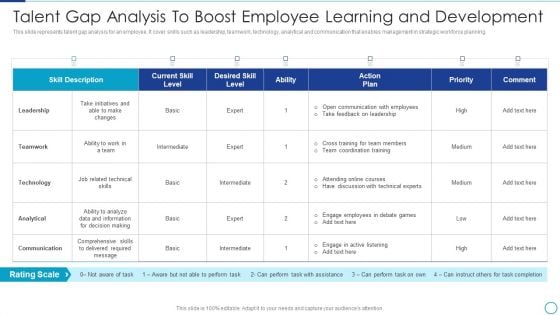
Workforce Management Strategies For Effective Hiring Process Talent Gap Analysis To Boost Clipart PDF
This slide represents talent gap analysis for an employee. It cover skills such as leadership, teamwork, technology, analytical and communication that enables management in strategic workforce planning. Deliver and pitch your topic in the best possible manner with this Workforce Management Strategies For Effective Hiring Process Talent Gap Analysis To Boost Clipart PDF. Use them to share invaluable insights on Leadership, Teamwork, Technology, Analytical and impress your audience. This template can be altered and modified as per your expectations. So, grab it now.
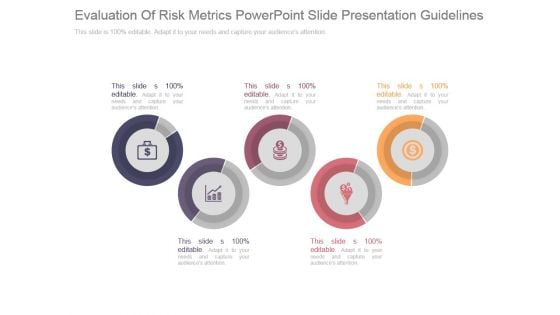
Evaluation Of Risk Metrics Powerpoint Slide Presentation Guidelines
This is a evaluation of risk metrics powerpoint slide presentation guidelines. This is a five stage process. The stages in this process are business, management, strategy, marketing, diagram.

Risk Metrics Dashboard Ppt PowerPoint Presentation Complete With Slides
If designing a presentation takes a lot of your time and resources and you are looking for a better alternative, then this Risk Metrics Dashboard Ppt PowerPoint Presentation Complete With Slides is the right fit for you. This is a prefabricated set that can help you deliver a great presentation on the topic. All the fourteen slides included in this sample template can be used to present a birds-eye view of the topic. These slides are also fully editable, giving you enough freedom to add specific details to make this layout more suited to your business setting. Apart from the content, all other elements like color, design, theme are also replaceable and editable. This helps in designing a variety of presentations with a single layout. Not only this, you can use this PPT design in formats like PDF, PNG, and JPG once downloaded. Therefore, without any further ado, download and utilize this sample presentation as per your liking.
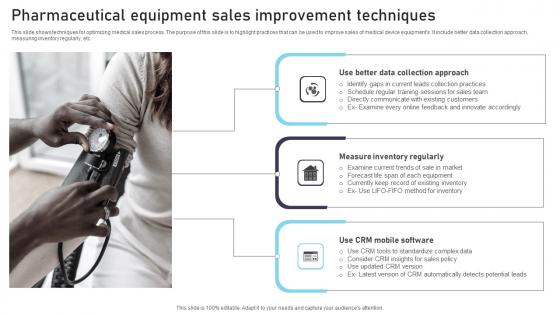
Pharmaceutical Equipment Sales Improvement Techniques Demonstration Pdf
This slide shows techniques for optimizing medical sales process. The purpose of this slide is to highlight practices that can be used to improve sales of medical device equipments. It include better data collection approach, measuring inventory regularly, etc. Pitch your topic with ease and precision using this Pharmaceutical Equipment Sales Improvement Techniques Demonstration Pdf. This layout presents information on Collection Approach, Inventory Regularly, Software. It is also available for immediate download and adjustment. So, changes can be made in the color, design, graphics or any other component to create a unique layout. This slide shows techniques for optimizing medical sales process. The purpose of this slide is to highlight practices that can be used to improve sales of medical device equipments. It include better data collection approach, measuring inventory regularly, etc.
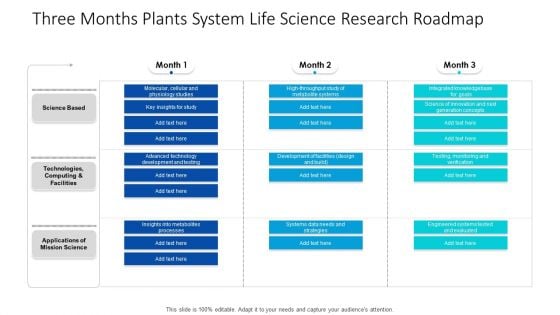
Three Months Plants System Life Science Research Roadmap Formats
Presenting our innovatively structured three months plants system life science research roadmap formats Template. Showcase your roadmap process in different formats like PDF, PNG, and JPG by clicking the download button below. This PPT design is available in both Standard Screen and Widescreen aspect ratios. It can also be easily personalized and presented with modified font size, font type, color, and shapes to measure your progress in a clear way.
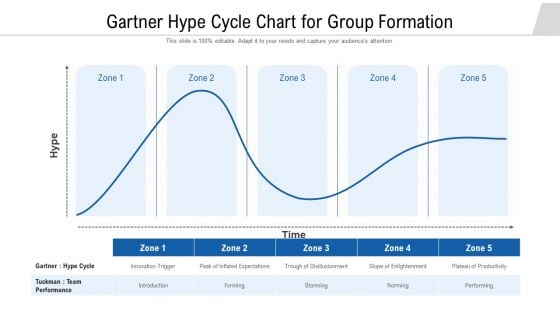
Gartner Hype Cycle Chart For Group Formation Ppt PowerPoint Presentation Gallery Show PDF
Presenting gartner hype cycle chart for group formation ppt powerpoint presentation gallery show pdf to dispense important information. This template comprises five stages. It also presents valuable insights into the topics including introduction, forming, storming. This is a completely customizable PowerPoint theme that can be put to use immediately. So, download it and address the topic impactfully.
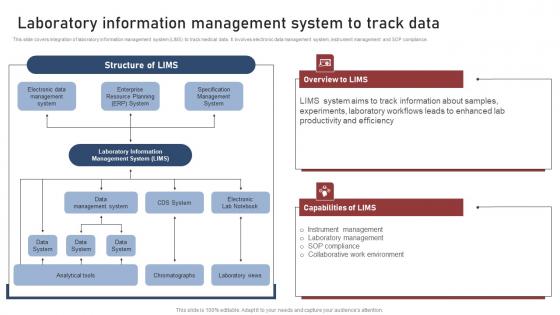
Laboratory Information Transforming Medical Workflows Via His Integration Mockup Pdf
This slide covers integration of laboratory information management system LIMS to track medical data. It involves electronic data management system, instrument management and SOP compliance. Retrieve professionally designed Laboratory Information Transforming Medical Workflows Via His Integration Mockup Pdf to effectively convey your message and captivate your listeners. Save time by selecting pre made slideshows that are appropriate for various topics, from business to educational purposes. These themes come in many different styles, from creative to corporate, and all of them are easily adjustable and can be edited quickly. Access them as PowerPoint templates or as Google Slides themes. You do not have to go on a hunt for the perfect presentation because Slidegeeks got you covered from everywhere. This slide covers integration of laboratory information management system LIMS to track medical data. It involves electronic data management system, instrument management and SOP compliance.
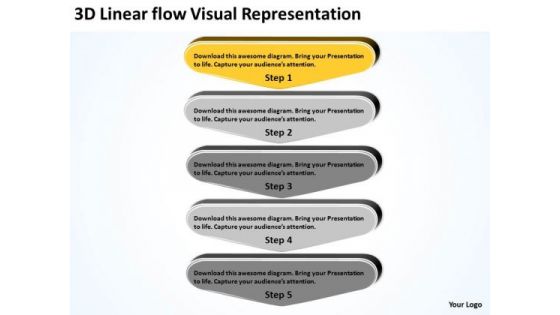
3d Linear Flow Visual Representation Company Business Plan Examples PowerPoint Templates
We present our 3d linear flow visual representation company business plan examples PowerPoint templates.Download our Business PowerPoint Templates because a brainwave has occurred to you after review. You know just how to push the graph skyward. Use our Signs PowerPoint Templates because it expound on why you have discarded some plans as you went along to the apex and came out with the final selection which you know will make you and your team shine. Download and present our Shapes PowerPoint Templates because it shows the pyramid which is a symbol of the desire to reach the top in a steady manner. Use our Layers PowerPoint Templates because this shows ideas to get the different elements of your Business to mesh and coalesce into a focused team driven by a common goal to achieve the common aim with Excellence. Present our Flow Charts PowerPoint Templates because it can illustrate your chain of ideas focusing on that aspect or resource in order to enhance the quality of your product.Use these PowerPoint slides for presentations relating to abstract, arrow, arrows, business, chart, design, development, diagram, direction, element, flow, flowchart, graph, linear, management, model, motion, organization, plan, process, program, section, segment, set, sign, solution, strategy, symbol, technology. The prominent colors used in the PowerPoint template are Yellow, Gray, White. PowerPoint presentation experts tell us our 3d linear flow visual representation company business plan examples PowerPoint templates are Ultra. The feedback we get is that our chart PowerPoint templates and PPT Slides effectively help you save your valuable time. We assure you our 3d linear flow visual representation company business plan examples PowerPoint templates are designed by professionals We assure you our diagram PowerPoint templates and PPT Slides will get their audience's attention. You can be sure our 3d linear flow visual representation company business plan examples PowerPoint templates are Delightful. The feedback we get is that our business PowerPoint templates and PPT Slides are designed by a team of presentation professionals. Your thoughts deserve befitting exposure. Get an appropriate collection of our 3d Linear Flow Visual Representation Company Business Plan Examples PowerPoint Templates.
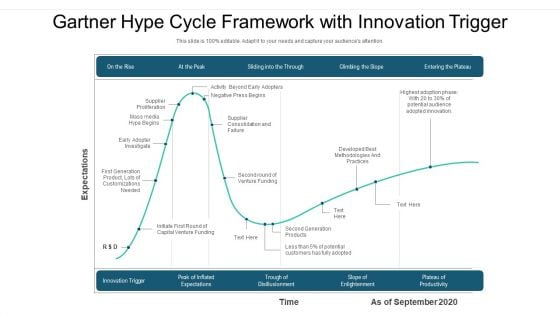
Gartner Hype Cycle Framework With Innovation Trigger Ppt PowerPoint Presentation File Format Ideas PDF
Presenting gartner hype cycle framework with innovation trigger ppt powerpoint presentation file format ideas pdf to dispense important information. This template comprises one stages. It also presents valuable insights into the topics including supplier proliferation, supplier consolidation and failure, second generation products. This is a completely customizable PowerPoint theme that can be put to use immediately. So, download it and address the topic impactfully.


 Continue with Email

 Home
Home


