Improvement Chart
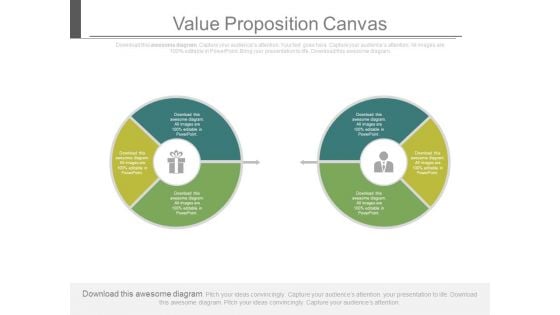
Value Proposition Canvas Pie Charts Ppt Slides
This is a value proposition canvas pie charts ppt slides. This is a two stage process. The stages in this process are business, marketing.
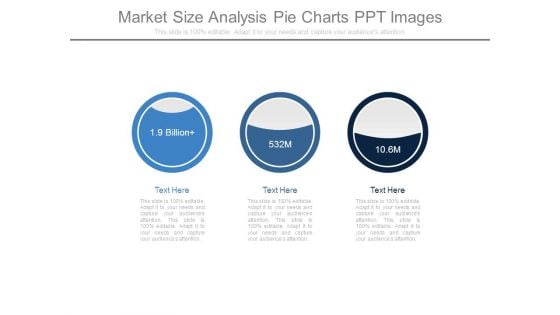
Market Size Analysis Pie Charts Ppt Images
This is a market size analysis pie charts ppt images. This is a three stage process. The stages in this process are business, marketing, analysis, management, strategy.
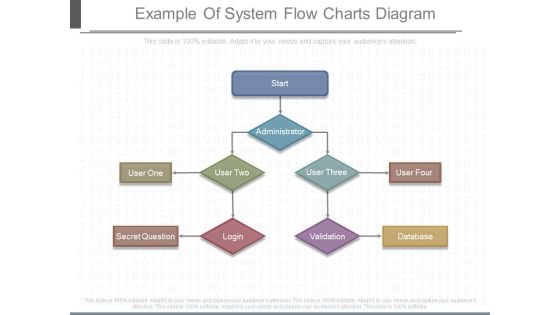
Example Of System Flow Charts Diagram
This is a example of system flow charts diagram. This is a one stage process. The stages in this process are start, administrator, user one, user two, user three, user four, secret question, login, validation, database.
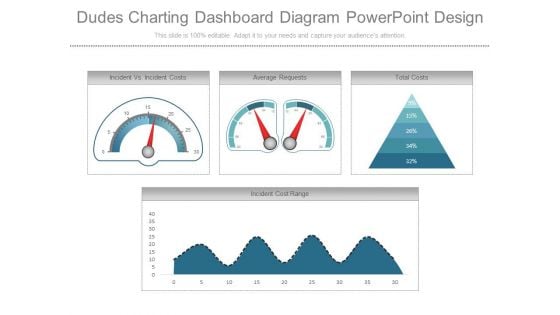
Dudes Charting Dashboard Diagram Powerpoint Design
This is a dudes charting dashboard diagram powerpoint design. This is a four stage process. The stages in this process are incident vs incident costs, average requests, total costs, incident cost range.
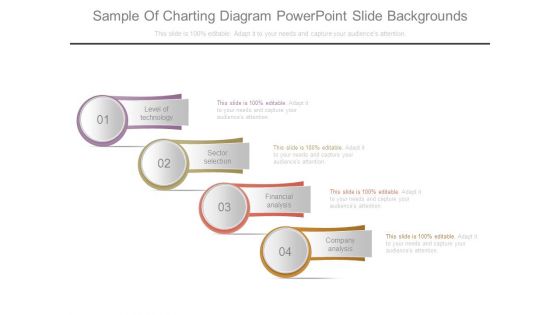
Sample Of Charting Diagram Powerpoint Slide Backgrounds
This is a sample of charting diagram powerpoint slide backgrounds. This is a four stage process. The stages in this process are level of technology, sector selection, financial analysis, company analysis.
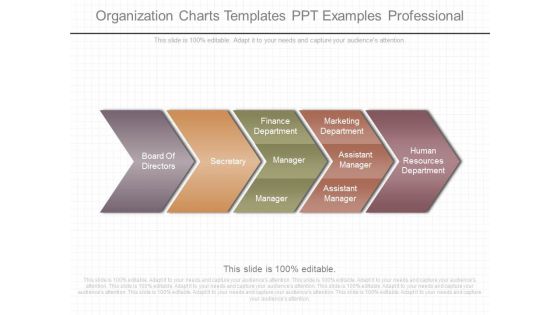
Organization Charts Templates Ppt Examples Professional
This is a organization charts templates ppt examples professional. This is a five stage process. The stages in this process are board of directors, secretary, finance department, manager, marketing department, assistant manager, human resources department.
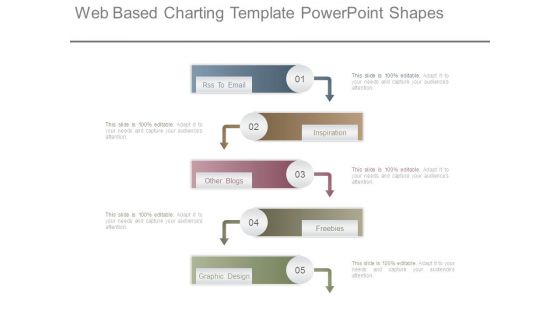
Web Based Charting Template Powerpoint Shapes
This is a web based charting template powerpoint shapes. This is a five stage process. The stages in this process are rss to email, inspiration, other blogs, freebies, graphic design.
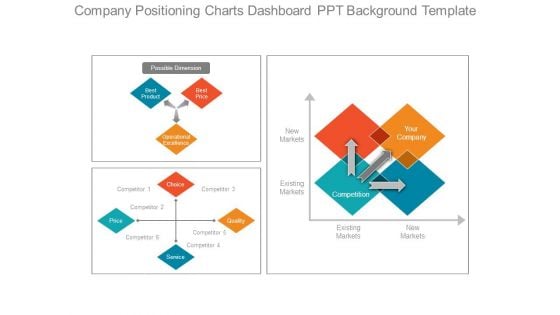
Company Positioning Charts Dashboard Ppt Background Template
This is a company positioning charts dashboard ppt background template. This is a four stage process. The stages in this process are possible dimension, best product, best price, operational excellence, choice, service, quality, competition, your company.
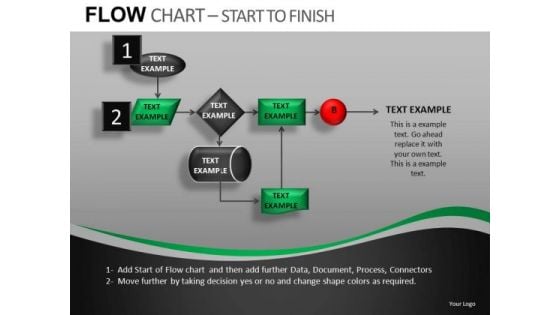
Ppt Slides Flow Charts Diagrams For PowerPoint
PPT Slides Flow Charts Diagrams for PowerPoint-These high quality powerpoint pre-designed slides and powerpoint templates have been carefully created by our professional team to help you impress your audience. All slides have been created and are 100% editable in powerpoint. Each and every property of any graphic - color, size, orientation, shading, outline etc. can be modified to help you build an effective powerpoint presentation. Any text can be entered at any point in the powerpoint template or slide. Simply DOWNLOAD, TYPE and PRESENT!These PowerPoint Presentation slides can be used for themes relating to--Business, businessman, chain, chart, communication, community, company, concept, connection, contact, corporate, creativity, data, database, diagram, draw, drawing, education, executive, flow, flowchart, global, graphic, group, illustration, internet, isolated, job, manager, meeting, net, network, networking, office, organization, people, person, plan, presentation, relationship, screen, social, structure, success, team, teamwork, web, white, work, writing Well begun is half done. Get a dream beginning with our Ppt Slides Flow Charts Diagrams For PowerPoint.

Create Organizational Charts Diagram Powerpoint Layout
This is a create organizational charts diagram powerpoint layout. This is a one stage process. The stages in this process are citizens, mayer ceo and commission, municipal court, commission liaison, county administrator, chief counsel, media relation, development, deputy county administrator, consultant services, file chief, assistant county administrator, chief financial officer.
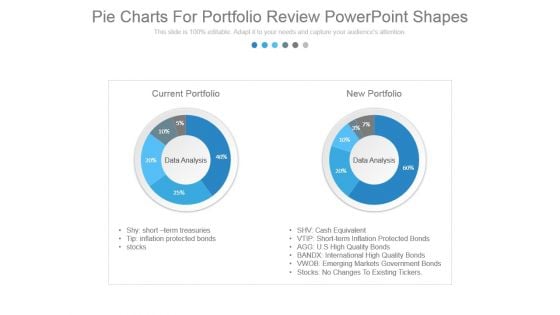
Pie Charts For Portfolio Review Powerpoint Shapes
This is a pie charts for portfolio review powerpoint shapes. This is a two stage process. The stages in this process are new portfolio, current portfolio, data analysis, shy short term treasuries, tip inflation protected bonds, stocks, shv cash equivalent, vtip short term inflation protected bonds, agg u s high quality bonds, bandx international high quality bonds, vwob emerging markets government bonds, stocks no changes to existing tickers.
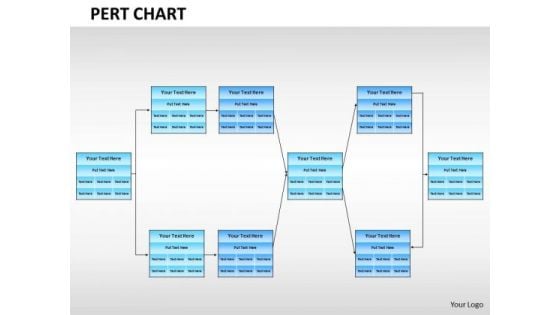
Business Framework Project Management Charts PowerPoint Presentation
This diagram displays purchasing process flow chart. Use this diagram, in your presentations to display finance and accounting in marketing. This diagram will enhance the quality of your presentations.
Agenda Ppt PowerPoint Presentation Diagram Graph Charts
This is a agenda ppt powerpoint presentation diagram graph charts. This is a four stage process. The stages in this process are agenda, planning, management, business, list.
Business Charts About Us Slide Powerpoint Slides
This PowerPoint template has been designed with graphics of business charts. Download this PPT slide to display industry growth statistics. You can easily customize this template to make it more unique as per your need.
Timeline Ppt PowerPoint Presentation Diagram Graph Charts
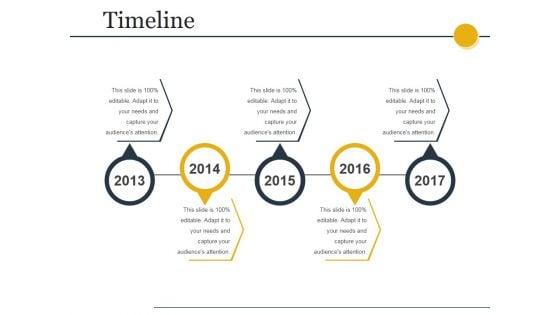
This is a timeline ppt powerpoint presentation diagram graph charts. This is a five stage process. The stages in this process are timeline, years, business, marketing, planning.
Linear Circles Percentage Analysis Charts Powerpoint Slides
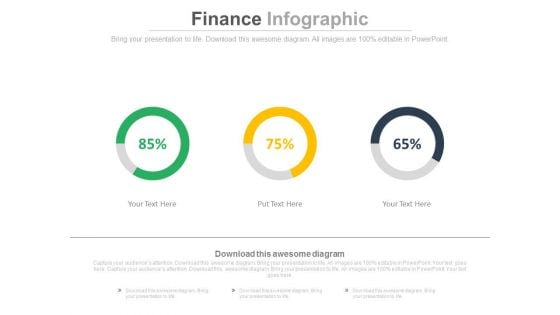
This PowerPoint template has been designed with graphics of three circles and percentage ratios. You may use this dashboard slide design for topics like profit growth and financial planning. This PPT slide is powerful tool to describe your ideas.
Effective Communication Procedure For Improving Employee Engagement Diagrams Pdf
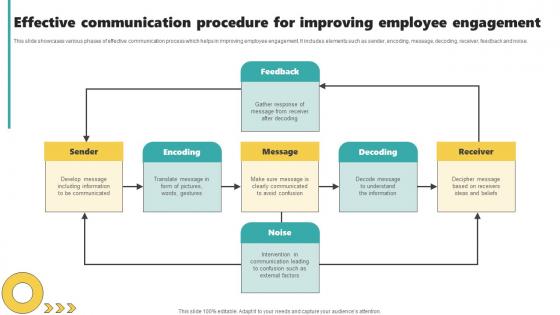
This slide showcases various phases of effective communication process which helps in improving employee engagement. It includes elements such as sender, encoding, message, decoding, receiver, feedback and noise. Pitch your topic with ease and precision using this Effective Communication Procedure For Improving Employee Engagement Diagrams Pdf. This layout presents information on Encoding, Message, Decoding, Receiver. It is also available for immediate download and adjustment. So, changes can be made in the color, design, graphics or any other component to create a unique layout. This slide showcases various phases of effective communication process which helps in improving employee engagement. It includes elements such as sender, encoding, message, decoding, receiver, feedback and noise.
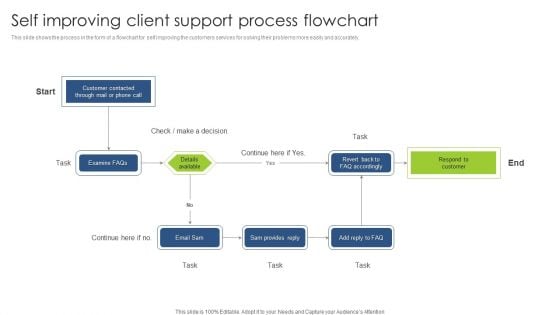
Self Improving Client Support Process Flowchart Inspiration PDF
This slide shows the process in the form of a flowchart for self improving the customers services for solving their problems more easily and accurately. Persuade your audience using this Self Improving Client Support Process Flowchart Inspiration PDF. This PPT design covers one stages, thus making it a great tool to use. It also caters to a variety of topics including Self Improving Client Support, Process Flowchart. Download this PPT design now to present a convincing pitch that not only emphasizes the topic but also showcases your presentation skills.
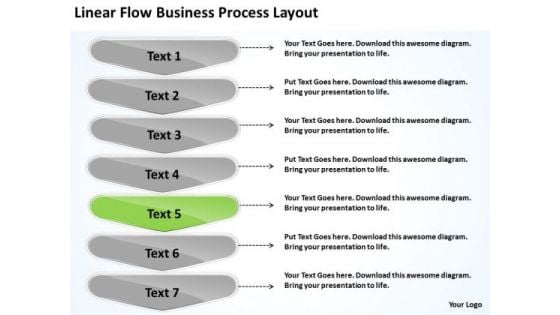
PowerPoint Presentations Process Layout Business Creating Flow Charts Templates
We present our powerpoint presentations process layout business creating flow charts templates.Present our Marketing PowerPoint Templates because it shows to your group how they mesh together to drive the whole. Download our Leadership PowerPoint Templates because you have the ability to think out of the box. It helps you maintain your unique identity. Present our Business PowerPoint Templates because a lot of dissimilar elements needing to gel to strike the deal. Use our Shapes PowerPoint Templates because you can asked to strive to give true form to your great dream. Use our Arrows PowerPoint Templates because the colour coding of our templates are specifically designed to highlight you points.Use these PowerPoint slides for presentations relating to Abstract, Arrow, Arrows, Business, Chart, Design, Development, Diagram, Direction, Element, Flow, Flowchart, Graph, Linear, Management, Model, Motion, Organization, Plan, Process, Program, Section, Segment, Set, Sign, Solution, Strategy, Symbol, Technology,,. The prominent colors used in the PowerPoint template are Green, Gray, White. PowerPoint presentation experts tell us our powerpoint presentations process layout business creating flow charts templates are Energetic. Customers tell us our Design PowerPoint templates and PPT Slides are designed to make your presentations professional. Use our powerpoint presentations process layout business creating flow charts templates are Wistful. Use our Business PowerPoint templates and PPT Slides are One-of-a-kind. We assure you our powerpoint presentations process layout business creating flow charts templates are Pleasant. People tell us our Chart PowerPoint templates and PPT Slides are Whimsical. Start driving performance improvement with our PowerPoint Presentations Process Layout Business Creating Flow Charts Templates. They will make you look good.
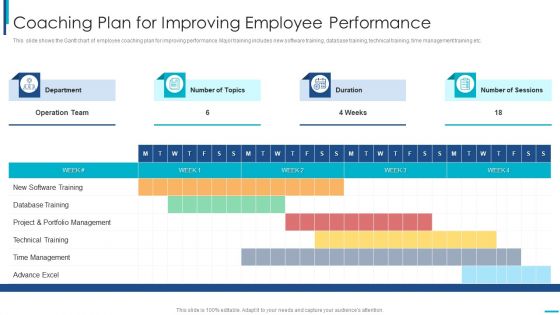
Skill Development Training To Strengthen Employee Performance Coaching Plan For Improving Employee Themes PDF
This slide shows the Gantt chart of employee coaching plan for improving performance. Major training includes new software training, database training, technical training, time management training etc. This is a skill development training to strengthen employee performance coaching plan for improving employee themes pdf template with various stages. Focus and dispense information on four stages using this creative set, that comes with editable features. It contains large content boxes to add your information on topics like advance excel, time management, technical training, project and portfolio management, database training. You can also showcase facts, figures, and other relevant content using this PPT layout. Grab it now.
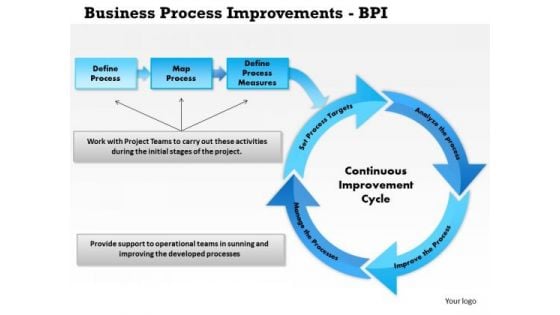
Business Framework Business Process Improvements Bpi PowerPoint Presentation
Explain the BPI (business process improvement) in any business presentation with our exclusive PPT slide. This diagram slide has been crafted with graphic of three staged flow chart and cyclic process flow diagram. Use this business framework Pot slide to show points of improvement.
Multiple Pie Charts In Powerpoint And Google Slides Cpb
Introducing our well designed Multiple Pie Charts In Powerpoint And Google Slides Cpb. This PowerPoint design presents information on topics like Multiple Pie Charts. As it is predesigned it helps boost your confidence level. It also makes you a better presenter because of its high quality content and graphics. This PPT layout can be downloaded and used in different formats like PDF, PNG, and JPG. Not only this, it is available in both Standard Screen and Widescreen aspect ratios for your convenience. Therefore, click on the download button now to persuade and impress your audience. Our Multiple Pie Charts In Powerpoint And Google Slides Cpb are topically designed to provide an attractive backdrop to any subject. Use them to look like a presentation pro.
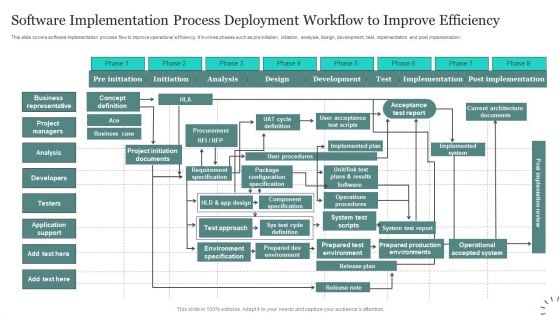
Software Implementation Process Deployment Workflow To Improve Efficiency Brochure PDF
This slide covers software implementation process flow to improve operational efficiency. It involves phases such as pre initiation, initiation, analysis, design, development, test, implementation and post implementation. Persuade your audience using this Software Implementation Process Deployment Workflow To Improve Efficiency Brochure PDF. This PPT design covers eight stages, thus making it a great tool to use. It also caters to a variety of topics including Post implementation, Implementation, Analysis. Download this PPT design now to present a convincing pitch that not only emphasizes the topic but also showcases your presentation skills.
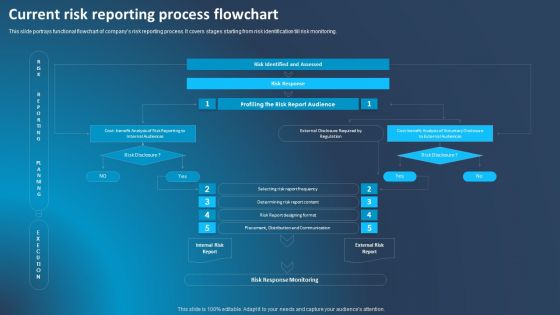
Improving Corporate Performance Current Risk Reporting Process Flowchart Template PDF
This slide portrays functional flowchart of companys risk reporting process. It covers stages starting from risk identification till risk monitoring. There are so many reasons you need a Improving Corporate Performance Current Risk Reporting Process Flowchart Template PDF. The first reason is you cant spend time making everything from scratch, Thus, Slidegeeks has made presentation templates for you too. You can easily download these templates from our website easily.
Improve IT Service Desk Incident Request Tracking Flowchart Information PDF
The following slide illustrates incident request tracking flowchart. It provides information about service level agreement SLA escalation, notification, reallocation, service outage, threshold, incident escalation, etc. Presenting Improve IT Service Desk Incident Request Tracking Flowchart Information PDF to provide visual cues and insights. Share and navigate important information on one stage that need your due attention. This template can be used to pitch topics like Outage Resolution, Incident Management, Reallocate Incident. In addtion, this PPT design contains high resolution images, graphics, etc, that are easily editable and available for immediate download.
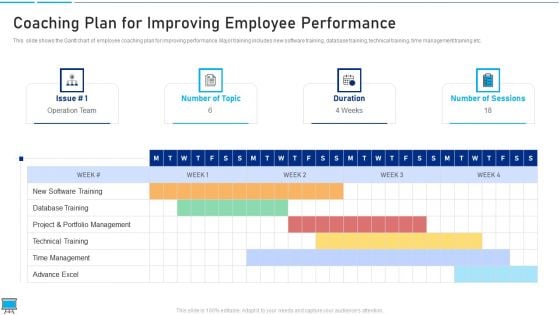
Performance Training Action Plan And Extensive Strategies Coaching Plan For Improving Employee Performance Demonstration PDF
This slide shows the Gantt chart of employee coaching plan for improving performance. Major training includes new software training, database training, technical training, time management training etc. Deliver and pitch your topic in the best possible manner with this performance training action plan and extensive strategies coaching plan for improving employee performance demonstration pdf Use them to share invaluable insights on database training, technical training, time management and impress your audience. This template can be altered and modified as per your expectations. So, grab it now.
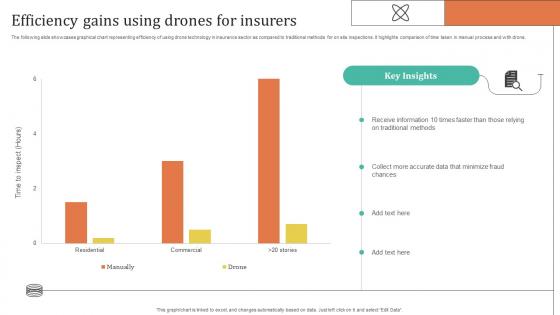
Improving Customer Satisfaction Efficiency Gains Using Drones For Insurers
The following slide showcases graphical chart representing efficiency of using drone technology in insurance sector as compared to traditional methods for on site inspections. It highlights comparison of time taken in manual process and with drone. This modern and well-arranged Improving Customer Satisfaction Efficiency Gains Using Drones For Insurers provides lots of creative possibilities. It is very simple to customize and edit with the Powerpoint Software. Just drag and drop your pictures into the shapes. All facets of this template can be edited with Powerpoint, no extra software is necessary. Add your own material, put your images in the places assigned for them, adjust the colors, and then you can show your slides to the world, with an animated slide included. The following slide showcases graphical chart representing efficiency of using drone technology in insurance sector as compared to traditional methods for on site inspections. It highlights comparison of time taken in manual process and with drone.
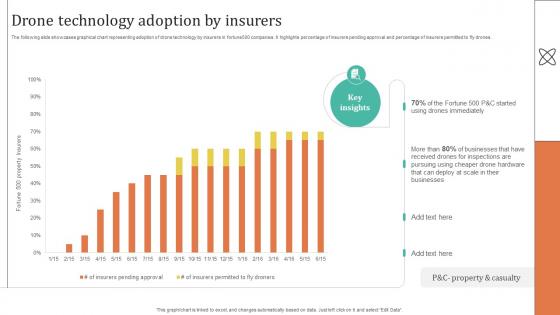
Improving Customer Satisfaction Drone Technology Adoption By Insurers
The following slide showcases graphical chart representing adoption of drone technology by insurers in fortune500 companies. It highlights percentage of insurers pending approval and percentage of insurers permitted to fly drones. Coming up with a presentation necessitates that the majority of the effort goes into the content and the message you intend to convey. The visuals of a PowerPoint presentation can only be effective if it supplements and supports the story that is being told. Keeping this in mind our experts created Improving Customer Satisfaction Drone Technology Adoption By Insurers to reduce the time that goes into designing the presentation. This way, you can concentrate on the message while our designers take care of providing you with the right template for the situation. The following slide showcases graphical chart representing adoption of drone technology by insurers in fortune500 companies. It highlights percentage of insurers pending approval and percentage of insurers permitted to fly drones.
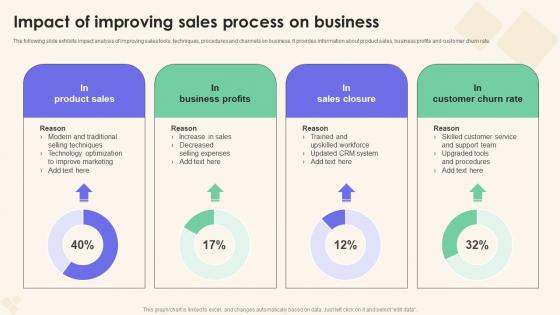
Impact Of Improving Sales Process Sales Performance Enhancement Template Pdf
The following slide exhibits impact analysis of improving sales tools, techniques, procedures and channels on business. It provides information about product sales, business profits and customer churn rate. Crafting an eye catching presentation has never been more straightforward. Let your presentation shine with this tasteful yet straightforward Impact Of Improving Sales Process Sales Performance Enhancement Template Pdf template. It offers a minimalistic and classy look that is great for making a statement. The colors have been employed intelligently to add a bit of playfulness while still remaining professional. Construct the ideal Impact Of Improving Sales Process Sales Performance Enhancement Template Pdf that effortlessly grabs the attention of your audience. Begin now and be certain to wow your customers. The following slide exhibits impact analysis of improving sales tools, techniques, procedures and channels on business. It provides information about product sales, business profits and customer churn rate.
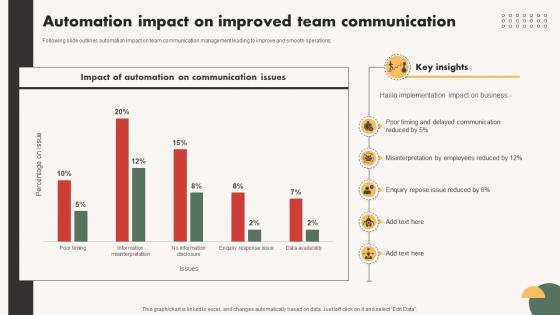
Automated Communication System Automation Impact On Improved Team
Following slide outlines automation impact on team communication management leading to improve and smooth operations. Do you have to make sure that everyone on your team knows about any specific topic I yes, then you should give Automated Communication System Automation Impact On Improved Team a try. Our experts have put a lot of knowledge and effort into creating this impeccable Automated Communication System Automation Impact On Improved Team. You can use this template for your upcoming presentations, as the slides are perfect to represent even the tiniest detail. You can download these templates from the Slidegeeks website and these are easy to edit. So grab these today Following slide outlines automation impact on team communication management leading to improve and smooth operations.
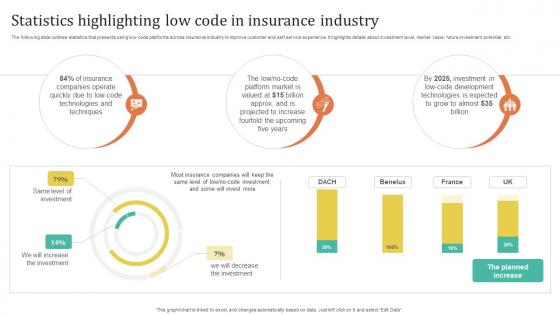
Improving Customer Satisfaction Statistics Highlighting Low Code In Insurance Industry
The following slide outlines statistics that presents using low code platforms across insurance industry to improve customer and self service experience. It highlights details about investment level, market value, future investment potential, etc. Find highly impressive Improving Customer Satisfaction Statistics Highlighting Low Code In Insurance Industry on Slidegeeks to deliver a meaningful presentation. You can save an ample amount of time using these presentation templates. No need to worry to prepare everything from scratch because Slidegeeks experts have already done a huge research and work for you. You need to download Improving Customer Satisfaction Statistics Highlighting Low Code In Insurance Industry for your upcoming presentation. All the presentation templates are 100 percent editable and you can change the color and personalize the content accordingly. Download now The following slide outlines statistics that presents using low code platforms across insurance industry to improve customer and self service experience. It highlights details about investment level, market value, future investment potential, etc.
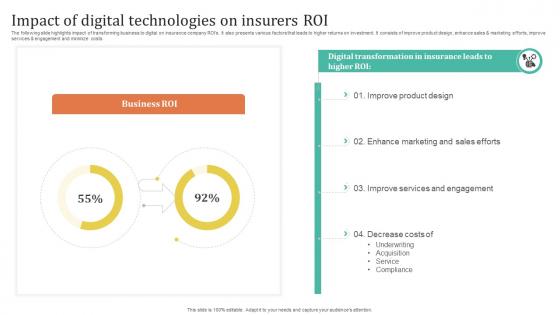
Improving Customer Satisfaction Impact Of Digital Technologies On Insurers Roi
The following slide highlights impact of transforming business to digital on insurance company ROIs. It also presents various factors that leads to higher returns on investment. It consists of improve product design, enhance sales and marketing efforts, improve services and engagement and minimize costs. Explore a selection of the finest Improving Customer Satisfaction Impact Of Digital Technologies On Insurers Roi here. With a plethora of professionally designed and pre-made slide templates, you can quickly and easily find the right one for your upcoming presentation. You can use our Improving Customer Satisfaction Impact Of Digital Technologies On Insurers Roi to effectively convey your message to a wider audience. Slidegeeks has done a lot of research before preparing these presentation templates. The content can be personalized and the slides are highly editable. Grab templates today from Slidegeeks. The following slide highlights impact of transforming business to digital on insurance company ROIs. It also presents various factors that leads to higher returns on investment. It consists of improve product design, enhance sales and marketing efforts, improve services and engagement and minimize costs.
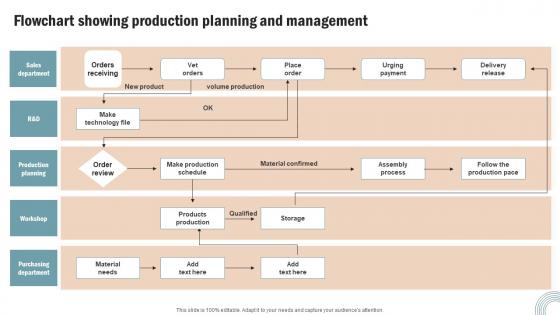
Flowchart Showing Production Operations Strategy Improve Business Productivity Clipart Pdf
If you are looking for a format to display your unique thoughts, then the professionally designed Flowchart Showing Production Operations Strategy Improve Business Productivity Clipart Pdf is the one for you. You can use it as a Google Slides template or a PowerPoint template. Incorporate impressive visuals, symbols, images, and other charts. Modify or reorganize the text boxes as you desire. Experiment with shade schemes and font pairings. Alter, share or cooperate with other people on your work. Download Flowchart Showing Production Operations Strategy Improve Business Productivity Clipart Pdf and find out how to give a successful presentation. Present a perfect display to your team and make your presentation unforgettable. Our Flowchart Showing Production Operations Strategy Improve Business Productivity Clipart Pdf are topically designed to provide an attractive backdrop to any subject. Use them to look like a presentation pro.
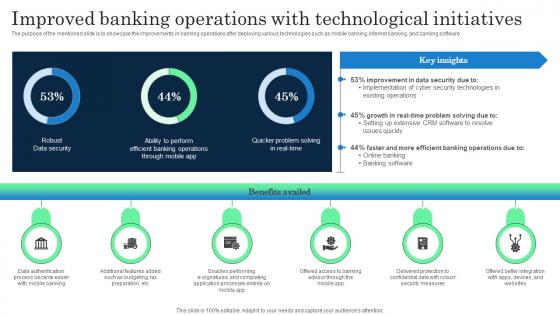
Improved Banking Operations With Incorporating Banking Operational Growth
The purpose of the mentioned slide is to showcase the improvements in banking operations after deploying various technologies such as mobile banking, internet banking, and banking software. Retrieve professionally designed Improved Banking Operations With Incorporating Banking Operational Growth to effectively convey your message and captivate your listeners. Save time by selecting pre-made slideshows that are appropriate for various topics, from business to educational purposes. These themes come in many different styles, from creative to corporate, and all of them are easily adjustable and can be edited quickly. Access them as PowerPoint templates or as Google Slides themes. You do not have to go on a hunt for the perfect presentation because Slidegeeks got you covered from everywhere. The purpose of the mentioned slide is to showcase the improvements in banking operations after deploying various technologies such as mobile banking, internet banking, and banking software
Tracking The Improvements Buzz Marketing Techniques For Engaging Rules Pdf
This slide showcases the KPIs that would help the business organization to evaluate buzz marketing campaigns improvements. It includes social media followers, YouTube subscribers, Facebook engagement and page impressions, page likes, etc. If you are looking for a format to display your unique thoughts, then the professionally designed Tracking The Improvements Buzz Marketing Techniques For Engaging Rules Pdf is the one for you. You can use it as a Google Slides template or a PowerPoint template. Incorporate impressive visuals, symbols, images, and other charts. Modify or reorganize the text boxes as you desire. Experiment with shade schemes and font pairings. Alter, share or cooperate with other people on your work. Download Tracking The Improvements Buzz Marketing Techniques For Engaging Rules Pdf and find out how to give a successful presentation. Present a perfect display to your team and make your presentation unforgettable. This slide showcases the KPIs that would help the business organization to evaluate buzz marketing campaigns improvements. It includes social media followers, YouTube subscribers, Facebook engagement and page impressions, page likes, etc.
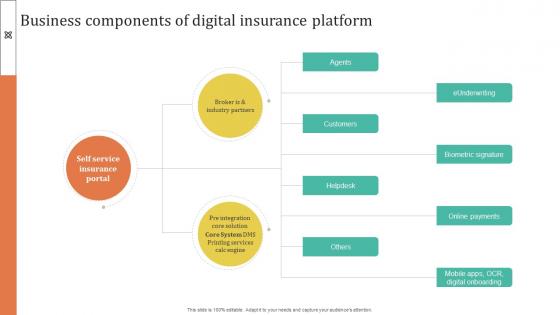
Improving Customer Satisfaction Business Components Of Digital Insurance Platform
Do you have an important presentation coming up Are you looking for something that will make your presentation stand out from the rest Look no further than Improving Customer Satisfaction Business Components Of Digital Insurance Platform. With our professional designs, you can trust that your presentation will pop and make delivering it a smooth process. And with Slidegeeks, you can trust that your presentation will be unique and memorable. So why wait Grab Improving Customer Satisfaction Business Components Of Digital Insurance Platform today and make your presentation stand out from the rest Our Improving Customer Satisfaction Business Components Of Digital Insurance Platform are topically designed to provide an attractive backdrop to any subject. Use them to look like a presentation pro.
Tracking The Cashflow Improvements With Tactical Financial Governance Topics Pdf
This slide showcases the KPIs that would help our business organization to track the improvements in the new cash management process. It includes quick ratio, cash balance, current ratio, days inventory outstanding, etc.Whether you have daily or monthly meetings, a brilliant presentation is necessary. Tracking The Cashflow Improvements With Tactical Financial Governance Topics Pdf can be your best option for delivering a presentation. Represent everything in detail using Tracking The Cashflow Improvements With Tactical Financial Governance Topics Pdf and make yourself stand out in meetings. The template is versatile and follows a structure that will cater to your requirements. All the templates prepared by Slidegeeks are easy to download and edit. Our research experts have taken care of the corporate themes as well. So, give it a try and see the results. This slide showcases the KPIs that would help our business organization to track the improvements in the new cash management process. It includes quick ratio, cash balance, current ratio, days inventory outstanding, etc.
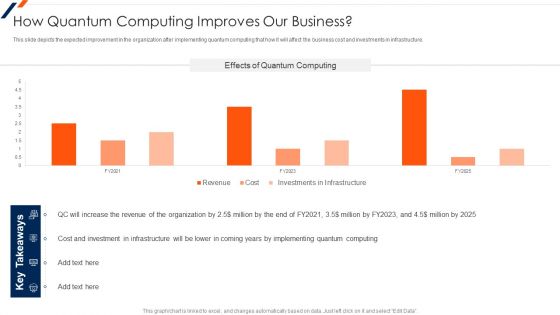
Quantum Computing How Quantum Computing Improves Our Business Download PDF
This slide depicts the expected improvement in the organization after implementing quantum computing that how it will affect the business cost and investments in infrastructure. Deliver and pitch your topic in the best possible manner with this Quantum Computing How Quantum Computing Improves Our Business Download PDF. Use them to share invaluable insights on Revenue, Cost And Investment, Quantum Computing and impress your audience. This template can be altered and modified as per your expectations. So, grab it now.
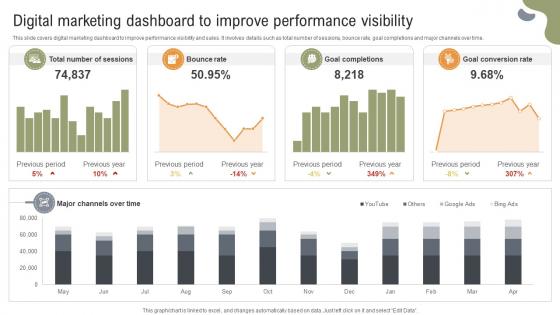
Implementing Strategies To Enhance Digital Marketing Dashboard To Improve Performance
This slide covers digital marketing dashboard to improve performance visibility and sales. It involves details such as total number of sessions, bounce rate, goal completions and major channels over time. Do you have an important presentation coming up Are you looking for something that will make your presentation stand out from the rest Look no further than Implementing Strategies To Enhance Digital Marketing Dashboard To Improve Performance. With our professional designs, you can trust that your presentation will pop and make delivering it a smooth process. And with Slidegeeks, you can trust that your presentation will be unique and memorable. So why wait Grab Implementing Strategies To Enhance Digital Marketing Dashboard To Improve Performance today and make your presentation stand out from the rest This slide covers digital marketing dashboard to improve performance visibility and sales. It involves details such as total number of sessions, bounce rate, goal completions and major channels over time.
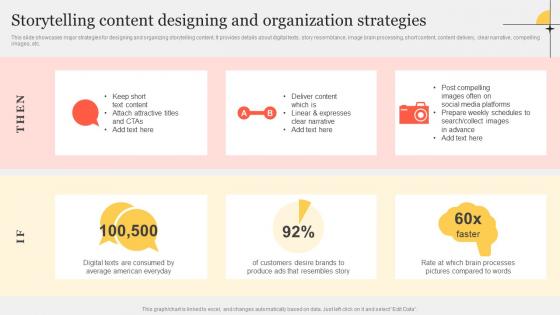
Storytelling Content Designing And Improving Customer Interaction Through Structure Pdf
This slide showcases major strategies for designing and organizing storytelling content. It provides details about digital texts, story resemblance, image brain processing, short content, content delivery, clear narrative, compelling images, etc. Whether you have daily or monthly meetings, a brilliant presentation is necessary. Storytelling Content Designing And Improving Customer Interaction Through Structure Pdf can be your best option for delivering a presentation. Represent everything in detail using Storytelling Content Designing And Improving Customer Interaction Through Structure Pdf and make yourself stand out in meetings. The template is versatile and follows a structure that will cater to your requirements. All the templates prepared by Slidegeeks are easy to download and edit. Our research experts have taken care of the corporate themes as well. So, give it a try and see the results. This slide showcases major strategies for designing and organizing storytelling content. It provides details about digital texts, story resemblance, image brain processing, short content, content delivery, clear narrative, compelling images, etc.
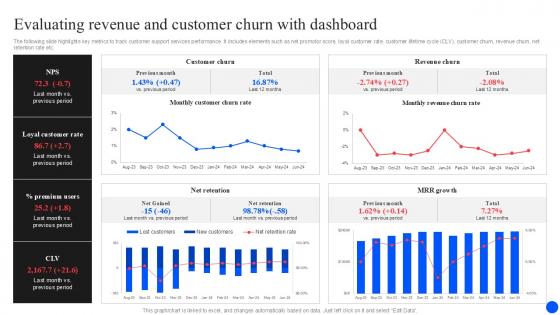
Evaluating Revenue And Customer Churn Improving Customer Retention PPT Sample
The following slide highlights key metrics to track customer support services performance. It includes elements such as net promotor score, loyal customer rate, customer lifetime cycle CLV, customer churn, revenue churn, net retention rate etc. Find highly impressive Evaluating Revenue And Customer Churn Improving Customer Retention PPT Sample on Slidegeeks to deliver a meaningful presentation. You can save an ample amount of time using these presentation templates. No need to worry to prepare everything from scratch because Slidegeeks experts have already done a huge research and work for you. You need to download Evaluating Revenue And Customer Churn Improving Customer Retention PPT Sample for your upcoming presentation. All the presentation templates are 100 percent editable and you can change the color and personalize the content accordingly. Download now The following slide highlights key metrics to track customer support services performance. It includes elements such as net promotor score, loyal customer rate, customer lifetime cycle CLV, customer churn, revenue churn, net retention rate etc.
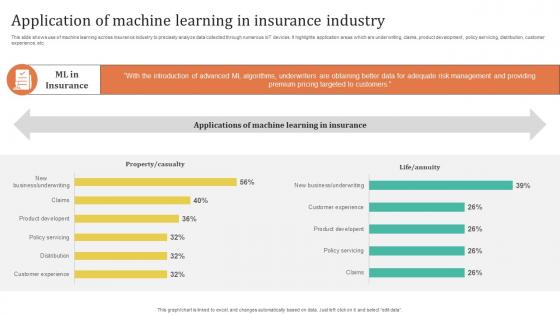
Improving Customer Satisfaction Application Of Machine Learning In Insurance Industry
This slide shows use of machine learning across insurance industry to precisely analyze data collected through numerous IoT devices. It highlights application areas which are underwriting, claims, product development, policy servicing, distribution, customer experience, etc. Get a simple yet stunning designed Improving Customer Satisfaction Application Of Machine Learning In Insurance Industry. It is the best one to establish the tone in your meetings. It is an excellent way to make your presentations highly effective. So, download this PPT today from Slidegeeks and see the positive impacts. Our easy-to-edit Improving Customer Satisfaction Application Of Machine Learning In Insurance Industry can be your go-to option for all upcoming conferences and meetings. So, what are you waiting for Grab this template today. This slide shows use of machine learning across insurance industry to precisely analyze data collected through numerous IoT devices. It highlights application areas which are underwriting, claims, product development, policy servicing, distribution, customer experience, etc.
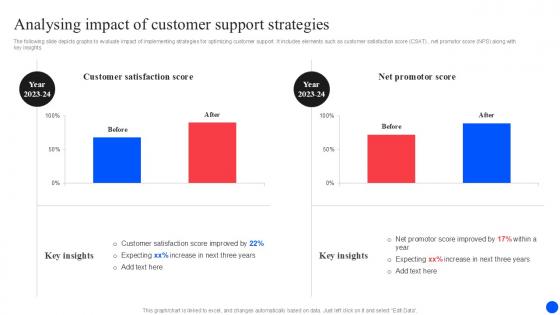
Analysing Impact Of Improving Customer Retention PPT Example
The following slide depicts graphs to evaluate impact of implementing strategies for optimizing customer support. It includes elements such as customer satisfaction score CSAT , net promotor score NPS along with key insights. Create an editable Analysing Impact Of Improving Customer Retention PPT Example that communicates your idea and engages your audience. Whether you are presenting a business or an educational presentation, pre-designed presentation templates help save time. Analysing Impact Of Improving Customer Retention PPT Example is highly customizable and very easy to edit, covering many different styles from creative to business presentations. Slidegeeks has creative team members who have crafted amazing templates. So, go and get them without any delay. The following slide depicts graphs to evaluate impact of implementing strategies for optimizing customer support. It includes elements such as customer satisfaction score CSAT , net promotor score NPS along with key insights.
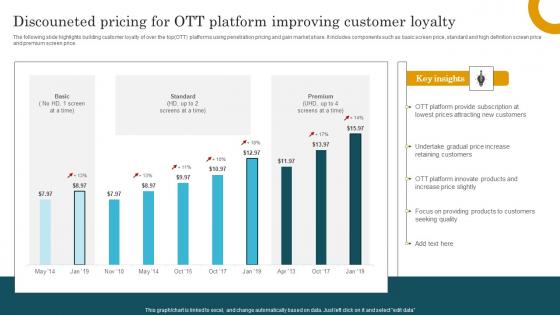
Discouneted Pricing For Ott Platform Improving Customer Loyalty Graphics Pdf
The following slide highlights building customer loyalty of over the topOTT platforms using penetration pricing and gain market share. It includes components such as basic screen price, standard and high definition screen price and premium screen price. Showcasing this set of slides titled Discouneted Pricing For Ott Platform Improving Customer Loyalty Graphics Pdf The topics addressed in these templates are Discouneted Pricing, Platform Improving, Customer Loyalty All the content presented in this PPT design is completely editable. Download it and make adjustments in color, background, font etc. as per your unique business setting. The following slide highlights building customer loyalty of over the topOTT platforms using penetration pricing and gain market share. It includes components such as basic screen price, standard and high definition screen price and premium screen price.
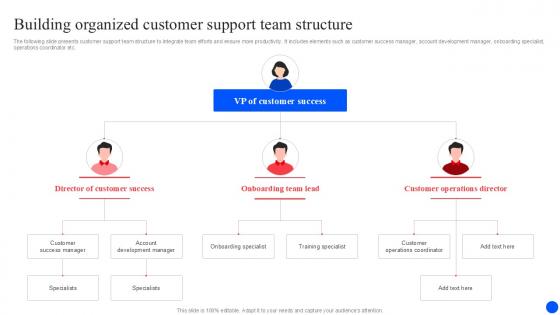
Building Organized Customer Support Improving Customer Retention PPT Template
The following slide presents customer support team structure to integrate team efforts and ensure more productivity. It includes elements such as customer success manager, account development manager, onboarding specialist, operations coordinator etc. Get a simple yet stunning designed Building Organized Customer Support Improving Customer Retention PPT Template. It is the best one to establish the tone in your meetings. It is an excellent way to make your presentations highly effective. So, download this PPT today from Slidegeeks and see the positive impacts. Our easy-to-edit Building Organized Customer Support Improving Customer Retention PPT Template can be your go-to option for all upcoming conferences and meetings. So, what are you waiting for Grab this template today. The following slide presents customer support team structure to integrate team efforts and ensure more productivity. It includes elements such as customer success manager, account development manager, onboarding specialist, operations coordinator etc.
Improving PPC Campaign Results Develop Campaign Performance Tracking Infographics Pdf
The following slide depicts campaign performance management dashboard to measure the results. It includes elements such as conversions funnel, conversion rates, opportunity value, landing pages, sources google, twitter, Facebook etc. If you are looking for a format to display your unique thoughts, then the professionally designed Improving PPC Campaign Results Develop Campaign Performance Tracking Infographics Pdf is the one for you. You can use it as a Google Slides template or a PowerPoint template. Incorporate impressive visuals, symbols, images, and other charts. Modify or reorganize the text boxes as you desire. Experiment with shade schemes and font pairings. Alter, share or cooperate with other people on your work. Download Improving PPC Campaign Results Develop Campaign Performance Tracking Infographics Pdf and find out how to give a successful presentation. Present a perfect display to your team and make your presentation unforgettable. The following slide depicts campaign performance management dashboard to measure the results. It includes elements such as conversions funnel, conversion rates, opportunity value, landing pages, sources google, twitter, Facebook etc.
Tracking First Response Time Improving Customer Retention PPT Presentation
The following slide depicts key performance indicators to review call resolution time and offer real time support. It also includes elements such as unsolved calls, weekly response time analysis, best day to call etc. Presenting this PowerPoint presentation, titled Tracking First Response Time Improving Customer Retention PPT Presentation, with topics curated by our researchers after extensive research. This editable presentation is available for immediate download and provides attractive features when used. Download now and captivate your audience. Presenting this Tracking First Response Time Improving Customer Retention PPT Presentation. Our researchers have carefully researched and created these slides with all aspects taken into consideration. This is a completely customizable Tracking First Response Time Improving Customer Retention PPT Presentation that is available for immediate downloading. Download now and make an impact on your audience. Highlight the attractive features available with our PPTs. The following slide depicts key performance indicators to review call resolution time and offer real time support. It also includes elements such as unsolved calls, weekly response time analysis, best day to call etc.
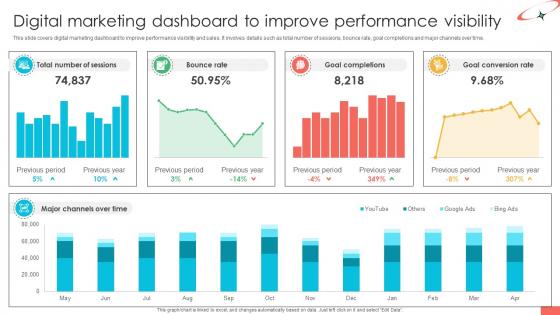
Marketing Strategies For Effective Digital Marketing Dashboard To Improve
This slide covers digital marketing dashboard to improve performance visibility and sales. It involves details such as total number of sessions, bounce rate, goal completions and major channels over time. Do you have an important presentation coming up Are you looking for something that will make your presentation stand out from the rest Look no further than Marketing Strategies For Effective Digital Marketing Dashboard To Improve. With our professional designs, you can trust that your presentation will pop and make delivering it a smooth process. And with Slidegeeks, you can trust that your presentation will be unique and memorable. So why wait Grab Marketing Strategies For Effective Digital Marketing Dashboard To Improve today and make your presentation stand out from the rest This slide covers digital marketing dashboard to improve performance visibility and sales. It involves details such as total number of sessions, bounce rate, goal completions and major channels over time.
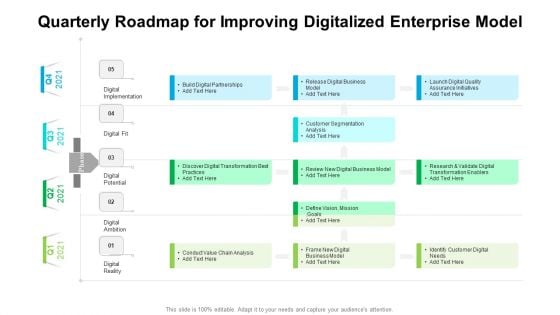
Quarterly Roadmap For Improving Digitalized Enterprise Model Summary
We present our quarterly roadmap for improving digitalized enterprise model summary. This PowerPoint layout is easy-to-edit so you can change the font size, font type, color, and shape conveniently. In addition to this, the PowerPoint layout is Google Slides compatible, so you can share it with your audience and give them access to edit it. Therefore, download and save this well-researched quarterly roadmap for improving digitalized enterprise model summary in different formats like PDF, PNG, and JPG to smoothly execute your business plan.
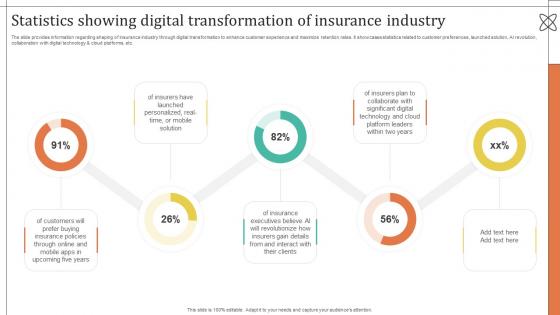
Improving Customer Satisfaction Statistics Showing Digital Transformation Of Insurance
The slide provides information regarding shaping of insurance industry through digital transformation to enhance customer experience and maximize retention rates. It showcases statistics related to customer preferences, launched solution, AI revolution, collaboration with digital technology and cloud platforms, etc. If you are looking for a format to display your unique thoughts, then the professionally designed Improving Customer Satisfaction Statistics Showing Digital Transformation Of Insurance is the one for you. You can use it as a Google Slides template or a PowerPoint template. Incorporate impressive visuals, symbols, images, and other charts. Modify or reorganize the text boxes as you desire. Experiment with shade schemes and font pairings. Alter, share or cooperate with other people on your work. Download Improving Customer Satisfaction Statistics Showing Digital Transformation Of Insurance and find out how to give a successful presentation. Present a perfect display to your team and make your presentation unforgettable. The slide provides information regarding shaping of insurance industry through digital transformation to enhance customer experience and maximize retention rates. It showcases statistics related to customer preferences, launched solution, AI revolution, collaboration with digital technology and cloud platforms, etc.
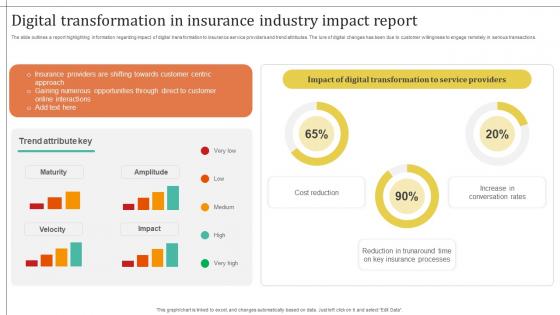
Improving Customer Satisfaction Digital Transformation In Insurance Industry Impact
The slide outlines a report highlighting information regarding impact of digital transformation to insurance service providers and trend attributes. The lure of digital changes has been due to customer willingness to engage remotely in serious transactions. Formulating a presentation can take up a lot of effort and time, so the content and message should always be the primary focus. The visuals of the PowerPoint can enhance the presenters message, so our Improving Customer Satisfaction Digital Transformation In Insurance Industry Impact was created to help save time. Instead of worrying about the design, the presenter can concentrate on the message while our designers work on creating the ideal templates for whatever situation is needed. Slidegeeks has experts for everything from amazing designs to valuable content, we have put everything into Improving Customer Satisfaction Digital Transformation In Insurance Industry Impact. The slide outlines a report highlighting information regarding impact of digital transformation to insurance service providers and trend attributes. The lure of digital changes has been due to customer willingness to engage remotely in serious transactions.
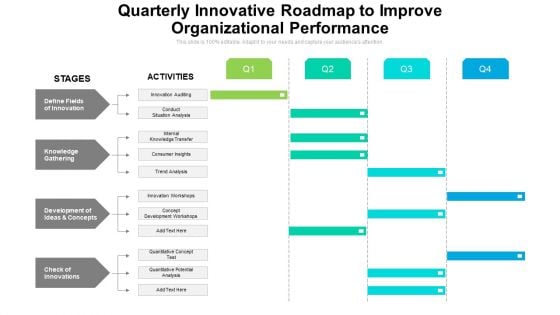
Quarterly Innovative Roadmap To Improve Organizational Performance Elements
We present our quarterly innovative roadmap to improve organizational performance elements. This PowerPoint layout is easy to edit so you can change the font size, font type, color, and shape conveniently. In addition to this, the PowerPoint layout is Google Slides compatible, so you can share it with your audience and give them access to edit it. Therefore, download and save this well researched quarterly innovative roadmap to improve organizational performance elements in different formats like PDF, PNG, and JPG to smoothly execute your business plan.
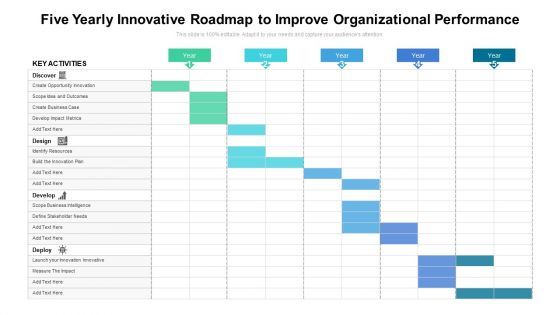
Five Yearly Innovative Roadmap To Improve Organizational Performance Portrait
We present our five yearly innovative roadmap to improve organizational performance portrait. This PowerPoint layout is easy to edit so you can change the font size, font type, color, and shape conveniently. In addition to this, the PowerPoint layout is Google Slides compatible, so you can share it with your audience and give them access to edit it. Therefore, download and save this well researched five yearly innovative roadmap to improve organizational performance portrait in different formats like PDF, PNG, and JPG to smoothly execute your business plan.
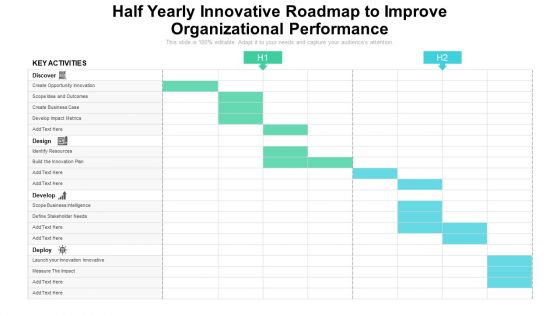
Half Yearly Innovative Roadmap To Improve Organizational Performance Designs
We present our half yearly innovative roadmap to improve organizational performance designs. This PowerPoint layout is easy to edit so you can change the font size, font type, color, and shape conveniently. In addition to this, the PowerPoint layout is Google Slides compatible, so you can share it with your audience and give them access to edit it. Therefore, download and save this well researched half yearly innovative roadmap to improve organizational performance designs in different formats like PDF, PNG, and JPG to smoothly execute your business plan.
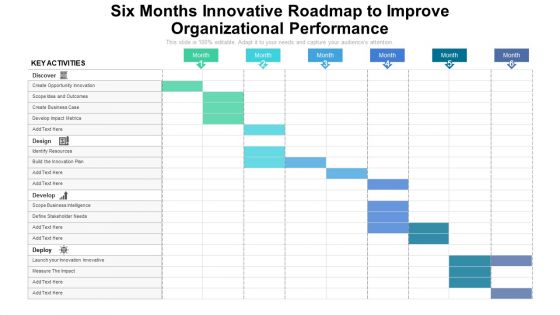
Six Months Innovative Roadmap To Improve Organizational Performance Inspiration
We present our six months innovative roadmap to improve organizational performance inspiration. This PowerPoint layout is easy to edit so you can change the font size, font type, color, and shape conveniently. In addition to this, the PowerPoint layout is Google Slides compatible, so you can share it with your audience and give them access to edit it. Therefore, download and save this well researched six months innovative roadmap to improve organizational performance inspiration in different formats like PDF, PNG, and JPG to smoothly execute your business plan.
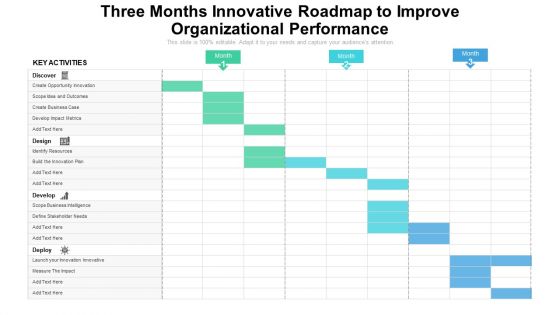
Three Months Innovative Roadmap To Improve Organizational Performance Infographics
We present our three months innovative roadmap to improve organizational performance infographics. This PowerPoint layout is easy to edit so you can change the font size, font type, color, and shape conveniently. In addition to this, the PowerPoint layout is Google Slides compatible, so you can share it with your audience and give them access to edit it. Therefore, download and save this well researched three months innovative roadmap to improve organizational performance infographics in different formats like PDF, PNG, and JPG to smoothly execute your business plan.
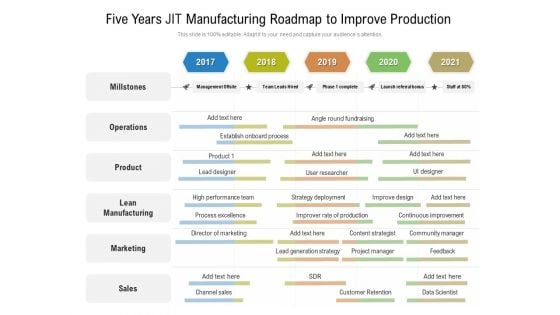
Five Years JIT Manufacturing Roadmap To Improve Production Background
We present our five years jit manufacturing roadmap to improve production background. This PowerPoint layout is easy-to-edit so you can change the font size, font type, color, and shape conveniently. In addition to this, the PowerPoint layout is Google Slides compatible, so you can share it with your audience and give them access to edit it. Therefore, download and save this well-researched five years jit manufacturing roadmap to improve production background in different formats like PDF, PNG, and JPG to smoothly execute your business plan.
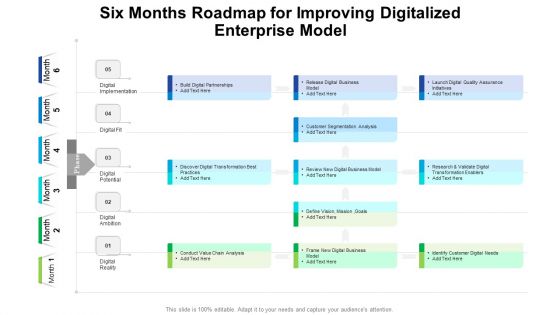
Six Months Roadmap For Improving Digitalized Enterprise Model Microsoft
We present our six months roadmap for improving digitalized enterprise model microsoft. This PowerPoint layout is easy-to-edit so you can change the font size, font type, color, and shape conveniently. In addition to this, the PowerPoint layout is Google Slides compatible, so you can share it with your audience and give them access to edit it. Therefore, download and save this well-researched six months roadmap for improving digitalized enterprise model microsoft in different formats like PDF, PNG, and JPG to smoothly execute your business plan.
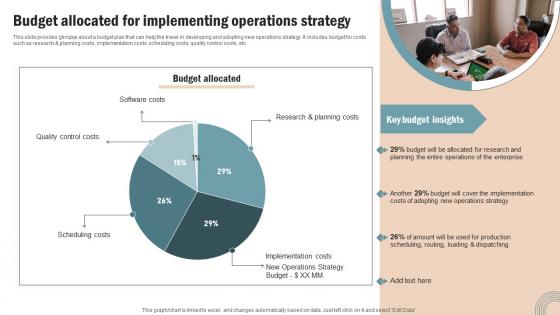
Budget Allocated Implementing Operations Strategy Improve Business Productivity Slides Pdf
This slide provides glimpse about a budget plan that can help the travel in developing and adopting new operations strategy. It includes budget for costs such as research and planning costs, implementation costs, scheduling costs, quality control costs, etc. From laying roadmaps to briefing everything in detail, our templates are perfect for you. You can set the stage with your presentation slides. All you have to do is download these easy to edit and customizable templates. Budget Allocated Implementing Operations Strategy Improve Business Productivity Slides Pdf will help you deliver an outstanding performance that everyone would remember and praise you for. Do download this presentation today. This slide provides glimpse about a budget plan that can help the travel in developing and adopting new operations strategy. It includes budget for costs such as research and planning costs, implementation costs, scheduling costs, quality control costs, etc.
Usage Technology Improve Transforming Medicare Services Using Health Icons Pdf
This slide covers impact of health information technology on healthcare services. It involves key technologies such as block chain, robotics, immunotherapies and artificial intelligence. Present like a pro with Usage Technology Improve Transforming Medicare Services Using Health Icons Pdf Create beautiful presentations together with your team, using our easy to use presentation slides. Share your ideas in real time and make changes on the fly by downloading our templates. So whether you are in the office, on the go, or in a remote location, you can stay in sync with your team and present your ideas with confidence. With Slidegeeks presentation got a whole lot easier. Grab these presentations today. This slide covers impact of health information technology on healthcare services. It involves key technologies such as block chain, robotics, immunotherapies and artificial intelligence.


 Continue with Email

 Home
Home


