Improvement Chart
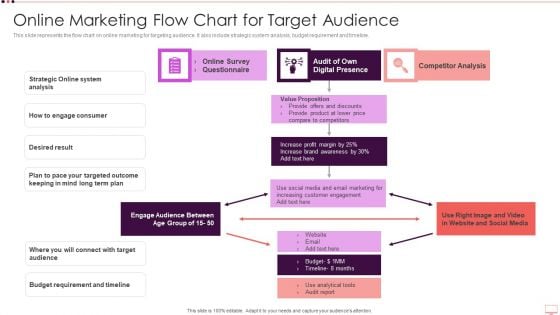
Online Marketing Flow Chart For Target Audience Slides PDF
This slide represents the flow chart on online marketing for targeting audience. It also include strategic system analysis, budget requirement and timeline. Showcasing this set of slides titled Online Marketing Flow Chart For Target Audience Slides PDF. The topics addressed in these templates are Plan, Consumer, System. All the content presented in this PPT design is completely editable. Download it and make adjustments in color, background, font etc. as per your unique business setting.
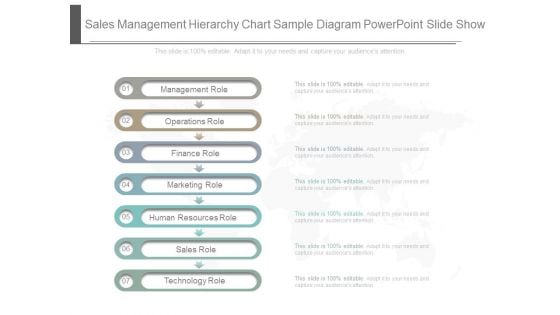
Sales Management Hierarchy Chart Sample Diagram Powerpoint Slide Show
This is a sales management hierarchy chart sample diagram powerpoint slide show. This is a seven stage process. The stages in this process are management role, operations role, finance role, marketing role, human resources role, sales role, technology role.
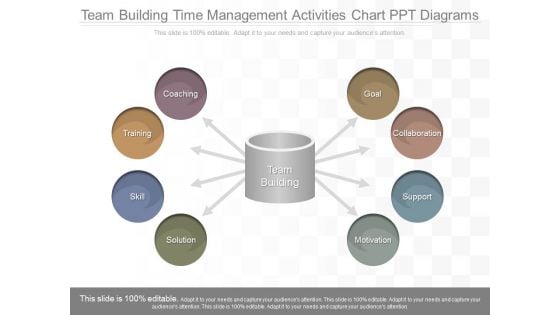
Team Building Time Management Activities Chart Ppt Diagrams
This is a team building time management activities chart ppt diagrams. This is a eight stage process. The stages in this process are goal, collaboration, support, motivation, solution, skill, training, coaching.

Conversion Rate Optimization Flow Chart Sample Diagram Powerpoint Slides Images
This is a conversion rate optimization flow chart sample diagram powerpoint slides images. This is a five stage process. The stages in this process are gather insights, measure, unique, pitch, status, future.

Conversion Rate Optimization Flow Chart Sample Diagram Example Ppt
This is a conversion rate optimization flow chart sample diagram example ppt. This is a four stage process. The stages in this process are measure, gather insights, test, form hypothesis.
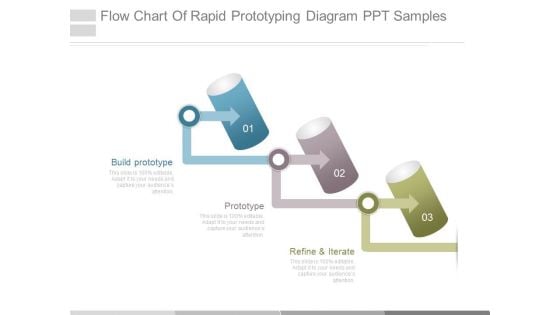
Flow Chart Of Rapid Prototyping Diagram Ppt Samples
This is a flow chart of rapid prototyping diagram ppt samples. This is a three stage process. The stages in this process are build prototype, prototype, refine and iterate.
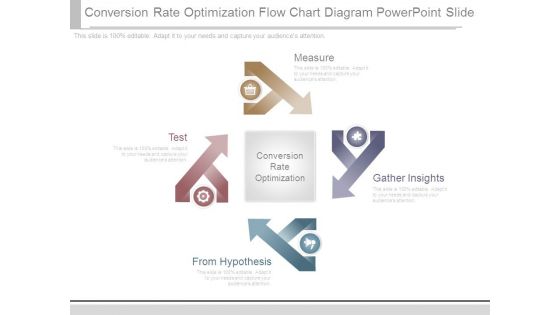
Conversion Rate Optimization Flow Chart Diagram Powerpoint Slide
This is a conversion rate optimization flow chart diagram powerpoint slide. This is a four stage process. The stages in this process are measure, gather insights, from hypothesis, test, conversion rate optimization.
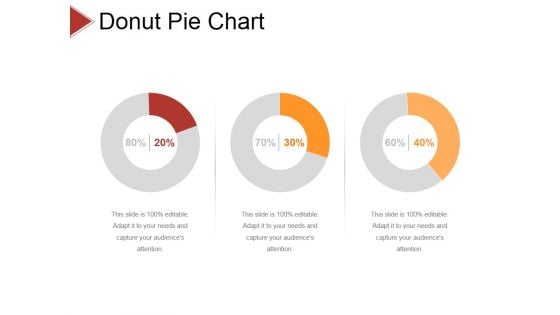
Donut Pie Chart Ppt PowerPoint Presentation Infographic Template Diagrams
This is a donut pie chart ppt powerpoint presentation infographic template diagrams. This is a three stage process. The stages in this process are business, strategy, analysis, pretention, comparison.
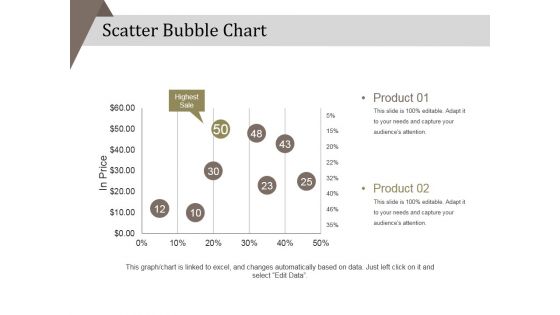
Scatter Bubble Chart Ppt PowerPoint Presentation Diagram Ppt
This is a scatter bubble chart ppt powerpoint presentation diagram ppt. This is a two stage process. The stages in this process are product, in price, highest sale, percentage, business, marketing.

Donut Pie Chart Product Finance Ppt PowerPoint Presentation Diagram Ppt
This is a donut pie chart product finance ppt powerpoint presentation diagram ppt. This is a three stage process. The stages in this process are finance, management, strategy, analysis, marketing.
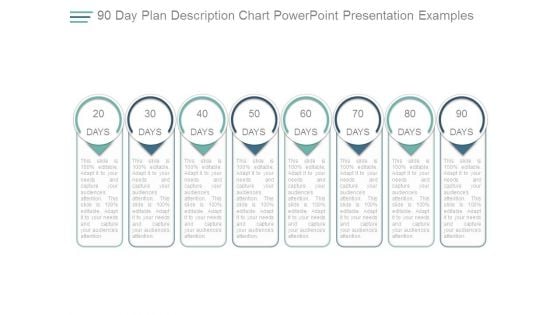
90 Day Plan Description Chart Powerpoint Presentation Examples
This is a 90 day plan description chart powerpoint presentation examples. This is a eight stage process. The stages in this process are 20 days, 30 days, 40 days, 50 days, 60 days, 70 days, 80 days, 90 days.
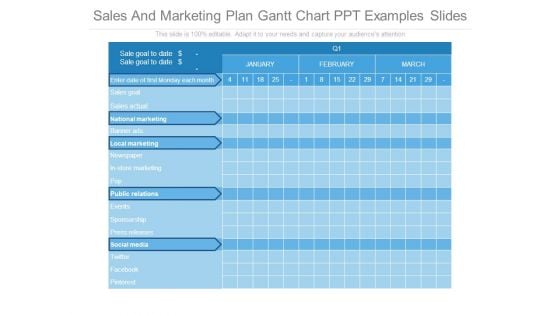
Sales And Marketing Plan Gantt Chart Ppt Examples Slides
This is a sales and marketing plan gantt chart ppt examples slides. This is a three stage process. The stages in this process are sales goal, sales actual, banner ads, newspaper, in store marketing.
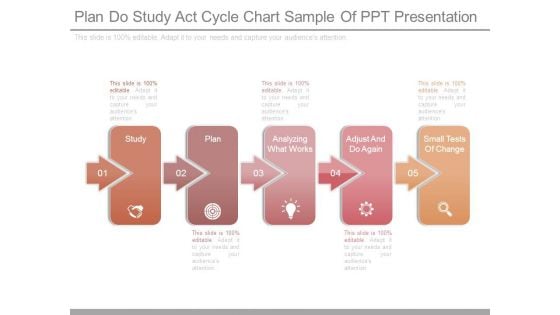
Plan Do Study Act Cycle Chart Sample Of Ppt Presentation
This is a plan do study act cycle chart sample of ppt presentation. This is a five stage process. The stages in this process are study, plan, analyzing what works, adjust and do again, small tests of change.
Cost Benefit Analysis Chart With Icons Powerpoint Layout
This is a cost benefit analysis chart with icons powerpoint layout. This is a two stage process. The stages in this process are balance scale, compare, business, marketing, management.
Project Charter Linear Chart With Icons Powerpoint Slide Background
This is a project charter linear chart with icons powerpoint slide background. This is a five stage process. The stages in this process are resources team roles, project milestone, project scope, problem statement goal statement, business case.
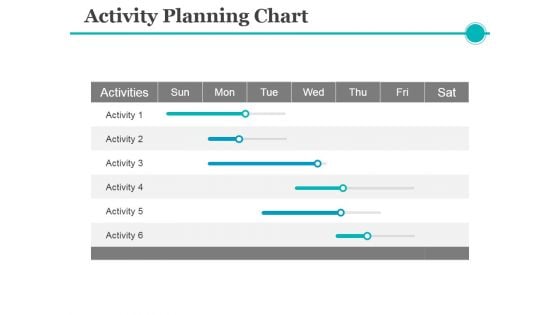
Activity Planning Chart Ppt PowerPoint Presentation Visual Aids Model
This is a activity planning chart ppt powerpoint presentation visual aids model. This is a six stage process. The stages in this process are activities, business, management, table, planning.
Donut Pie Chart Ppt PowerPoint Presentation Icon Slide Portrait
This is a donut pie chart ppt powerpoint presentation icon slide portrait. This is a five stage process. The stages in this process are product, percentage, finance, donut, business.
Management Organizational Chart Ppt PowerPoint Presentation Portfolio Icon
This is a management organizational chart ppt powerpoint presentation portfolio icon. This is a three stage process. The stages in this process are tony williams, bill durbin, david johnson, robert fowler, kate jeter.
Management Organizational Chart Ppt PowerPoint Presentation Icon Background Images
This is a management organizational chart ppt powerpoint presentation icon background images. This is a three stage process. The stages in this process are marketing communication manager, marketing director, employee, bill durbin, robert fowler.
Clustered Bar Chart Finance Ppt PowerPoint Presentation Icon Tips
This is a clustered bar chart finance ppt powerpoint presentation icon tips. This is a two stage process. The stages in this process are analysis, finance, marketing, management, investment.
Bubble Chart Employee Value Proposition Ppt PowerPoint Presentation Icon Sample
This is a bubble chart employee value proposition ppt powerpoint presentation icon sample. This is a two stage process. The stages in this process are business, management, strategy, analysis, marketing.
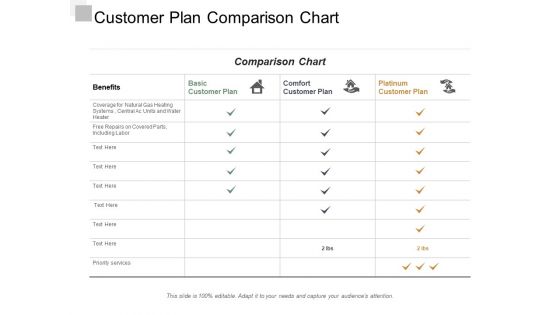
Customer Plan Comparison Chart Ppt Powerpoint Presentation Infographic Template Portrait
This is a customer plan comparison chart ppt powerpoint presentation infographic template portrait. This is a four stage process. The stages in this process are customer service strategy, customer service plan, customer service approach.
Five Steps Chart With Icons Ppt PowerPoint Presentation Infographics Guidelines
This is a five steps chart with icons ppt powerpoint presentation infographics guidelines. This is a five stage process. The stages in this process are boxes and arrows, cartoon and arrows, text boxes with arrows.
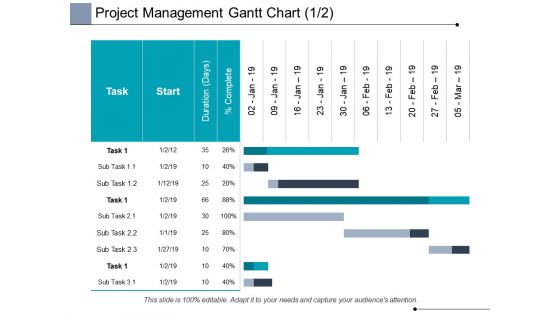
Project Management Gantt Chart Planning Ppt PowerPoint Presentation Visuals
This is a project management gantt chart planning ppt powerpoint presentation visuals. This is a three stage process. The stages in this process are business, planning, strategy, marketing, management.
Combo Chart Marketing Analysis Ppt Powerpoint Presentation Pictures Icons
This is a combo chart marketing analysis ppt powerpoint presentation pictures icons. This is a three stage process. The stages in this process are finance, marketing, management, investment, analysis.
Clustered Bar Chart Finance Ppt Powerpoint Presentation Icon Graphics Template
This is a clustered bar chart finance ppt powerpoint presentation icon graphics template. This is a four stage process. The stages in this process are finance, marketing, management, investment, analysis.
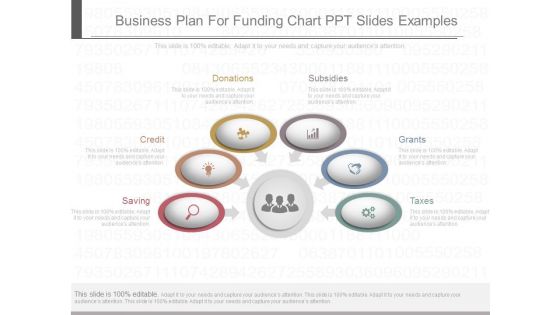
Business Plan For Funding Chart Ppt Slides Examples
This is a business plan for funding chart ppt slides examples. This is a five stage process. The stages in this process are saving, credit, donations, subsidies, grants, taxes.
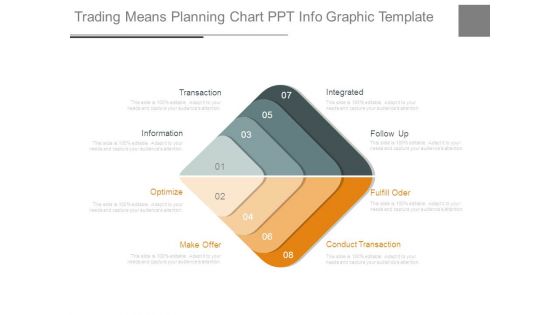
Trading Means Planning Chart Ppt Info Graphic Template
This is a trading means planning chart ppt info graphic template. This is a eight stage process. The stages in this process are transaction, information, optimize, make offer, integrated, follow up, fulfill order, conduct transaction.
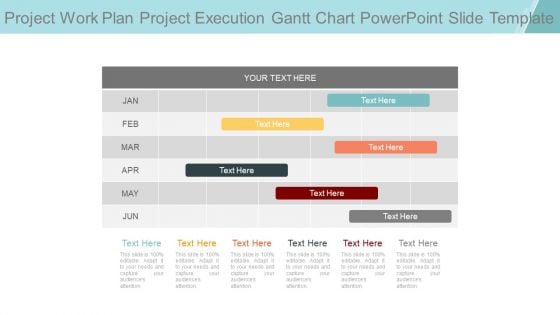
Project Work Plan Project Execution Gantt Chart Powerpoint Slide Template
This is a project work plan project execution gantt chart powerpoint slide template. This is a six stage process. The stages in this process are jan, feb, mar, apr, may, jun.
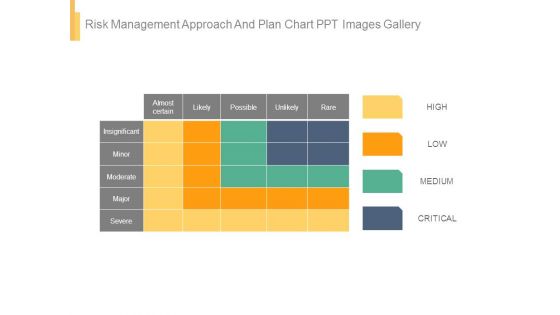
Risk Management Approach And Plan Chart Ppt Images Gallery
This is a risk management approach and plan chart ppt images gallery. This is a four stage process. The stages in this process are almost certain, likely, possible, unlikely, rare, insignificant, minor, moderate, major, severe, high, low, medium, critical.
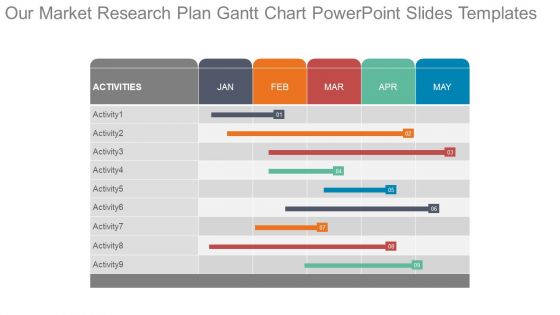
Our Market Research Plan Gantt Chart Powerpoint Slides Templates
This is a our market research plan gantt chart powerpoint slides templates. This is a nine stage process. The stages in this process are activities, jan, feb, mar, apr, may.
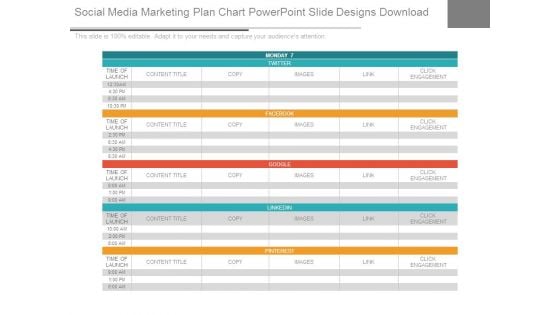
Social Media Marketing Plan Chart Powerpoint Slide Designs Download
This is a social media marketing plan chart powerpoint slide designs download. This is a five stage process. The stages in this process are content title, copy, images, link, click engagement.
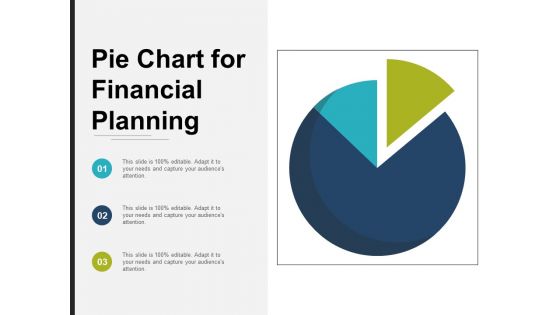
Pie Chart For Financial Planning Ppt PowerPoint Presentation Professional Aids
This is a pie chart for financial planning ppt powerpoint presentation professional aids. This is a three stage process. The stages in this process are sectioned circle, segmented circle, partitioned circle.
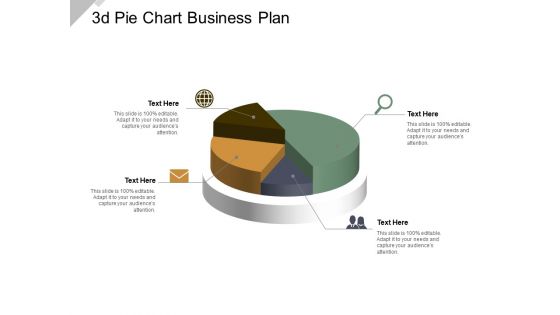
3D Pie Chart Business Plan Ppt PowerPoint Presentation Model Guidelines
This is a 3d pie chart business plan ppt powerpoint presentation model guidelines. This is a four stage process. The stages in this process are art, colouring, paint brush.
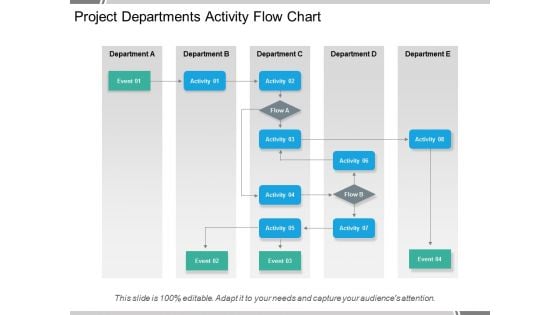
Project Departments Activity Flow Chart Ppt PowerPoint Presentation Pictures Show
This is a project departments activity flow chart ppt powerpoint presentation pictures show. This is a five stage process. The stages in this process are operational excellence, operational plan, operational process.
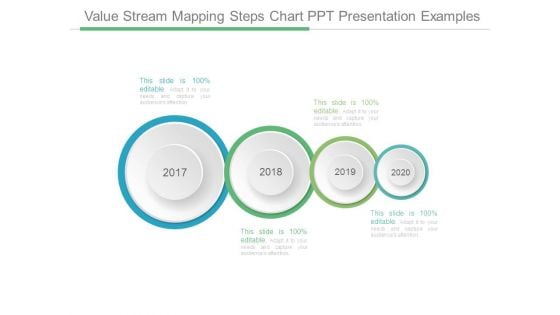
Value Stream Mapping Steps Chart Ppt Presentation Examples
This is a value stream mapping steps chart ppt presentation examples. This is a four stage process. The stages in this process are years, time planning, business, marketing, future.
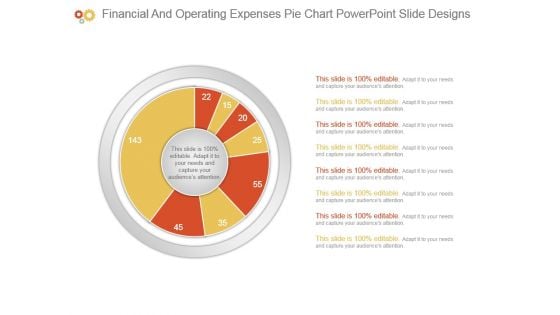
Financial And Operating Expenses Pie Chart Powerpoint Slide Designs
This is a financial and operating expenses pie chart powerpoint slide designs. This is a eight stage process. The stages in this process are business, diagram, marketing, management, presentation.
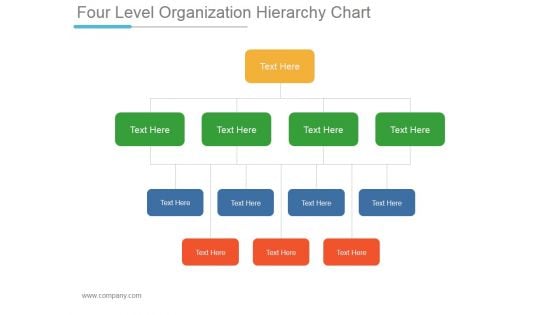
Four Level Organization Hierarchy Chart Ppt PowerPoint Presentation Clipart
This is a four level organization hierarchy chart ppt powerpoint presentation clipart. This is a four stage process. The stages in this process are business, strategy, marketing, management, text.
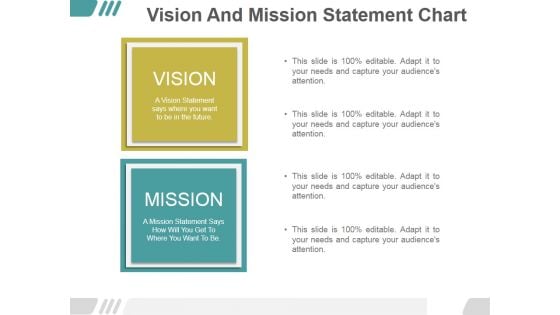
Vision And Mission Statement Chart Ppt PowerPoint Presentation Samples
This is a vision and mission statement chart ppt powerpoint presentation samples. This is a two stage process. The stages in this process are vision, business, marketing, mission, management.
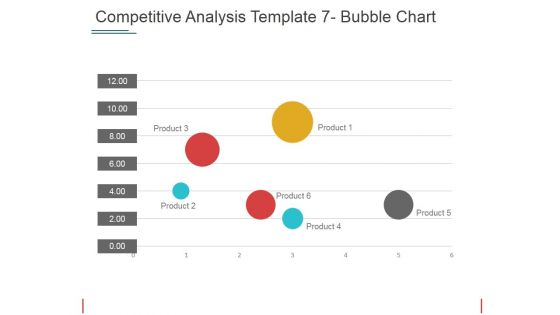
Competitive Analysis Bubble Chart Ppt PowerPoint Presentation Pictures Mockup
This is a competitive analysis bubble chart ppt powerpoint presentation pictures mockup. This is a six stage process. The stages in this process are product, table, business, marketing, management.
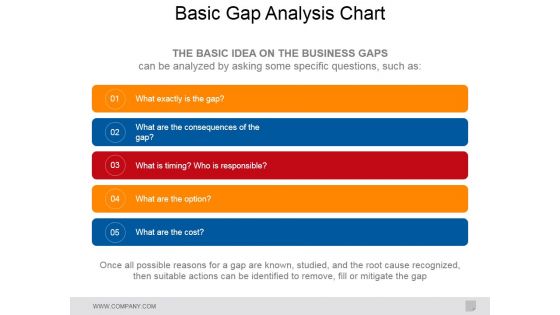
Basic Gap Analysis Chart Ppt PowerPoint Presentation Professional Slide Download
This is a basic gap analysis chart ppt powerpoint presentation professional slide download. This is a five stage process. The stages in this process are business, marketing, analysis, gap, idea, management.
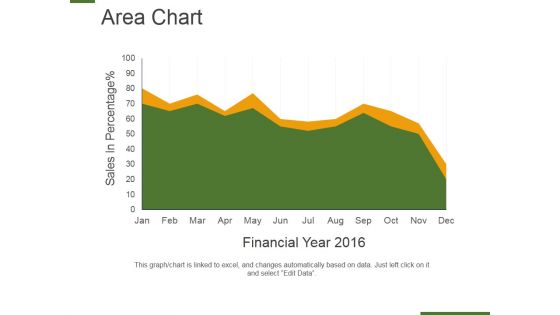
Area Chart Ppt PowerPoint Presentation Layouts Graphics Example
This is a area chart ppt powerpoint presentation layouts graphics example. This is a two stage process. The stages in this process are sales in percentage, financial year, business, marketing, presentation.
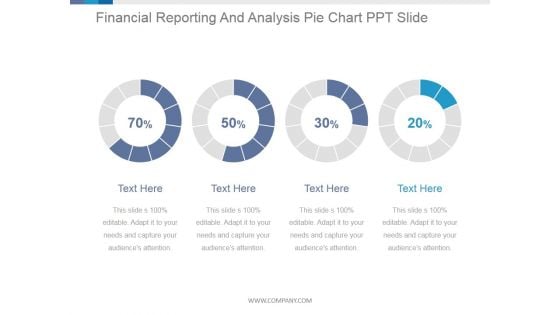
Financial Reporting And Analysis Pie Chart Ppt PowerPoint Presentation Guidelines
This is a financial reporting and analysis pie chart ppt powerpoint presentation guidelines. This is a four stage process. The stages in this process are process, percentage, business, marketing, finance.
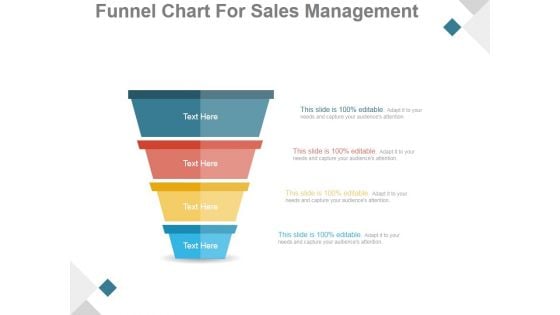
Funnel Chart For Sales Management Ppt PowerPoint Presentation Styles
This is a funnel chart for sales management ppt powerpoint presentation styles. This is a four stage process. The stages in this process are funnel, process, flow, business, sale.
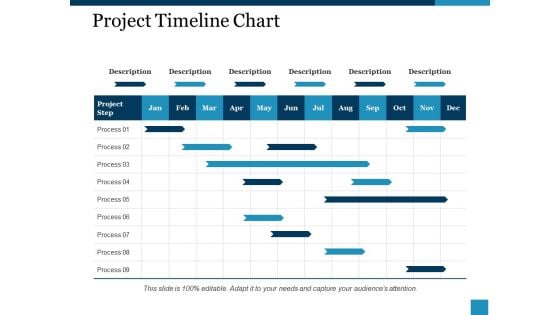
Project Timeline Chart Ppt PowerPoint Presentation Portfolio Gridlines
This is a project timeline chart ppt powerpoint presentation portfolio gridlines. This is a nine stage process. The stages in this process are description, process, project step, table, business.

Insurance Claim Approval Flow Chart Ppt Powerpoint Presentation Styles Gallery
This is a insurance claim approval flow chart ppt powerpoint presentation styles gallery. This is a four stage process. The stages in this process are insurance claim process, insurance claim steps, insurance claim procedure.
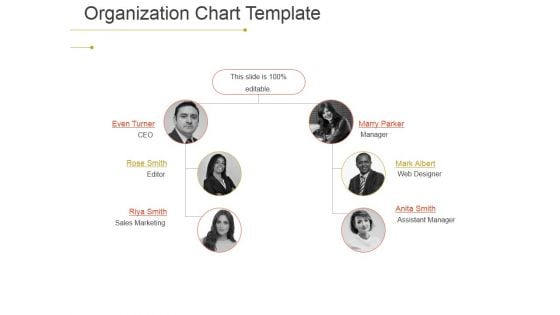
Organization Chart Ppt PowerPoint Presentation Model Graphic Images
This is a organization chart ppt powerpoint presentation model graphic images. This is a six stage process. The stages in this process are editor, sales marketing, assistant manager, manager, web designer.
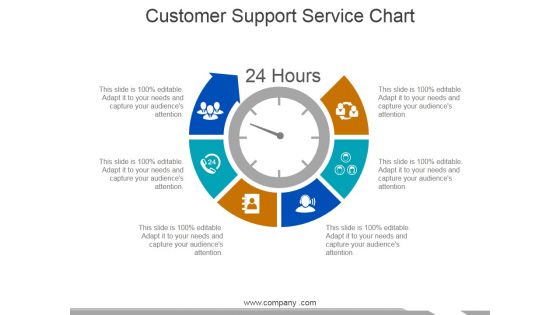
Customer Support Service Chart Ppt PowerPoint Presentation Infographic Template Graphics
This is a customer support service chart ppt powerpoint presentation infographic template graphics. This is a six stage process. The stages in this process are business, icons, strategy, marketing.
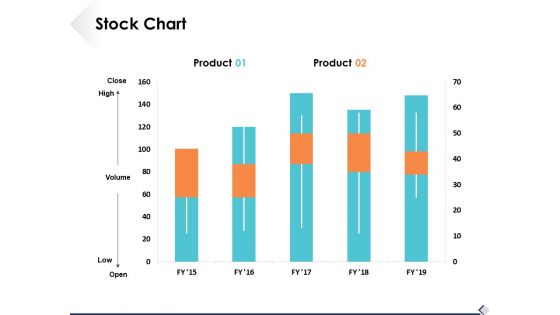
Stock Chart Finance Ppt PowerPoint Presentation Styles Background Image
This is a stock chart finance ppt powerpoint presentation styles background image. This is a two stage process. The stages in this process are analysis, marketing, icons, finance, strategy.
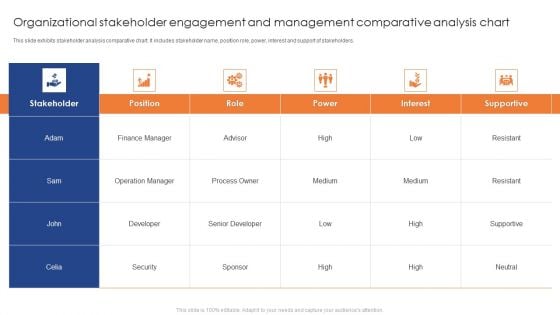
Organizational Stakeholder Engagement And Management Comparative Analysis Chart Professional PDF
This slide exhibits stakeholder analysis comparative chart. It includes stakeholder name, position role, power, interest and support of stakeholders. Showcasing this set of slides titled Organizational Stakeholder Engagement And Management Comparative Analysis Chart Professional PDF. The topics addressed in these templates are Finance Manager, Operation Manager, Developer. All the content presented in this PPT design is completely editable. Download it and make adjustments in color, background, font etc. as per your unique business setting.
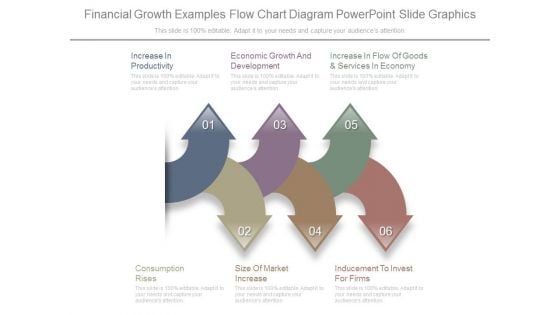
Financial Growth Examples Flow Chart Diagram Powerpoint Slide Graphics
This is a financial growth examples flow chart diagram powerpoint slide graphics. This is a six stage process. The stages in this process are increase in productivity, economic growth and development, increase in flow of goods and services in economy, consumption rises, size of market increase, inducement to invest for firms.
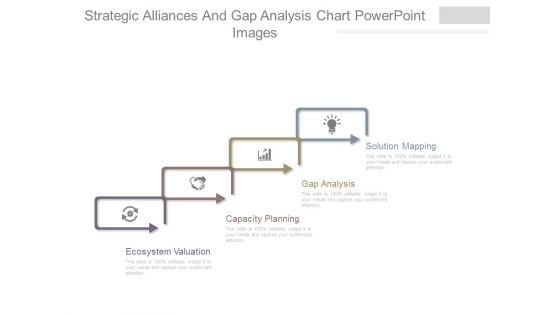
Strategic Alliances And Gap Analysis Chart Powerpoint Images
This is a strategic alliances and gap analysis chart powerpoint images. This is a four stage process. The stages in this process are solution mapping, gap analysis, capacity planning, ecosystem valuation.

Hierarchy Chart Sample Templates Ppt PowerPoint Presentation Background Designs
This is a hierarchy chart sample templates ppt powerpoint presentation background designs. This is a two stage process. The stages in this process are business, marketing, management, communication, planning.
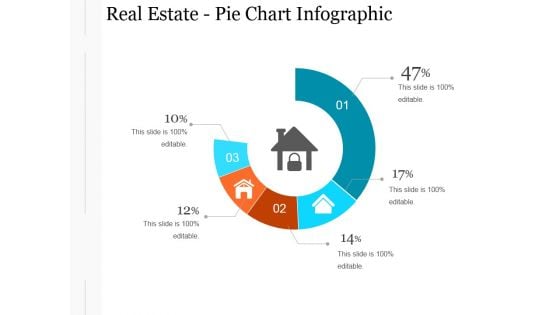
Real Estate Pie Chart Infographic Ppt PowerPoint Presentation Designs Download
This is a real estate pie chart infographic ppt powerpoint presentation designs download. This is a four stage process. The stages in this process are business, planning, management, marketing, strategy.

Donut Pie Chart Ppt PowerPoint Presentation Infographics Outfit
This is a donut pie chart ppt powerpoint presentation infographics outfit. This is a three stage process. The stages in this process are business, strategy, analysis, planning, dashboard, finance.
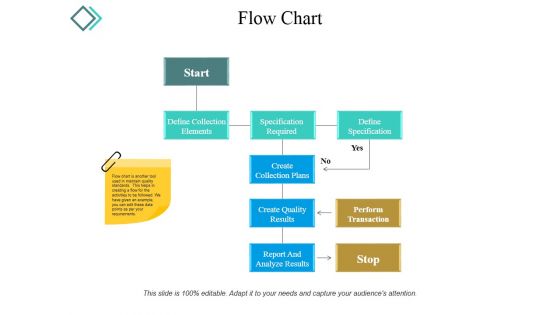
Flow Chart Ppt PowerPoint Presentation Styles Example Topics
This is a flow chart ppt powerpoint presentation styles example topics. This is a nine stage process. The stages in this process are start, create collection plans, define specification, specification required.

Donut Pie Chart Ppt PowerPoint Presentation File Example Introduction
This is a donut pie chart ppt powerpoint presentation file example introduction. This is a three stage process. The stages in this process are business, marketing, finance, planning, analysis.
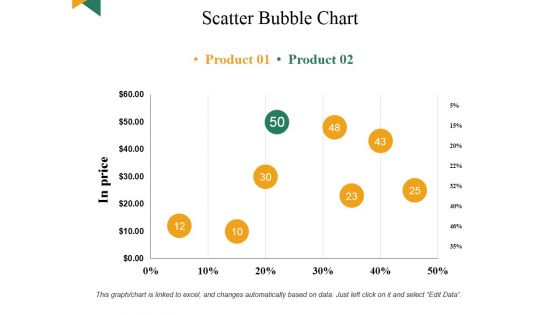
Scatter Bubble Chart Ppt PowerPoint Presentation Summary Visual Aids
This is a scatter bubble chart ppt powerpoint presentation summary visual aids. This is a eight stage process. The stages in this process are business, marketing, finance, analysis, planning.

Quality Cost Report Trend Chart Ppt PowerPoint Presentation Portfolio Maker
This is a quality cost report trend chart ppt powerpoint presentation portfolio maker. This is a two stage process. The stages in this process are compare, marketing, business, strategy, planning.
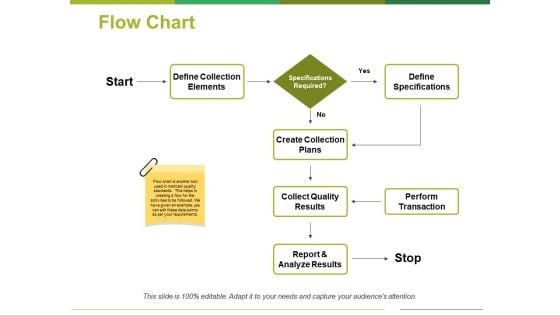
Flow Chart Ppt PowerPoint Presentation File Infographic Template
This is a flow chart ppt powerpoint presentation file infographic template. This is a seven stage process. The stages in this process are start, define specifications, perform transaction, create collection plans, report and analyze results.


 Continue with Email

 Home
Home


