In Progress Icon
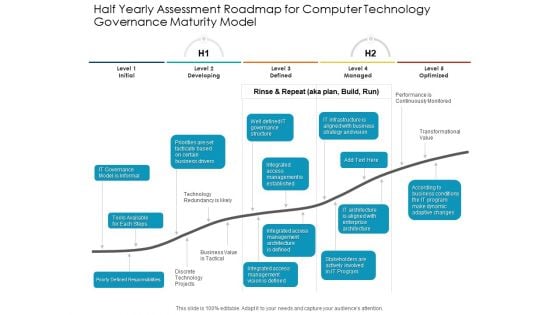
Half Yearly Assessment Roadmap For Computer Technology Governance Maturity Model Ideas
Visualize your work plan and communicate your ideas impactfully with our pre designed half yearly assessment roadmap for computer technology governance maturity model ideas. Showcase the detailed overview of the project, the key deliverables, and the milestones to be achieved with the help of our fully customizable PowerPoint layout. You can easily emphasize on the project goals and discuss all the activities involved in an easy to comprehend manner by utilizing our professionally designed PPT theme. This roadmap PowerPoint layout is a perfect strategic planning tool that can help in keeping the project on track. With our attractive PowerPoint theme, you can articulate the workflow, track the work progress, and have a clear vision of the goal to be achieved. Download this versatile half yearly assessment roadmap for computer technology governance maturity model ideas and save your hours of work.
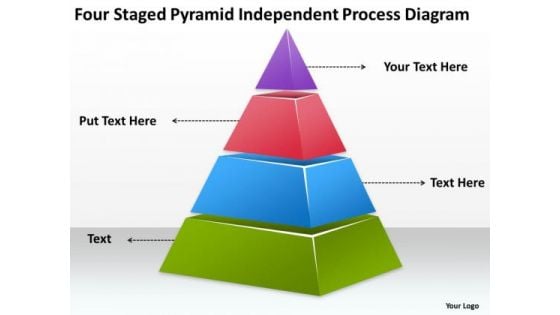
Four Staged Pyramid Independent Process Diagram Ppt Insurance Business Plan PowerPoint Templates
We present our four staged pyramid independent process diagram ppt insurance business plan PowerPoint templates.Download our Pyramids PowerPoint Templates because Our PowerPoint Templates and Slides are aesthetically designed to attract attention. We gaurantee that they will grab all the eyeballs you need. Use our Business PowerPoint Templates because It can Bubble and burst with your ideas. Download and present our Process and Flows PowerPoint Templates because Our PowerPoint Templates and Slides offer you the needful to organise your thoughts. Use them to list out your views in a logical sequence. Present our Success PowerPoint Templates because You have a driving passion to excel in your field. Our PowerPoint Templates and Slides will prove ideal vehicles for your ideas. Present our Flow Charts PowerPoint Templates because Our PowerPoint Templates and Slides offer you the widest possible range of options.Use these PowerPoint slides for presentations relating to Pyramidal, pyramid, five, isolated, model, step, hierarchy, diagram, layered, cone, scheme, process, element, shape, abstract, illustration, chart, design, color, growth, progress, structure, triangular. The prominent colors used in the PowerPoint template are Purple, Red, Blue. Feed in some energy with our Four Staged Pyramid Independent Process Diagram Ppt Insurance Business Plan PowerPoint Templates. Your thoughts will drum up a catchy beat.
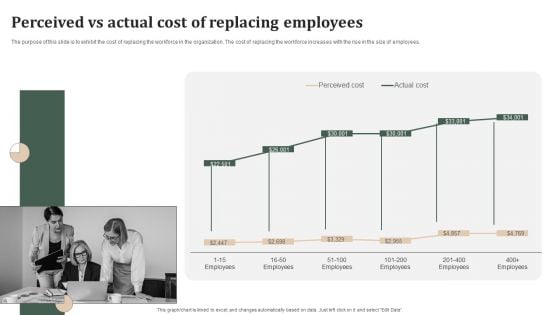
Successful Staff Retention Techniques Perceived Vs Actual Cost Of Replacing Employees Demonstration PDF
The purpose of this slide is to exhibit the cost of replacing the workforce in the organization. The cost of replacing the workforce increases with the rise in the size of employees. Present like a pro with Successful Staff Retention Techniques Perceived Vs Actual Cost Of Replacing Employees Demonstration PDF Create beautiful presentations together with your team, using our easy to use presentation slides. Share your ideas in real time and make changes on the fly by downloading our templates. So whether you are in the office, on the go, or in a remote location, you can stay in sync with your team and present your ideas with confidence. With Slidegeeks presentation got a whole lot easier. Grab these presentations today.
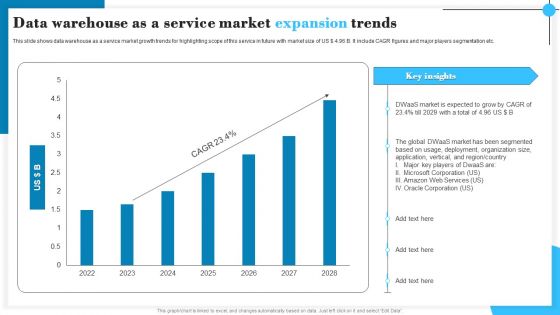
Data Warehouse As A Service Market Expansion Trends Sample PDF
This slide shows data warehouse as a service market growth trends for highlighting scope of this service in future with market size of US 4.96 B. It include CAGR figures and major players segmentation etc. Showcasing this set of slides titled Data Warehouse As A Service Market Expansion Trends Sample PDF. The topics addressed in these templates are Market Is Expected, Organization Size, Deployment. All the content presented in this PPT design is completely editable. Download it and make adjustments in color, background, font etc. as per your unique business setting.
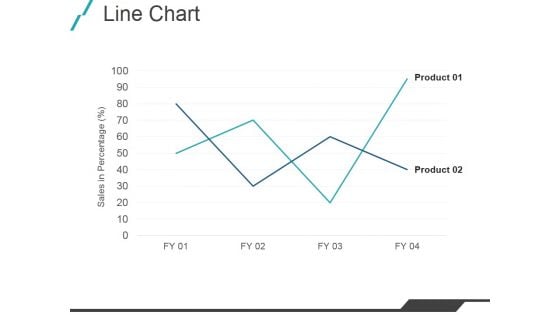
Line Chart Ppt PowerPoint Presentation Model Example File
This is a line chart ppt powerpoint presentation model example file. This is a two stage process. The stages in this process are product, graph, growth, management.
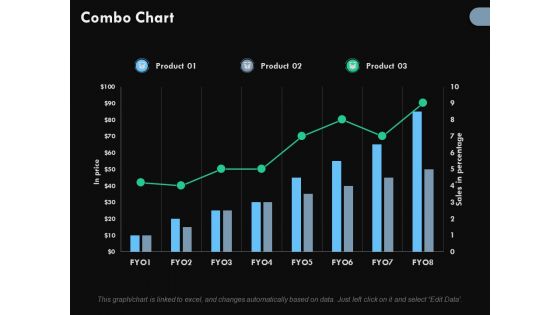
Combo Chart Ppt PowerPoint Presentation Infographic Template Maker
This is a combo chart ppt powerpoint presentation infographic template maker. This is a three stage process. The stages in this process are business, finance, growth, investment, marketing.
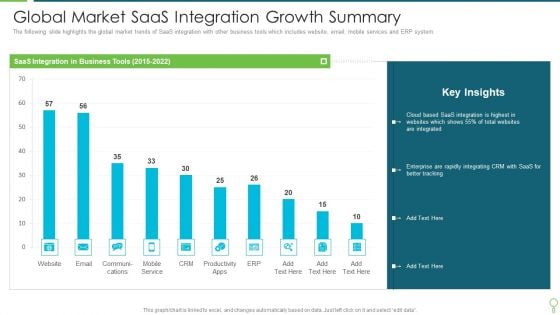
Global Market Saas Integration Growth Summary Slides PDF
The following slide highlights the global market trends of SaaS integration with other business tools which includes website, email, mobile services and ERP system. Showcasing this set of slides titled Global Market Saas Integration Growth Summary Slides PDF. The topics addressed in these templates are Global Market Saas Integration Growth Summary. All the content presented in this PPT design is completely editable. Download it and make adjustments in color, background, font etc. as per your unique business setting.
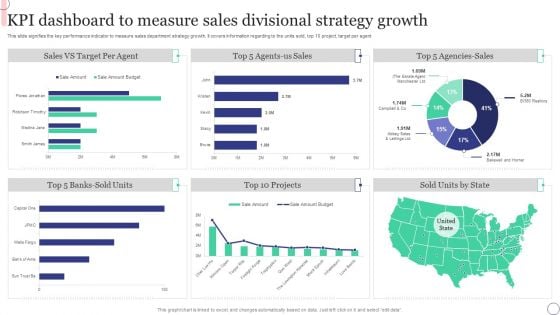
KPI Dashboard To Measure Sales Divisional Strategy Growth Formats PDF
This slide signifies the key performance indicator to measure sales department strategy growth. It covers information regarding to the units sold, top 10 project, target per agent. Showcasing this set of slides titled KPI Dashboard To Measure Sales Divisional Strategy Growth Formats PDF. The topics addressed in these templates are Sales, Target. All the content presented in this PPT design is completely editable. Download it and make adjustments in color, background, font etc. as per your unique business setting.
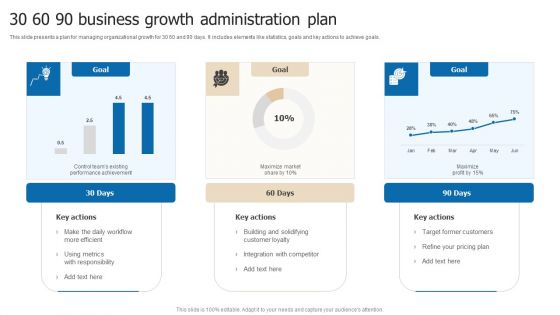
30 60 90 Business Growth Administration Plan Pictures PDF
This slide presents a plan for managing organizational growth for 30 60 and 90 days. It includes elements like statistics, goals and key actions to achieve goals. Showcasing this set of slides titled 30 60 90 Business Growth Administration Plan Pictures PDF. The topics addressed in these templates are Goal, 60 Days, 90 Days. All the content presented in this PPT design is completely editable. Download it and make adjustments in color, background, font etc. as per your unique business setting.
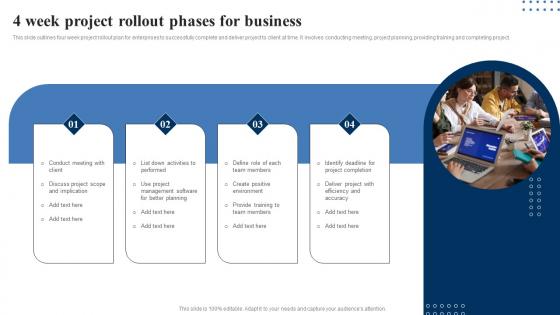
4 Week Project Rollout Phases For Business Slides Pdf
This slide outlines four week project rollout plan for enterprises to successfully complete and deliver project to client at time. It involves conducting meeting, project planning, providing training and completing project.Showcasing this set of slides titled 4 Week Project Rollout Phases For Business Slides Pdf The topics addressed in these templates are Management Software, Positive Environment, Provide Training All the content presented in this PPT design is completely editable. Download it and make adjustments in color, background, font etc. as per your unique business setting. This slide outlines four week project rollout plan for enterprises to successfully complete and deliver project to client at time. It involves conducting meeting, project planning, providing training and completing project.
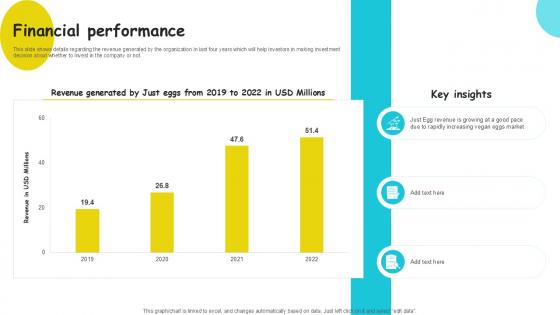
Financial Performance Plant Based Eggs Developing Company Investor PPT Slide
This slide shows details regarding the revenue generated by the organization in last four years which will help investors in making investment decision about whether to invest in the company or not. The Financial Performance Plant Based Eggs Developing Company Investor PPT Slide is a compilation of the most recent design trends as a series of slides. It is suitable for any subject or industry presentation, containing attractive visuals and photo spots for businesses to clearly express their messages. This template contains a variety of slides for the user to input data, such as structures to contrast two elements, bullet points, and slides for written information. Slidegeeks is prepared to create an impression. This slide shows details regarding the revenue generated by the organization in last four years which will help investors in making investment decision about whether to invest in the company or not.
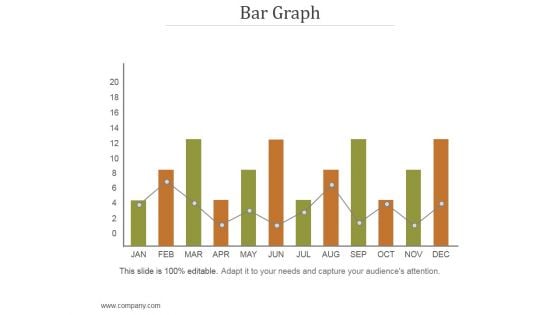
Bar Graph Ppt PowerPoint Presentation Background Images
This is a bar graph ppt powerpoint presentation background images. This is a twelve stage process. The stages in this process are bar graph, months, finance, growth, success.
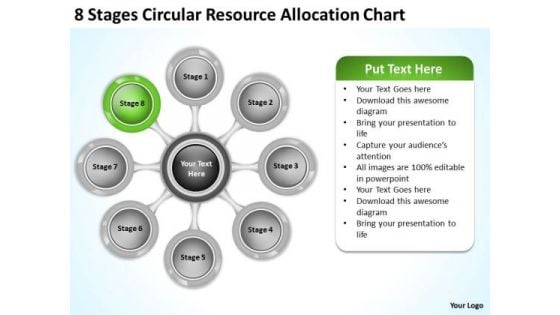
Marketing Concepts 8 Stages Circular Resource Allocation Chart Total
We present our marketing concepts 8 stages circular resource allocation chart total.Download and present our Arrows PowerPoint Templates because Our PowerPoint Templates and Slides offer you the widest possible range of options. Present our Circle Charts PowerPoint Templates because Our PowerPoint Templates and Slides are topically designed to provide an attractive backdrop to any subject. Download and present our Business PowerPoint Templates because Our PowerPoint Templates and Slides are Clear and concise. Use them and dispel any doubts your team may have. Present our Shapes PowerPoint Templates because You can Bait your audience with our PowerPoint Templates and Slides. They will bite the hook of your ideas in large numbers. Download our Process and Flows PowerPoint Templates because Our PowerPoint Templates and Slides will let your ideas bloom. Create a bed of roses for your audience.Use these PowerPoint slides for presentations relating to Chart, Diagram, Graph, Process, Vector, Business, Sequence, Feeds, Iteration, Concept, Rotation, Presentation, Circle, Dynamic, Report, Succession, Cycle, Progression, Iterative, Endless, Direction, Dependency, Production, Phase, Method, Company, Progress, Continuity, Path, Continuous, Arrows. The prominent colors used in the PowerPoint template are Green, Gray, Black. Flaunt it with our Marketing Concepts 8 Stages Circular Resource Allocation Chart Total. Exhibit your ability without a care.
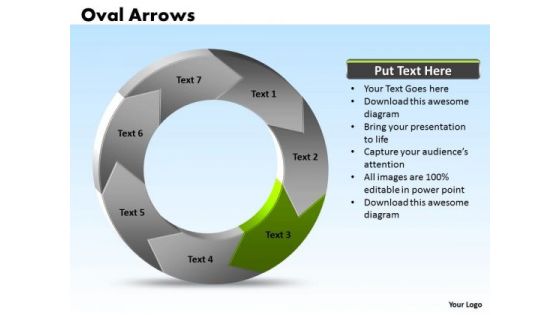
Ppt Oval PowerPoint Presentation Circular Arrows 2007 Factors Templates
PPT oval powerpoint presentation circular arrows 2007 factors Templates-These circular arrows are the tools that helped most of us evolve. Use them to help you organize the logic of your views. The color and design used in this diagram is so attractive that can help you to make your presentation simply stunning.-PPT oval powerpoint presentation circular arrows 2007 factors Templates-Arrow, Background, Beautiful, Blue, Business, Button, Chart, Circle, Circular, Concept, Continous, Continuity, Continuous, Cycle, Diagram, Directional, Divisions, Graph, Icon, Illustration, Isolated, Modern, Multicolored, Presentation, Process, Profit, Progress, Recycle, Red, Research, Round, Segments, Sequence, Set, Sphere, Strategy, Success, Text, Trendy, Wheel Direct people with our Ppt Oval PowerPoint Presentation Circular Arrows 2007 Factors Templates. Download without worries with our money back guaranteee.
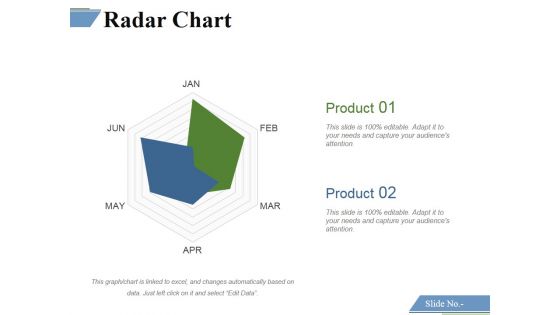
Radar Chart Ppt PowerPoint Presentation Summary Gallery
This is a radar chart ppt powerpoint presentation summary gallery. This is a two stage process. The stages in this process are radar chart, business, marketing, management, strategy.
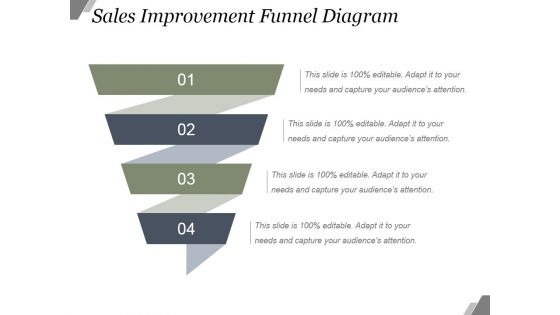
Sales Improvement Funnel Diagram Ppt PowerPoint Presentation Shapes
This is a sales improvement funnel diagram ppt powerpoint presentation shapes. This is a four stage process. The stages in this process are sales, funnel ,marketing, funnel, business.
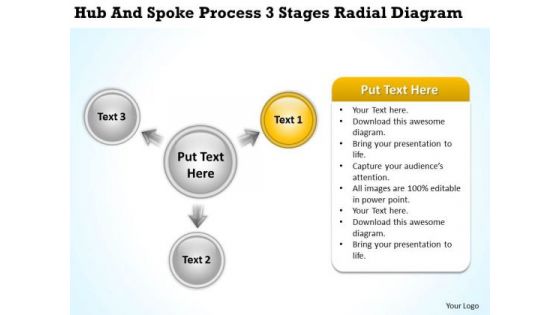
Business Diagram Examples Hub And Spoke Process 3 Stages Radial PowerPoint Templates
We present our business diagram examples hub and spoke process 3 stages radial PowerPoint templates.Download our Communication PowerPoint Templates because It can Bubble and burst with your ideas. Download and present our Business PowerPoint Templates because You can Rise to the occasion with our PowerPoint Templates and Slides. You will bring your audience on their feet in no time. Present our Circle Charts PowerPoint Templates because It can Leverage your style with our PowerPoint Templates and Slides. Charm your audience with your ability. Download and present our Arrows PowerPoint Templates because you should Experience excellence with our PowerPoint Templates and Slides. They will take your breath away. Download our Process and Flows PowerPoint Templates because Our PowerPoint Templates and Slides will bullet point your ideas. See them fall into place one by one.Use these PowerPoint slides for presentations relating to Arrows, Business, Chart, Circle, Company, Concept, Continuity, Continuous, Cycle, Dependency, Diagram, Direction, Dynamic, Endless, Feeds, Graph, Iteration, Iterative, Method, Path, Phase, Presentation, Process, Production, Progress, Progression, Report, Rotation, Sequence, Succession, Vector. The prominent colors used in the PowerPoint template are Yellow, Gray, Black. Despatch your views with the assistance of our Business Diagram Examples Hub And Spoke Process 3 Stages Radial PowerPoint Templates. They will deliver them on the dot.
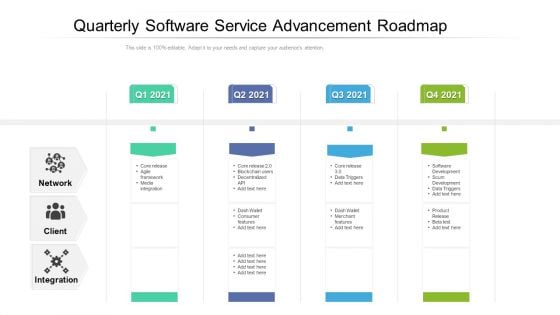
Quarterly Software Service Advancement Roadmap Diagrams
Presenting our jaw dropping quarterly software service advancement roadmap diagrams. You can alternate the color, font size, font type, and shapes of this PPT layout according to your strategic process. This PPT presentation is compatible with Google Slides and is available in both standard screen and widescreen aspect ratios. You can also download this well researched PowerPoint template design in different formats like PDF, JPG, and PNG. So utilize this visually appealing design by clicking the download button given below.
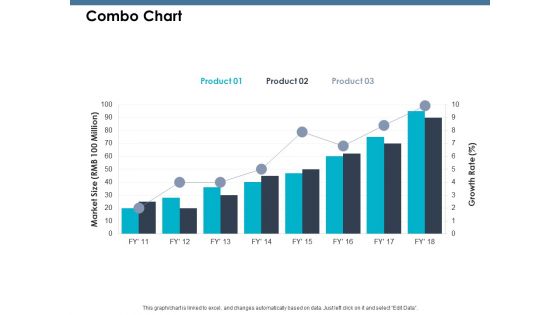
Combo Chart Ppt PowerPoint Presentation Model Grid
This is a combo chart ppt powerpoint presentation model grid. This is a three stage process. The stages in this process are growth, product, percentage, marketing.
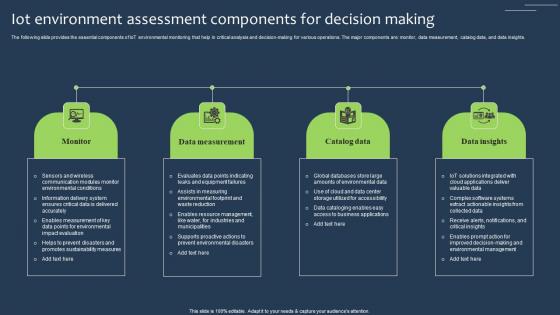
IOT Environment Assessment Components For Decision Making Themes Pdf
The following slide provides the essential components of IoT environmental monitoring that help in critical analysis and decision-making for various operations. The major components are monitor, data measurement, catalog data, and data insights. Pitch your topic with ease and precision using this IOT Environment Assessment Components For Decision Making Themes Pdf This layout presents information on Data Measurement, Catalog Data, Data Insights It is also available for immediate download and adjustment. So, changes can be made in the color, design, graphics or any other component to create a unique layout. The following slide provides the essential components of IoT environmental monitoring that help in critical analysis and decision-making for various operations. The major components are monitor, data measurement, catalog data, and data insights.
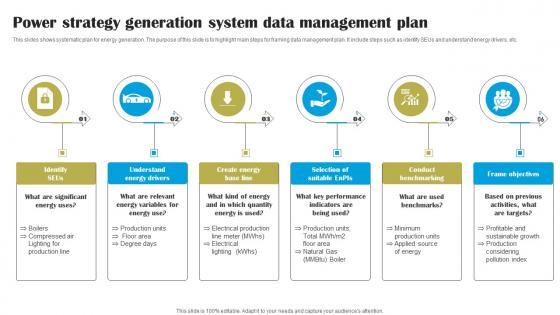
Power Strategy Generation System Data Management Plan Themes Pdf
This slides shows systematic plan for energy generation. The purpose of this slide is to highlight main steps for framing data management plan. It include steps such as identify SEUs and understand energy drivers, etc.Showcasing this set of slides titled Power Strategy Generation System Data Management Plan Themes Pdf The topics addressed in these templates are Conduct Benchmarking, Frame Objectives, Electrical Production All the content presented in this PPT design is completely editable. Download it and make adjustments in color, background, font etc. as per your unique business setting. This slides shows systematic plan for energy generation. The purpose of this slide is to highlight main steps for framing data management plan. It include steps such as identify SEUs and understand energy drivers, etc.
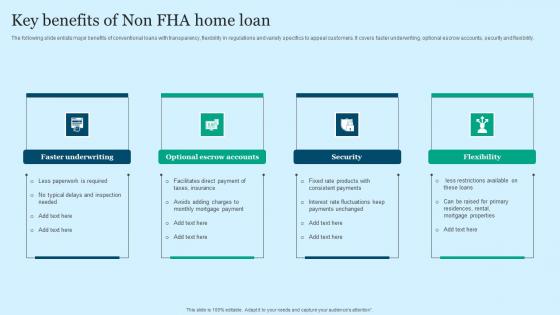
Key Benefits Of Non FHA Home Loan Themes Pdf
The following slide enlists major benefits of conventional loans with transparency, flexibility in regulations and variety specifics to appeal customers. It covers faster underwriting, optional escrow accounts, security and flexibility. Pitch your topic with ease and precision using this Key Benefits Of Non FHA Home Loan Themes Pdf. This layout presents information on Escrow Accounts, Security, Flexibility. It is also available for immediate download and adjustment. So, changes can be made in the color, design, graphics or any other component to create a unique layout. The following slide enlists major benefits of conventional loans with transparency, flexibility in regulations and variety specifics to appeal customers. It covers faster underwriting, optional escrow accounts, security and flexibility.
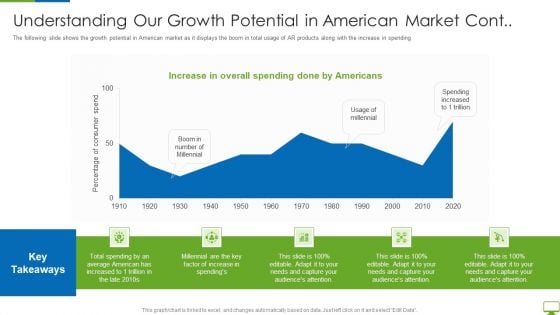
Cyber Network Simulation Platform Capital Funding Pitch Deck Understanding Our Growth Potential Structure PDF
The following slide shows the growth potential in American market as it displays the boom in total usage of AR products along with the increase in spending Deliver an awe inspiring pitch with this creative cyber network simulation platform capital funding pitch deck understanding our growth potential structure pdf bundle. Topics like factor of increase, average american, total spending can be discussed with this completely editable template. It is available for immediate download depending on the needs and requirements of the user.

Line Chart Ppt PowerPoint Presentation Gallery Example Introduction
This is a line chart ppt powerpoint presentation portfolio shapes. This is a two stage process. The stages in this process are product, financial years, line chart.
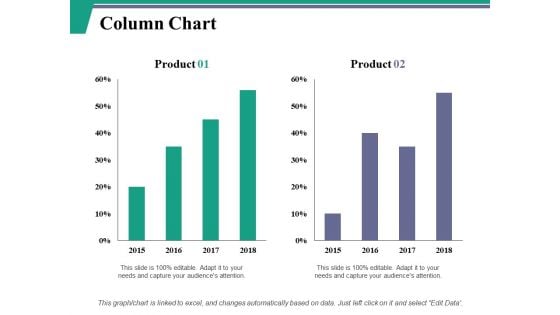
Column Chart Ppt PowerPoint Presentation Model Layout Ideas
This is a column chart ppt powerpoint presentation model layout ideas. This is a two stage process. The stages in this process are product, column chart, bar graph.

Line Chart Ppt PowerPoint Presentation Portfolio File Formats
This is a line chart ppt powerpoint presentation portfolio file formats. This is a two stage process. The stages in this process are product, profit, line chart.
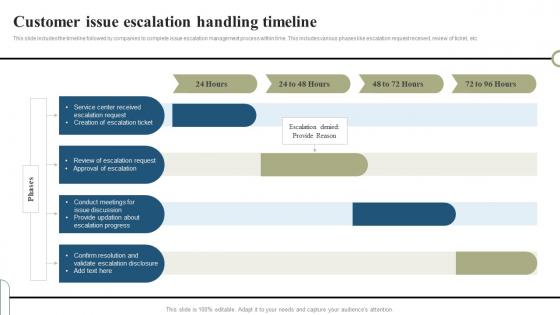
Customer Issue Escalation Handling Timeline Structure Pdf
This slide includes the timeline followed by companies to complete issue escalation management process within time. This includes various phases like escalation request received, review of ticket, etc. Pitch your topic with ease and precision using this Customer Issue Escalation Handling Timeline Structure Pdf This layout presents information on Service Center, Escalation Progress, Customer Issue It is also available for immediate download and adjustment. So, changes can be made in the color, design, graphics or any other component to create a unique layout. This slide includes the timeline followed by companies to complete issue escalation management process within time. This includes various phases like escalation request received, review of ticket, etc.
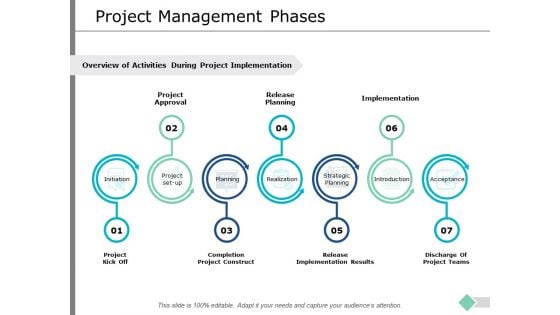
Project Management Phases Ppt PowerPoint Presentation Professional Slideshow
This is a project management phases ppt powerpoint presentation professional slideshow. This is a seven stage process. The stages in this process are initiation, planning, realization, introduction, acceptance.
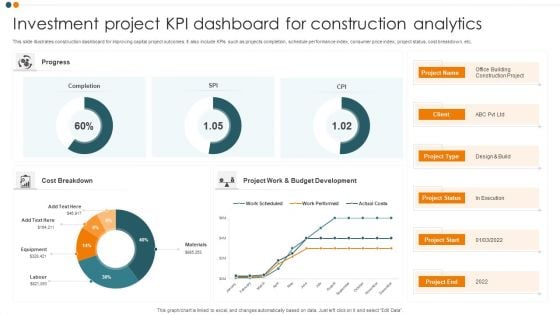
Investment Project KPI Dashboard For Construction Analytics Background PDF
This slide illustrates construction dashboard for improving capital project outcomes. It also include KPIs such as projects completion, schedule performance index, consumer price index, project status, cost breakdown, etc. Pitch your topic with ease and precision using this Investment Project KPI Dashboard For Construction Analytics Background PDF. This layout presents information on Cost Breakdown, Completion, Progress. It is also available for immediate download and adjustment. So, changes can be made in the color, design, graphics or any other component to create a unique layout.
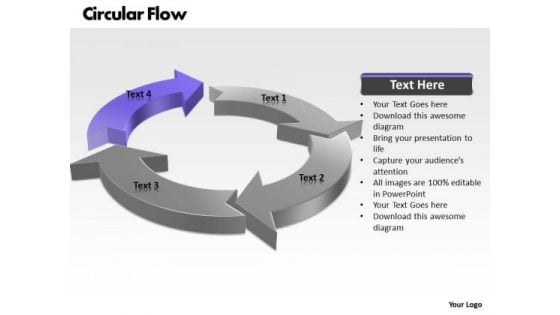
Ppt Circular Flow Of Change Management Process PowerPoint Presentation 4 Stages Templates
PPT circular flow of change management process powerpoint presentation 4 stages Templates-This diagram can be used to show reinforcing factors and loops. This diagram is a useful captivating tool conceived to enable you to define your message in your consulting, strategic and management PPT presentations.-PPT circular flow of change management process powerpoint presentation 4 stages Templates-Arrow, Chart, Circle, Circular, Circulation, Collection, Concept, Connection, Continuity, Cursor, Cycle, Cyclic, Diagram, Direction, Flow, Flowchart, Graph, Graphic, Group, Icon, Motion, Movement, Process, Progress, Recycle, Recycling, Refresh, Reload, Renew, Repetition, Return, Reuse, Ring, Rotation, Round, Sign, Six, Symbol Counsel wisely with our Ppt Circular Flow Of Change Management Process PowerPoint Presentation 4 Stages Templates. Bring all your acumen into play.
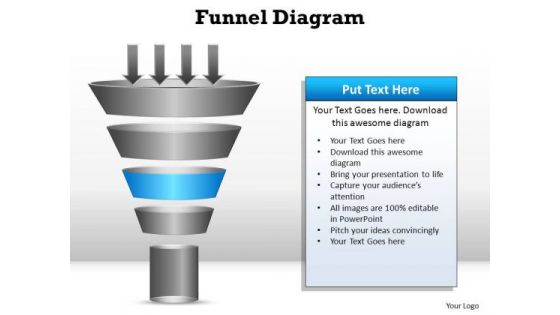
PowerPoint Templates Success Funnel Diagram Ppt Backgrounds
PowerPoint Templates Success Funnel Diagram PPT Backgrounds--These amazing PowerPoint pre-designed slides and PowerPoint templates have been carefully created by our team of experts to help you impress your audience. Our stunning collection of Powerpoint slides are 100% editable and can easily fit in any PowerPoint presentations. By using these animations and graphics in PowerPoint and you can easily make professional presentations. Any text can be entered at any point in the PowerPoint template or slide. Just DOWNLOAD our awesome PowerPoint templates and you are ready to go. Our PowerPoint Templates Success Funnel Diagram Ppt Backgrounds believe in being consistent. The are designed to maintain a standard.
Production Growth Of Semiconductor Industry Stats Microsoft PDF
This slide covers the gross value added contribution of semiconductors industry into GDP over the last three years. It also shows growing period of the industry continuously. Showcasing this set of slides titled Production Growth Of Semiconductor Industry Stats Microsoft PDF. The topics addressed in these templates are Manufacturing, Average Rate. All the content presented in this PPT design is completely editable. Download it and make adjustments in color, background, font etc. as per your unique business setting.

Pyramid Guidelines Diagram To Increase Product Sales Structure PDF
The slide highlights a diagram of pyramid principle to increase product sales and business growth. It includes key elements like business objective, arguments and supporting facts. Showcasing this set of slides titled Pyramid Guidelines Diagram To Increase Product Sales Structure PDF. The topics addressed in these templates are Arguments, Data Supporting Arguments. All the content presented in this PPT design is completely editable. Download it and make adjustments in color, background, font etc. as per your unique business setting.
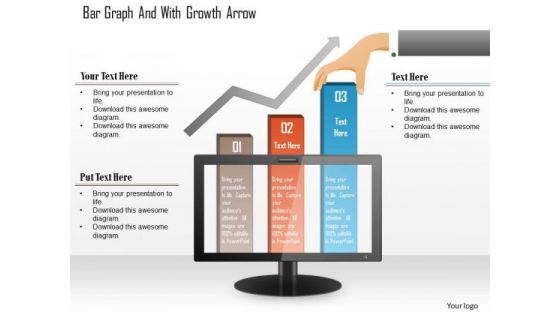
Business Diagram Bar Graph And With Growth Arrow Presentation Template
Our above diagram slide displays bar graph graph that shows relationships between different data series. Use this diagram in your presentations to get good remarks from your viewers.
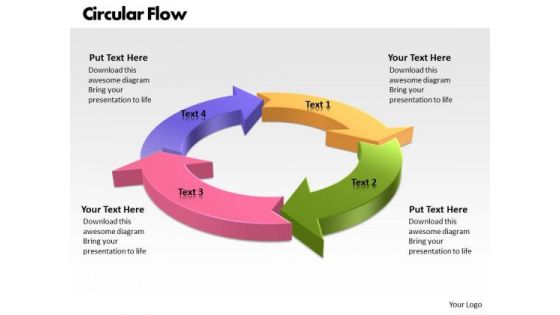
Ppt Circular Flow Free PowerPoint Template 4 State Templates
PPT circular flow free powerpoint template 4 state Templates-The above template displays a circular flow diagram is in the shape of a circle because all of the components work together and without one it would not function. Our beautiful image makes your presentations simpler showing that you care about even the smallest details.-PPT circular flow free powerpoint template 4 state Templates-Arrow, Chart, Circle, Circular, Circulation, Collection, Concept, Connection, Continuity, Cursor, Cycle, Cyclic, Diagram, Direction, Flow, Flowchart, Graph, Graphic, Group, Icon, Motion, Movement, Process, Progress, Recycle, Recycling, Refresh, Reload, Renew, Repetition, Return, Reuse, Ring, Rotation, Round, Sign, Six, Symbol Feel free to air your views. Get that allowance with our Ppt Circular Flow Free PowerPoint Template 4 State Templates.
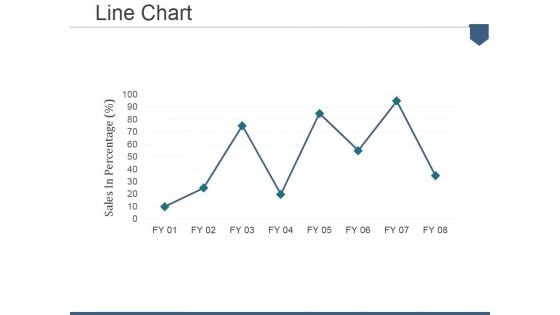
Line Chart Ppt PowerPoint Presentation Summary Portfolio
This is a line chart ppt powerpoint presentation summary portfolio. This is a eight stage process. The stages in this process are finance, planning, management, business, process, strategy.
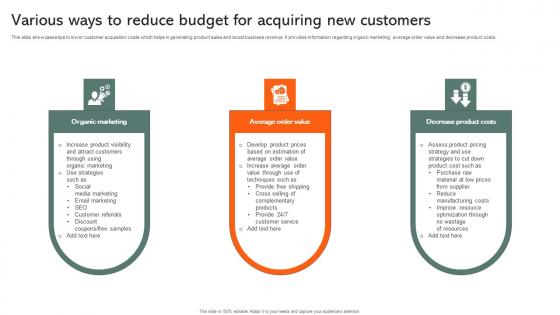
Various Ways To Reduce Budget For Acquiring New Customers Themes Pdf
This slide showcases tips to lower customer acquisition costs which helps in generating product sales and boost business revenue. It provides information regarding organic marketing, average order value and decrease product costs. Pitch your topic with ease and precision using this Various Ways To Reduce Budget For Acquiring New Customers Themes Pdf. This layout presents information on Organic Marketing, Average Order Value, Decrease Product Costs. It is also available for immediate download and adjustment. So, changes can be made in the color, design, graphics or any other component to create a unique layout. This slide showcases tips to lower customer acquisition costs which helps in generating product sales and boost business revenue. It provides information regarding organic marketing, average order value and decrease product costs.
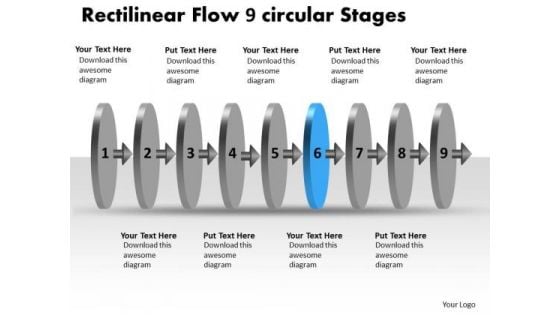
Rectilinear Flow 9 Circular Stages Flowchart PowerPoint Templates
We present our rectilinear flow 9 circular stages flowchart PowerPoint templates.Use our Circle Charts PowerPoint Templates because,you can outline your targets to your team. Use our Arrows PowerPoint Templates because,This slide is Designed to help bullet-point your views and thoughts. Use our Design PowerPoint Templates because,It shows to your group how they mesh together to drive the whole. Use our Shapes PowerPoint Templates because,This slide represents the Tools of the Trade. Use our Process and Flows PowerPoint Templates because,You can Show them the way, be Captain of the ship and lead them to new shores.Use these PowerPoint slides for presentations relating to abstract, arrow, blank, business, chart, circular, circulation, concept, conceptual, design, diagram, executive, flow, icon, idea, illustration, linear, management, model, numbers, organization, procedure, process, progression, resource, sequence, sequential, stages, steps, strategy. The prominent colors used in the PowerPoint template are Yellow, Gray, Black Help the audience digest your thoughts. Our Rectilinear Flow 9 Circular Stages Flowchart PowerPoint Templates give you the facility.
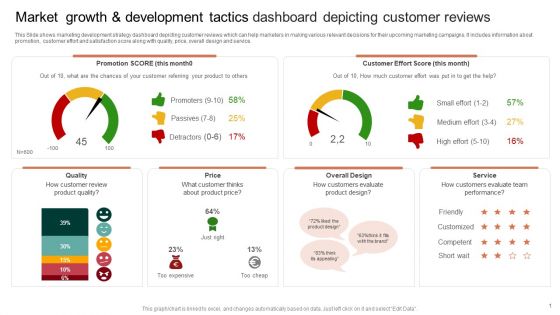
Market Growth And Development Tactics Dashboard Depicting Customer Reviews Pictures PDF
This Slide shows marketing development strategy dashboard depicting customer reviews which can help marketers in making various relevant decisions for their upcoming marketing campaigns. It includes information about promotion, customer effort and satisfaction score along with quality, price, overall design and service. Showcasing this set of slides titled Market Growth And Development Tactics Dashboard Depicting Customer Reviews Pictures PDF. The topics addressed in these templates are Product Price, Product Quality, Overall Design. All the content presented in this PPT design is completely editable. Download it and make adjustments in color, background, font etc. as per your unique business setting.
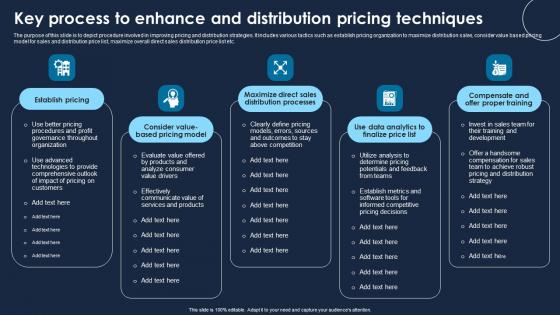
Key Process To Enhance And Distribution Pricing Techniques Diagrams Pdf
The purpose of this slide is to depict procedure involved in improving pricing and distribution strategies. It includes various tactics such as establish pricing organization to maximize distribution sales, consider value based pricing model for sales and distribution price list, maximize overall direct sales distribution price list etc. Showcasing this set of slides titled Key Process To Enhance And Distribution Pricing Techniques Diagrams Pdf The topics addressed in these templates are Establish Pricing, Distribution Processes, Data Analytics All the content presented in this PPT design is completely editable. Download it and make adjustments in color, background, font etc. as per your unique business setting. The purpose of this slide is to depict procedure involved in improving pricing and distribution strategies. It includes various tactics such as establish pricing organization to maximize distribution sales, consider value based pricing model for sales and distribution price list, maximize overall direct sales distribution price list etc.

Column Chart Ppt PowerPoint Presentation Model Design Inspiration
This is a column chart ppt powerpoint presentation model design inspiration. This is a three stage process. The stages in this process are business, marketing, bar, graph, plan.
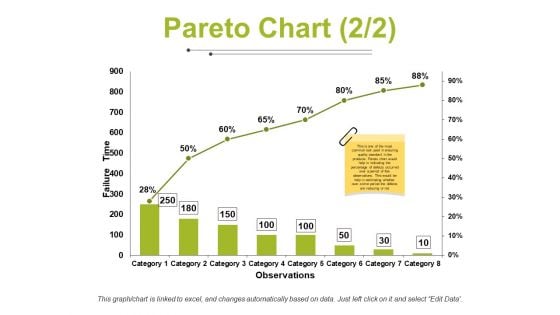
Pareto Chart Template 2 Ppt PowerPoint Presentation Gallery Microsoft
This is a pareto chart template 2 ppt powerpoint presentation gallery microsoft. This is a eight stage process. The stages in this process are failure time, observations, category.
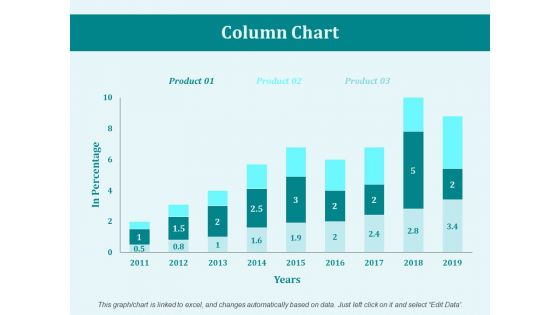
Column Chart Marketing Ppt PowerPoint Presentation Summary Images
This is a column chart marketing ppt powerpoint presentation summary images. This is a three stage process. The stages in this process are business, management, marketing, product, percentage.
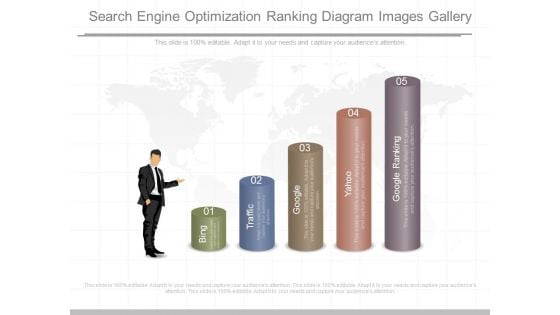
Search Engine Optimization Ranking Diagram Images Gallery
This is a search engine optimization ranking diagram images gallery. This is a five stage process. The stages in this process are bing, traffic, google, yahoo, google ranking.
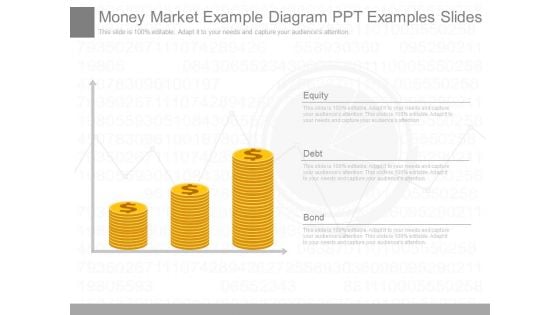
Money Market Example Diagram Ppt Examples Slides
This is a money market example diagram ppt examples slides. This is a three stage process. The stages in this process are equity, debt, bond.
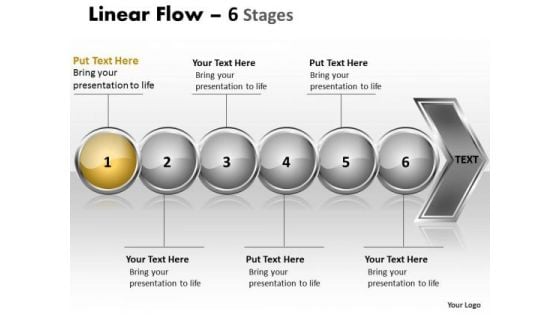
Business Ppt Continuous Illustration Of 6 Issues Strategy PowerPoint 2 Design
We present our Business PPT continuous illustration of 6 issues strategy PowerPoint 2 design. Use our Spheres PowerPoint Templates because; emphasize the process of your business/corporate growth. Use our Business PowerPoint Templates because, Marketing Strategy Business Template: - Maximizing sales of your product is the intended destination. Use our Arrows PowerPoint Templates because; Use our templates to emphasize your views. Use our Symbol PowerPoint Templates because, Many a core idea has various enveloping layers. Use our Process and Flows PowerPoint Templates because; Use our templates to illustrate your ability. Use these PowerPoint slides for presentations relating to Abstract, Arrow, Blank, Business, Chart, Circular, Circulation, Concept, Conceptual, Design, Diagram, Executive, Icon, Idea, Illustration, Linear, Flow, Management, Model, Numbers, Organization, Procedure, Process, Progression, Resource, Sequence, Sequential, Stages, Steps, Strategy. The prominent colors used in the PowerPoint template are Yellow, Gray, and Black You are fastidious with your choices. Our Business Ppt Continuous Illustration Of 6 Issues Strategy PowerPoint 2 Design will certainly catch your fancy.
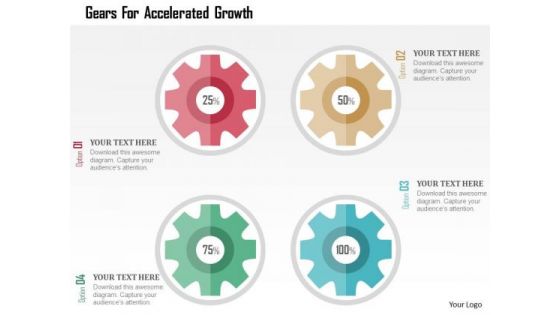
Business Diagram Gears For Accelerated Growth Presentation Template
This business slide displays graphics of gears. Download this diagram to display information in visual manner. This template is innovatively designed to highlight your worthy views

Ppt Representation Of Circular Procedure 7 State Diagram PowerPoint Templates
PPT representation of circular procedure 7 state diagram PowerPoint Templates-The above template displays a circular diagram. Use this diagram to define steps in a process. It can help you to make a great illustration within your presentation.-PPT representation of circular procedure 7 state diagram PowerPoint Templates-Arrow, Chart, Circular Procedure, Color, Colorful, Connect, Connection, Design, Diagram, Finance, Graphic, Group, Growth, Icon, Illustration, Marketing, Pieces, Process, Recycle, Recycling, Round, Set, Strategy, Symbol, Wheel Display your faith in your team with our Ppt Representation Of Circular Procedure 7 State Diagram PowerPoint Templates. Demonstrate your strong belief in them.
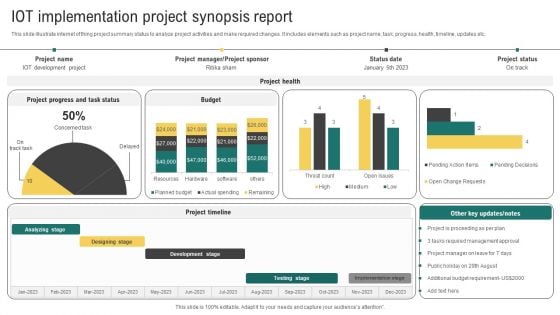
IOT Implementation Project Synopsis Report Summary PDF
This slide illustrate internet of thing project summary status to analyze project activities and make required changes. It includes elements such as project name, task, progress, health, timeline, updates etc. Pitch your topic with ease and precision using this IOT Implementation Project Synopsis Report Summary PDF. This layout presents information on Development Stage, Testing Stage, Implementation Stage. It is also available for immediate download and adjustment. So, changes can be made in the color, design, graphics or any other component to create a unique layout.
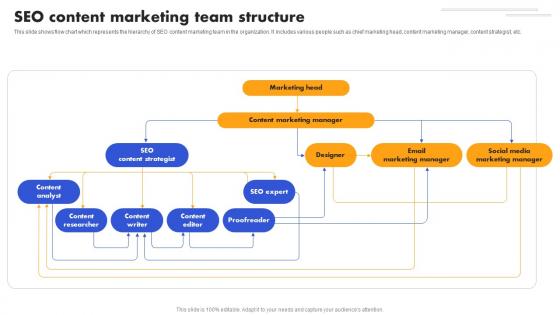
SEO Strategy To Improve SEO Content Marketing Team Structure Strategy SS V
This slide shows flow chart which represents the hierarchy of SEO content marketing team in the organization. It includes various people such as chief marketing head, content marketing manager, content strategist, etc. Present like a pro with SEO Strategy To Improve SEO Content Marketing Team Structure Strategy SS V. Create beautiful presentations together with your team, using our easy-to-use presentation slides. Share your ideas in real-time and make changes on the fly by downloading our templates. So whether you are in the office, on the go, or in a remote location, you can stay in sync with your team and present your ideas with confidence. With Slidegeeks presentation got a whole lot easier. Grab these presentations today. This slide shows flow chart which represents the hierarchy of SEO content marketing team in the organization. It includes various people such as chief marketing head, content marketing manager, content strategist, etc.

Sales Training KPI Dashboard For Improving Skills Portrait PDF
The following slide depicts the sales training assessment to work upon the areas need improvement. It also includes current status, goals along with training basis, index and scores.Showcasing this set of slides titled Sales Training KPI Dashboard For Improving Skills Portrait PDF The topics addressed in these templates are Acquisition Process, Sales Presentation, Customer Relationship Management All the content presented in this PPT design is completely editable. Download it and make adjustments in color, background, font etc. as per your unique business setting.
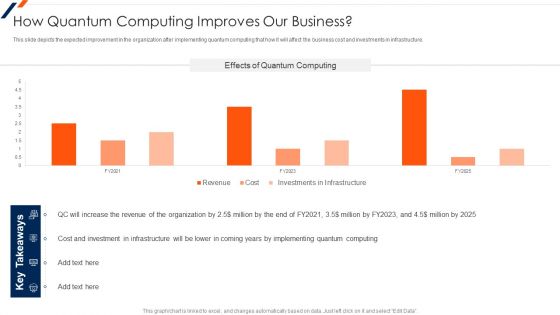
Quantum Computing How Quantum Computing Improves Our Business Download PDF
This slide depicts the expected improvement in the organization after implementing quantum computing that how it will affect the business cost and investments in infrastructure. Deliver and pitch your topic in the best possible manner with this Quantum Computing How Quantum Computing Improves Our Business Download PDF. Use them to share invaluable insights on Revenue, Cost And Investment, Quantum Computing and impress your audience. This template can be altered and modified as per your expectations. So, grab it now.
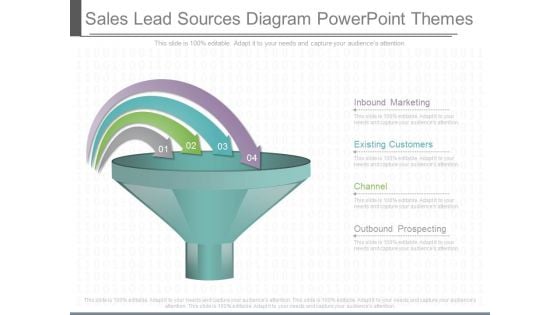
Sales Lead Sources Diagram Powerpoint Themes
This is a sales lead sources diagram powerpoint themes. This is a four stage process. The stages in this process are inbound marketing, existing customers, channel, outbound prospecting.
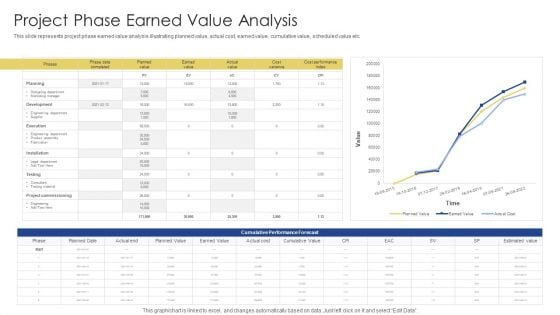
Project Phase Earned Value Analysis Ppt PowerPoint Presentation Gallery Infographics PDF
This slide represents project phase earned value analysis illustrating planned value, actual cost, earned value, cumulative value, scheduled value etc. Showcasing this set of slides titled Project Phase Earned Value Analysis Ppt PowerPoint Presentation Gallery Infographics PDF. The topics addressed in these templates are Cumulative Performance Forecast, Planning, Development. All the content presented in this PPT design is completely editable. Download it and make adjustments in color, background, font etc. as per your unique business setting.
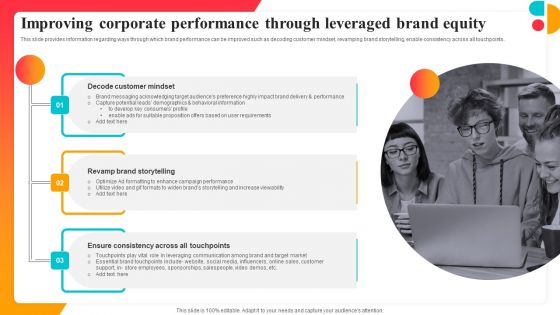
Improving Corporate Performance Through Leveraged Brand Equity Diagrams PDF
This slide provides information regarding ways through which brand performance can be improved such as decoding customer mindset, revamping brand storytelling, enable consistency across all touchpoints. Present like a pro with Improving Corporate Performance Through Leveraged Brand Equity Diagrams PDF Create beautiful presentations together with your team, using our easy to use presentation slides. Share your ideas in real time and make changes on the fly by downloading our templates. So whether you are in the office, on the go, or in a remote location, you can stay in sync with your team and present your ideas with confidence. With Slidegeeks presentation got a whole lot easier. Grab these presentations today.
Dollar Profits Growth PowerPoint Templates And PowerPoint Themes 1012
Deliver amazing Presentations with our above template showing profit and growth bar graph. Adjust the above image in your PPT presentations to visually support your content in your Business PPT slideshows marketing, finance, success and strategy. Deliver amazing presentations to mesmerize your audience. Get ahead despite fierce competition. Accelerate away from the pack with our Dollar Profits Growth PowerPoint Templates And PowerPoint Themes 1012.
Delivery Excellence Chart With Revenue Growth Ppt PowerPoint Presentation Model Layouts PDF
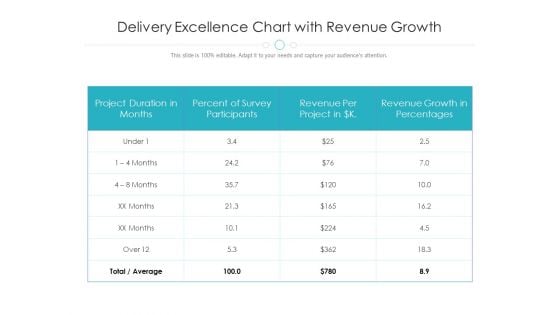
Pitch your topic with ease and precision using this delivery excellence chart with revenue growth ppt powerpoint presentation model layouts pdf. This layout presents information on percent of survey participants, project duration in months, revenue growth in percentages. It is also available for immediate download and adjustment. So, changes can be made in the color, design, graphics or any other component to create a unique layout.
Intelligent Infrastructure Addressing Cyber Risk Management Dashboard Formats PDF
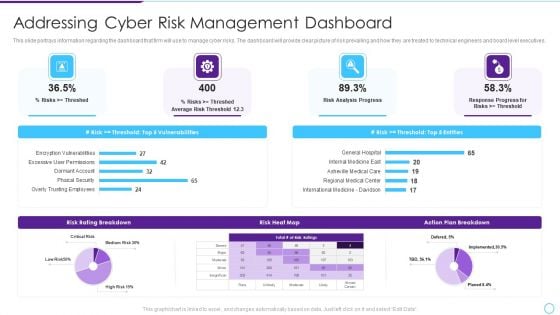
This slide portrays information regarding the dashboard that firm will use to manage cyber risks. The dashboard will provide clear picture of risk prevailing and how they are treated to technical engineers and board level executives. Deliver and pitch your topic in the best possible manner with this Intelligent Infrastructure Addressing Cyber Risk Management Dashboard Formats PDF. Use them to share invaluable insights on Risk Analysis Progress, Risk Rating Breakdown, Risk Heat Map, Action Plan Breakdown and impress your audience. This template can be altered and modified as per your expectations. So, grab it now.
Digital Marketing KPI Dashboard With Conversion And Bounce Rate Introduction PDF
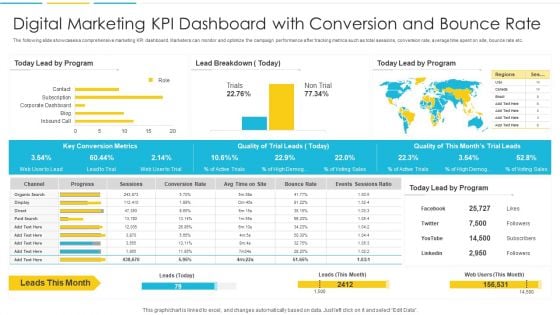
The following slide showcases a comprehensive marketing KPI dashboard. Marketers can monitor and optimize the campaign performance after tracking metrics such as total sessions, conversion rate, average time spent on site, bounce rate etc. Pitch your topic with ease and precision using this Digital Marketing KPI Dashboard With Conversion And Bounce Rate Introduction PDF. This layout presents information on Organic, Progress, Conversion Rate. It is also available for immediate download and adjustment. So, changes can be made in the color, design, graphics or any other component to create a unique layout
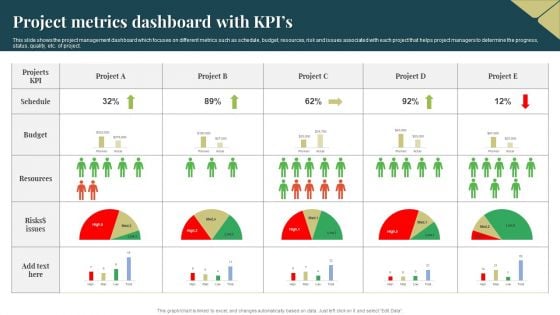
Project Metrics Dashboard With Kpis Ideas PDF
This slide shows the project management dashboard which focuses on different metrics such as schedule, budget, resources, risk and issues associated with each project that helps project managers to determine the progress, status, quality, etc. of project. Pitch your topic with ease and precision using this Project Metrics Dashboard With Kpis Ideas PDF. This layout presents information on Resources, Budget, Risks. It is also available for immediate download and adjustment. So, changes can be made in the color, design, graphics or any other component to create a unique layout.


 Continue with Email

 Home
Home


