Index
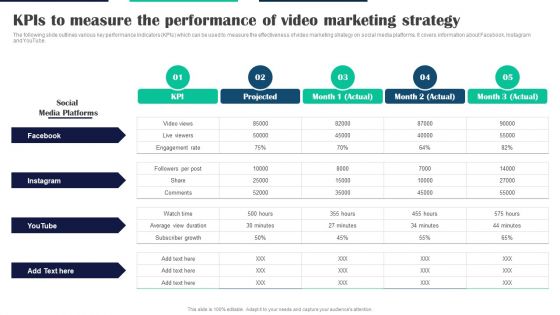
Executing Video Promotional Kpis To Measure The Performance Of Video Marketing Strategy Inspiration PDF
The following slide outlines various key performance indicators KPIs which can be used to measure the effectiveness of video marketing strategy on social media platforms. It covers information about Facebook, Instagram and YouTube. This modern and well-arranged Executing Video Promotional Kpis To Measure The Performance Of Video Marketing Strategy Inspiration PDF provides lots of creative possibilities. It is very simple to customize and edit with the Powerpoint Software. Just drag and drop your pictures into the shapes. All facets of this template can be edited with Powerpoint, no extra software is necessary. Add your own material, put your images in the places assigned for them, adjust the colors, and then you can show your slides to the world, with an animated slide included.
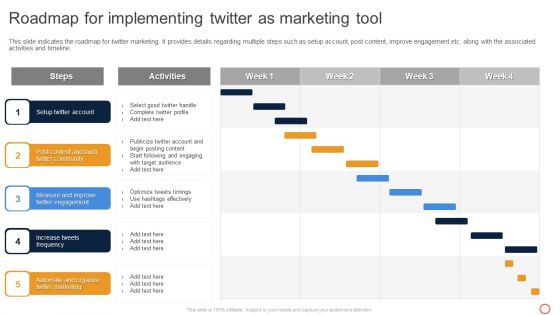
Leveraging Twitter For Social Roadmap For Implementing Twitter As Marketing Tool Demonstration PDF
This slide indicates the roadmap for twitter marketing. It provides details regarding multiple steps such as setup account, post content, improve engagement etc. along with the associated activities and timeline. This modern and well-arranged Leveraging Twitter For Social Roadmap For Implementing Twitter As Marketing Tool Demonstration PDF provides lots of creative possibilities. It is very simple to customize and edit with the Powerpoint Software. Just drag and drop your pictures into the shapes. All facets of this template can be edited with Powerpoint, no extra software is necessary. Add your own material, put your images in the places assigned for them, adjust the colors, and then you can show your slides to the world, with an animated slide included.
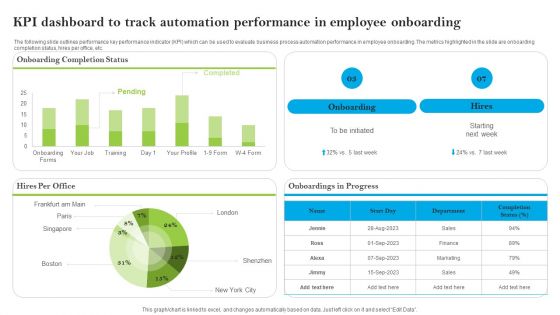
Introducing AI Tools KPI Dashboard To Track Automation Performance In Employee Formats PDF
The following slide outlines performance key performance indicator KPI which can be used to evaluate business process automation performance in employee onboarding. The metrics highlighted in the slide are onboarding completion status, hires per office, etc. This modern and well-arranged Introducing AI Tools KPI Dashboard To Track Automation Performance In Employee Formats PDF provides lots of creative possibilities. It is very simple to customize and edit with the Powerpoint Software. Just drag and drop your pictures into the shapes. All facets of this template can be edited with Powerpoint, no extra software is necessary. Add your own material, put your images in the places assigned for them, adjust the colors, and then you can show your slides to the world, with an animated slide included.
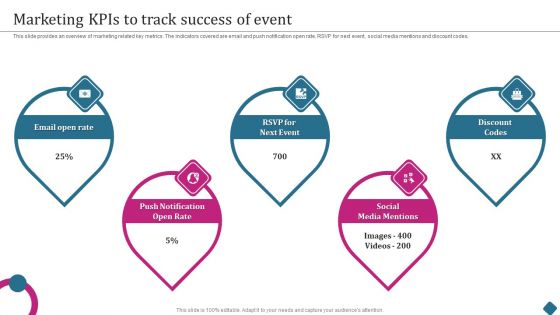
Smart Phone Launch Event Management Tasks Marketing Kpis To Track Success Of Event Information PDF
This slide provides an overview of marketing related key metrics. The indicators covered are email and push notification open rate, RSVP for next event, social media mentions and discount codes. This modern and well arranged Smart Phone Launch Event Management Tasks Marketing Kpis To Track Success Of Event Information PDF provides lots of creative possibilities. It is very simple to customize and edit with the Powerpoint Software. Just drag and drop your pictures into the shapes. All facets of this template can be edited with Powerpoint no extra software is necessary. Add your own material, put your images in the places assigned for them, adjust the colors, and then you can show your slides to the world, with an animated slide included.
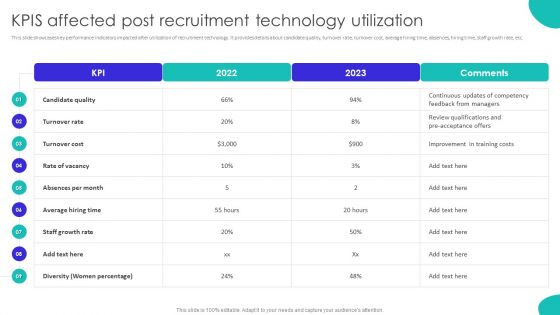
Improving Technology Based Kpis Affected Post Recruitment Technology Utilization Information PDF
This slide showcases key performance indicators impacted after utilization of recruitment technology. It provides details about candidate quality, turnover rate, turnover cost, average hiring time, absences, hiring time, staff growth rate, etc. This modern and well-arranged Improving Technology Based Kpis Affected Post Recruitment Technology Utilization Information PDF provides lots of creative possibilities. It is very simple to customize and edit with the Powerpoint Software. Just drag and drop your pictures into the shapes. All facets of this template can be edited with Powerpoint, no extra software is necessary. Add your own material, put your images in the places assigned for them, adjust the colors, and then you can show your slides to the world, with an animated slide included.
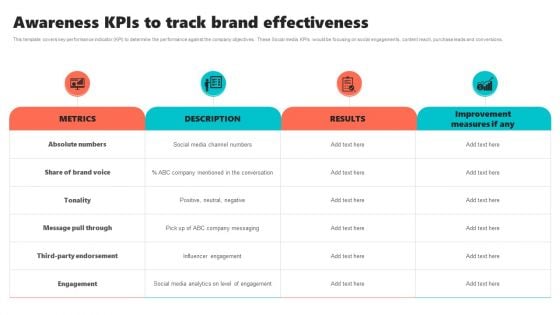
New Brand Introduction Plan Awareness Kpis To Track Brand Effectiveness Clipart PDF
This template covers key performance indicator KPI to determine the performance against the company objectives. These Social media KPIs would be focusing on social engagements, content reach, purchase leads and conversions. This modern and well-arranged New Brand Introduction Plan Awareness Kpis To Track Brand Effectiveness Clipart PDF provides lots of creative possibilities. It is very simple to customize and edit with the Powerpoint Software. Just drag and drop your pictures into the shapes. All facets of this template can be edited with Powerpoint no extra software is necessary. Add your own material, put your images in the places assigned for them, adjust the colors, and then you can show your slides to the world, with an animated slide included.
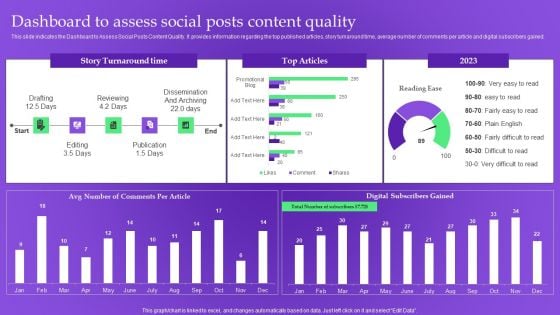
Analysis Plan For E Commerce Promotion Tactics Dashboard To Assess Social Posts Content Quality Sample PDF
This slide indicates the Dashboard to Assess Social Posts Content Quality. It provides information regarding the top published articles, story turnaround time, average number of comments per article and digital subscribers gained. This modern and well arranged Analysis Plan For E Commerce Promotion Tactics Dashboard To Assess Social Posts Content Quality Sample PDF provides lots of creative possibilities. It is very simple to customize and edit with the Powerpoint Software. Just drag and drop your pictures into the shapes. All facets of this template can be edited with Powerpoint no extra software is necessary. Add your own material, put your images in the places assigned for them, adjust the colors, and then you can show your slides to the world, with an animated slide included.
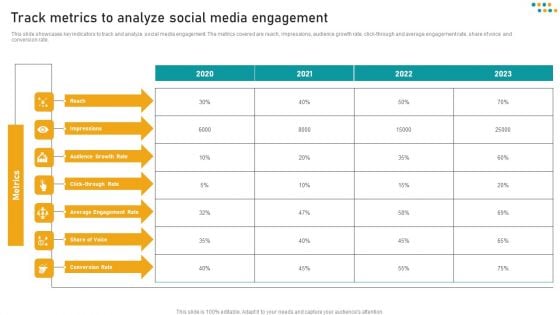
E Commerce Business Track Metrics To Analyze Social Media Engagement Professional PDF
This slide showcases key indicators to track and analyze social media engagement. The metrics covered are reach, impressions, audience growth rate, click-through and average engagement rate, share of voice and conversion rate. This modern and well-arranged E Commerce Business Track Metrics To Analyze Social Media Engagement Professional PDF provides lots of creative possibilities. It is very simple to customize and edit with the Powerpoint Software. Just drag and drop your pictures into the shapes. All facets of this template can be edited with Powerpoint, no extra software is necessary. Add your own material, put your images in the places assigned for them, adjust the colors, and then you can show your slides to the world, with an animated slide included.
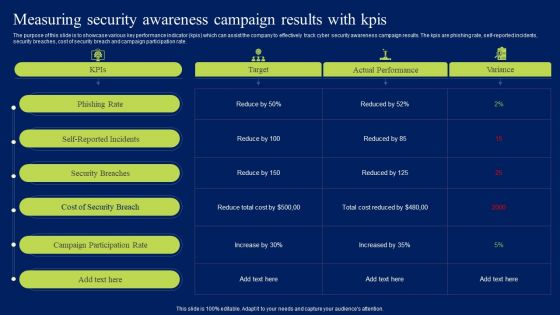
Measuring Security Awareness Campaign Results With Kpis Ppt Summary Sample PDF
The purpose of this slide is to showcase various key performance indicator kpis which can assist the company to effectively track cyber security awareness campaign results. The kpis are phishing rate, self-reported incidents, security breaches, cost of security breach and campaign participation rate. This modern and well-arranged Measuring Security Awareness Campaign Results With Kpis Ppt Summary Sample PDF provides lots of creative possibilities. It is very simple to customize and edit with the Powerpoint Software. Just drag and drop your pictures into the shapes. All facets of this template can be edited with Powerpoint, no extra software is necessary. Add your own material, put your images in the places assigned for them, adjust the colors, and then you can show your slides to the world, with an animated slide included.
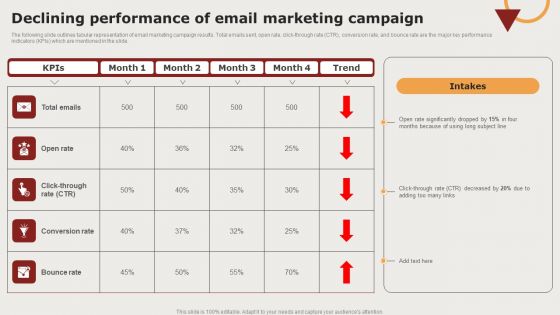
Creating Positioning Techniques For Market Research Declining Performance Of Email Marketing Campaign Rules PDF
The following slide outlines tabular representation of email marketing campaign results. Total emails sent, open rate, click-through rate CTR, conversion rate, and bounce rate are the major key performance indicators KPIs which are mentioned in the slide. This modern and well arranged Creating Positioning Techniques For Market Research Declining Performance Of Email Marketing Campaign Rules PDF provides lots of creative possibilities. It is very simple to customize and edit with the Powerpoint Software. Just drag and drop your pictures into the shapes. All facets of this template can be edited with Powerpoint no extra software is necessary. Add your own material, put your images in the places assigned for them, adjust the colors, and then you can show your slides to the world, with an animated slide included.
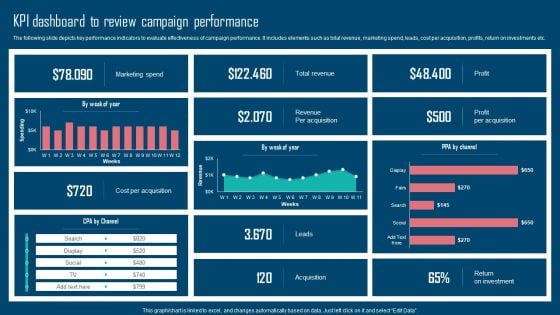
Adopting IMC Technique To Boost Brand Recognition Kpi Dashboard To Review Campaign Performance Pictures PDF
The following slide depicts key performance indicators to evaluate effectiveness of campaign performance. It includes elements such as total revenue, marketing spend, leads, cost per acquisition, profits, return on investments etc. This modern and well arranged Adopting IMC Technique To Boost Brand Recognition Kpi Dashboard To Review Campaign Performance Pictures PDF provides lots of creative possibilities. It is very simple to customize and edit with the Powerpoint Software. Just drag and drop your pictures into the shapes. All facets of this template can be edited with Powerpoint no extra software is necessary. Add your own material, put your images in the places assigned for them, adjust the colors, and then you can show your slides to the world, with an animated slide included.
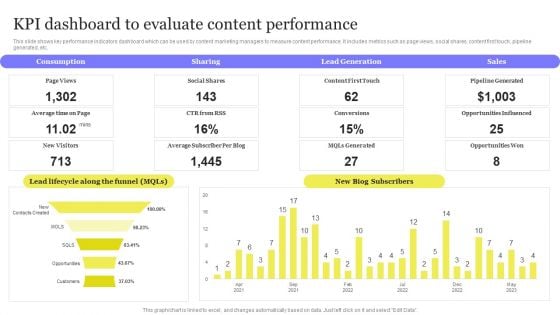
Enhancing Digital Visibility Using SEO Content Strategy KPI Dashboard To Evaluate Content Performance Diagrams PDF
This slide shows key performance indicators dashboard which can be used by content marketing managers to measure content performance. It includes metrics such as page views, social shares, content first touch, pipeline generated, etc. This modern and well arranged Enhancing Digital Visibility Using SEO Content Strategy KPI Dashboard To Evaluate Content Performance Diagrams PDF provides lots of creative possibilities. It is very simple to customize and edit with the Powerpoint Software. Just drag and drop your pictures into the shapes. All facets of this template can be edited with Powerpoint no extra software is necessary. Add your own material, put your images in the places assigned for them, adjust the colors, and then you can show your slides to the world, with an animated slide included.
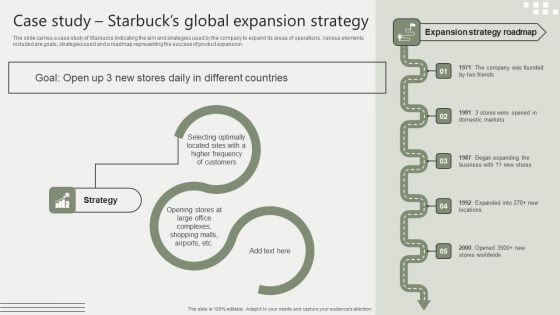
Global Business Market Development Guide Case Study Starbucks Global Expansion Strategy Diagrams PDF
The slide carries a case study of Starbucks indicating the aim and strategies used by the company to expand its areas of operations. Various elements included are goals, strategies used and a roadmap representing the success of product expansion This modern and well arranged Global Business Market Development Guide Case Study Starbucks Global Expansion Strategy Diagrams PDF provides lots of creative possibilities. It is very simple to customize and edit with the Powerpoint Software. Just drag and drop your pictures into the shapes. All facets of this template can be edited with Powerpoint no extra software is necessary. Add your own material, put your images in the places assigned for them, adjust the colors, and then you can show your slides to the world, with an animated slide included.
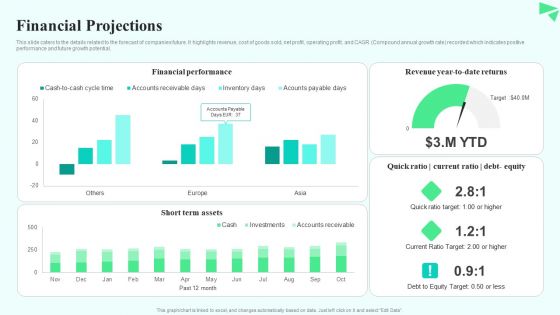
Search Retargeting And Lead Generation Company Elevator Pitch Deck Financial Projections Portrait PDF
This slide caters to the details related to the forecast of companies future. It highlights revenue, cost of goods sold, net profit, operating profit, and CAGR Compound annual growth rate recorded which indicates positive performance and future growth potential. This modern and well arranged Search Retargeting And Lead Generation Company Elevator Pitch Deck Financial Projections Portrait PDF provides lots of creative possibilities. It is very simple to customize and edit with the Powerpoint Software. Just drag and drop your pictures into the shapes. All facets of this template can be edited with Powerpoint no extra software is necessary. Add your own material, put your images in the places assigned for them, adjust the colors, and then you can show your slides to the world, with an animated slide included.
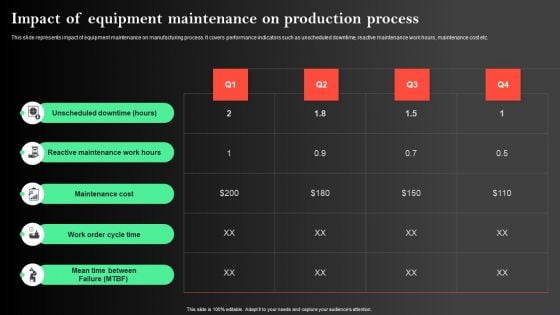
Manufacturing Operations Management Process Impact Of Equipment Maintenance On Production Background PDF
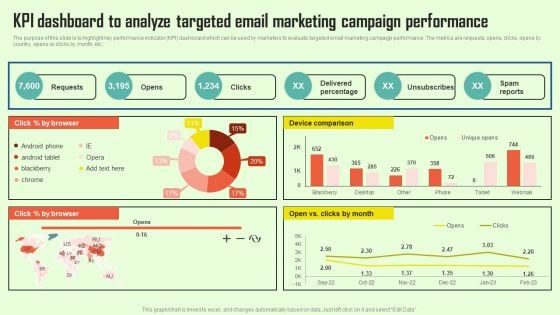
Increasing Consumer Engagement With Database KPI Dashboard To Analyze Targeted Email Infographics PDF
The purpose of this slide is to highlight key performance indicator KPI dashboard which can be used by marketers to evaluate targeted email marketing campaign performance. The metrics are requests, opens, clicks, opens by country, opens vs clicks by month, etc. This modern and well arranged Increasing Consumer Engagement With Database KPI Dashboard To Analyze Targeted Email Infographics PDF provides lots of creative possibilities. It is very simple to customize and edit with the Powerpoint Software. Just drag and drop your pictures into the shapes. All facets of this template can be edited with Powerpoint no extra software is necessary. Add your own material, put your images in the places assigned for them, adjust the colors, and then you can show your slides to the world, with an animated slide included.
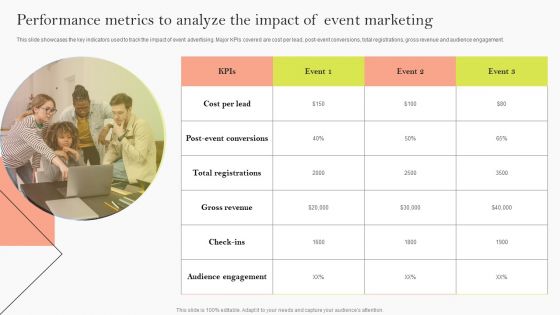
Performance Metrics To Analyze The Impact Of Event Marketing Ppt Model Good PDF
This slide showcases the key indicators used to track the impact of event advertising. Major KPIs covered are cost per lead, post-event conversions, total registrations, gross revenue and audience engagement. This modern and well arranged Performance Metrics To Analyze The Impact Of Event Marketing Ppt Model Good PDF provides lots of creative possibilities. It is very simple to customize and edit with the Powerpoint Software. Just drag and drop your pictures into the shapes. All facets of this template can be edited with Powerpoint no extra software is necessary. Add your own material, put your images in the places assigned for them, adjust the colors, and then you can show your slides to the world, with an animated slide included.
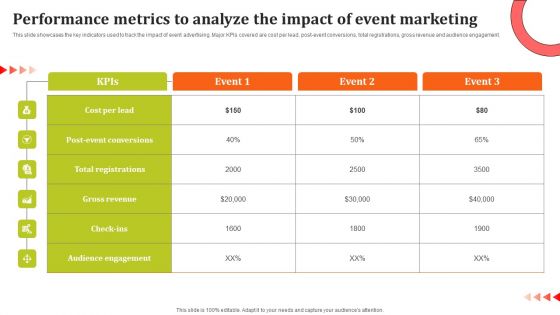
Performance Metrics To Analyze The Impact Of Event Marketing Ppt Model Layouts PDF
This slide showcases the key indicators used to track the impact of event advertising. Major KPIs covered are cost per lead, post-event conversions, total registrations, gross revenue and audience engagement. This modern and well arranged Performance Metrics To Analyze The Impact Of Event Marketing Ppt Model Layouts PDF provides lots of creative possibilities. It is very simple to customize and edit with the Powerpoint Software. Just drag and drop your pictures into the shapes. All facets of this template can be edited with Powerpoint no extra software is necessary. Add your own material, put your images in the places assigned for them, adjust the colors, and then you can show your slides to the world, with an animated slide included.
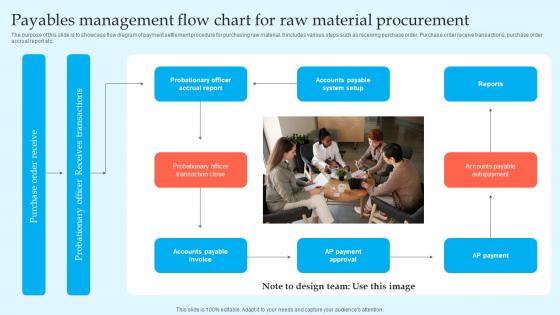
Payables Management Flow Chart For Raw Material Procurement Rules Pdf
The purpose of this slide is to showcase flow diagram of payment settlement procedure for purchasing raw material. It includes various steps such as receiving purchase order, Purchase order receive transactions, purchase order accrual report etc.Showcasing this set of slides titled Payables Management Flow Chart For Raw Material Procurement Rules Pdf The topics addressed in these templates are Accounts Payable Autopayment, Receives Transactions, Purchase Order Receive All the content presented in this PPT design is completely editable. Download it and make adjustments in color, background, font etc. as per your unique business setting. The purpose of this slide is to showcase flow diagram of payment settlement procedure for purchasing raw material. It includes various steps such as receiving purchase order, Purchase order receive transactions, purchase order accrual report etc.
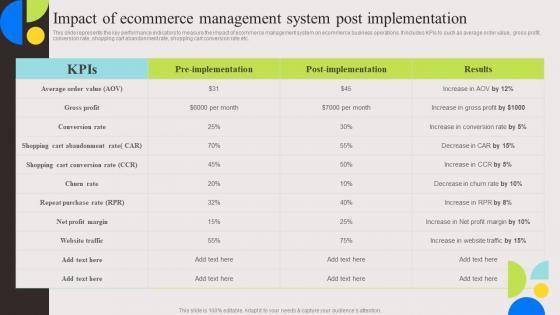
Impact Of Ecommerce Management Evaluation And Deployment Of Enhanced Mockup Pdf
This slide represents the key performance indicators to measure the impact of ecommerce management system on ecommerce business operations. It includes KPIs to such as average order value, gross profit, conversion rate, shopping cart abandonment rate, shopping cart conversion rate etc. Coming up with a presentation necessitates that the majority of the effort goes into the content and the message you intend to convey. The visuals of a PowerPoint presentation can only be effective if it supplements and supports the story that is being told. Keeping this in mind our experts created Impact Of Ecommerce Management Evaluation And Deployment Of Enhanced Mockup Pdf to reduce the time that goes into designing the presentation. This way, you can concentrate on the message while our designers take care of providing you with the right template for the situation. This slide represents the key performance indicators to measure the impact of ecommerce management system on ecommerce business operations. It includes KPIs to such as average order value, gross profit, conversion rate, shopping cart abandonment rate, shopping cart conversion rate etc.
Key Metrics To Measure Current Evaluation And Deployment Of Enhanced Professional Pdf
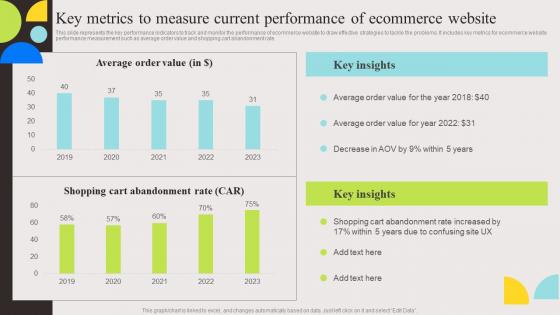
This slide represents the key performance indicators to track and monitor the performance of ecommerce website to draw effective strategies to tackle the problems. It includes key metrics for ecommerce website performance measurement such as average order value and shopping cart abandonment rate. Are you searching for a Key Metrics To Measure Current Evaluation And Deployment Of Enhanced Professional Pdf that is uncluttered, straightforward, and original It is easy to edit, and you can change the colors to suit your personal or business branding. For a presentation that expresses how much effort you have put in, this template is ideal With all of its features, including tables, diagrams, statistics, and lists, it is perfect for a business plan presentation. Make your ideas more appealing with these professional slides. Download Key Metrics To Measure Current Evaluation And Deployment Of Enhanced Professional Pdf from Slidegeeks today. This slide represents the key performance indicators to track and monitor the performance of ecommerce website to draw effective strategies to tackle the problems. It includes key metrics for ecommerce website performance measurement such as average order value and shopping cart abandonment rate.
Success Metrics To Measure Offline Marketing Strategies Performance Effective GTM Techniques Brochure PDF
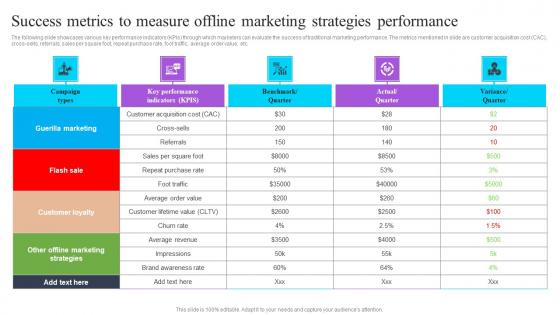
The following slide showcases various key performance indicators KPIs through which marketers can evaluate the success of traditional marketing performance. The metrics mentioned in slide are customer acquisition cost CAC, cross-sells, referrals, sales per square foot, repeat purchase rate, foot traffic, average order value, etc. Slidegeeks is here to make your presentations a breeze with Success Metrics To Measure Offline Marketing Strategies Performance Effective GTM Techniques Brochure PDF With our easy-to-use and customizable templates, you can focus on delivering your ideas rather than worrying about formatting. With a variety of designs to choose from, you are sure to find one that suits your needs. And with animations and unique photos, illustrations, and fonts, you can make your presentation pop. So whether you are giving a sales pitch or presenting to the board, make sure to check out Slidegeeks first The following slide showcases various key performance indicators KPIs through which marketers can evaluate the success of traditional marketing performance. The metrics mentioned in slide are customer acquisition cost CAC cross-sells, referrals, sales per square foot, repeat purchase rate, foot traffic, average order value, etc.
Logistics Management Strategy Advanced Supply Chain Improvement Strategies Ideas Pdf
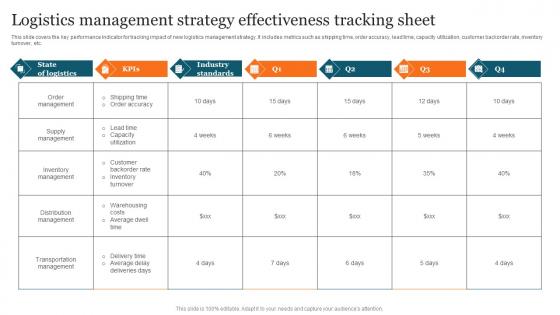
This slide covers the key performance indicator for tracking impact of new logistics management strategy. It includes metrics such as shipping time, order accuracy, lead time, capacity utilization, customer backorder rate, inventory turnover, etc. Formulating a presentation can take up a lot of effort and time, so the content and message should always be the primary focus. The visuals of the PowerPoint can enhance the presenters message, so our Logistics Management Strategy Advanced Supply Chain Improvement Strategies Ideas Pdf was created to help save time. Instead of worrying about the design, the presenter can concentrate on the message while our designers work on creating the ideal templates for whatever situation is needed. Slidegeeks has experts for everything from amazing designs to valuable content, we have put everything into Logistics Management Strategy Advanced Supply Chain Improvement Strategies Ideas Pdf This slide covers the key performance indicator for tracking impact of new logistics management strategy. It includes metrics such as shipping time, order accuracy, lead time, capacity utilization, customer backorder rate, inventory turnover, etc.
Success Metrics To Measure Offline Marketing Strategies Effective Startup Promotion Plan Introduction Pdf
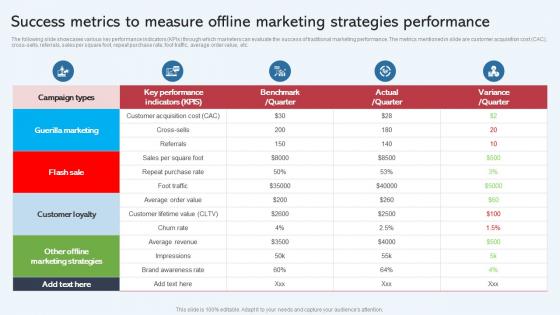
The following slide showcases various key performance indicators KPIs through which marketers can evaluate the success of traditional marketing performance. The metrics mentioned in slide are customer acquisition cost CAC, cross sells, referrals, sales per square foot, repeat purchase rate, foot traffic, average order value, etc. Slidegeeks is here to make your presentations a breeze with Success Metrics To Measure Offline Marketing Strategies Effective Startup Promotion Plan Introduction Pdf With our easy to use and customizable templates, you can focus on delivering your ideas rather than worrying about formatting. With a variety of designs to choose from, you are sure to find one that suits your needs. And with animations and unique photos, illustrations, and fonts, you can make your presentation pop. So whether you are giving a sales pitch or presenting to the board, make sure to check out Slidegeeks first. The following slide showcases various key performance indicators KPIs through which marketers can evaluate the success of traditional marketing performance. The metrics mentioned in slide are customer acquisition cost CAC, cross sells, referrals, sales per square foot, repeat purchase rate, foot traffic, average order value, etc.

KPI Measuring After Implementing Restaurant Marketing Strategies Create An Effective Restaurant
The following slide showcases various key performance indicators KPIs through which marketers can evaluate the success of traditional marketing performance. The metrics mentioned in slide are customer acquisition cost CAC, cross-sells, referrals, sales per square foot, repeat purchase rate, foot traffic, average order value, etc. Formulating a presentation can take up a lot of effort and time, so the content and message should always be the primary focus. The visuals of the PowerPoint can enhance the presenters message, so our KPI Measuring After Implementing Restaurant Marketing Strategies Create An Effective Restaurant was created to help save time. Instead of worrying about the design, the presenter can concentrate on the message while our designers work on creating the ideal templates for whatever situation is needed. Slidegeeks has experts for everything from amazing designs to valuable content, we have put everything into KPI Measuring After Implementing Restaurant Marketing Strategies Create An Effective Restaurant. The following slide showcases various key performance indicators KPIs through which marketers can evaluate the success of traditional marketing performance. The metrics mentioned in slide are customer acquisition cost CAC, cross-sells, referrals, sales per square foot, repeat purchase rate, foot traffic, average order value, etc.

Create A Restaurant Marketing KPI Measuring After Implementing Restaurant
The following slide showcases various key performance indicators KPIs through which marketers can evaluate the success of traditional marketing performance. The metrics mentioned in slide are customer acquisition cost CAC , cross-sells, referrals, sales per square foot, repeat purchase rate, foot traffic, average order value, etc. Crafting an eye-catching presentation has never been more straightforward. Let your presentation shine with this tasteful yet straightforward Create A Restaurant Marketing KPI Measuring After Implementing Restaurant template. It offers a minimalistic and classy look that is great for making a statement. The colors have been employed intelligently to add a bit of playfulness while still remaining professional. Construct the ideal Create A Restaurant Marketing KPI Measuring After Implementing Restaurant that effortlessly grabs the attention of your audience Begin now and be certain to wow your customers The following slide showcases various key performance indicators KPIs through which marketers can evaluate the success of traditional marketing performance. The metrics mentioned in slide are customer acquisition cost CAC , cross-sells, referrals, sales per square foot, repeat purchase rate, foot traffic, average order value, etc.
Impact Analysis Supply Chain Optimization DT SS V
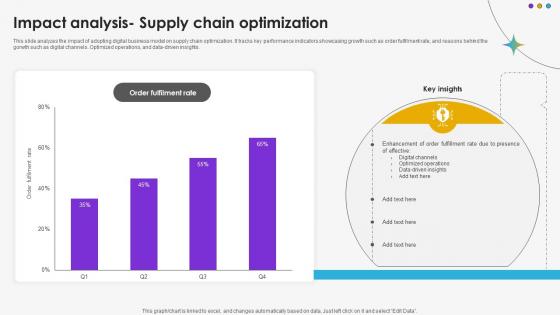
This slide analyzes the impact of adopting digital business model on supply chain optimization. It tracks key performance indicators showcasing growth such as order fulfilment rate, and reasons behind the gorwth such as digital channels. Optimized operations, and data-driven insights.Whether you have daily or monthly meetings, a brilliant presentation is necessary. Impact Analysis Supply Chain Optimization DT SS V can be your best option for delivering a presentation. Represent everything in detail using Impact Analysis Supply Chain Optimization DT SS V and make yourself stand out in meetings. The template is versatile and follows a structure that will cater to your requirements. All the templates prepared by Slidegeeks are easy to download and edit. Our research experts have taken care of the corporate themes as well. So, give it a try and see the results. This slide analyzes the impact of adopting digital business model on supply chain optimization. It tracks key performance indicators showcasing growth such as order fulfilment rate, and reasons behind the gorwth such as digital channels. Optimized operations, and data-driven insights.
Key Statistics Associated With Global Air Conditioners Market Smartphones Industry Report PPT Sample IR SS V
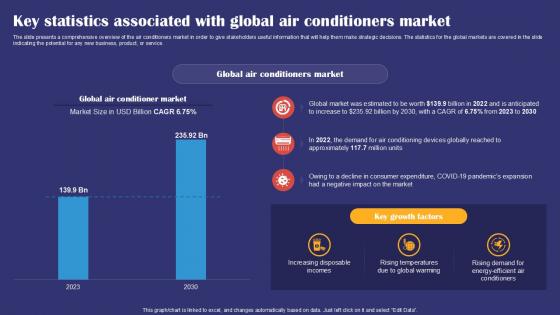
The slide presents a comprehensive overview of the air conditioners market in order to give stakeholders useful information that will help them make strategic decisions. The statistics for the global markets are covered in the slide indicating the potential for any new business, product, or service. Whether you have daily or monthly meetings, a brilliant presentation is necessary. Key Statistics Associated With Global Air Conditioners Market Smartphones Industry Report PPT Sample IR SS V can be your best option for delivering a presentation. Represent everything in detail using Key Statistics Associated With Global Air Conditioners Market Smartphones Industry Report PPT Sample IR SS V and make yourself stand out in meetings. The template is versatile and follows a structure that will cater to your requirements. All the templates prepared by Slidegeeks are easy to download and edit. Our research experts have taken care of the corporate themes as well. So, give it a try and see the results. The slide presents a comprehensive overview of the air conditioners market in order to give stakeholders useful information that will help them make strategic decisions. The statistics for the global markets are covered in the slide indicating the potential for any new business, product, or service.
Key Statistics Associated With Global Consumer Electronics Smartphones Industry Report PPT PowerPoint IR SS V
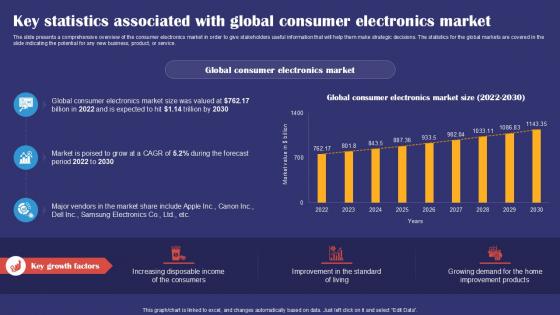
The slide presents a comprehensive overview of the consumer electronics market in order to give stakeholders useful information that will help them make strategic decisions. The statistics for the global markets are covered in the slide indicating the potential for any new business, product, or service. Find highly impressive Key Statistics Associated With Global Consumer Electronics Smartphones Industry Report PPT PowerPoint IR SS V on Slidegeeks to deliver a meaningful presentation. You can save an ample amount of time using these presentation templates. No need to worry to prepare everything from scratch because Slidegeeks experts have already done a huge research and work for you. You need to download Key Statistics Associated With Global Consumer Electronics Smartphones Industry Report PPT PowerPoint IR SS V for your upcoming presentation. All the presentation templates are 100 percent editable and you can change the color and personalize the content accordingly. Download now The slide presents a comprehensive overview of the consumer electronics market in order to give stakeholders useful information that will help them make strategic decisions. The statistics for the global markets are covered in the slide indicating the potential for any new business, product, or service.
Key Statistics Associated With Global Digital Cameras Market Smartphones Industry Report PPT Template IR SS V
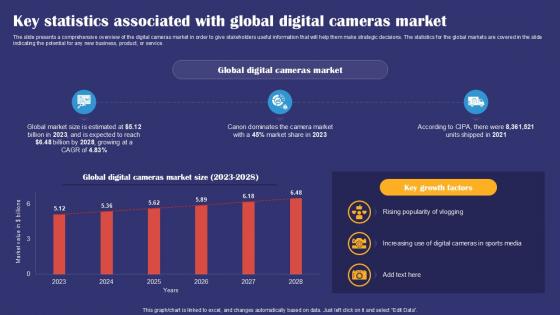
The slide presents a comprehensive overview of the digital cameras market in order to give stakeholders useful information that will help them make strategic decisions. The statistics for the global markets are covered in the slide indicating the potential for any new business, product, or service. If your project calls for a presentation, then Slidegeeks is your go to partner because we have professionally designed, easy to edit templates that are perfect for any presentation. After downloading, you can easily edit Key Statistics Associated With Global Digital Cameras Market Smartphones Industry Report PPT Template IR SS V and make the changes accordingly. You can rearrange slides or fill them with different images. Check out all the handy templates The slide presents a comprehensive overview of the digital cameras market in order to give stakeholders useful information that will help them make strategic decisions. The statistics for the global markets are covered in the slide indicating the potential for any new business, product, or service.

Key Statistics Associated With Global E Commerce Smartphones Industry Report PPT Presentation IR SS V
The slide presents a comprehensive overview of the e commerce electronics market in order to give stakeholders useful information that will help them make strategic decisions. The statistics for the global markets are covered in the slide indicating the potential for any new business, product, or service. If you are looking for a format to display your unique thoughts, then the professionally designed Key Statistics Associated With Global E Commerce Smartphones Industry Report PPT Presentation IR SS V is the one for you. You can use it as a Google Slides template or a PowerPoint template. Incorporate impressive visuals, symbols, images, and other charts. Modify or reorganize the text boxes as you desire. Experiment with shade schemes and font pairings. Alter, share or cooperate with other people on your work. Download Key Statistics Associated With Global E Commerce Smartphones Industry Report PPT Presentation IR SS V and find out how to give a successful presentation. Present a perfect display to your team and make your presentation unforgettable. The slide presents a comprehensive overview of the e commerce electronics market in order to give stakeholders useful information that will help them make strategic decisions. The statistics for the global markets are covered in the slide indicating the potential for any new business, product, or service.

Key Statistics Associated With Global Laptops Market Smartphones Industry Report PPT Template IR SS V
The slide presents a comprehensive overview of the laptops market in order to give stakeholders useful information that will help them make strategic decisions. The statistics for the global markets are covered in the slide indicating the potential for any new business, product, or service. Are you in need of a template that can accommodate all of your creative concepts This one is crafted professionally and can be altered to fit any style. Use it with Google Slides or PowerPoint. Include striking photographs, symbols, depictions, and other visuals. Fill, move around, or remove text boxes as desired. Test out color palettes and font mixtures. Edit and save your work, or work with colleagues. Download Key Statistics Associated With Global Laptops Market Smartphones Industry Report PPT Template IR SS V and observe how to make your presentation outstanding. Give an impeccable presentation to your group and make your presentation unforgettable. The slide presents a comprehensive overview of the laptops market in order to give stakeholders useful information that will help them make strategic decisions. The statistics for the global markets are covered in the slide indicating the potential for any new business, product, or service.
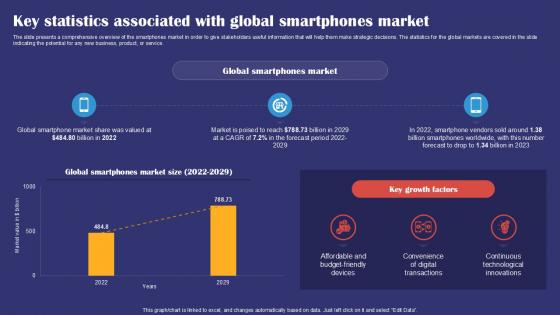
Key Statistics Associated With Global Smartphones Market Smartphones Industry Report PPT Presentation IR SS V
The slide presents a comprehensive overview of the smartphones market in order to give stakeholders useful information that will help them make strategic decisions. The statistics for the global markets are covered in the slide indicating the potential for any new business, product, or service. Crafting an eye catching presentation has never been more straightforward. Let your presentation shine with this tasteful yet straightforward Key Statistics Associated With Global Smartphones Market Smartphones Industry Report PPT Presentation IR SS V template. It offers a minimalistic and classy look that is great for making a statement. The colors have been employed intelligently to add a bit of playfulness while still remaining professional. Construct the ideal Key Statistics Associated With Global Smartphones Market Smartphones Industry Report PPT Presentation IR SS V that effortlessly grabs the attention of your audience Begin now and be certain to wow your customers The slide presents a comprehensive overview of the smartphones market in order to give stakeholders useful information that will help them make strategic decisions. The statistics for the global markets are covered in the slide indicating the potential for any new business, product, or service.

Health Insurance Medical PowerPoint Template 0610
a photo of prescriptions with insurance card with additional cash indicating the high cost of health insurance You are entitled to excellence. Demand your due from our Health Insurance Medical PowerPoint Template 0610.
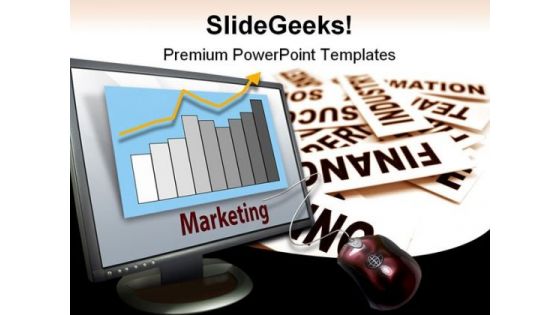
Marketing Business Sales PowerPoint Backgrounds And Templates 1210
Microsoft PowerPoint Template and Background with Business bar graph on monitor with arrow indicator Cast our Marketing Business Sales PowerPoint Backgrounds And Templates 1210 in your act. The audience will call for an encore.

Direction To Goals Success PowerPoint Templates And PowerPoint Backgrounds 0611
Microsoft PowerPoint Template and Background with signage indicating several directions to specific goals Many of your colleagues may fall for a fallacy. Advise them appropriately with our Direction To Goals Success PowerPoint Templates And PowerPoint Backgrounds 0611.
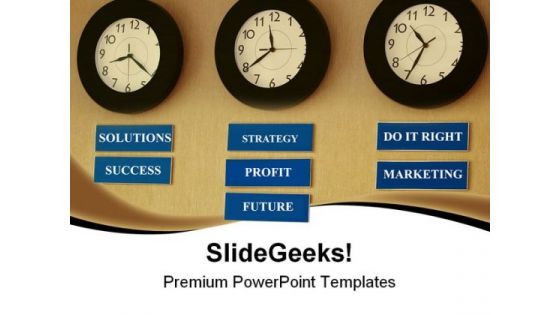
Company Goals And Direction Success PowerPoint Templates And PowerPoint Backgrounds 0711
Microsoft PowerPoint Template and Background with management directions concept shown with clock and time indicator Our Company Goals And Direction Success PowerPoint Templates And PowerPoint Backgrounds 0711 will not falter at the altar. They adhere to the vows they make.

Out Beating Competitors Business PowerPoint Templates And PowerPoint Backgrounds 0711
Microsoft PowerPoint Template and Background with line graph indicating the winer out beating two competitors Critique plans with our Out Beating Competitors Business PowerPoint Templates And PowerPoint Backgrounds 0711. Download without worries with our money back guaranteee.

Santa House Signpost Holidays PowerPoint Templates And PowerPoint Backgrounds 0811
Microsoft PowerPoint Template and Background with wooden signpost with santa's hat indicating santa's house with snow Our Santa House Signpost Holidays PowerPoint Templates And PowerPoint Backgrounds 0811 are really captivating. The audience will not take their eyes off you.

Solutions Business PowerPoint Templates And PowerPoint Backgrounds 0811
Microsoft PowerPoint Template and Background with metal signpost indicating three solutions Attract your colleagues with your ideas. Capture their attention with our eye-catching Solutions Business PowerPoint Templates And PowerPoint Backgrounds 0811.

Santa House Signpost Holidays PowerPoint Themes And PowerPoint Slides 0811
Microsoft PowerPoint Theme and Slide with wooden signpost with santa's hat indicating santa's house with snow Spice up the discourse with our Santa House Signpost Holidays PowerPoint Themes And PowerPoint Slides 0811. Strengthen the flavour of your thoughts.

Solutions Business PowerPoint Themes And PowerPoint Slides 0811
Microsoft PowerPoint Theme and Slide with metal signpost indicating three solutions Be prepared for every eventuality. Plan your defences with our Solutions Business PowerPoint Themes And PowerPoint Slides 0811.
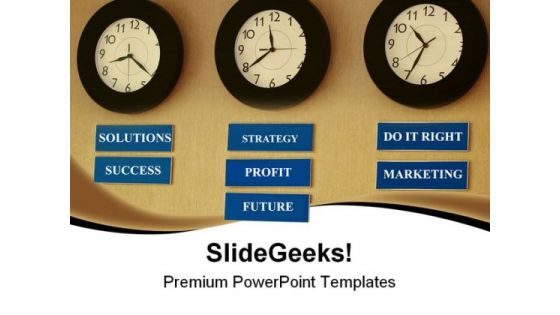
Company Goals And Direction Success PowerPoint Themes And PowerPoint Slides 0711
Microsoft PowerPoint Theme and Slide with management directions concept shown with clock and time indicator Arm yourself with our Company Goals And Direction Success PowerPoint Themes And PowerPoint Slides 0711. Carry your thoughts safely across.

Solution Signpost Business PowerPoint Templates And PowerPoint Themes 0312
Microsoft Powerpoint Templates and Background with metal signpost indicating three solutions Consultour Solution Signpost Business PowerPoint Templates And PowerPoint Themes 0312 for any advice. Get answers that are ethical and actionable.

Success Teamwork Signpost Metaphor PowerPoint Templates And PowerPoint Themes 0412
Microsoft Powerpoint Templates and Background with metal signpost indicating three solutions Maintain the continuity of your thoughts. Our Success Teamwork Signpost Metaphor PowerPoint Templates And PowerPoint Themes 0412 will be the fillers.

Success Signpost Metaphor PowerPoint Templates And PowerPoint Themes 0412
Microsoft Powerpoint Templates and Background with pole indicating success Play your cards well with our Success Signpost Metaphor PowerPoint Templates And PowerPoint Themes 0412. Give your thoughts a good deal.

Solution Signpost Business PowerPoint Templates And PowerPoint Themes 0412
Microsoft Powerpoint Templates and Background with metal signpost indicating three solutions Use any of the facets our Solution Signpost Business PowerPoint Templates And PowerPoint Themes 0412 offer. They rank really high on employability.

Solutions Signpost Metaphor PowerPoint Templates And PowerPoint Themes 0512
Microsoft Powerpoint Templates and Background with metal signpost indicating three solutions Bring on the heat with our Solutions Signpost Metaphor PowerPoint Templates And PowerPoint Themes 0512. All your doubts will begin to evaporate.
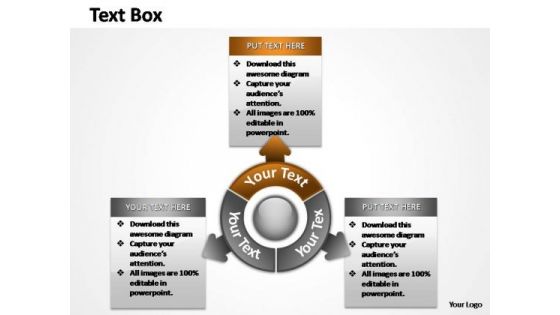
PowerPoint Slide Layout Strategy Steps Ppt Slide Designs
Arrows Indicates the way to growth. Use this diagram for improved controls to drive your business towards the right direction Complete the circle with our PowerPoint Slide Layout Strategy Steps Ppt Slide Designs. Explore every direction with your thoughts.
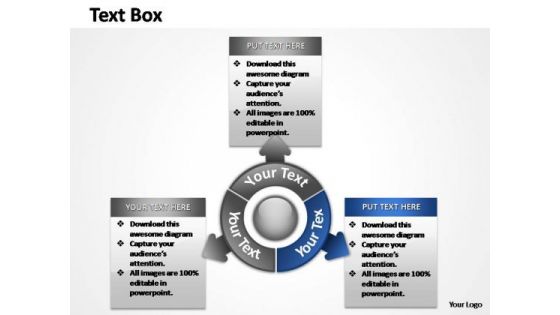
PowerPoint Theme Process Steps Ppt Presentation
Arrows Indicates the way to growth. Use this diagram for improved controls to drive your business towards the right direction Baseless fears can be a bane. Allay them with our PowerPoint Theme Process Steps Ppt Presentation.
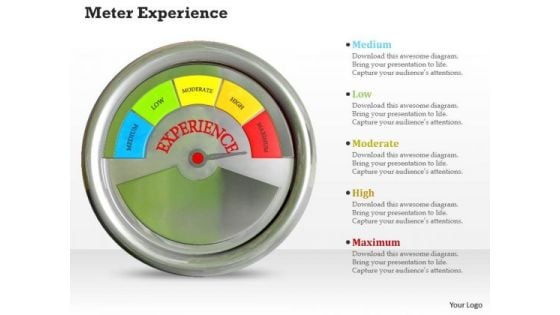
Stock Photo Meter Experience PowerPoint Slide
This image contains graphics of 3d meter indicating maximum level of experience. This image is an excellent tool to give an ideal presentation. Special effects of this image will surely interest the audience.
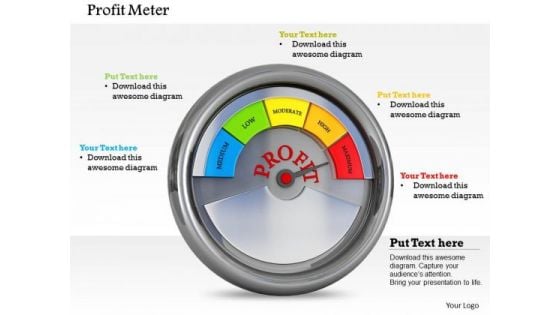
Stock Photo Profit Meter At Maximum Level PowerPoint Slide
Display the concept of profit growth with this image. This image has been designed with graphics of meter indicating maximum level of profit. Use this image to make business presentations.
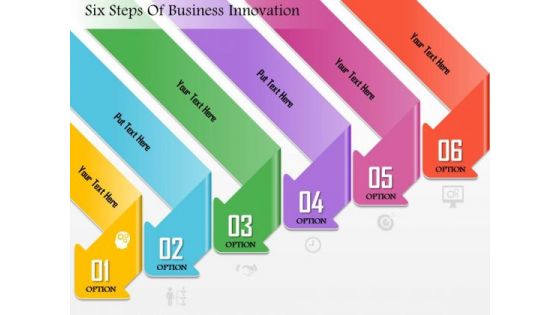
Business Diagram Six Steps Of Business Innovation Presentation Template
Use this business consulting diagram to describe or analyze processes, document procedures, indicate work or information flow, track cost and efficiency. This diagram is designed to attract the attention of your audience.

Business Diagram Two Warning Sign For Danger In Nuclear Area Presentation Template
This PowerPoint template has been designed with graphic of two warning sign for danger indication. The importance of safety in the work place can be defined with this diagram. Use this image to build quality presentation for your viewers.
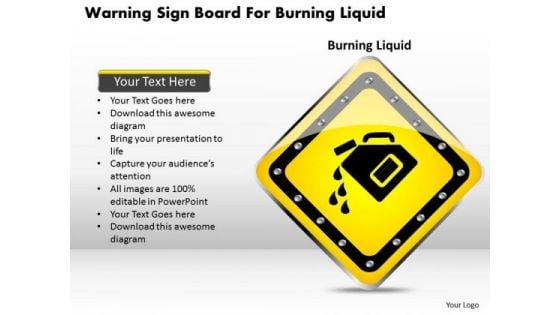
Business Diagram Warning Sign Board For Burning Liquid Presentation Template
This PowerPoint template has been designed with graphic of warning board. This warning board is designed to display warning for burning liquid. Use this image for warning indication from flammable liquid.

Business Diagram Warning Sign For Nuclear Plant And Hazard Presentation Template
This PowerPoint template has been designed with graphic of warning signs. These signs are used to display warning for nuclear power. Use this diagram to make danger indication related presentations.

Business Diagram Yellow Warning Sign For Blast Area Presentation Template
This PowerPoint diagram has been designed with graphic of yellow warning symbol. This slide contains the warning for blast indication. Use this diagram for presentations which are related with safety and warning.

Business Diagram Yellow Warning Symbol For Nuclear Area Presentation Template
This PowerPoint diagram has been designed with graphic of yellow warning symbol. This slide contains the warning for nuclear area indication. Build presentations for your safety and warning related topics with this diagram.
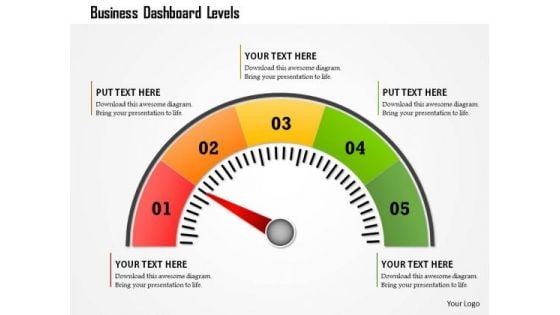
Business Framework Business Dashboard Levels PowerPoint Presentation
This business diagram displays colored meter with multiple levels. Use this diagram to display business process. This diagram can be used to indicate performance measures. This is an excellent diagram to impress your audiences.
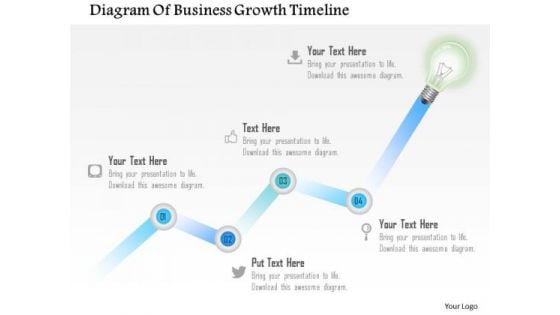
Business Diagram Diagram Of Business Growth Timeline Presentation Template
A sequential time line diagram has been used to design this business slide. This diagram contains the concept of growth indication. Use this professional slide for your business and success related presentations.


 Continue with Email

 Home
Home


