Industry Snapshot
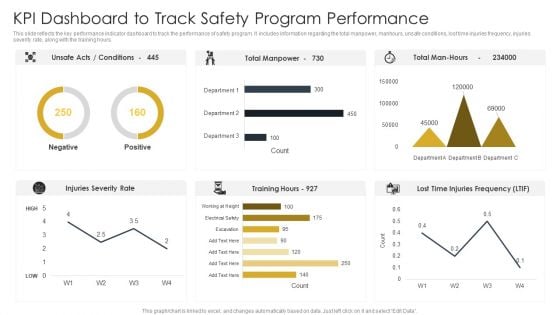
Kpi Dashboard To Track Safety Program Performance Construction Site Safety Plan Summary PDF
This slide reflects the key performance indicator dashboard to track the performance of safety program. It includes information regarding the total manpower, manhours, unsafe conditions, lost time injuries frequency, injuries severity rate, along with the training hours. The Kpi Dashboard To Track Safety Program Performance Construction Site Safety Plan Summary PDF is a compilation of the most recent design trends as a series of slides. It is suitable for any subject or industry presentation, containing attractive visuals and photo spots for businesses to clearly express their messages. This template contains a variety of slides for the user to input data, such as structures to contrast two elements, bullet points, and slides for written information. Slidegeeks is prepared to create an impression.
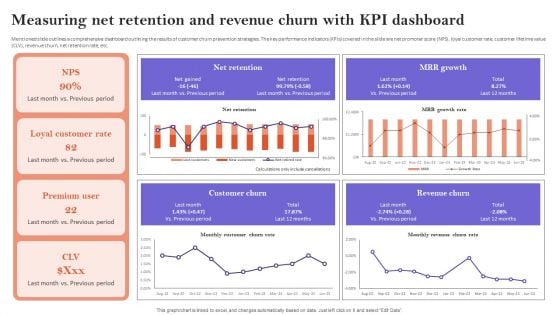
Measuring Net Retention And Revenue Churn With Kpi Dashboard Ideas PDF
Mentioned slide outlines a comprehensive dashboard outlining the results of customer churn prevention strategies. The key performance indicators KPIs covered in the slide are net promoter score NPS, loyal customer rate, customer lifetime value CLV, revenue churn, net retention rate, etc. The Measuring Net Retention And Revenue Churn With Kpi Dashboard Ideas PDF is a compilation of the most recent design trends as a series of slides. It is suitable for any subject or industry presentation, containing attractive visuals and photo spots for businesses to clearly express their messages. This template contains a variety of slides for the user to input data, such as structures to contrast two elements, bullet points, and slides for written information. Slidegeeks is prepared to create an impression.
Predictive Analytics Model Performance Tracking Dashboard Forward Looking Analysis IT Introduction PDF
This slide represents the predictive analytics model performance tracking dashboard, and it covers the details of total visitors, total buyers, total products added to the cart, filters by date and category, visitors to clients conversion rate, and so on.The Predictive Analytics Model Performance Tracking Dashboard Forward Looking Analysis IT Introduction PDF is a compilation of the most recent design trends as a series of slides. It is suitable for any subject or industry presentation, containing attractive visuals and photo spots for businesses to clearly express their messages. This template contains a variety of slides for the user to input data, such as structures to contrast two elements, bullet points, and slides for written information. Slidegeeks is prepared to create an impression.
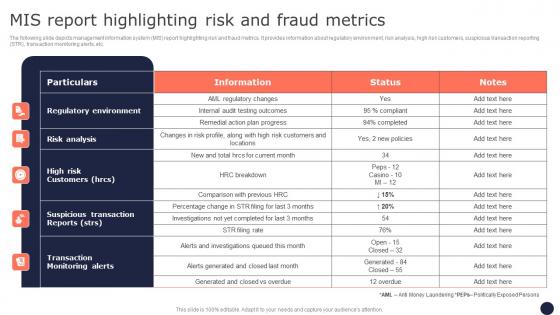
Mis Report Highlighting Risk And Fraud Metrics Mitigating Corporate Scams And Robberies Portrait Pdf
The following slide depicts management information system MIS report highlighting risk and fraud metrics. It provides information about regulatory environment, risk analysis, high risk customers, suspicious transaction reporting STR, transaction monitoring alerts, etc. The Mis Report Highlighting Risk And Fraud Metrics Mitigating Corporate Scams And Robberies Portrait Pdf is a compilation of the most recent design trends as a series of slides. It is suitable for any subject or industry presentation, containing attractive visuals and photo spots for businesses to clearly express their messages. This template contains a variety of slides for the user to input data, such as structures to contrast two elements, bullet points, and slides for written information. Slidegeeks is prepared to create an impression. The following slide depicts management information system MIS report highlighting risk and fraud metrics. It provides information about regulatory environment, risk analysis, high risk customers, suspicious transaction reporting STR, transaction monitoring alerts, etc.
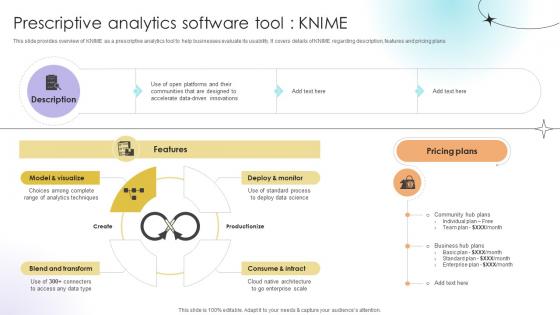
Prescriptive Analytics Software Tool Knime Data Analytics SS V
This slide provides overview of KNIME as a prescriptive analytics tool to help businesses evaluate its usability. It covers details of KNIME regarding description, features and pricing plans.The Prescriptive Analytics Software Tool Knime Data Analytics SS V is a compilation of the most recent design trends as a series of slides. It is suitable for any subject or industry presentation, containing attractive visuals and photo spots for businesses to clearly express their messages. This template contains a variety of slides for the user to input data, such as structures to contrast two elements, bullet points, and slides for written information. Slidegeeks is prepared to create an impression. This slide provides overview of KNIME as a prescriptive analytics tool to help businesses evaluate its usability. It covers details of KNIME regarding description, features and pricing plans.
Inbound Lead Performance Tracking Dashboard Improving Lead Generation Process Pictures PDF
This slide covers the KPI dashboard for evaluating inbound lead performance. It includes metrics such as lead to opportunity ratio, opportunity to win ratio, lead conversion ratio, inbound leads, and leads in the sales funnel. The Inbound Lead Performance Tracking Dashboard Improving Lead Generation Process Pictures PDF is a compilation of the most recent design trends as a series of slides. It is suitable for any subject or industry presentation, containing attractive visuals and photo spots for businesses to clearly express their messages. This template contains a variety of slides for the user to input data, such as structures to contrast two elements, bullet points, and slides for written information. Slidegeeks is prepared to create an impression.

Key Metrics To Consider In Prompt Evaluation Crafting Interactions A Guide AI SS V
This slide showcases key metrics to consider while evaluating prompt engineering, referable by users and multiple businesses harnessing this technology. It provides information about relevance, coherence, accuracy, etc. The Key Metrics To Consider In Prompt Evaluation Crafting Interactions A Guide AI SS V is a compilation of the most recent design trends as a series of slides. It is suitable for any subject or industry presentation, containing attractive visuals and photo spots for businesses to clearly express their messages. This template contains a variety of slides for the user to input data, such as structures to contrast two elements, bullet points, and slides for written information. Slidegeeks is prepared to create an impression. This slide showcases key metrics to consider while evaluating prompt engineering, referable by users and multiple businesses harnessing this technology. It provides information about relevance, coherence, accuracy, etc.

Strategies For Dynamic Supply Chain Agility Supply Chain Kpi Dashboard For Effective Financial Analysis Demonstration PDF
Mentioned slide illustrates KPI dashboard that can be used by managers to assess financial health of supply chain business. KPIs covered are supply chain costs versus sales, cash to order cycle, warehouse operating cost distribution etc. The Strategies For Dynamic Supply Chain Agility Supply Chain Kpi Dashboard For Effective Financial Analysis Demonstration PDF is a compilation of the most recent design trends as a series of slides. It is suitable for any subject or industry presentation, containing attractive visuals and photo spots for businesses to clearly express their messages. This template contains a variety of slides for the user to input data, such as structures to contrast two elements, bullet points, and slides for written information. Slidegeeks is prepared to create an impression.
Dashboard For Tracking Business And IT Alignment Ppt PowerPoint Presentation File Background Images PDF
This slide depicts the dashboard for business and IT alignment by covering details of total sales, customer support service, percentage of business operations aligned IT, usage of communication channels, and top performer associates. The Dashboard For Tracking Business And IT Alignment Ppt PowerPoint Presentation File Background Images PDF is a compilation of the most recent design trends as a series of slides. It is suitable for any subject or industry presentation, containing attractive visuals and photo spots for businesses to clearly express their messages. This template contains a variety of slides for the user to input data, such as structures to contrast two elements, bullet points, and slides for written information. Slidegeeks is prepared to create an impression.
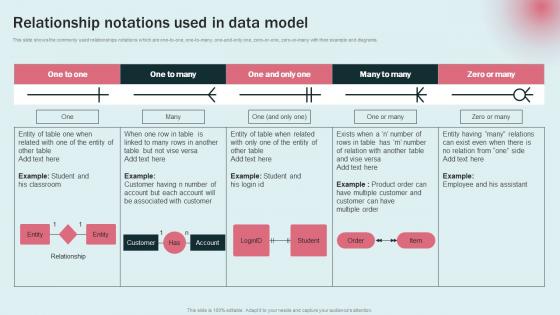
Relationship Notations Used Data Modeling Approaches For Modern Analytics Pictures Pdf
This slide shows the commonly used relationships notations which are one to one, one to many, one and only one, zero or one, zero or many with their example and diagrams. The Relationship Notations Used Data Modeling Approaches For Modern Analytics Pictures Pdf is a compilation of the most recent design trends as a series of slides. It is suitable for any subject or industry presentation, containing attractive visuals and photo spots for businesses to clearly express their messages. This template contains a variety of slides for the user to input data, such as structures to contrast two elements, bullet points, and slides for written information. Slidegeeks is prepared to create an impression. This slide shows the commonly used relationships notations which are one to one, one to many, one and only one, zero or one, zero or many with their example and diagrams.
Dashboard For Tracking Brand Communication Campaign Results Executing Brand Communication Strategy Clipart PDF
This slide covers the dashboard for monitoring various audience segments. It includes metrics such as ad mentions, engagement, top occupation of the audience, top interest of the audience, age, language, etc. The Dashboard For Tracking Brand Communication Campaign Results Executing Brand Communication Strategy Clipart PDF is a compilation of the most recent design trends as a series of slides. It is suitable for any subject or industry presentation, containing attractive visuals and photo spots for businesses to clearly express their messages. This template contains a variety of slides for the user to input data, such as structures to contrast two elements, bullet points, and slides for written information. Slidegeeks is prepared to create an impression.
Inbound Lead Performance Tracking Dashboard Enhancing Client Lead Conversion Rates Structure PDF
This slide covers the KPI dashboard for evaluating inbound lead performance. It includes metrics such as lead to opportunity ratio, opportunity to win ratio, lead conversion ratio, inbound leads, and leads in the sales funnel. The Inbound Lead Performance Tracking Dashboard Enhancing Client Lead Conversion Rates Structure PDF is a compilation of the most recent design trends as a series of slides. It is suitable for any subject or industry presentation, containing attractive visuals and photo spots for businesses to clearly express their messages. This template contains a variety of slides for the user to input data, such as structures to contrast two elements, bullet points, and slides for written information. Slidegeeks is prepared to create an impression.
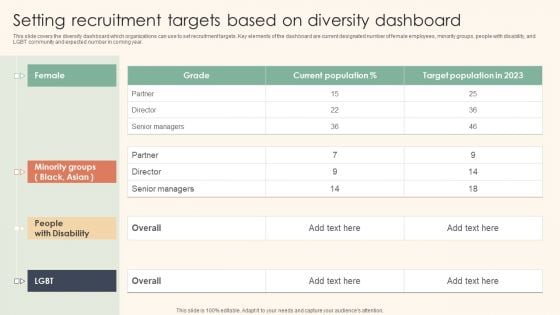
Setting Recruitment Targets Based On Diversity Dashboard Information PDF
This slide covers the diversity dashboard which organizations can use to set recruitment targets. Key elements of the dashboard are current designated number of female employees, minority groups, people with disability, and LGBT community and expected number in coming year. The Setting Recruitment Targets Based On Diversity Dashboard Information PDF is a compilation of the most recent design trends as a series of slides. It is suitable for any subject or industry presentation, containing attractive visuals and photo spots for businesses to clearly express their messages. This template contains a variety of slides for the user to input data, such as structures to contrast two elements, bullet points, and slides for written information. Slidegeeks is prepared to create an impression.

Human Resource Monthly Employee Engagement Report PPT Example SS
This slide represents the employee engagement report prepared by the human resource team. It includes details related to response rate, highlights, factors, questions, factor and question summary etc. The Human Resource Monthly Employee Engagement Report PPT Example SS is a compilation of the most recent design trends as a series of slides. It is suitable for any subject or industry presentation, containing attractive visuals and photo spots for businesses to clearly express their messages. This template contains a variety of slides for the user to input data, such as structures to contrast two elements, bullet points, and slides for written information. Slidegeeks is prepared to create an impression. This slide represents the employee engagement report prepared by the human resource team. It includes details related to response rate, highlights, factors, questions, factor and question summary etc.
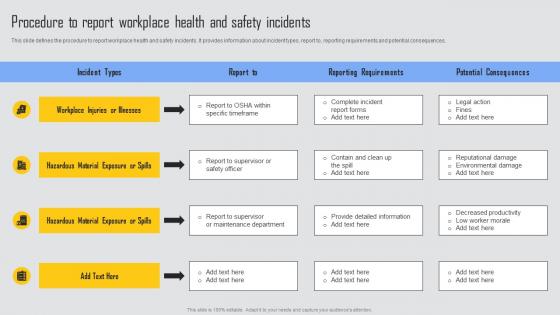
Procedure To Report Workplace Managing Risks And Establishing Trust Through Efficient Structure Pdf
This slide defines the procedure to report workplace health and safety incidents. It provides information about incident types, report to, reporting requirements and potential consequences. The Procedure To Report Workplace Managing Risks And Establishing Trust Through Efficient Structure Pdf is a compilation of the most recent design trends as a series of slides. It is suitable for any subject or industry presentation, containing attractive visuals and photo spots for businesses to clearly express their messages. This template contains a variety of slides for the user to input data, such as structures to contrast two elements, bullet points, and slides for written information. Slidegeeks is prepared to create an impression. This slide defines the procedure to report workplace health and safety incidents. It provides information about incident types, report to, reporting requirements and potential consequences.
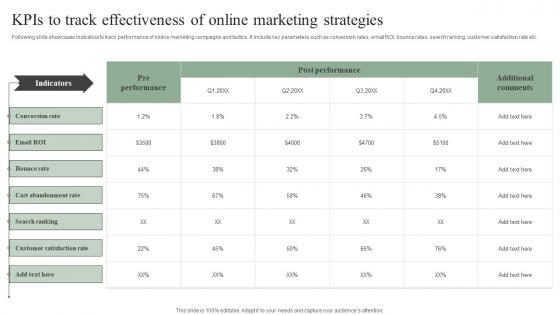
Kpis To Track Effectiveness Of Online Marketing Efficient Marketing Tactics Inspiration Pdf
Following slide showcases indicators to track performance of online marketing campaigns and tactics. It include key parameters such as conversion rates, email ROI, bounce rates, search ranking, customer satisfaction rate etc. The Kpis To Track Effectiveness Of Online Marketing Efficient Marketing Tactics Inspiration Pdf is a compilation of the most recent design trends as a series of slides. It is suitable for any subject or industry presentation, containing attractive visuals and photo spots for businesses to clearly express their messages. This template contains a variety of slides for the user to input data, such as structures to contrast two elements, bullet points, and slides for written information. Slidegeeks is prepared to create an impression. Following slide showcases indicators to track performance of online marketing campaigns and tactics. It include key parameters such as conversion rates, email ROI, bounce rates, search ranking, customer satisfaction rate etc.

Sharing Annual Report For Shareholder Communication Comprehensive Strategic Plan Template Pdf
This slide showcases overview annual report that can be uploaded by organization to engage shareholders. It also showcases key components of annual report which are notes to financial statements, financial highlights, cash flow and income statement. The Sharing Annual Report For Shareholder Communication Comprehensive Strategic Plan Template Pdf is a compilation of the most recent design trends as a series of slides. It is suitable for any subject or industry presentation, containing attractive visuals and photo spots for businesses to clearly express their messages. This template contains a variety of slides for the user to input data, such as structures to contrast two elements, bullet points, and slides for written information. Slidegeeks is prepared to create an impression. This slide showcases overview annual report that can be uploaded by organization to engage shareholders. It also showcases key components of annual report which are notes to financial statements, financial highlights, cash flow and income statement.
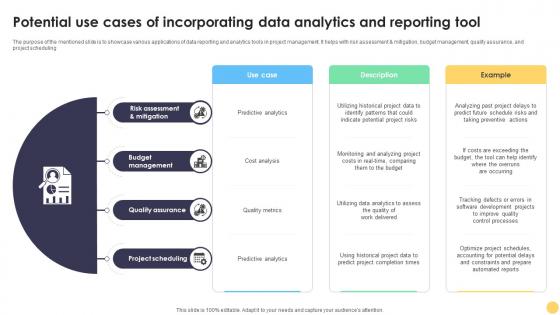
Digital Project Management Strategies Potential Use Cases Of Incorporating Data Analytics And Reporting
The purpose of the mentioned slide is to showcase various applications of data reporting and analytics tools in project management. It helps with risk assessment and mitigation, budget management, quality assurance, and project scheduling. The Digital Project Management Strategies Potential Use Cases Of Incorporating Data Analytics And Reporting is a compilation of the most recent design trends as a series of slides. It is suitable for any subject or industry presentation, containing attractive visuals and photo spots for businesses to clearly express their messages. This template contains a variety of slides for the user to input data, such as structures to contrast two elements, bullet points, and slides for written information. Slidegeeks is prepared to create an impression. The purpose of the mentioned slide is to showcase various applications of data reporting and analytics tools in project management. It helps with risk assessment and mitigation, budget management, quality assurance, and project scheduling.
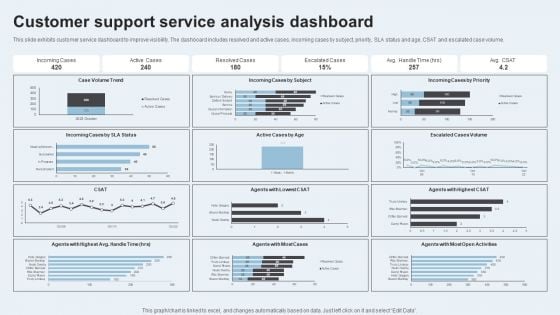
Action Plan To Enhance Client Service Customer Support Service Analysis Dashboard Graphics PDF
This slide exhibits customer service dashboard to improve visibility. The dashboard includes resolved and active cases, incoming cases by subject, priority, SLA status and age, CSAT and escalated case volume. The Action Plan To Enhance Client Service Customer Support Service Analysis Dashboard Graphics PDF is a compilation of the most recent design trends as a series of slides. It is suitable for any subject or industry presentation, containing attractive visuals and photo spots for businesses to clearly express their messages. This template contains a variety of slides for the user to input data, such as structures to contrast two elements, bullet points, and slides for written information. Slidegeeks is prepared to create an impression.

Table Of Prescriptive Model Deployment Timeline Data Analytics SS V
This slide provides a deployment table of prescriptive model aimed at highlighting movement of models through various phases. The basis of deployment are stage, start and end date, manager name with resources utilized.The Table Of Prescriptive Model Deployment Timeline Data Analytics SS V is a compilation of the most recent design trends as a series of slides. It is suitable for any subject or industry presentation, containing attractive visuals and photo spots for businesses to clearly express their messages. This template contains a variety of slides for the user to input data, such as structures to contrast two elements, bullet points, and slides for written information. Slidegeeks is prepared to create an impression. This slide provides a deployment table of prescriptive model aimed at highlighting movement of models through various phases. The basis of deployment are stage, start and end date, manager name with resources utilized.
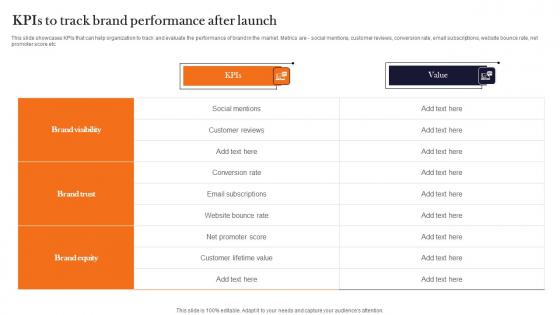
Kpis To Track Brand Performance After Launch Product Advertising And Positioning Pictures Pdf
This slide showcases KPIs that can help organization to track and evaluate the performance of brand in the market. Metrics are social mentions, customer reviews, conversion rate, email subscriptions, website bounce rate, net promoter score etc. The Kpis To Track Brand Performance After Launch Product Advertising And Positioning Pictures Pdf is a compilation of the most recent design trends as a series of slides. It is suitable for any subject or industry presentation, containing attractive visuals and photo spots for businesses to clearly express their messages. This template contains a variety of slides for the user to input data, such as structures to contrast two elements, bullet points, and slides for written information. Slidegeeks is prepared to create an impression. This slide showcases KPIs that can help organization to track and evaluate the performance of brand in the market. Metrics are social mentions, customer reviews, conversion rate, email subscriptions, website bounce rate, net promoter score etc.
Program Metrics Powerpoint Ppt Template Bundles
Increase your chances of writing a winning business proposal and grabbing your prospects attention with this well-crafted, innovative Program Metrics Powerpoint Ppt Template Bundles. This Business Program Continuity, Program Management, Supplier Performance Evaluation-slide presentation template comes with in-built content to help you outline a presentation that can serve as an industry benchmark. The complete deck also makes use of an impressive color scheme to create a visual impact and hook the audience. Use this PPT to plan how your business can be the Numero uno in its segment within no time at all. Download now to showcase your brand USP and offerings to engage your client. Our Program Metrics PowerPoint Template Bundles are thoughtfully crafted to offer a visually appealing background for any topic, helping you deliver a professional presentation.
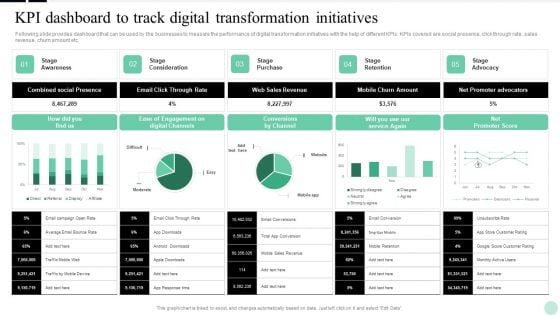
Implementing Digital Transformation Kpi Dashboard To Track Digital Transformation Initiatives Structure PDF
Following slide provides dashboard that can be used by the businesses to measure the performance of digital transformation initiatives with the help of different KPIs. KPIs covered are social presence, click through rate, sales revenue, churn amount etc. The Implementing Digital Transformation Kpi Dashboard To Track Digital Transformation Initiatives Structure PDF is a compilation of the most recent design trends as a series of slides. It is suitable for any subject or industry presentation, containing attractive visuals and photo spots for businesses to clearly express their messages. This template contains a variety of slides for the user to input data, such as structures to contrast two elements, bullet points, and slides for written information. Slidegeeks is prepared to create an impression.
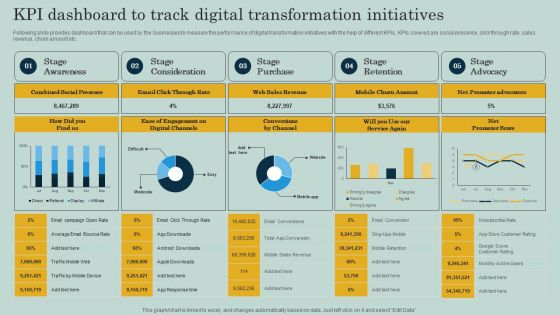
KPI Dashboard To Track Digital Transformation Initiatives Ppt Show Backgrounds PDF
Following slide provides dashboard that can be used by the businesses to measure the performance of digital transformation initiatives with the help of different KPIs. KPIs covered are social presence, click through rate, sales revenue, churn amount etc. The KPI Dashboard To Track Digital Transformation Initiatives Ppt Show Backgrounds PDF is a compilation of the most recent design trends as a series of slides. It is suitable for any subject or industry presentation, containing attractive visuals and photo spots for businesses to clearly express their messages. This template contains a variety of slides for the user to input data, such as structures to contrast two elements, bullet points, and slides for written information. Slidegeeks is prepared to create an impression.
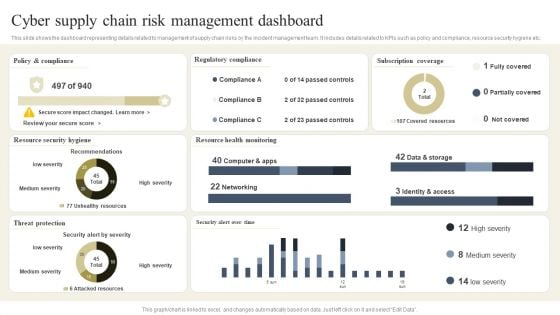
CYBER Security Breache Response Strategy Cyber Supply Chain Risk Management Dashboard Inspiration PDF
This slide shows the dashboard representing details related to management of supply chain risks by the incident management team. It includes details related to KPIs such as policy and compliance, resource security hygiene etc. The CYBER Security Breache Response Strategy Cyber Supply Chain Risk Management Dashboard Inspiration PDF is a compilation of the most recent design trends as a series of slides. It is suitable for any subject or industry presentation, containing attractive visuals and photo spots for businesses to clearly express their messages. This template contains a variety of slides for the user to input data, such as structures to contrast two elements, bullet points, and slides for written information. Slidegeeks is prepared to create an impression.
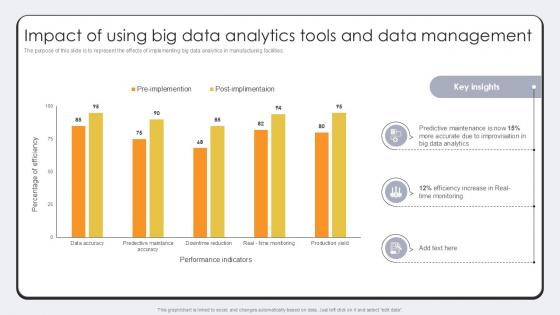
Impact Of Using Big Data Analytics Revolutionizing Production IoT Ppt Sample
The purpose of this slide is to represent the effects of implementing big data analytics in manufacturing facilities. The Impact Of Using Big Data Analytics Revolutionizing Production IoT Ppt Sample is a compilation of the most recent design trends as a series of slides. It is suitable for any subject or industry presentation, containing attractive visuals and photo spots for businesses to clearly express their messages. This template contains a variety of slides for the user to input data, such as structures to contrast two elements, bullet points, and slides for written information. Slidegeeks is prepared to create an impression. The purpose of this slide is to represent the effects of implementing big data analytics in manufacturing facilities.
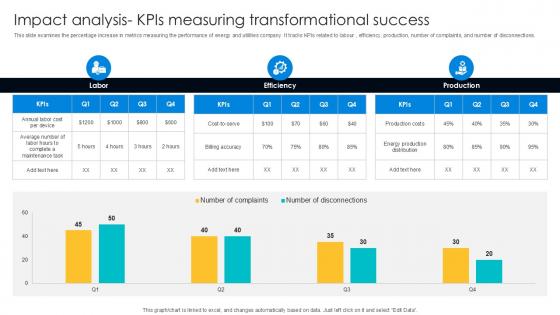
Impact Analysis KPIs Measuring Digital Transformation Journey PPT Presentation DT SS V
This slide examines the percentage increase in metrics measuring the performance of energy and utilities company. It tracks KPIs related to labour , efficiency, production, number of complaints, and number of disconnections. The Impact Analysis KPIs Measuring Digital Transformation Journey PPT Presentation DT SS V is a compilation of the most recent design trends as a series of slides. It is suitable for any subject or industry presentation, containing attractive visuals and photo spots for businesses to clearly express their messages. This template contains a variety of slides for the user to input data, such as structures to contrast two elements, bullet points, and slides for written information. Slidegeeks is prepared to create an impression. This slide examines the percentage increase in metrics measuring the performance of energy and utilities company. It tracks KPIs related to labour , efficiency, production, number of complaints, and number of disconnections.
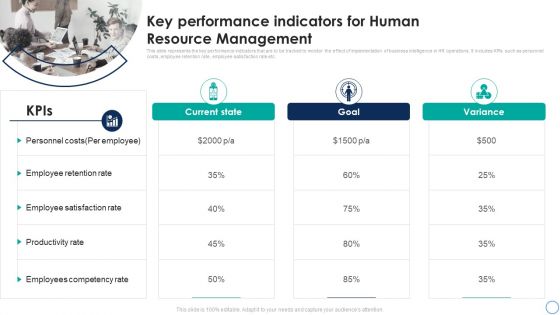
Business Analytics Application Key Performance Indicators For Human Resource Topics PDF
This slide represents the key performance indicators that are to be tracked to monitor the effect of implementation of business intelligence in HR operations. It includes KPIs such as personnel costs, employee retention rate, employee satisfaction rate etc. The Business Analytics Application Key Performance Indicators For Human Resource Topics PDF is a compilation of the most recent design trends as a series of slides. It is suitable for any subject or industry presentation, containing attractive visuals and photo spots for businesses to clearly express their messages. This template contains a variety of slides for the user to input data, such as structures to contrast two elements, bullet points, and slides for written information. Slidegeeks is prepared to create an impression.
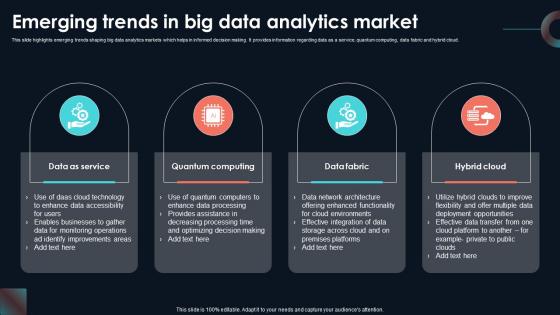
Emerging Trends In Big Data Analytics Developing Strategic Insights Using Big Data Analytics SS V
This slide highlights emerging trends shaping big data analytics markets which helps in informed decision making. It provides information regarding data as a service, quantum computing, data fabric and hybrid cloud. The Emerging Trends In Big Data Analytics Developing Strategic Insights Using Big Data Analytics SS V is a compilation of the most recent design trends as a series of slides. It is suitable for any subject or industry presentation, containing attractive visuals and photo spots for businesses to clearly express their messages. This template contains a variety of slides for the user to input data, such as structures to contrast two elements, bullet points, and slides for written information. Slidegeeks is prepared to create an impression. This slide highlights emerging trends shaping big data analytics markets which helps in informed decision making. It provides information regarding data as a service, quantum computing, data fabric and hybrid cloud.

Methods To Integrate Text Analytics With Multimedia Data PPT Powerpoint SS
This slide outlines several methods for text analytics and other multimedia data integration, such as images, audio, or video through data fusion, augmentation, etc. The Methods To Integrate Text Analytics With Multimedia Data PPT Powerpoint SS is a compilation of the most recent design trends as a series of slides. It is suitable for any subject or industry presentation, containing attractive visuals and photo spots for businesses to clearly express their messages. This template contains a variety of slides for the user to input data, such as structures to contrast two elements, bullet points, and slides for written information. Slidegeeks is prepared to create an impression. This slide outlines several methods for text analytics and other multimedia data integration, such as images, audio, or video through data fusion, augmentation, etc.

Types Of Attribution Analysis Models Product Analytics Implementation Data Analytics V
This slide outlines major types of attribution analysis methods aimed at helping businesses improve marketing ROI. It covers various types such as first touch, last touch, linear, time decay, custom and U shaped attribution The Types Of Attribution Analysis Models Product Analytics Implementation Data Analytics V is a compilation of the most recent design trends as a series of slides. It is suitable for any subject or industry presentation, containing attractive visuals and photo spots for businesses to clearly express their messages. This template contains a variety of slides for the user to input data, such as structures to contrast two elements, bullet points, and slides for written information. Slidegeeks is prepared to create an impression. This slide outlines major types of attribution analysis methods aimed at helping businesses improve marketing ROI. It covers various types such as first touch, last touch, linear, time decay, custom and U shaped attribution
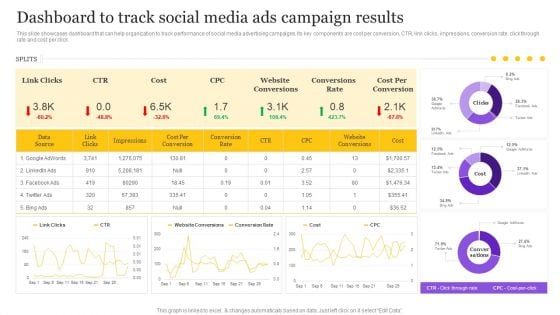
Digital Marketing Strategy Dashboard To Track Social Media Ads Campaign Results Introduction PDF
This slide showcases dashboard that can help organization to track performance of social media advertising campaigns. Its key components are cost per conversion, CTR, link clicks, impressions, conversion rate, click through rate and cost per click. The Digital Marketing Strategy Dashboard To Track Social Media Ads Campaign Results Introduction PDF is a compilation of the most recent design trends as a series of slides. It is suitable for any subject or industry presentation, containing attractive visuals and photo spots for businesses to clearly express their messages. This template contains a variety of slides for the user to input data, such as structures to contrast two elements, bullet points, and slides for written information. Slidegeeks is prepared to create an impression.

Real Time Content Marketing Result Dashboard Ppt Infographic Template Example PDF
The following slide depicts real time content marketing KPI dashboard to monitor traffic flow and manage promotional efforts. It includes elements such as visitors by channel, conversion rate, search, direct, sessions, average time engaged etc. The Real Time Content Marketing Result Dashboard Ppt Infographic Template Example PDF is a compilation of the most recent design trends as a series of slides. It is suitable for any subject or industry presentation, containing attractive visuals and photo spots for businesses to clearly express their messages. This template contains a variety of slides for the user to input data, such as structures to contrast two elements, bullet points, and slides for written information. Slidegeeks is prepared to create an impression.
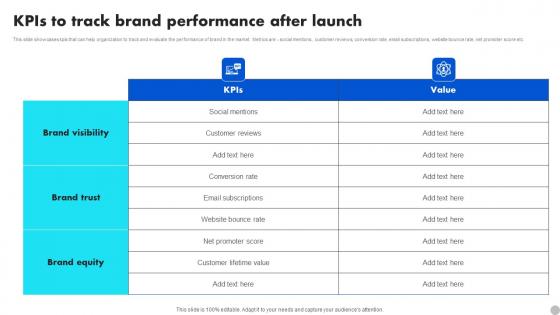
KPIS To Track Brand Performance After Launch Brand Diversification Approach Elements Pdf
This slide showcases kpis that can help organization to track and evaluate the performance of brand in the market. Metrics are social mentions, customer reviews, conversion rate, email subscriptions, website bounce rate, net promoter score etc. The KPIS To Track Brand Performance After Launch Brand Diversification Approach Elements Pdf is a compilation of the most recent design trends as a series of slides. It is suitable for any subject or industry presentation, containing attractive visuals and photo spots for businesses to clearly express their messages. This template contains a variety of slides for the user to input data, such as structures to contrast two elements, bullet points, and slides for written information. Slidegeeks is prepared to create an impression. This slide showcases kpis that can help organization to track and evaluate the performance of brand in the market. Metrics are social mentions, customer reviews, conversion rate, email subscriptions, website bounce rate, net promoter score etc.
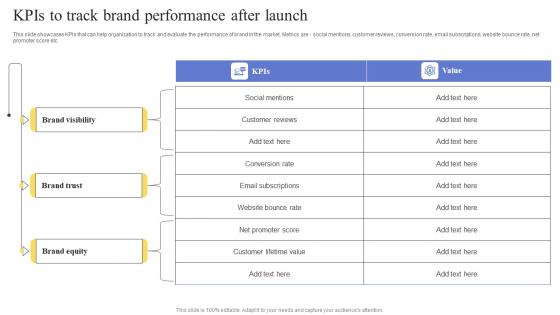
KPIS To Track Brand Performance After Launch Maximizing Revenue Using Demonstration Pdf
This slide showcases KPIs that can help organization to track and evaluate the performance of brand in the market. Metrics are - social mentions, customer reviews, conversion rate, email subscriptions, website bounce rate, net promoter score etc. The KPIS To Track Brand Performance After Launch Maximizing Revenue Using Demonstration Pdf is a compilation of the most recent design trends as a series of slides. It is suitable for any subject or industry presentation, containing attractive visuals and photo spots for businesses to clearly express their messages. This template contains a variety of slides for the user to input data, such as structures to contrast two elements, bullet points, and slides for written information. Slidegeeks is prepared to create an impression. This slide showcases KPIs that can help organization to track and evaluate the performance of brand in the market. Metrics are - social mentions, customer reviews, conversion rate, email subscriptions, website bounce rate, net promoter score etc.
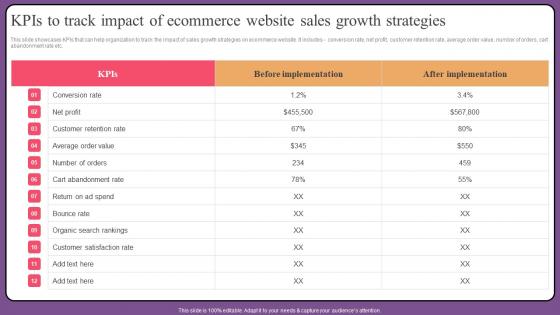
KPIs To Track Impact Of Ecommerce Website Sales Growth Strategies Rules Pdf
This slide showcases KPIs that can help organization to track the impact of sales growth strategies on ecommerce website. It includes conversion rate, net profit, customer retention rate, average order value, number of orders, cart abandonment rate etc. The KPIs To Track Impact Of Ecommerce Website Sales Growth Strategies Rules Pdf is a compilation of the most recent design trends as a series of slides. It is suitable for any subject or industry presentation, containing attractive visuals and photo spots for businesses to clearly express their messages. This template contains a variety of slides for the user to input data, such as structures to contrast two elements, bullet points, and slides for written information. Slidegeeks is prepared to create an impression. This slide showcases KPIs that can help organization to track the impact of sales growth strategies on ecommerce website. It includes conversion rate, net profit, customer retention rate, average order value, number of orders, cart abandonment rate etc.
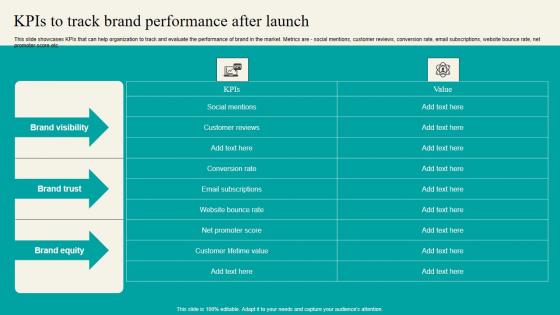
Kpis To Track Brand Performance After Launch Strategic Marketing Plan Summary PDF
This slide showcases KPIs that can help organization to track and evaluate the performance of brand in the market. Metrics are - social mentions, customer reviews, conversion rate, email subscriptions, website bounce rate, net promoter score etc. The Kpis To Track Brand Performance After Launch Strategic Marketing Plan Summary PDF is a compilation of the most recent design trends as a series of slides. It is suitable for any subject or industry presentation, containing attractive visuals and photo spots for businesses to clearly express their messages. This template contains a variety of slides for the user to input data, such as structures to contrast two elements, bullet points, and slides for written information. Slidegeeks is prepared to create an impression. This slide showcases KPIs that can help organization to track and evaluate the performance of brand in the market. Metrics are - social mentions, customer reviews, conversion rate, email subscriptions, website bounce rate, net promoter score etc.
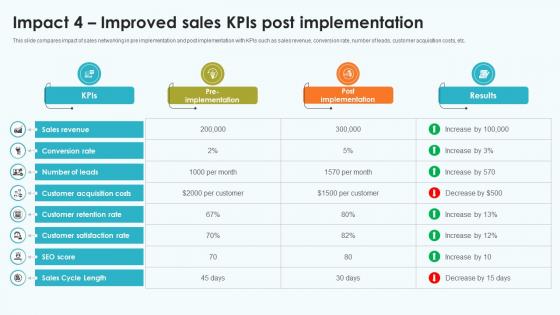
Elevating Sales Networks Impact 4 Improved Sales Kpis Post Implementation SA SS V
This slide compares impact of sales networking in pre implementation and post implementation with KPIs such as sales revenue, conversion rate, number of leads, customer acquisition costs, etc. The Elevating Sales Networks Impact 4 Improved Sales Kpis Post Implementation SA SS V is a compilation of the most recent design trends as a series of slides. It is suitable for any subject or industry presentation, containing attractive visuals and photo spots for businesses to clearly express their messages. This template contains a variety of slides for the user to input data, such as structures to contrast two elements, bullet points, and slides for written information. Slidegeeks is prepared to create an impression. This slide compares impact of sales networking in pre implementation and post implementation with KPIs such as sales revenue, conversion rate, number of leads, customer acquisition costs, etc.

Optimization Of IoT Remote Monitoring Smart Displays Used For Controlling Other Devices And Applications IoT SS V
This slide provides an overview of the smart displays used in smart homes to monitor home activities. It further includes popular brands and factors to consider that are usage, size, resolution, cost, sound quality and energy use. The Optimization Of IoT Remote Monitoring Smart Displays Used For Controlling Other Devices And Applications IoT SS V is a compilation of the most recent design trends as a series of slides. It is suitable for any subject or industry presentation, containing attractive visuals and photo spots for businesses to clearly express their messages. This template contains a variety of slides for the user to input data, such as structures to contrast two elements, bullet points, and slides for written information. Slidegeeks is prepared to create an impression. This slide provides an overview of the smart displays used in smart homes to monitor home activities. It further includes popular brands and factors to consider that are usage, size, resolution, cost, sound quality and energy use.
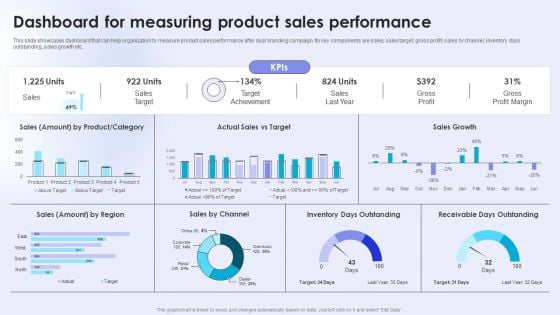
Dual Branding Campaign To Boost Sales Of Product Or Services Dashboard For Measuring Product Sales Elements PDF
This slide showcases dashboard that can help organization to measure product sales performance after dual branding campaign. Its key components are sales, sales target, gross profit, sales by channel, inventory days outstanding, sales growth etc. The Dual Branding Campaign To Boost Sales Of Product Or Services Dashboard For Measuring Product Sales Elements PDF is a compilation of the most recent design trends as a series of slides. It is suitable for any subject or industry presentation, containing attractive visuals and photo spots for businesses to clearly express their messages. This template contains a variety of slides for the user to input data, such as structures to contrast two elements, bullet points, and slides for written information. Slidegeeks is prepared to create an impression.
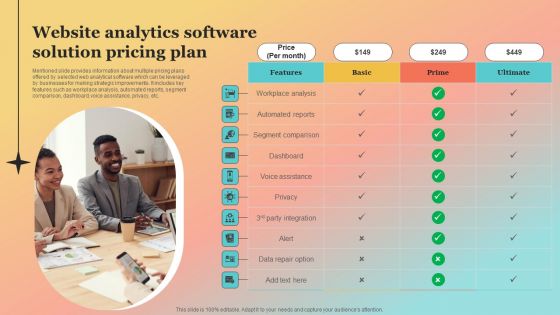
New Website Launch Strategy Website Analytics Software Solution Pricing Plan Microsoft PDF
Mentioned slide provides information about multiple pricing plans offered by selected web analytical software which can be leveraged by businesses for making strategic improvements. It includes key features such as workplace analysis, automated reports, segment comparison, dashboard, voice assistance, privacy, etc. The New Website Launch Strategy Website Analytics Software Solution Pricing Plan Microsoft PDF is a compilation of the most recent design trends as a series of slides. It is suitable for any subject or industry presentation, containing attractive visuals and photo spots for businesses to clearly express their messages. This template contains a variety of slides for the user to input data, such as structures to contrast two elements, bullet points, and slides for written information. Slidegeeks is prepared to create an impression.
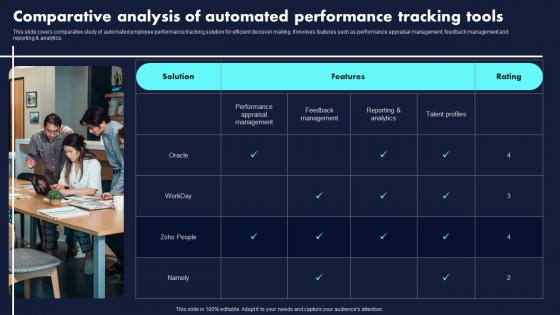
Comparative Analysis Of Automated Proven Techniques For Enhancing Infographics Pdf
This slide covers comparative study of automated employee performance tracking solution for efficient decision making. It involves features such as performance appraisal management, feedback management and reporting analytics.The Comparative Analysis Of Automated Proven Techniques For Enhancing Infographics Pdf is a compilation of the most recent design trends as a series of slides. It is suitable for any subject or industry presentation, containing attractive visuals and photo spots for businesses to clearly express their messages. This template contains a variety of slides for the user to input data, such as structures to contrast two elements, bullet points, and slides for written information. Slidegeeks is prepared to create an impression. This slide covers comparative study of automated employee performance tracking solution for efficient decision making. It involves features such as performance appraisal management, feedback management and reporting analytics.
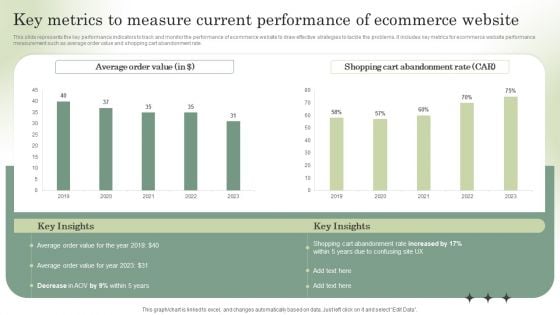
Optimizing Online Stores Key Metrics To Measure Current Performance Download PDF
This slide represents the key performance indicators to track and monitor the performance of ecommerce website to draw effective strategies to tackle the problems. It includes key metrics for ecommerce website performance measurement such as average order value and shopping cart abandonment rate. The Optimizing Online Stores Key Metrics To Measure Current Performance Download PDF is a compilation of the most recent design trends as a series of slides. It is suitable for any subject or industry presentation, containing attractive visuals and photo spots for businesses to clearly express their messages. This template contains a variety of slides for the user to input data, such as structures to contrast two elements, bullet points, and slides for written information. Slidegeeks is prepared to create an impression.
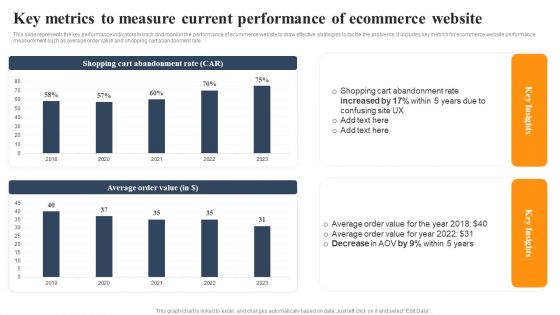
Implementing An Effective Ecommerce Management Framework Key Metrics Current Performance Of Ecommerce Website Slides PDF
This slide represents the key performance indicators to track and monitor the performance of ecommerce website to draw effective strategies to tackle the problems. It includes key metrics for ecommerce website performance measurement such as average order value and shopping cart abandonment rate. The Implementing An Effective Ecommerce Management Framework Key Metrics Current Performance Of Ecommerce Website Slides PDF is a compilation of the most recent design trends as a series of slides. It is suitable for any subject or industry presentation, containing attractive visuals and photo spots for businesses to clearly express their messages. This template contains a variety of slides for the user to input data, such as structures to contrast two elements, bullet points, and slides for written information. Slidegeeks is prepared to create an impression.

Key Requirements For IoT Analytics Storage Internet Of Things Analysis Clipart Pdf
This slide outlines two of the key requirement of IoT analytics which are storage and processing. The purpose of this slide is to explains where data is stored and how processing is conducted over servers. The Key Requirements For IoT Analytics Storage Internet Of Things Analysis Clipart Pdf is a compilation of the most recent design trends as a series of slides. It is suitable for any subject or industry presentation, containing attractive visuals and photo spots for businesses to clearly express their messages. This template contains a variety of slides for the user to input data, such as structures to contrast two elements, bullet points, and slides for written information. Slidegeeks is prepared to create an impression. This slide outlines two of the key requirement of IoT analytics which are storage and processing. The purpose of this slide is to explains where data is stored and how processing is conducted over servers.

Next Step For Land And Building Photography Service Proposal Ppt Outline Example PDF
The following slide displays the next step that the organization has to take once the land and building photography service proposal has been signed. It covers discussion for project and project, acceptance of proposal etc. The Next Step For Land And Building Photography Service Proposal Ppt Outline Example PDF is a compilation of the most recent design trends as a series of slides. It is suitable for any subject or industry presentation, containing attractive visuals and photo spots for businesses to clearly express their messages. This template contains a variety of slides for the user to input data, such as structures to contrast two elements, bullet points, and slides for written information. Slidegeeks is prepared to create an impression.
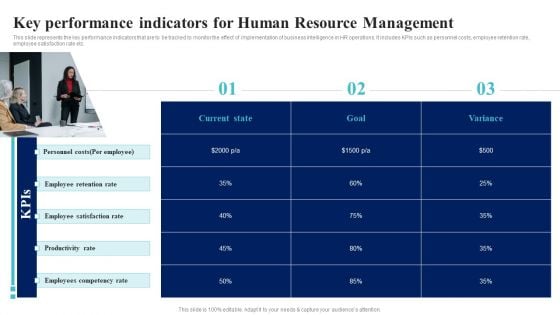
BI Implementation To Enhance Hiring Process Key Performance Indicators For Human Resource Management Summary PDF
This slide represents the key performance indicators that are to be tracked to monitor the effect of implementation of business intelligence in HR operations. It includes KPIs such as personnel costs, employee retention rate, employee satisfaction rate etc.The BI Implementation To Enhance Hiring Process Key Performance Indicators For Human Resource Management Summary PDF is a compilation of the most recent design trends as a series of slides. It is suitable for any subject or industry presentation, containing attractive visuals and photo spots for businesses to clearly express their messages. This template contains a variety of slides for the user to input data, such as structures to contrast two elements, bullet points, and slides for written information. Slidegeeks is prepared to create an impression.
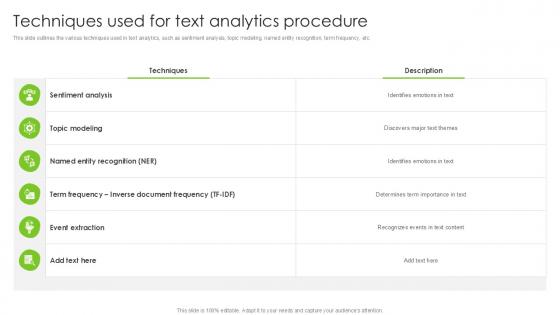
Techniques Used For Text Analytics Procedure PPT Presentation SS
This slide outlines the various techniques used in text analytics, such as sentiment analysis, topic modeling, named entity recognition, term frequency, etc. The Techniques Used For Text Analytics Procedure PPT Presentation SS is a compilation of the most recent design trends as a series of slides. It is suitable for any subject or industry presentation, containing attractive visuals and photo spots for businesses to clearly express their messages. This template contains a variety of slides for the user to input data, such as structures to contrast two elements, bullet points, and slides for written information. Slidegeeks is prepared to create an impression. This slide outlines the various techniques used in text analytics, such as sentiment analysis, topic modeling, named entity recognition, term frequency, etc.
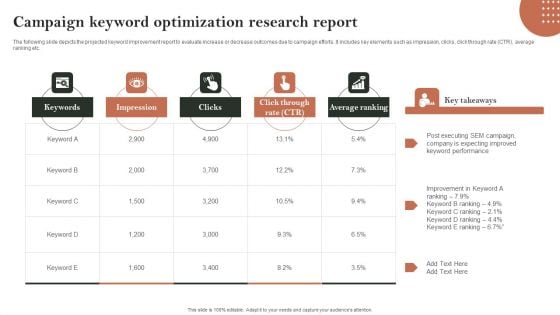
Search Engine Marketing Campaign Keyword Optimization Research Report Pictures PDF
The following slide depicts the projected keyword improvement report to evaluate increase or decrease outcomes due to campaign efforts. It includes key elements such as impression, clicks, click through rate CTR, average ranking etc. The Search Engine Marketing Campaign Keyword Optimization Research Report Pictures PDF is a compilation of the most recent design trends as a series of slides. It is suitable for any subject or industry presentation, containing attractive visuals and photo spots for businesses to clearly express their messages. This template contains a variety of slides for the user to input data, such as structures to contrast two elements, bullet points, and slides for written information. Slidegeeks is prepared to create an impression.

Actual Time Transaction Monitoring Software And Strategies Numerous Types Of Transaction Monitoring Ideas PDF
This slide illustrates various types of transaction monitoring technologies. It provides information about suspicious activity reports SARs, adverse media monitoring solution, customer due diligence solution, transaction monitoring screening solution, etc. The Actual Time Transaction Monitoring Software And Strategies Numerous Types Of Transaction Monitoring Ideas PDF is a compilation of the most recent design trends as a series of slides. It is suitable for any subject or industry presentation, containing attractive visuals and photo spots for businesses to clearly express their messages. This template contains a variety of slides for the user to input data, such as structures to contrast two elements, bullet points, and slides for written information. Slidegeeks is prepared to create an impression.
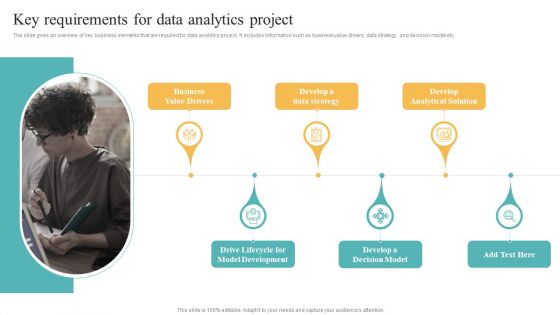
Transformation Toolkit Competitive Intelligence Information Analysis Key Requirements For Data Analytics Project Formats PDF
The slide gives an overview of key business elements that are required for data analytics project. It includes information such as business value drivers, data strategy, and decision model etc. The Transformation Toolkit Competitive Intelligence Information Analysis Key Requirements For Data Analytics Project Formats PDF is a compilation of the most recent design trends as a series of slides. It is suitable for any subject or industry presentation, containing attractive visuals and photo spots for businesses to clearly express their messages. This template contains a variety of slides for the user to input data, such as structures to contrast two elements, bullet points, and slides for written information. Slidegeeks is prepared to create an impression.

Marketers Guide To Data Analysis Optimization Introduction To SEO Analytics For Improving Websites Organic Structure PDF
This slide covers an overview of search engine optimization analytics. It also includes steps to perform website SEO analytics, such as checking the speed of your website, identifying your key competitors, analyzing best-performing pages, performing a competition backlink profile analysis, etc. The Marketers Guide To Data Analysis Optimization Introduction To SEO Analytics For Improving Websites Organic Structure PDF is a compilation of the most recent design trends as a series of slides. It is suitable for any subject or industry presentation, containing attractive visuals and photo spots for businesses to clearly express their messages. This template contains a variety of slides for the user to input data, such as structures to contrast two elements, bullet points, and slides for written information. Slidegeeks is prepared to create an impression.
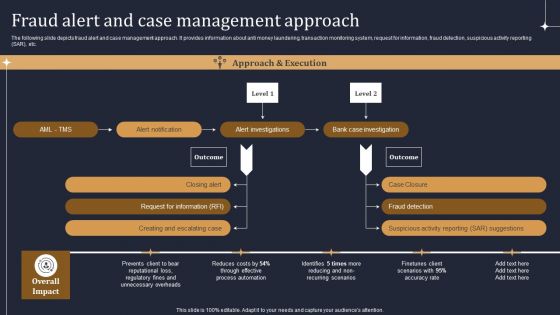
KYC Transaction Monitoring System Business Security Fraud Alert And Case Management Approach Diagrams PDF
The following slide depicts fraud alert and case management approach. It provides information about anti money laundering, transaction monitoring system, request for information, fraud detection, suspicious activity reporting SAR, etc. The KYC Transaction Monitoring System Business Security Fraud Alert And Case Management Approach Diagrams PDF is a compilation of the most recent design trends as a series of slides. It is suitable for any subject or industry presentation, containing attractive visuals and photo spots for businesses to clearly express their messages. This template contains a variety of slides for the user to input data, such as structures to contrast two elements, bullet points, and slides for written information. Slidegeeks is prepared to create an impression.
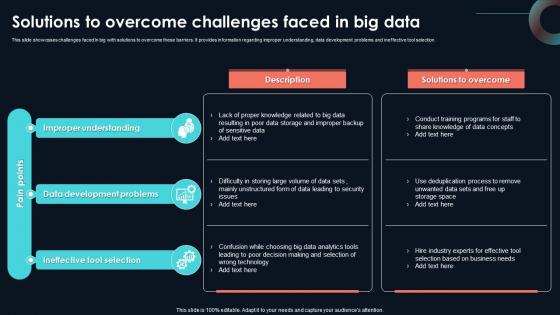
Solutions To Overcome Challenges Faced Developing Strategic Insights Using Big Data Analytics SS V
This slide showcases challenges faced In big with solutions to overcome these barriers. It provides information regarding improper understanding, data development problems and ineffective tool selection. The Solutions To Overcome Challenges Faced Developing Strategic Insights Using Big Data Analytics SS V is a compilation of the most recent design trends as a series of slides. It is suitable for any subject or industry presentation, containing attractive visuals and photo spots for businesses to clearly express their messages. This template contains a variety of slides for the user to input data, such as structures to contrast two elements, bullet points, and slides for written information. Slidegeeks is prepared to create an impression. This slide showcases challenges faced In big with solutions to overcome these barriers. It provides information regarding improper understanding, data development problems and ineffective tool selection.
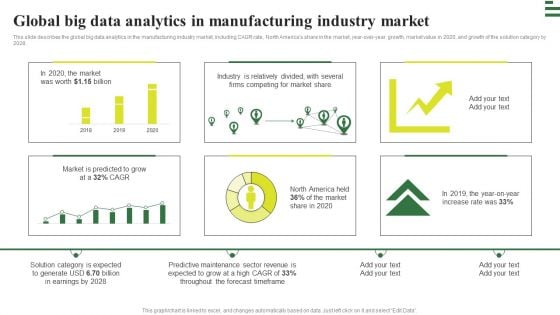
Transforming Manufacturing With Automation Global Big Data Analytics Rules PDF
This slide describes the global big data analytics in the manufacturing industry market, including CAGR rate, North Americas share in the market, year-over-year growth, market value in 2020, and growth of the solution category by 2028. Are you in need of a template that can accommodate all of your creative concepts This one is crafted professionally and can be altered to fit any style. Use it with Google Slides or PowerPoint. Include striking photographs, symbols, depictions, and other visuals. Fill, move around, or remove text boxes as desired. Test out color palettes and font mixtures. Edit and save your work, or work with colleagues. Download Transforming Manufacturing With Automation Global Big Data Analytics Rules PDF and observe how to make your presentation outstanding. Give an impeccable presentation to your group and make your presentation unforgettable.
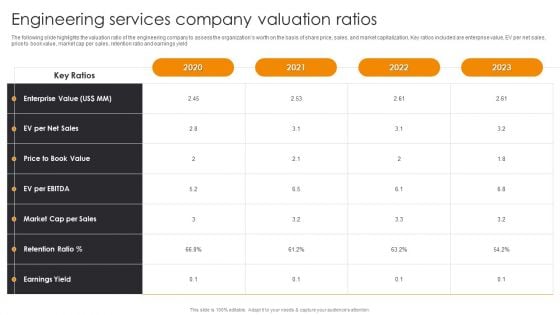
Engineering Services Company Valuation Ratios Engineering Company Financial Analysis Report Brochure PDF
The following slide highlights the valuation ratio of the engineering company to assess the organizations worth on the basis of share price, sales, and market capitalization, Key ratios included are enterprise value, EV per net sales, price to book value, market cap per sales, retention ratio and earnings yield. The Engineering Services Company Valuation Ratios Engineering Company Financial Analysis Report Brochure PDF is a compilation of the most recent design trends as a series of slides. It is suitable for any subject or industry presentation, containing attractive visuals and photo spots for businesses to clearly express their messages. This template contains a variety of slides for the user to input data, such as structures to contrast two elements, bullet points, and slides for written information. Slidegeeks is prepared to create an impression.
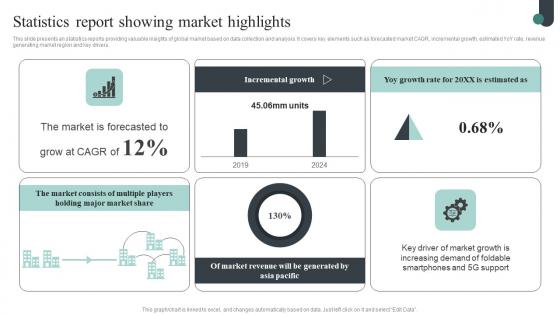
Competitive Intelligence Guide To Determine Market Statistics Report Showing Introduction Pdf
This slide presents an statistics reports providing valuable insights of global market based on data collection and analysis. It covers key elements such as forecasted market CAGR, incremental growth, estimated YoY rate, revenue generating market region and key drivers. The Competitive Intelligence Guide To Determine Market Statistics Report Showing Introduction Pdf is a compilation of the most recent design trends as a series of slides. It is suitable for any subject or industry presentation, containing attractive visuals and photo spots for businesses to clearly express their messages. This template contains a variety of slides for the user to input data, such as structures to contrast two elements, bullet points, and slides for written information. Slidegeeks is prepared to create an impression. This slide presents an statistics reports providing valuable insights of global market based on data collection and analysis. It covers key elements such as forecasted market CAGR, incremental growth, estimated YoY rate, revenue generating market region and key drivers.
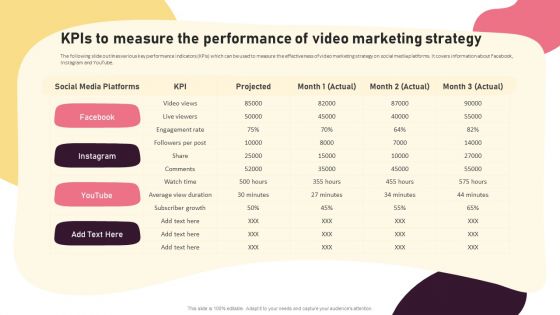
Video Promotion Techniques Kpis To Measure The Performance Of Video Marketing Designs PDF
The following slide outlines various key performance indicators KPIs which can be used to measure the effectiveness of video marketing strategy on social media platforms. It covers information about Facebook, Instagram and YouTube. The Video Promotion Techniques Kpis To Measure The Performance Of Video Marketing Designs PDF is a compilation of the most recent design trends as a series of slides. It is suitable for any subject or industry presentation, containing attractive visuals and photo spots for businesses to clearly express their messages. This template contains a variety of slides for the user to input data, such as structures to contrast two elements, bullet points, and slides for written information. Slidegeeks is prepared to create an impression.
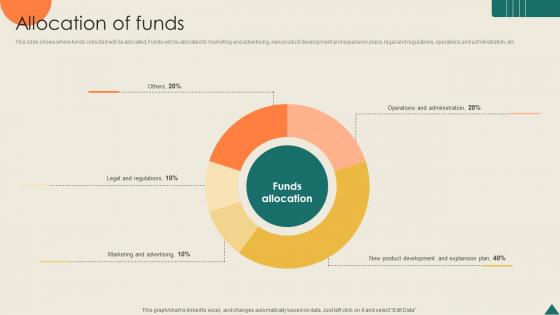
Allocation Of Funds Financial Analytics Platform Investor Elevator Pitch Deck
This slide shows where funds collected will be allocated. Funds will be allocated to marketing and advertising, new product development and expansion plans, legal and regulations, operations and administration, etc. The Allocation Of Funds Financial Analytics Platform Investor Elevator Pitch Deck is a compilation of the most recent design trends as a series of slides. It is suitable for any subject or industry presentation, containing attractive visuals and photo spots for businesses to clearly express their messages. This template contains a variety of slides for the user to input data, such as structures to contrast two elements, bullet points, and slides for written information. Slidegeeks is prepared to create an impression. This slide shows where funds collected will be allocated. Funds will be allocated to marketing and advertising, new product development and expansion plans, legal and regulations, operations and administration, etc.
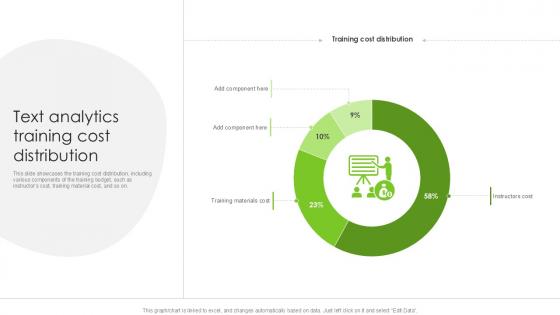
Text Analytics Training Cost Distribution PPT Sample SS
This slide showcases the training cost distribution, including various components of the training budget, such as instructors cost, training material cost, and so on. The Text Analytics Training Cost Distribution PPT Sample SS is a compilation of the most recent design trends as a series of slides. It is suitable for any subject or industry presentation, containing attractive visuals and photo spots for businesses to clearly express their messages. This template contains a variety of slides for the user to input data, such as structures to contrast two elements, bullet points, and slides for written information. Slidegeeks is prepared to create an impression. This slide showcases the training cost distribution, including various components of the training budget, such as instructors cost, training material cost, and so on.


 Continue with Email

 Home
Home


