Info Graphic
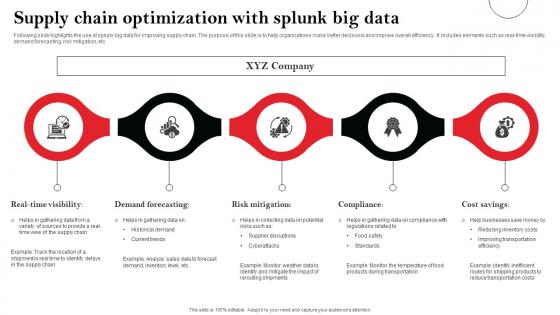
Supply Chain Optimization With Splunk Big Data Graphics Pdf
Following slide highlights the use of splunk big data for improving supply chain. The purpose of this slide is to help organizations make better decisions and improve overall efficiency. It includes elements such as real-time visibility, demand forecasting, risk mitigation, etc. Showcasing this set of slides titled Supply Chain Optimization With Splunk Big Data Graphics Pdf The topics addressed in these templates are Real-Time Visibility, Demand Forecasting, Risk Mitigation All the content presented in this PPT design is completely editable. Download it and make adjustments in color, background, font etc. as per your unique business setting. Following slide highlights the use of splunk big data for improving supply chain. The purpose of this slide is to help organizations make better decisions and improve overall efficiency. It includes elements such as real-time visibility, demand forecasting, risk mitigation, etc.
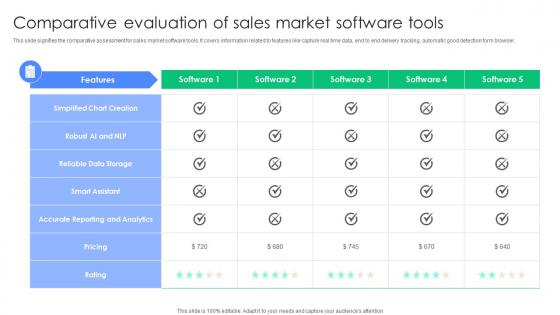
Comparative Evaluation Of Sales Market Software Tools Graphics Pdf
This slide signifies the comparative assessment for sales market software tools. It covers information related to features like capture real time data, end to end delivery tracking, automatic good detection form browser. Pitch your topic with ease and precision using this Comparative Evaluation Of Sales Market Software Tools Graphics Pdf. This layout presents information on Simplified Chart Creation, Robust AI NLP, Reliable Data Storage. It is also available for immediate download and adjustment. So, changes can be made in the color, design, graphics or any other component to create a unique layout. This slide signifies the comparative assessment for sales market software tools. It covers information related to features like capture real time data, end to end delivery tracking, automatic good detection form browser.
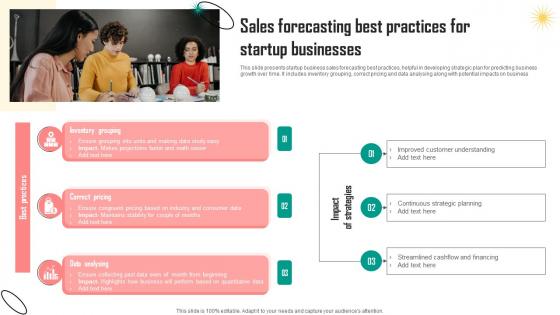
Sales Forecasting Best Practices For Startup Businesses Graphics Pdf
This slide presents startup business sales forecasting best practices, helpful in developing strategic plan for predicting business growth over time. It includes inventory grouping, correct pricing and data analysing along with potential impacts on business Pitch your topic with ease and precision using this Sales Forecasting Best Practices For Startup Businesses Graphics Pdf. This layout presents information on Inventory Grouping, Correct Pricing, Data Analysing. It is also available for immediate download and adjustment. So, changes can be made in the color, design, graphics or any other component to create a unique layout. This slide presents startup business sales forecasting best practices, helpful in developing strategic plan for predicting business growth over time. It includes inventory grouping, correct pricing and data analysing along with potential impacts on business
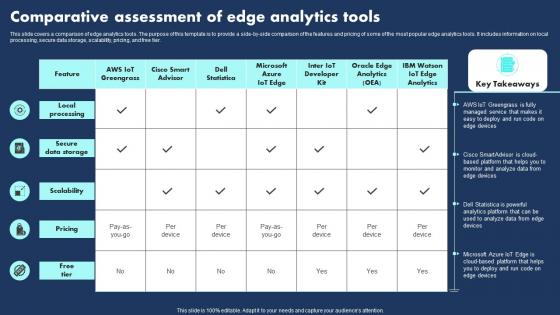
Comparative Assessment Of Edge Analytics Tools Graphics Pdf
This slide covers a comparison of edge analytics tools. The purpose of this template is to provide a side by side comparison of the features and pricing of some of the most popular edge analytics tools. It includes information on local processing, secure data storage, scalability, pricing, and free tier.Showcasing this set of slides titled Comparative Assessment Of Edge Analytics Tools Graphics Pdf The topics addressed in these templates are Local Processing, Secure Data Storage, Scalability All the content presented in this PPT design is completely editable. Download it and make adjustments in color, background, font etc. as per your unique business setting. This slide covers a comparison of edge analytics tools. The purpose of this template is to provide a side by side comparison of the features and pricing of some of the most popular edge analytics tools. It includes information on local processing, secure data storage, scalability, pricing, and free tier.
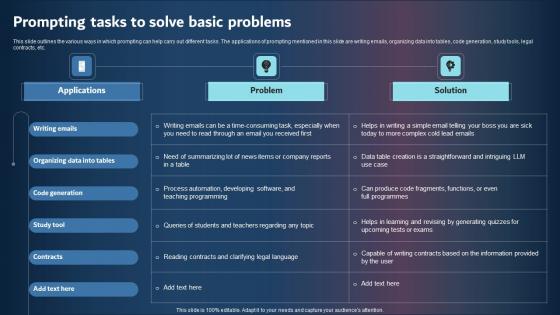
Prompting Tasks To Solve Basic Problems Graphics PDF
This slide outlines the various ways in which prompting can help carry out different tasks. The applications of prompting mentioned in this slide are writing emails, organizing data into tables, code generation, study tools, legal contracts, etc. From laying roadmaps to briefing everything in detail, our templates are perfect for you. You can set the stage with your presentation slides. All you have to do is download these easy-to-edit and customizable templates. Prompting Tasks To Solve Basic Problems Graphics Pdf will help you deliver an outstanding performance that everyone would remember and praise you for. Do download this presentation today. This slide outlines the various ways in which prompting can help carry out different tasks. The applications of prompting mentioned in this slide are writing emails, organizing data into tables, code generation, study tools, legal contracts, etc.
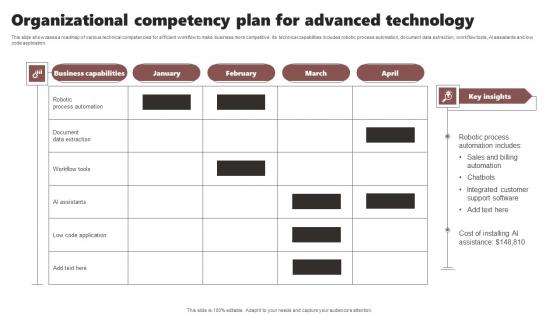
Organizational Competency Plan For Advanced Technology Graphics Pdf
This slide showcases a roadmap of various technical competencies for efficient workflow to make business more competitive. Its technical capabilities includes robotic process automation, document data extraction, workflow tools, AI assistants and low code application. Showcasing this set of slides titled Organizational Competency Plan For Advanced Technology Graphics Pdf. The topics addressed in these templates are Sales Billing Automation, Chatbots, Integrated Customer Support Software. All the content presented in this PPT design is completely editable. Download it and make adjustments in color, background, font etc. as per your unique business setting. This slide showcases a roadmap of various technical competencies for efficient workflow to make business more competitive. Its technical capabilities includes robotic process automation, document data extraction, workflow tools, AI assistants and low code application.
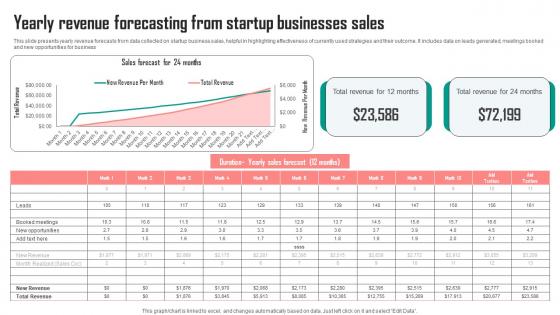
Yearly Revenue Forecasting From Startup Businesses Sales Graphics Pdf
This slide presents yearly revenue forecasts from data collected on startup business sales, helpful in highlighting effectiveness of currently used strategies and their outcome. It includes data on leads generated, meetings booked and new opportunities for business Pitch your topic with ease and precision using this Yearly Revenue Forecasting From Startup Businesses Sales Graphics Pdf. This layout presents information on Sales, Total Revenue, Months. It is also available for immediate download and adjustment. So, changes can be made in the color, design, graphics or any other component to create a unique layout. This slide presents yearly revenue forecasts from data collected on startup business sales, helpful in highlighting effectiveness of currently used strategies and their outcome. It includes data on leads generated, meetings booked and new opportunities for business
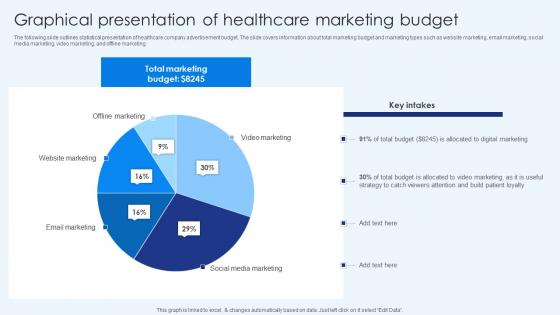
Graphical Presentation Of Healthcare Marketing Budget Healthcare Promotion Microsoft Pdf
The following slide outlines statistical presentation of healthcare company advertisement budget. The slide covers information about total marketing budget and marketing types such as website marketing, email marketing, social media marketing, video marketing, and offline marketing. If you are looking for a format to display your unique thoughts, then the professionally designed Graphical Presentation Of Healthcare Marketing Budget Healthcare Promotion Microsoft Pdf is the one for you. You can use it as a Google Slides template or a PowerPoint template. Incorporate impressive visuals, symbols, images, and other charts. Modify or reorganize the text boxes as you desire. Experiment with shade schemes and font pairings. Alter, share or cooperate with other people on your work. Download Graphical Presentation Of Healthcare Marketing Budget Healthcare Promotion Microsoft Pdf and find out how to give a successful presentation. Present a perfect display to your team and make your presentation unforgettable. The following slide outlines statistical presentation of healthcare company advertisement budget. The slide covers information about total marketing budget and marketing types such as website marketing, email marketing, social media marketing, video marketing, and offline marketing.
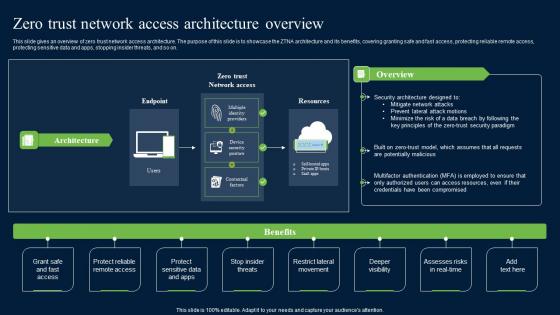
Zero Trust Network Security Access Architecture Overview Graphics Pdf
This slide gives an overview of zero trust network access architecture. The purpose of this slide is to showcase the ZTNA architecture and its benefits, covering granting safe and fast access, protecting reliable remote access, protecting sensitive data and apps, stopping insider threats, and so on. If your project calls for a presentation, then Slidegeeks is your go-to partner because we have professionally designed, easy-to-edit templates that are perfect for any presentation. After downloading, you can easily edit Zero Trust Network Security Access Architecture Overview Graphics Pdf and make the changes accordingly. You can rearrange slides or fill them with different images. Check out all the handy templates This slide gives an overview of zero trust network access architecture. The purpose of this slide is to showcase the ZTNA architecture and its benefits, covering granting safe and fast access, protecting reliable remote access, protecting sensitive data and apps, stopping insider threats, and so on.

Statistics Highlighting Monthly Goals Achieved By Production Department Graphics Pdf
Mentioned slide demonstrates monthly production goals accomplished by production and operations department. It includes key elements such as target units to be produced and actual goods produced by business. Showcasing this set of slides titled Statistics Highlighting Monthly Goals Achieved By Production Department Graphics Pdf. The topics addressed in these templates are Goods Produced. All the content presented in this PPT design is completely editable. Download it and make adjustments in color, background, font etc. as per your unique business setting. Mentioned slide demonstrates monthly production goals accomplished by production and operations department. It includes key elements such as target units to be produced and actual goods produced by business.
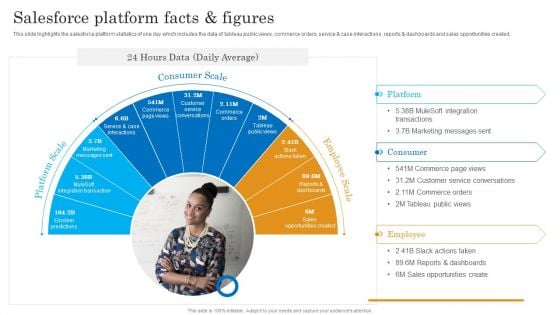
Salesforce Platform Facts AND Figures Salesforce Business Profile Graphics PDF
This slide highlights the salesforce platform statistics of one day which includes the data of tableau public views, commerce orders, service and case interactions, reports and dashboards and sales opportunities created. Presenting Salesforce Platform Facts AND Figures Salesforce Business Profile Graphics PDF to provide visual cues and insights. Share and navigate important information on three stages that need your due attention. This template can be used to pitch topics like Platform Scale, Consumer Scale, Employee Scale. In addtion, this PPT design contains high resolution images, graphics, etc, that are easily editable and available for immediate download.
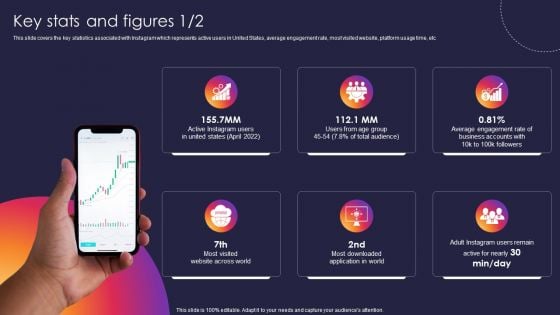
Instagram Company Details Key Stats And Figures Graphics PDF
This slide covers the key statistics associated with Instagram which represents active users in United States, average engagement rate, most visited website, platform usage time, etc. Presenting Instagram Company Details Key Stats And Figures Graphics PDF to provide visual cues and insights. Share and navigate important information on six stages that need your due attention. This template can be used to pitch topics like Average, Business Accounts, Application. In addtion, this PPT design contains high resolution images, graphics, etc, that are easily editable and available for immediate download.
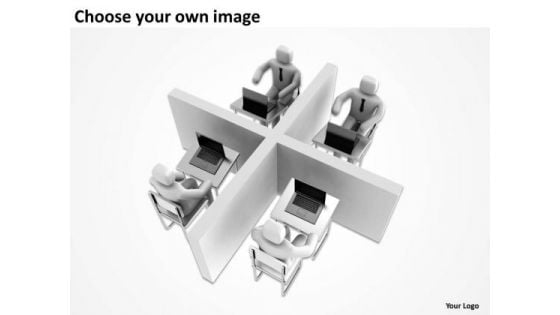
PowerPoint Graphics Business 3d Blue Men Communication Slides
We present our powerpoint graphics business 3d blue men communication Slides.Use our People PowerPoint Templates because Our PowerPoint Templates and Slides are topically designed to provide an attractive backdrop to any subject. Download our Business PowerPoint Templates because Our PowerPoint Templates and Slides come in all colours, shades and hues. They help highlight every nuance of your views. Use our Computer PowerPoint Templates because Our PowerPoint Templates and Slides offer you the needful to organise your thoughts. Use them to list out your views in a logical sequence. Download our Communication PowerPoint Templates because Our PowerPoint Templates and Slides will steer your racing mind. Hit the right buttons and spur on your audience. Present our Internet PowerPoint Templates because Our PowerPoint Templates and Slides will help you be quick off the draw. Just enter your specific text and see your points hit home.Use these PowerPoint slides for presentations relating to 3d, business, businessman, call, call-center, center, character, communicate, communication, company, computer, computing, concept, conference, connect, contact, cooperation, corporate, customer, dispatcher, figure, gray, headphone, headset, help, helpdesk, human, illustration, info, information, internet, isolated, leadership, man, manager, microphone, news, person, phone, professional, render, service, support, team, teamwork, together, white, work, worker. The prominent colors used in the PowerPoint template are Blue, Gray, Black. The feedback we get is that our powerpoint graphics business 3d blue men communication Slides are effectively colour coded to prioritise your plans They automatically highlight the sequence of events you desire. Customers tell us our call-center PowerPoint templates and PPT Slides are aesthetically designed to attract attention. We guarantee that they will grab all the eyeballs you need. The feedback we get is that our powerpoint graphics business 3d blue men communication Slides effectively help you save your valuable time. Professionals tell us our communication PowerPoint templates and PPT Slides are designed by professionals Presenters tell us our powerpoint graphics business 3d blue men communication Slides are visually appealing. You can be sure our character PowerPoint templates and PPT Slides are topically designed to provide an attractive backdrop to any subject. Get on the boat with our PowerPoint Graphics Business 3d Blue Men Communication Slides. Get your views ferried across.
Graphical Representation Of Data Using Statistical Data Measures Elements PDF
Persuade your audience using this graphical representation of data using statistical data measures elements pdf. This PPT design covers four stages, thus making it a great tool to use. It also caters to a variety of topics including graphical representation of data using statistical data measures. Download this PPT design now to present a convincing pitch that not only emphasizes the topic but also showcases your presentation skills.
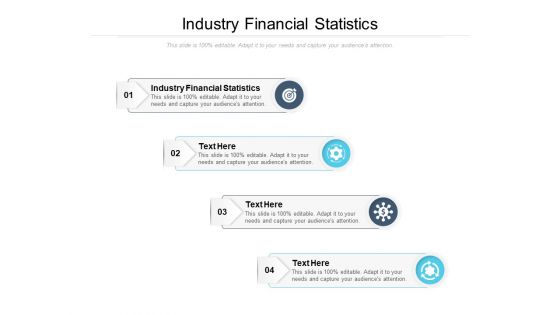
Industry Financial Statistics Ppt PowerPoint Presentation Model Graphics Cpb
Presenting this set of slides with name industry financial statistics ppt powerpoint presentation model graphics cpb. This is an editable Powerpoint four stages graphic that deals with topics like industry financial statistics to help convey your message better graphically. This product is a premium product available for immediate download and is 100 percent editable in Powerpoint. Download this now and use it in your presentations to impress your audience.
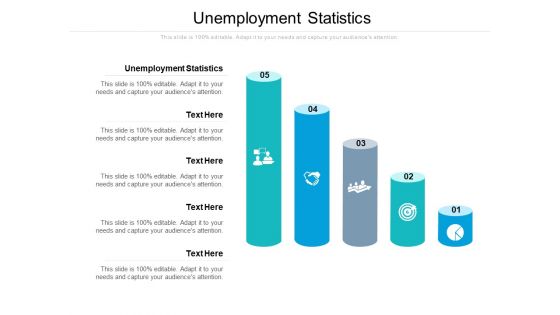
Unemployment Statistics Ppt PowerPoint Presentation Pictures Graphics Template Cpb Pdf
Presenting this set of slides with name unemployment statistics ppt powerpoint presentation pictures graphics template cpb pdf. This is an editable Powerpoint five stages graphic that deals with topics like unemployment statistics to help convey your message better graphically. This product is a premium product available for immediate download and is 100 percent editable in Powerpoint. Download this now and use it in your presentations to impress your audience.
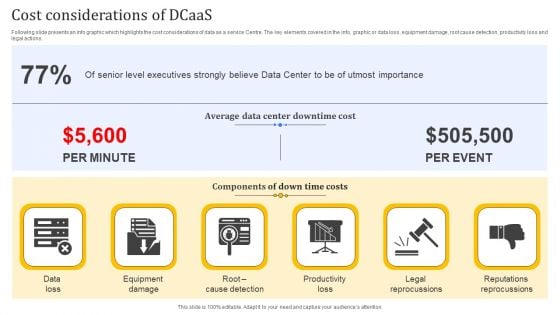
Cost Considerations Of Dcaas Summary PDF
Following slide presents an info graphic which highlights the cost considerations of data as a service Centre. The key elements covered in the info, graphic or data loss, equipment damage, root cause detection, productivity loss and legal actions. Showcasing this set of slides titled Cost Considerations Of Dcaas Summary PDF. The topics addressed in these templates are Equipment Damage, Productivity Loss, Legal Reprocussions. All the content presented in this PPT design is completely editable. Download it and make adjustments in color, background, font etc. as per your unique business setting.
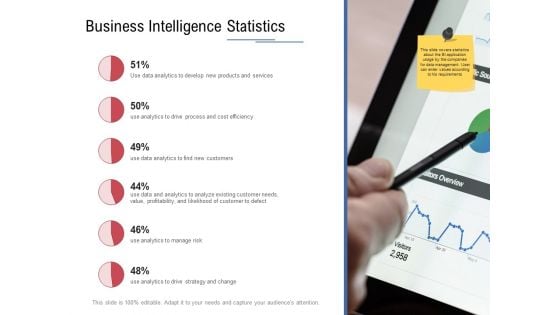
Data Assimilation Business Intelligence Statistics Ppt Slides Graphics Design PDF
This is a data assimilation business intelligence statistics ppt slides graphics design pdf template with various stages. Focus and dispense information on six stages using this creative set, that comes with editable features. It contains large content boxes to add your information on topics like data analytics, develop, services, efficiency, cost. You can also showcase facts, figures, and other relevant content using this PPT layout. Grab it now.
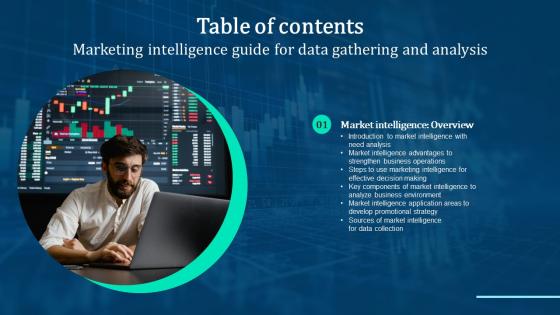
Marketing Intelligence Guide Data Gathering Table Of Contents Graphics Pdf
Slidegeeks has constructed Marketing Intelligence Guide Data Gathering Table Of Contents Graphics Pdf after conducting extensive research and examination. These presentation templates are constantly being generated and modified based on user preferences and critiques from editors. Here, you will find the most attractive templates for a range of purposes while taking into account ratings and remarks from users regarding the content. This is an excellent jumping off point to explore our content and will give new users an insight into our top notch PowerPoint Templates. Our Marketing Intelligence Guide Data Gathering Table Of Contents Graphics Pdf are topically designed to provide an attractive backdrop to any subject. Use them to look like a presentation pro.
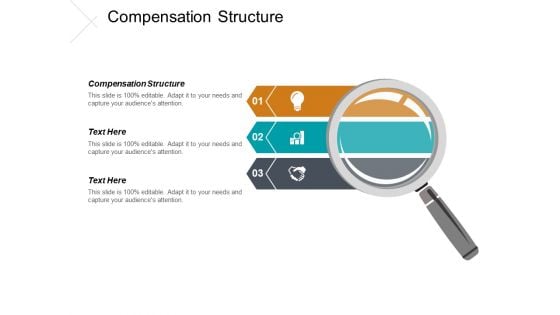
Compensation Structure Ppt PowerPoint Presentation Styles Graphics Example Cpb
This is a compensation structure ppt powerpoint presentation styles graphics example cpb. This is a three stage process. The stages in this process are compensation structure.
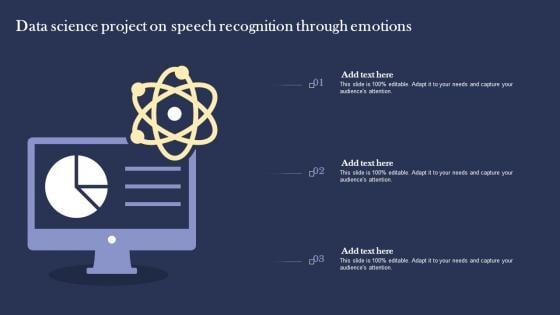
Data Science Project On Speech Recognition Through Emotions Graphics pdf
Pitch your topic with ease and precision using this Data Science Project On Speech Recognition Through Emotions Graphics pdf. This layout presents information on Data Science, Project Speech Recognition, Through Emotions. It is also available for immediate download and adjustment. So, changes can be made in the color, design, graphics or any other component to create a unique layout. Our Data Science Project On Speech Recognition Through Emotions Graphics pdf are topically designed to provide an attractive backdrop to any subject. Use them to look like a presentation pro.
Data Management Maturity Framework For Target Operating Model Graphics Pdf
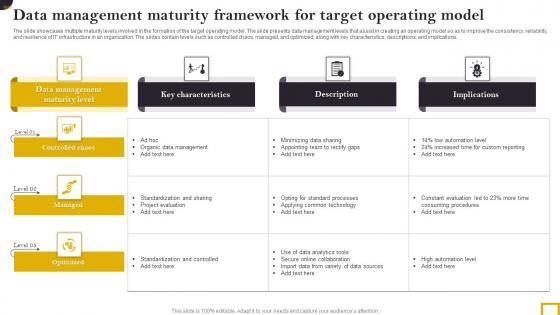
The slide showcases multiple maturity levels involved in the formation of the target operating model. The slide presents data management levels that assist in creating an operating model so as to improve the consistency, reliability, and resilience of IT infrastructure in an organization. The slides contain levels such as controlled chaos, managed, and optimized, along with key characteristics, descriptions, and implications. Pitch your topic with ease and precision using this Data Management Maturity Framework For Target Operating Model Graphics Pdf. This layout presents information on Key Characteristics, Descriptions, Implications. It is also available for immediate download and adjustment. So, changes can be made in the color, design, graphics or any other component to create a unique layout. The slide showcases multiple maturity levels involved in the formation of the target operating model. The slide presents data management levels that assist in creating an operating model so as to improve the consistency, reliability, and resilience of IT infrastructure in an organization. The slides contain levels such as controlled chaos, managed, and optimized, along with key characteristics, descriptions, and implications.
Demographic Statistics Icon Presenting Statistics Of People Graphics PDF
Showcasing this set of slides titled Demographic Statistics Icon Presenting Statistics Of People Graphics PDF. The topics addressed in these templates are Demographic Statistics, Icon Presenting, Statistic People. All the content presented in this PPT design is completely editable. Download it and make adjustments in color, background, font etc. as per your unique business setting.
Cloud Cryptography Challenges Cloud Data Security Using Cryptography Graphics Pdf
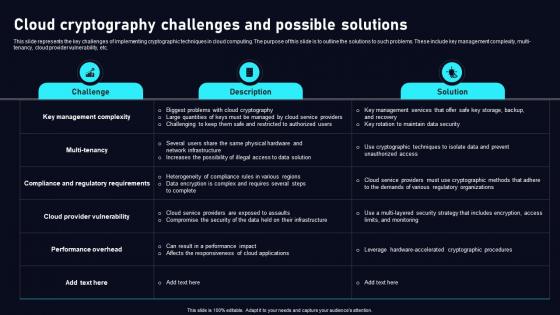
This slide represents the key challenges of implementing cryptographic techniques in cloud computing. The purpose of this slide is to outline the solutions to such problems. These include key management complexity, multi tenancy, cloud provider vulnerability, etc. Crafting an eye catching presentation has never been more straightforward. Let your presentation shine with this tasteful yet straightforward Cloud Cryptography Challenges Cloud Data Security Using Cryptography Graphics Pdf template. It offers a minimalistic and classy look that is great for making a statement. The colors have been employed intelligently to add a bit of playfulness while still remaining professional. Construct the ideal Cloud Cryptography Challenges Cloud Data Security Using Cryptography Graphics Pdf that effortlessly grabs the attention of your audience Begin now and be certain to wow your customers This slide represents the key challenges of implementing cryptographic techniques in cloud computing. The purpose of this slide is to outline the solutions to such problems. These include key management complexity, multi tenancy, cloud provider vulnerability, etc.
Data Breach Prevention Services Provided Data Breach Prevention Graphics Pdf
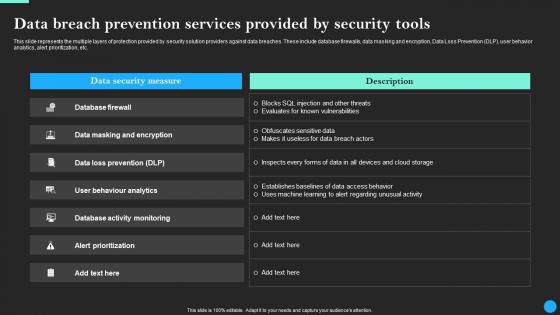
This slide represents the multiple layers of protection provided by security solution providers against data breaches. These include database firewalls, data masking and encryption, Data Loss Prevention DLP, user behavior analytics, alert prioritization, etc. Are you in need of a template that can accommodate all of your creative concepts This one is crafted professionally and can be altered to fit any style. Use it with Google Slides or PowerPoint. Include striking photographs, symbols, depictions, and other visuals. Fill, move around, or remove text boxes as desired. Test out color palettes and font mixtures. Edit and save your work, or work with colleagues. Download Data Breach Prevention Services Provided Data Breach Prevention Graphics Pdfand observe how to make your presentation outstanding. Give an impeccable presentation to your group and make your presentation unforgettable. This slide represents the multiple layers of protection provided by security solution providers against data breaches. These include database firewalls, data masking and encryption, Data Loss Prevention DLP, user behavior analytics, alert prioritization, etc.
Data Security Protection Ppt PowerPoint Presentation Icon Graphics Download Cpb
Presenting this set of slides with name data security protection ppt powerpoint presentation icon graphics download cpb. This is an editable Powerpoint three stages graphic that deals with topics like data security protection to help convey your message better graphically. This product is a premium product available for immediate download and is 100 percent editable in Powerpoint. Download this now and use it in your presentations to impress your audience.
Data Acquisitions Ppt PowerPoint Presentation Professional Graphics Cpb
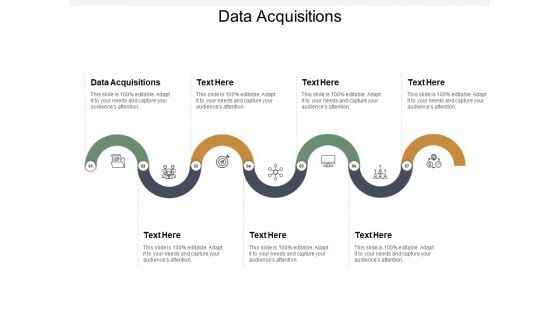
Presenting this set of slides with name data acquisitions ppt powerpoint presentation professional graphics cpb. This is an editable Powerpoint seven stages graphic that deals with topics like data acquisitions to help convey your message better graphically. This product is a premium product available for immediate download and is 100 percent editable in Powerpoint. Download this now and use it in your presentations to impress your audience.
Ability Analyse Data Ppt PowerPoint Presentation Portfolio Graphics Cpb
Presenting this set of slides with name ability analyse data ppt powerpoint presentation portfolio graphics cpb. This is an editable Powerpoint four stages graphic that deals with topics like ability analyse data to help convey your message better graphically. This product is a premium product available for immediate download and is 100 percent editable in Powerpoint. Download this now and use it in your presentations to impress your audience.
Internet Things Data Storage Ppt PowerPoint Presentation Layouts Graphics Cpb
Presenting this set of slides with name internet things data storage ppt powerpoint presentation layouts graphics cpb. This is an editable Powerpoint five stages graphic that deals with topics like internet things data storage to help convey your message better graphically. This product is a premium product available for immediate download and is 100 percent editable in Powerpoint. Download this now and use it in your presentations to impress your audience.
Data Analysis Research Methodology Ppt PowerPoint Presentation Model Graphics Cpb
Presenting this set of slides with name data analysis research methodology ppt powerpoint presentation model graphics cpb. This is an editable Powerpoint six stages graphic that deals with topics like data analysis research methodology to help convey your message better graphically. This product is a premium product available for immediate download and is 100 percent editable in Powerpoint. Download this now and use it in your presentations to impress your audience.
Data Cleansing Quality Ppt PowerPoint Presentation Icon Graphics Design Cpb
Presenting this set of slides with name data cleansing quality ppt powerpoint presentation icon graphics design cpb. This is an editable Powerpoint four stages graphic that deals with topics like data cleansing quality to help convey your message better graphically. This product is a premium product available for immediate download and is 100 percent editable in Powerpoint. Download this now and use it in your presentations to impress your audience.
Data Center Components Ppt PowerPoint Presentation Professional Graphics Download Cpb
Presenting this set of slides with name data center components ppt powerpoint presentation professional graphics download cpb. This is an editable Powerpoint four stages graphic that deals with topics like data center components to help convey your message better graphically. This product is a premium product available for immediate download and is 100 percent editable in Powerpoint. Download this now and use it in your presentations to impress your audience.
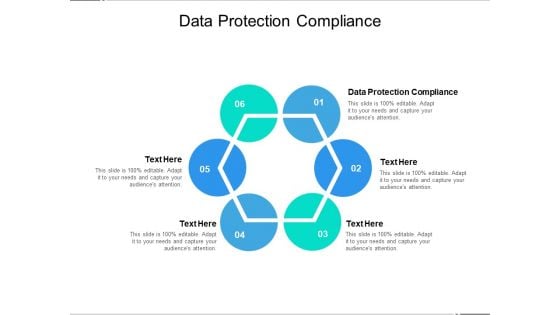
Data Protection Compliance Ppt PowerPoint Presentation Pictures Graphics Template Cpb
Presenting this set of slides with name data protection compliance ppt powerpoint presentation pictures graphics template cpb. This is an editable Powerpoint six stages graphic that deals with topics like data protection compliance to help convey your message better graphically. This product is a premium product available for immediate download and is 100 percent editable in Powerpoint. Download this now and use it in your presentations to impress your audience.
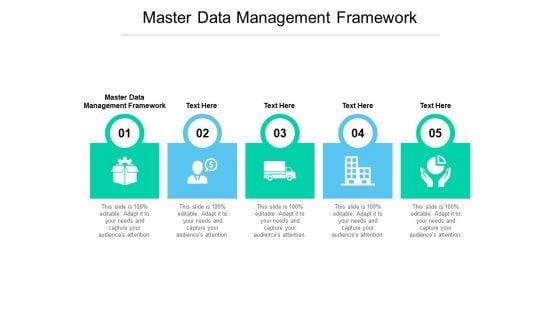
Master Data Management Framework Ppt PowerPoint Presentation Graphics Cpb Pdf
Presenting this set of slides with name master data management framework ppt powerpoint presentation graphics cpb pdf. This is an editable Powerpoint five stages graphic that deals with topics like master data management frameworkto help convey your message better graphically. This product is a premium product available for immediate download and is 100 percent editable in Powerpoint. Download this now and use it in your presentations to impress your audience.
Data Mutual Fund Pricing Ppt PowerPoint Presentation Graphics Cpb Pdf
Presenting this set of slides with name data mutual fund pricing ppt powerpoint presentation graphics cpb pdf. This is an editable Powerpoint three stages graphic that deals with topics like data mutual fund pricing to help convey your message better graphically. This product is a premium product available for immediate download and is 100 percent editable in Powerpoint. Download this now and use it in your presentations to impress your audience.
Market Data Platform Ppt PowerPoint Presentation Icon Graphics Cpb Pdf
Presenting this set of slides with name market data platform ppt powerpoint presentation icon graphics cpb pdf. This is an editable Powerpoint four stages graphic that deals with topics like market data platform to help convey your message better graphically. This product is a premium product available for immediate download and is 100 percent editable in Powerpoint. Download this now and use it in your presentations to impress your audience.

Crowdsourcing Data Innovation Model For E Commerce Facilities Graphics Pdf
This slide showcases crowdsourcing innovation model for e-commerce facilities. It includes various components such as mission, strategy, governance, performance and compliance. Showcasing this set of slides titled Crowdsourcing Data Innovation Model For E Commerce Facilities Graphics Pdf The topics addressed in these templates are Mission And Strategy, Governance, Performance And Compliance All the content presented in this PPT design is completely editable. Download it and make adjustments in color, background, font etc. as per your unique business setting. This slide showcases crowdsourcing innovation model for e-commerce facilities. It includes various components such as mission, strategy, governance, performance and compliance.
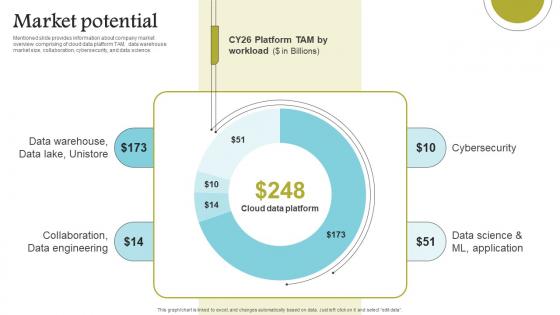
Market Potential Cloud Data Computing Company Fund Raising Graphics PDF
Mentioned slide provides information about company market overview comprising of cloud data platform TAM, data warehouse market size, collaboration, cybersecurity, and data science. Are you in need of a template that can accommodate all of your creative concepts This one is crafted professionally and can be altered to fit any style. Use it with Google Slides or PowerPoint. Include striking photographs, symbols, depictions, and other visuals. Fill, move around, or remove text boxes as desired. Test out color palettes and font mixtures. Edit and save your work, or work with colleagues. Download Market Potential Cloud Data Computing Company Fund Raising Graphics PDF and observe how to make your presentation outstanding. Give an impeccable presentation to your group and make your presentation unforgettable. Mentioned slide provides information about company market overview comprising of cloud data platform TAM, data warehouse market size, collaboration, cybersecurity, and data science.
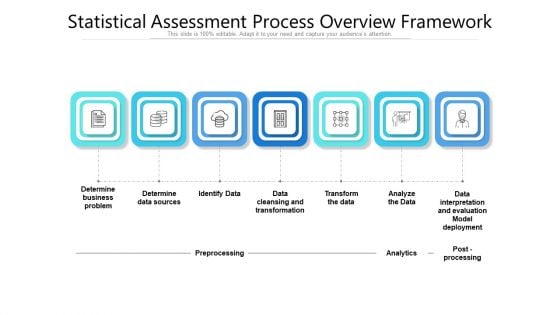
Statistical Assessment Process Overview Framework Ppt Layouts Graphics PDF
Presenting statistical assessment process overview framework ppt layouts graphics pdf to dispense important information. This template comprises seven stages. It also presents valuable insights into the topics including data sources, transform, business problem, data interpretation, analytics. This is a completely customizable PowerPoint theme that can be put to use immediately. So, download it and address the topic impactfully.
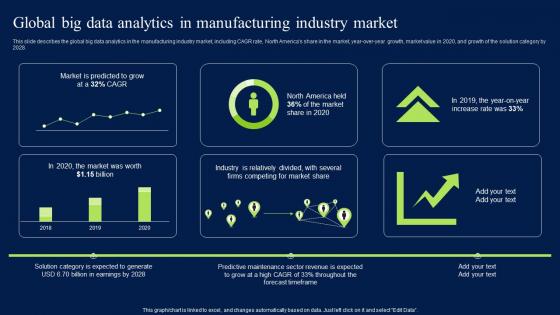
Global Big Data Analytics In Manufacturing Industry Market Graphics PDF
This slide describes the global big data analytics in the manufacturing industry market, including CAGR rate, North Americas share in the market, year-over-year growth, market value in 2020, and growth of the solution category by 2028. Find a pre-designed and impeccable Global Big Data Analytics In Manufacturing Industry Market Graphics PDF. The templates can ace your presentation without additional effort. You can download these easy-to-edit presentation templates to make your presentation stand out from others. So, what are you waiting for Download the template from Slidegeeks today and give a unique touch to your presentation. This slide describes the global big data analytics in the manufacturing industry market, including CAGR rate, North Americas share in the market, year-over-year growth, market value in 2020, and growth of the solution category by 2028.
Magnifying Glass Ppt PowerPoint Presentation Ideas Graphics Design
This is a magnifying glass ppt powerpoint presentation ideas graphics design. This is a five stage process. The stages in this process are magnifying glass, business, marketing, management.
Automotive Industry Statistics Ppt PowerPoint Presentation Inspiration Graphics Design Cpb
This is a automotive industry statistics ppt powerpoint presentation inspiration graphics design cpb. This is a three stage process. The stages in this process are automotive industry statistics.
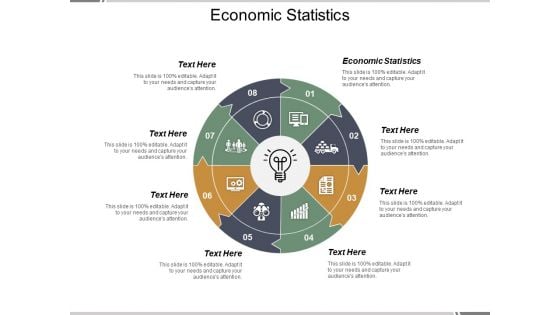
Economic Statistics Ppt PowerPoint Presentation Model Graphics Template Cpb
This is a economic statistics ppt powerpoint presentation model graphics template cpb. This is a eight stage process. The stages in this process are economic statistics.

Product Statistics Ppt PowerPoint Presentation Layouts Graphics Design Cpb
This is a product statistics ppt powerpoint presentation layouts graphics design cpb. This is a four stage process. The stages in this process are product statistics.
Mobile Web Statistics Ppt PowerPoint Presentation Gallery Graphics Pictures Cpb
This is a mobile web statistics ppt powerpoint presentation gallery graphics pictures cpb. This is a seven stage process. The stages in this process are mobile web statistics.
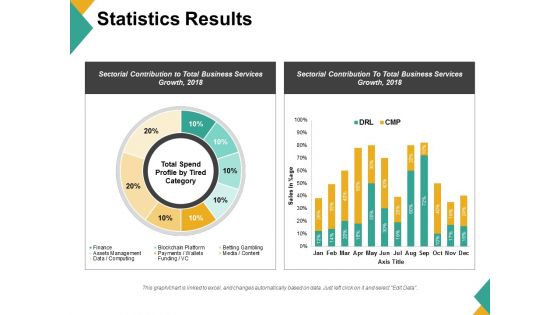
Statistics Results Ppt PowerPoint Presentation Gallery Graphics Pictures
This is a statistics results ppt powerpoint presentation gallery graphics pictures. This is a two stage process. The stages in this process are business, finance, marketing, strategy, analysis.

Statistical Analysis Ppt PowerPoint Presentation Styles Graphics Design
This is a statistical analysis ppt powerpoint presentation styles graphics design. This is a six stage process. The stages in this process are marketing, business, management, compare.
Statistical Statement Vector Icon Ppt PowerPoint Presentation Styles Graphics Pictures
Presenting this set of slides with name statistical statement vector icon ppt powerpoint presentation styles graphics pictures. This is a one stage process. The stages in this process are data report, infographics brochure, business statement. This is a completely editable PowerPoint presentation and is available for immediate download. Download now and impress your audience.

Business Diagram Lock Graphics For Secure Internet Access Presentation Template
This power point template has been crafted with graphic of 3d world map and lock. This PPT contains the concept of security. Use this PPT for your business and marketing related presentations.
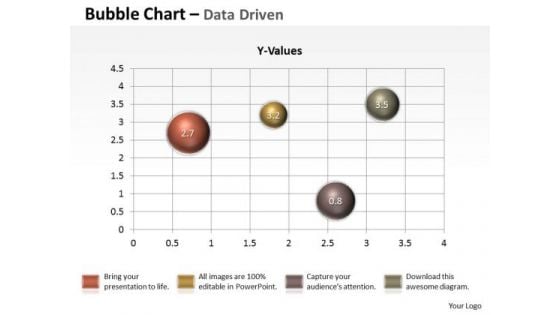
Data Analysis Techniques 3d Graphical Presentation Of PowerPoint Templates
Our data analysis techniques 3d graphical presentation of Powerpoint Templates Will Follow The Drill. They Accomplish The Task Assigned To Them.
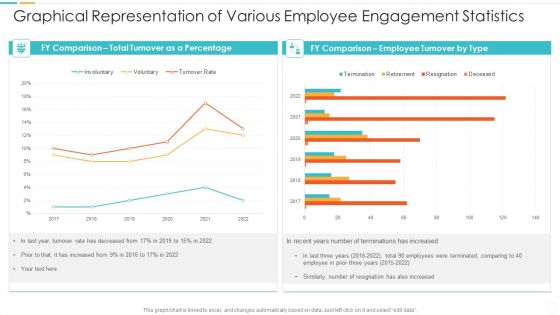
Graphical Representation Of Various Employee Engagement Statistics Microsoft PDF
Showcasing this set of slides titled graphical representation of various employee engagement statistics microsoft pdf. The topics addressed in these templates are graphical representation of various employee engagement statistics. All the content presented in this PPT design is completely editable. Download it and make adjustments in color, background, font etc. as per your unique business setting.
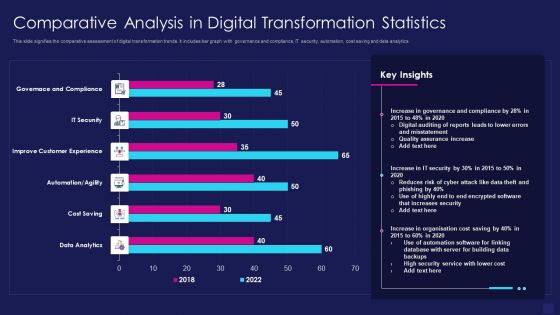
Comparative Analysis In Digital Transformation Statistics Graphics PDF
This slide signifies the comparative assessment of digital transformation trends. It includes bar graph with governance and compliance, IT security, automation, cost saving and data analytics. Showcasing this set of slides titled comparative analysis in digital transformation statistics graphics pdf. The topics addressed in these templates are data analytics, cost saving, improve customer experience. All the content presented in this PPT design is completely editable. Download it and make adjustments in color, background, font etc. as per your unique business setting.
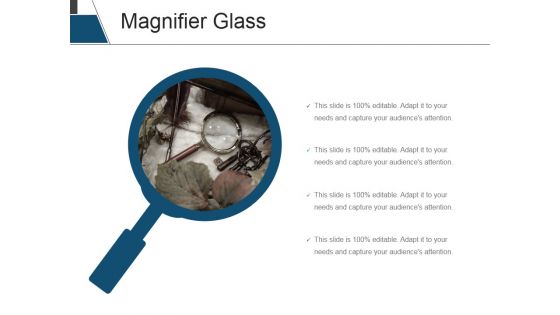
Magnifier Glass Ppt PowerPoint Presentation Pictures Graphics Tutorials
This is a magnifier glass ppt powerpoint presentation pictures graphics tutorials. This is a one stage process. The stages in this process are magnifying glass, business, marketing, technology, communication.
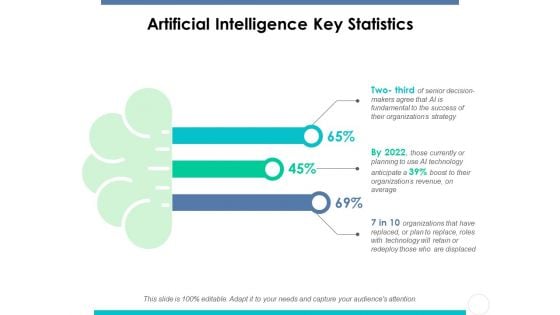
Artificial Intelligence Key Statistics Ppt PowerPoint Presentation Summary Graphics Tutorials
This is a artificial intelligence key statistics ppt powerpoint presentation summary graphics tutorials. This is a three stage process. The stages in this process are artificial, intelligence, statistics, business, marketing.
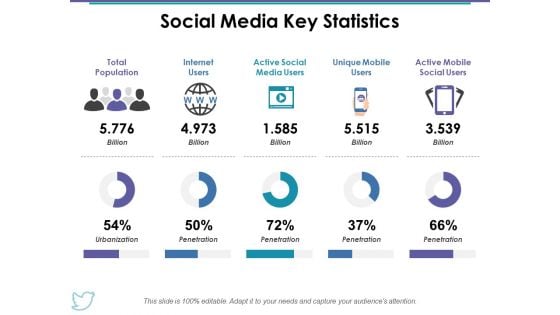
Social Media Key Statistics Ppt PowerPoint Presentation Summary Graphics Example
This is a social media key statistics ppt powerpoint presentation summary graphics example. This is a five stage process. The stages in this process are social media, key statistics, internet users, unique mobile users, business.
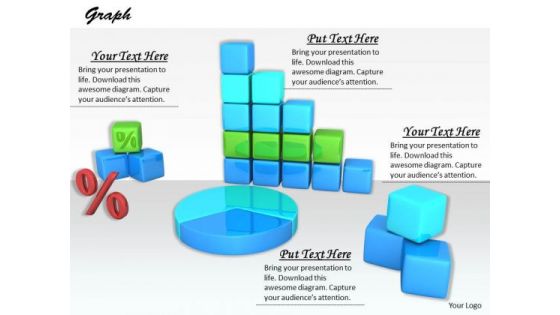
Stock Photo Design For Graphical Representations Of Data PowerPoint Slide
The above image contains a graphic of charts and graphs. Use this professional image in business or sales related presentations. It helps you to explain your plans in all earnest to your colleagues and raise the bar for all.
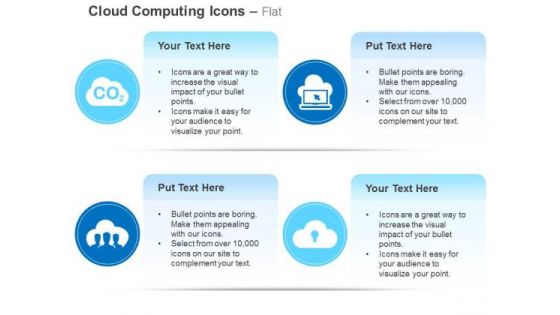
Co2 Network Laptop Data Upload Ppt Slides Graphics
This power point icon template has been crafted with graphic of CO2, network and laptop with data icons. These icons can be used for data upload and networking related topics. Use these icons for social network and technology related presentation.
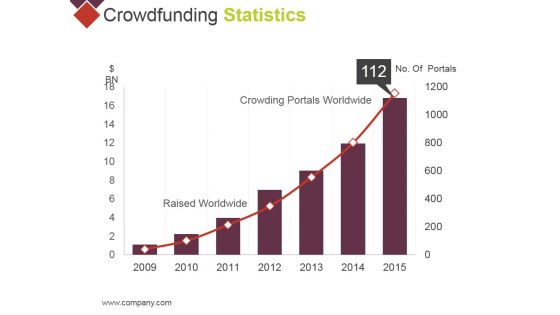
Crowdfunding Statistics Template 1 Ppt PowerPoint Presentation Portfolio Graphics Pictures
This is a crowdfunding statistics template 1 ppt powerpoint presentation portfolio graphics pictures. This is a seven stage process. The stages in this process are raised worldwide, crowding portals worldwide.
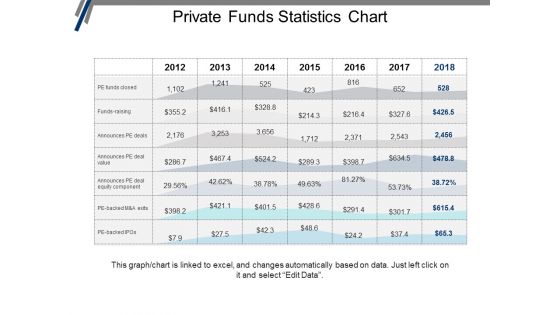
Private Funds Statistics Chart Ppt PowerPoint Presentation Portfolio Graphics Design
This is a private funds statistics chart ppt powerpoint presentation portfolio graphics design. This is a seven stage process. The stages in this process are investment, funding, private equity, venture capital.
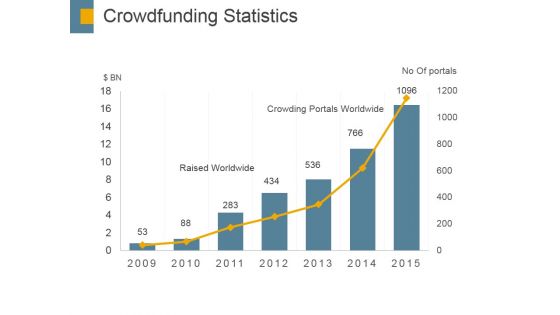
Crowdfunding Statistics Template 2 Ppt PowerPoint Presentation Styles Graphics Design
This is a crowdfunding statistics template 2 ppt powerpoint presentation styles graphics design. This is a seven stage process. The stages in this process are raised worldwide, crowding portals worldwide, no of portals.

 Home
Home