Infographic Circular
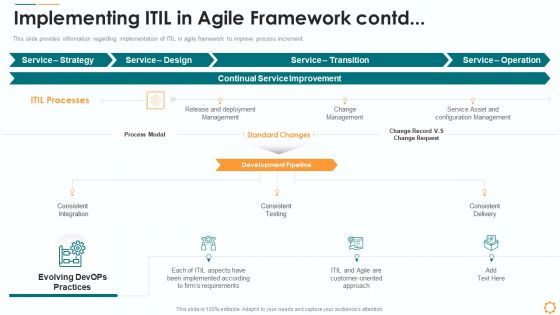
Implementing ITIL In Agile Framework Contd Ppt Infographics Images PDF
This slide provides information regarding implementation of ITIL in agile framework to improve process increment. Deliver an awe inspiring pitch with this creative implementing itil in agile framework contd ppt infographics images pdf bundle. Topics like deployment management, continual service improvement, change management, configuration management, consistent delivery can be discussed with this completely editable template. It is available for immediate download depending on the needs and requirements of the user.
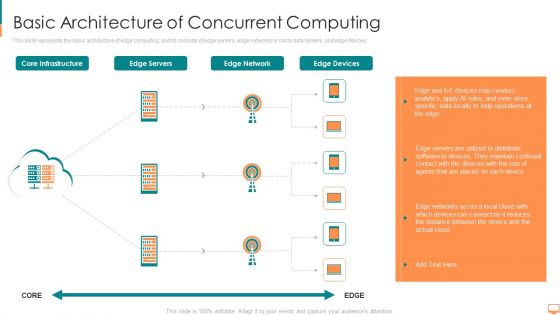
Basic Architecture Of Concurrent Computing Ppt Infographics Examples PDF
This slide represents the basic architecture of edge computing, and its consists of edge servers, edge networks or micro data centers, and edge devices. Deliver and pitch your topic in the best possible manner with this basic architecture of concurrent computing ppt infographics examples pdf. Use them to share invaluable insights on software, maintain, continual, devices, networks and impress your audience. This template can be altered and modified as per your expectations. So, grab it now.
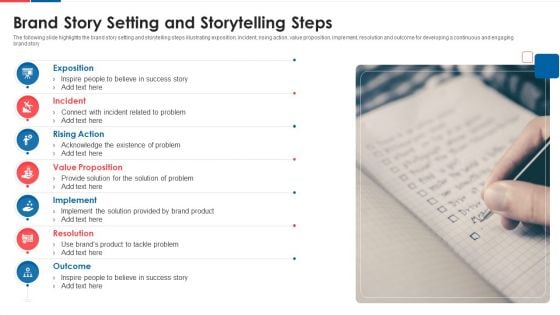
Brand Story Setting And Storytelling Steps Infographics PDF
The following slide highlights the brand story setting and storytelling steps illustrating exposition, incident, rising action, value proposition, implement, resolution and outcome for developing a continuous and engaging brand story. Presenting brand story setting and storytelling steps infographics pdf to dispense important information. This template comprises seven stages. It also presents valuable insights into the topics including exposition, incident, rising action. This is a completely customizable PowerPoint theme that can be put to use immediately. So, download it and address the topic impactfully.
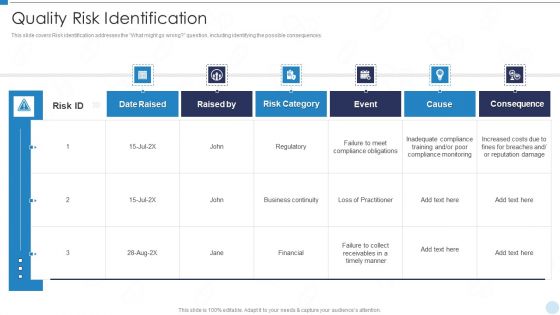
QRM Quality Risk Identification Ppt Infographics Example File PDF
This slide covers Risk identification addresses the What might go wrong question, including identifying the possible consequences. Deliver an awe inspiring pitch with this creative QRM Quality Risk Identification Ppt Infographics Example File PDF bundle. Topics like Risk Category, Business Continuity, Financial can be discussed with this completely editable template. It is available for immediate download depending on the needs and requirements of the user.
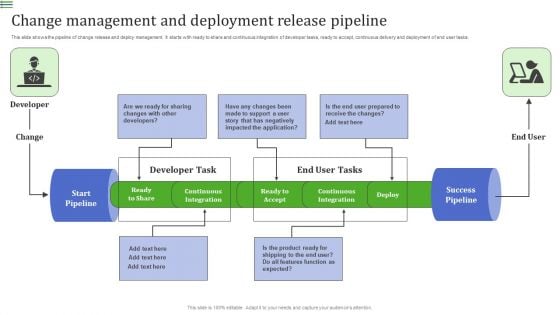
Change Management And Deployment Release Pipeline Infographics PDF
This slide shows the pipeline of change release and deploy management. It starts with ready to share and continuous integration of developer tasks, ready to accept, continuous delivery and deployment of end user tasks.Showcasing this set of slides titled Change Management And Deployment Release Pipeline Infographics PDF. The topics addressed in these templates are Continuous Integration, Continuous Integration, Success Pipeline. All the content presented in this PPT design is completely editable. Download it and make adjustments in color, background, font etc. as per your unique business setting.
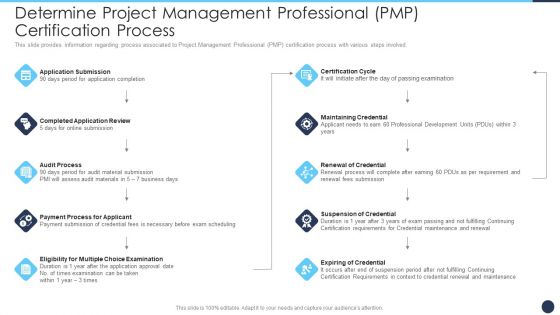
Determine Project Management Professional PMP Certification Process Infographics PDF
This slide provides information regarding process associated to Project Management Professional PMP certification process with various steps involved. Presenting determine project management professional pmp certification process infographics pdf to provide visual cues and insights. Share and navigate important information on ten stages that need your due attention. This template can be used to pitch topics like audit process, maintaining credential, certification cycle. In addtion, this PPT design contains high resolution images, graphics, etc, that are easily editable and available for immediate download.
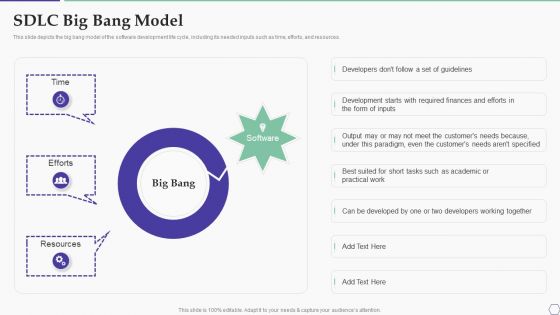
Solution Development Process SDLC Big Bang Model Infographics PDF
This slide depicts the big bang model of the software development life cycle, including its needed inputs such as time, efforts, and resources.Deliver an awe inspiring pitch with this creative Solution Development Process SDLC Big Bang Model Infographics PDF bundle. Topics like Required Finances, Developers Working, Even Customers can be discussed with this completely editable template. It is available for immediate download depending on the needs and requirements of the user.
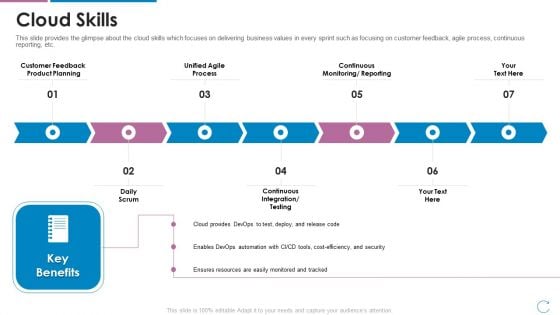
Devops Team Capabilities IT Cloud Skills Ppt Model Infographics PDF
This slide provides the glimpse about the cloud skills which focuses on delivering business values in every sprint such as focusing on customer feedback, agile process, continuous reporting, etc. This is a devops team capabilities it cloud skills ppt model infographics pdf template with various stages. Focus and dispense information on seven stages using this creative set, that comes with editable features. It contains large content boxes to add your information on topics like customer feedback, product planning, unified agile process, continuous monitoring, reporting, daily scrum. You can also showcase facts, figures, and other relevant content using this PPT layout. Grab it now.
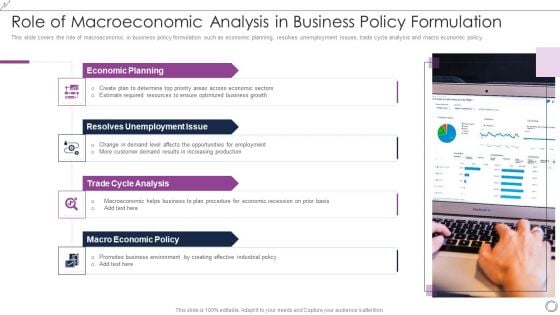
Role Of Macroeconomic Analysis In Business Policy Formulation Infographics PDF
This slide covers the role of macroeconomic in business policy formulation such as economic planning, resolves unemployment issues, trade cycle analysis and macro economic policy. Persuade your audience using this Role Of Macroeconomic Analysis In Business Policy Formulation Infographics PDF. This PPT design covers four stages, thus making it a great tool to use. It also caters to a variety of topics including Economic Planning, Resolves Unemployment Issue, Trade Cycle Analysis, Macro Economic Policy. Download this PPT design now to present a convincing pitch that not only emphasizes the topic but also showcases your presentation skills.
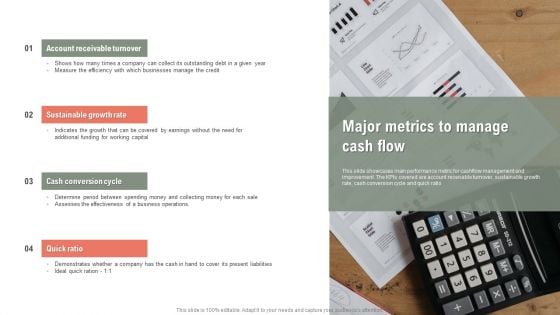
Major Metrics To Manage Cash Flow Ppt Infographics Portfolio PDF
This slide showcases main performance metric for cashflow management and improvement. The KPIs covered are account receivable turnover, sustainable growth rate, cash conversion cycle and quick ratio. Presenting Major Metrics To Manage Cash Flow Ppt Infographics Portfolio PDF to dispense important information. This template comprises four stages. It also presents valuable insights into the topics including Account Receivable Turnover, Sustainable Growth Rate, Cash Conversion Cycle. This is a completely customizable PowerPoint theme that can be put to use immediately. So, download it and address the topic impactfully.
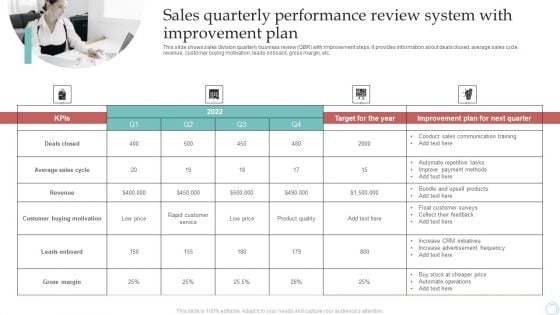
Sales Quarterly Performance Review System With Improvement Plan Infographics PDF
This slide shows sales division quarterly business review QBR with improvement steps. It provides information about deals closed, average sales cycle, revenue, customer buying motivation, leads onboard, gross margin, etc. Presenting Sales Quarterly Performance Review System With Improvement Plan Infographics PDF to dispense important information. This template comprises four stages. It also presents valuable insights into the topics including Deals Closed, Average Sales Cycle, Revenue. This is a completely customizable PowerPoint theme that can be put to use immediately. So, download it and address the topic impactfully.
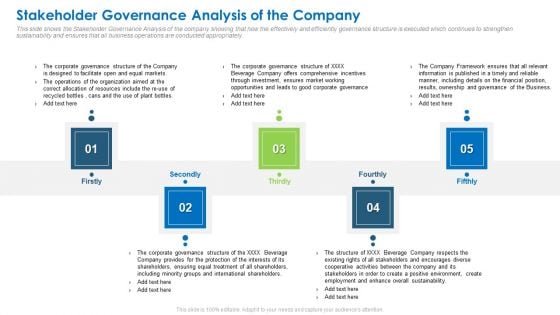
Stakeholder Governance Analysis Of The Company Infographics PDF
This slide shows the Stakeholder Governance Analysis of the company showing that how the effectively and efficiently governance structure is executed which continues to strengthen sustainability and ensures that all business operations are conducted appropriately. This is a stakeholder governance analysis of the company infographics pdf template with various stages. Focus and dispense information on five stages using this creative set, that comes with editable features. It contains large content boxes to add your information on topics like stakeholder governance analysis of the company. You can also showcase facts, figures, and other relevant content using this PPT layout. Grab it now.
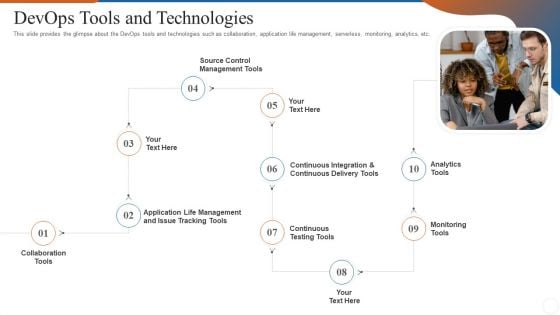
Operations Management Skills Devops Tools And Technologies Infographics PDF
This slide provides the glimpse about the DevOps tools and technologies such as collaboration, application life management, serverless, monitoring, analytics, etc. This is a operations management skills devops tools and technologies infographics pdf template with various stages. Focus and dispense information on ten stages using this creative set, that comes with editable features. It contains large content boxes to add your information on topics like collaboration tools, monitoring tools, analytics tools, continuous testing tools, source control management tools. You can also showcase facts, figures, and other relevant content using this PPT layout. Grab it now.
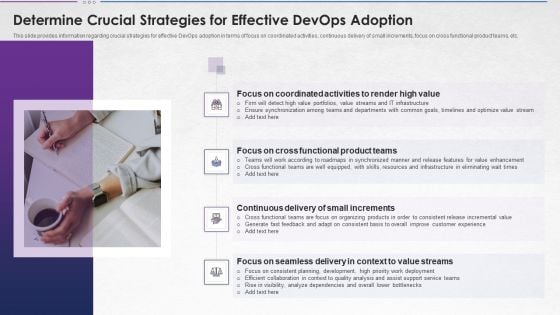
Steps For Devops Implementation IT Determine Crucial Strategies Infographics PDF
This slide provides information regarding crucial strategies for effective DevOps adoption in terms of focus on coordinated activities, continuous delivery of small increments, focus on cross functional product teams, etc. Presenting steps for devops implementation it determine crucial strategies infographics pdf to provide visual cues and insights. Share and navigate important information on four stages that need your due attention. This template can be used to pitch topics like value, goals, optimize, development, quality. In addtion, this PPT design contains high resolution images, graphics, etc, that are easily editable and available for immediate download.
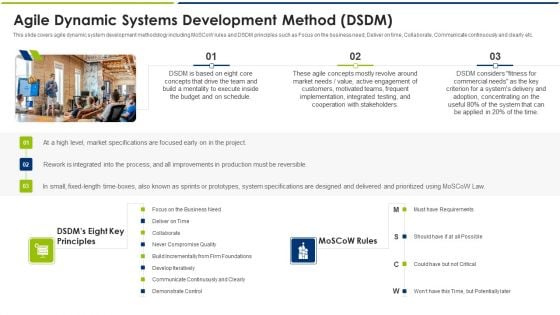
Agile Dynamic Systems Development Method DSDM Ppt Infographics Smartart PDF
This slide covers agile dynamic system development methodology including MoSCoW rules and DSDM principles such as Focus on the business need, Deliver on time, Collaborate, Communicate continuously and clearly etc. Presenting agile dynamic systems development method dsdm ppt infographics smartart pdf to provide visual cues and insights. Share and navigate important information on three stages that need your due attention. This template can be used to pitch topics like system, production, designed, requirements. In addtion, this PPT design contains high resolution images, graphics, etc, that are easily editable and available for immediate download.
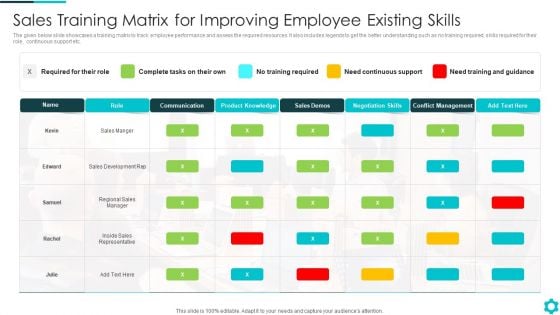
Sales Training Matrix For Improving Employee Existing Skills Infographics PDF
The given below slide showcases a training matrix to track employee performance and assess the required resources. It also includes legends to get the better understanding such as no training required, skills required for their role, continuous support etc.Pitch your topic with ease and precision using this Sales Training Matrix For Improving Employee Existing Skills Infographics PDF This layout presents information on Communication, Conflict Management, Inside Sales Representative It is also available for immediate download and adjustment. So, changes can be made in the color, design, graphics or any other component to create a unique layout.
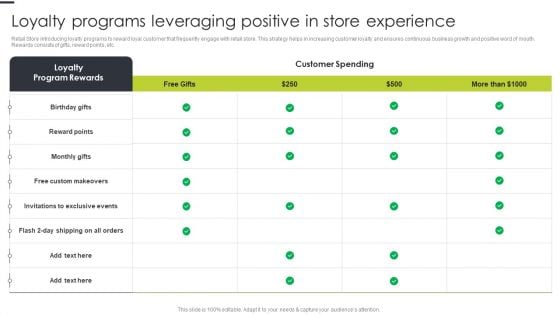
Loyalty Programs Leveraging Positive In Store Experience Infographics PDF
Retail Store introducing loyalty programs to reward loyal customer that frequently engage with retail store. This strategy helps in increasing customer loyalty and ensures continuous business growth and positive word of mouth. Rewards consists of gifts, reward points, etc. Deliver an awe inspiring pitch with this creative Loyalty Programs Leveraging Positive In Store Experience Infographics PDF bundle. Topics like Custom Makeovers, Exclusive Events, Reward Points can be discussed with this completely editable template. It is available for immediate download depending on the needs and requirements of the user.
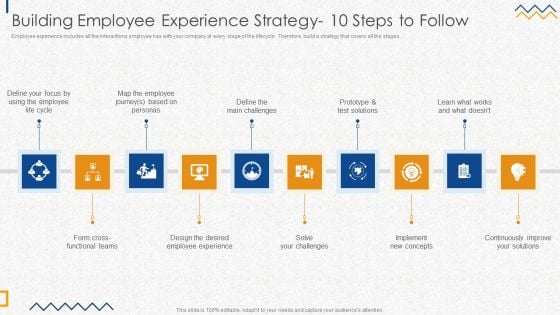
Building Employee Experience Strategy 10 Steps To Follow Infographics PDF
Employee experience includes all the interactions employee has with your company at every stage of the lifecycle. Therefore, build a strategy that covers all the stages.This is a Building Employee Experience Strategy 10 Steps To Follow Infographics PDF template with various stages. Focus and dispense information on ten stages using this creative set, that comes with editable features. It contains large content boxes to add your information on topics like Employee Experience, Implement Concepts, Continuously Improve. You can also showcase facts, figures, and other relevant content using this PPT layout. Grab it now.
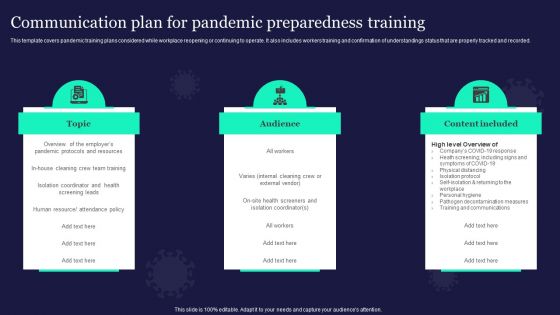
Communication Plan For Pandemic Preparedness Training Infographics PDF
This template covers pandemic training plans considered while workplace reopening or continuing to operate. It also includes workers training and confirmation of understandings status that are properly tracked and recorded. This is a Communication Plan For Pandemic Preparedness Training Infographics PDF template with various stages. Focus and dispense information on three stages using this creative set, that comes with editable features. It contains large content boxes to add your information on topics like Audience, Content Included, Pandemic Protocols. You can also showcase facts, figures, and other relevant content using this PPT layout. Grab it now.
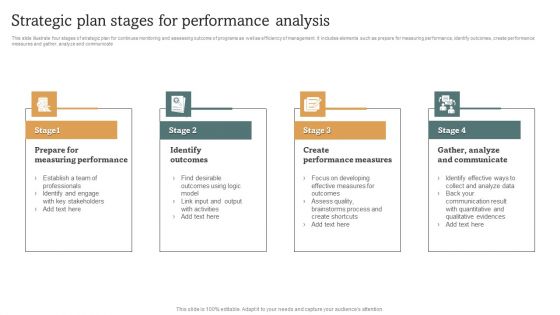
Strategic Plan Stages For Performance Analysis Infographics PDF
This slide illustrate four stages of strategic plan for continues monitoring and assessing outcome of programs as well as efficiency of management. It includes elements such as prepare for measuring performance, identify outcomes, create performance measures and gather, analyze and communicate. Persuade your audience using this Strategic Plan Stages For Performance Analysis Infographics PDF. This PPT design covers four stages, thus making it a great tool to use. It also caters to a variety of topics including Identify Outcomes, Create Performance Measures, Prepare For Measuring Performance. Download this PPT design now to present a convincing pitch that not only emphasizes the topic but also showcases your presentation skills.
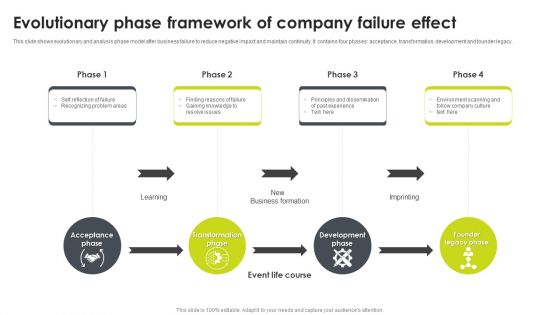
Evolutionary Phase Framework Of Company Failure Effect Infographics PDF
This slide shows evolutionary and analysis phase model after business failure to reduce negative impact and maintain continuity. It contains four phases acceptance, transformation, development and founder legacy. Persuade your audience using this Evolutionary Phase Framework Of Company Failure Effect Infographics PDF. This PPT design covers four stages, thus making it a great tool to use. It also caters to a variety of topics including Business Formation, Development Phase, Transformation Phase. Download this PPT design now to present a convincing pitch that not only emphasizes the topic but also showcases your presentation skills.
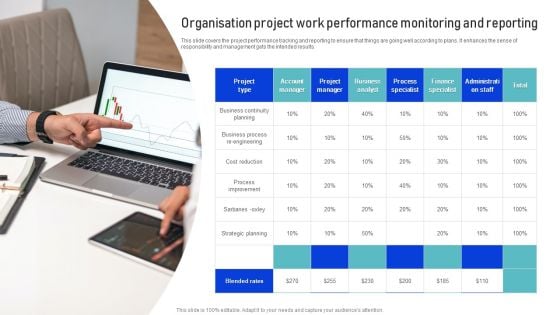
Organisation Project Work Performance Monitoring And Reporting Infographics PDF
This slide covers the project performance tracking and reporting to ensure that things are going well according to plans. It enhances the sense of responsibility and management gets the intended results. Presenting Organisation Project Work Performance Monitoring And Reporting Infographics PDF to dispense important information. This template comprises one stages. It also presents valuable insights into the topics including Business Continuity Planning, Strategic Planning, Business Analyst. This is a completely customizable PowerPoint theme that can be put to use immediately. So, download it and address the topic impactfully.
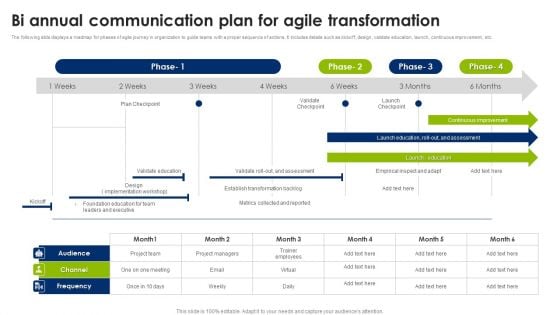
Bi Annual Communication Plan For Agile Transformation Infographics PDF
The following slide displays a roadmap for phases of agile journey in organization to guide teams with a proper sequence of actions. It includes details such as kickoff, design, validate education, launch, continuous improvement, etc. Showcasing this set of slides titled Bi Annual Communication Plan For Agile Transformation Infographics PDF. The topics addressed in these templates are Audience, Channel, Frequency. All the content presented in this PPT design is completely editable. Download it and make adjustments in color, background, font etc. as per your unique business setting.
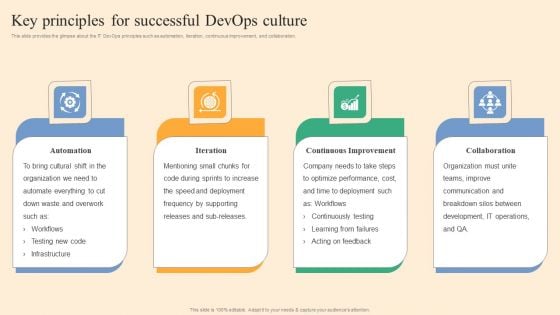
Key Principles For Successful Devops Culture Ppt Infographics Show PDF
This slide provides the glimpse about the IT DevOps principles such as automation, iteration, continuous improvement, and collaboration. Slidegeeks is here to make your presentations a breeze with Key Principles For Successful Devops Culture Ppt Infographics Show PDF With our easy-to-use and customizable templates, you can focus on delivering your ideas rather than worrying about formatting. With a variety of designs to choose from, you are sure to find one that suits your needs. And with animations and unique photos, illustrations, and fonts, you can make your presentation pop. So whether you are giving a sales pitch or presenting to the board, make sure to check out Slidegeeks first
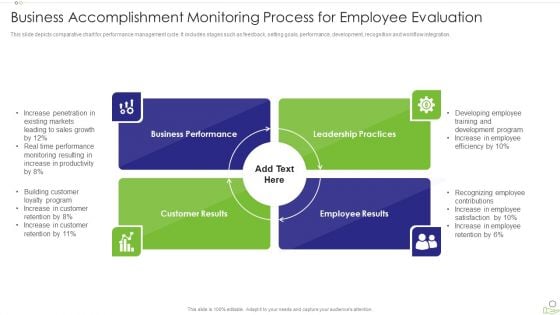
Business Accomplishment Monitoring Process For Employee Evaluation Infographics PDF
This slide depicts comparative chart for performance management cycle. It includes stages such as feedback, setting goals, performance, development, recognition and workflow integration. Persuade your audience using this business accomplishment monitoring process for employee evaluation infographics pdf. This PPT design covers four stages, thus making it a great tool to use. It also caters to a variety of topics including business performance, leadership practices, customer results. Download this PPT design now to present a convincing pitch that not only emphasizes the topic but also showcases your presentation skills.
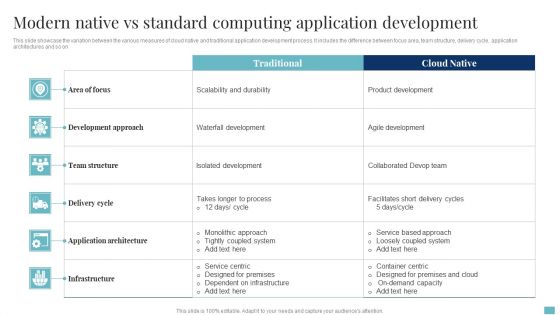
Modern Native Vs Standard Computing Application Development Infographics PDF
This slide showcase the variation between the various measures of cloud native and traditional application development process. It includes the difference between focus area, team structure, delivery cycle, application architectures and so on. Pitch your topic with ease and precision using this Modern Native Vs Standard Computing Application Development Infographics PDF. This layout presents information on Development Approach, Application Architecture, Team Structure. It is also available for immediate download and adjustment. So, changes can be made in the color, design, graphics or any other component to create a unique layout.
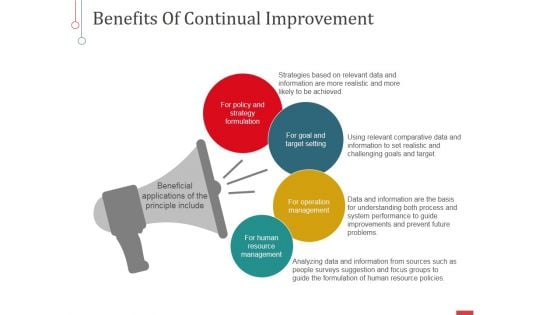
Benefits Of Continual Improvement Ppt PowerPoint Presentation Model Infographics
This is a benefits of continual improvement ppt powerpoint presentation model infographics. This is a four stage process. The stages in this process are for policy and strategy formulation, for goal and target setting, for operation management, for human resource management.
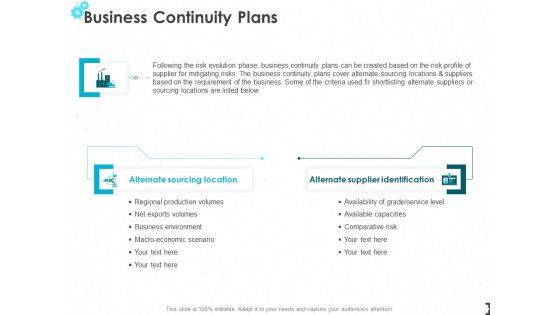
Business Continuity Plans Ppt PowerPoint Presentation Pictures Infographics
Presenting this set of slides with name business continuity plans ppt powerpoint presentation pictures infographics. The topics discussed in these slides are alternate sourcing location, alternate supplier identification. This is a completely editable PowerPoint presentation and is available for immediate download. Download now and impress your audience.
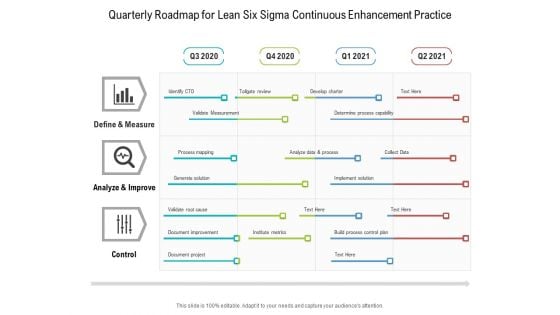
Quarterly Roadmap For Lean Six Sigma Continuous Enhancement Practice Infographics
Introducing our quarterly roadmap for lean six sigma continuous enhancement practice infographics. This PPT presentation is Google Slides compatible, therefore, you can share it easily with the collaborators for measuring the progress. Also, the presentation is available in both standard screen and widescreen aspect ratios. So edit the template design by modifying the font size, font type, color, and shapes as per your requirements. As this PPT design is fully editable it can be presented in PDF, JPG and PNG formats.
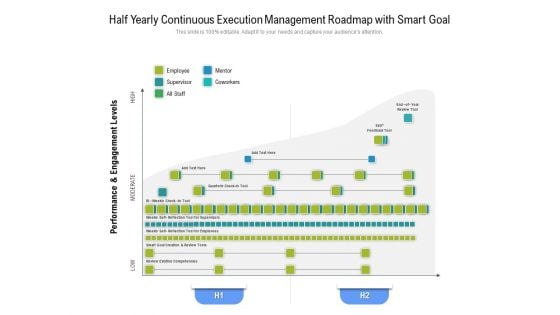
Half Yearly Continuous Execution Management Roadmap With Smart Goal Infographics
Presenting our jaw-dropping half yearly continuous execution management roadmap with smart goal infographics. You can alternate the color, font size, font type, and shapes of this PPT layout according to your strategic process. This PPT presentation is compatible with Google Slides and is available in both standard screen and widescreen aspect ratios. You can also download this well-researched PowerPoint template design in different formats like PDF, JPG, and PNG. So utilize this visually-appealing design by clicking the download button given below.
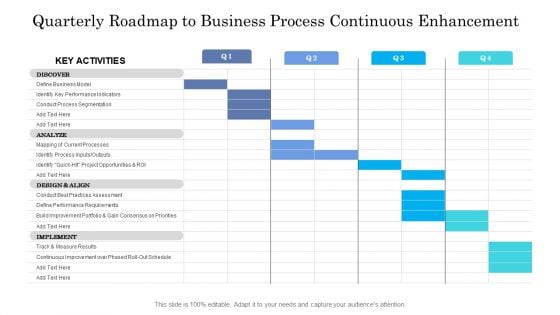
Quarterly Roadmap To Business Process Continuous Enhancement Infographics
Presenting our jaw dropping quarterly roadmap to business process continuous enhancement infographics. You can alternate the color, font size, font type, and shapes of this PPT layout according to your strategic process. This PPT presentation is compatible with Google Slides and is available in both standard screen and widescreen aspect ratios. You can also download this well researched PowerPoint template design in different formats like PDF, JPG, and PNG. So utilize this visually appealing design by clicking the download button given below.
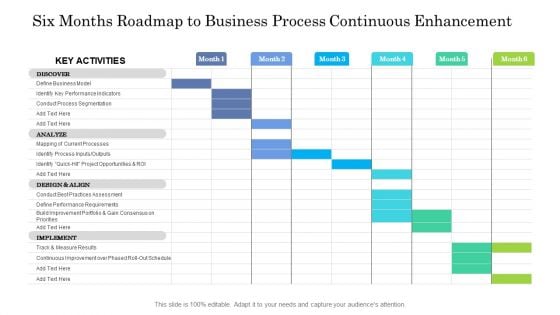
Six Months Roadmap To Business Process Continuous Enhancement Infographics
Presenting our jaw dropping six months roadmap to business process continuous enhancement infographics. You can alternate the color, font size, font type, and shapes of this PPT layout according to your strategic process. This PPT presentation is compatible with Google Slides and is available in both standard screen and widescreen aspect ratios. You can also download this well researched PowerPoint template design in different formats like PDF, JPG, and PNG. So utilize this visually appealing design by clicking the download button given below.
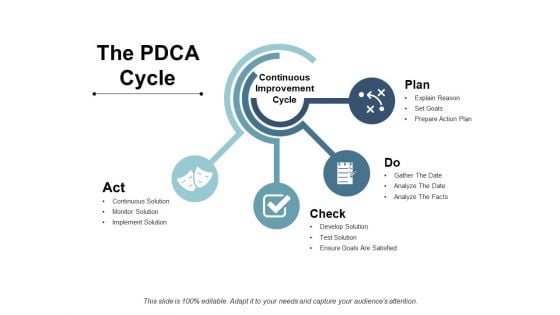
The Pdca Cycle Ppt PowerPoint Presentation Model Infographics
This is a the pdca cycle ppt powerpoint presentation model infographics. This is a four stage process. The stages in this process are business, management, planning, strategy, marketing.
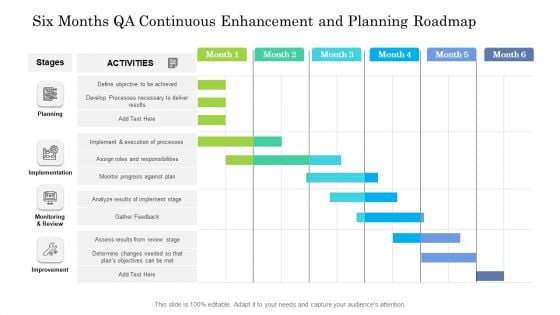
Six Months QA Continuous Enhancement And Planning Roadmap Infographics
Presenting the six months qa continuous enhancement and planning roadmap infographics. The template includes a roadmap that can be used to initiate a strategic plan. Not only this, the PowerPoint slideshow is completely editable and you can effortlessly modify the font size, font type, and shapes according to your needs. This PPT slide can be easily reached in standard screen and widescreen aspect ratios. The set is also available in various formats like PDF, PNG, and JPG. So download and use it multiple times as per your knowledge.
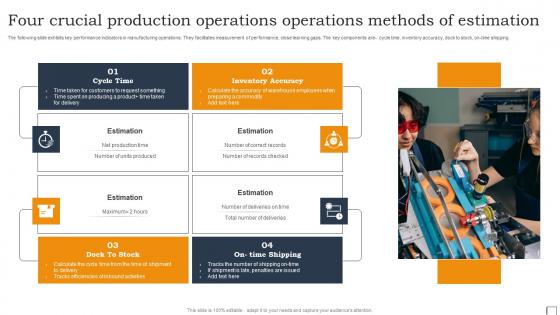
Four Crucial Production Operations Operations Methods Of Estimation Infographics Pdf
The following slide exhibits key performance indicators in manufacturing operations. They facilitates measurement of performance, close learning gaps. The key components are- cycle time, inventory accuracy, dock to stock, on-time shipping. Showcasing this set of slides titled Four Crucial Production Operations Operations Methods Of Estimation Infographics Pdf. The topics addressed in these templates are Cycle Time, Inventory Accuracy. All the content presented in this PPT design is completely editable. Download it and make adjustments in color, background, font etc. as per your unique business setting. The following slide exhibits key performance indicators in manufacturing operations. They facilitates measurement of performance, close learning gaps. The key components are- cycle time, inventory accuracy, dock to stock, on-time shipping.
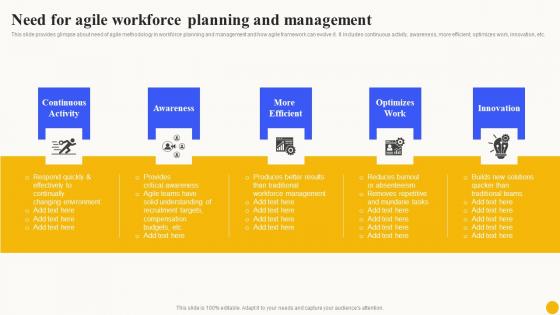
Need For Agile Workforce Planning Planned Workforce Enhancement Infographics Pdf
This slide provides glimpse about need of agile methodology in workforce planning and management and how agile framework can evolve it. It includes continuous activity, awareness, more efficient, optimizes work, innovation, etc.Coming up with a presentation necessitates that the majority of the effort goes into the content and the message you intend to convey. The visuals of a PowerPoint presentation can only be effective if it supplements and supports the story that is being told. Keeping this in mind our experts created Need For Agile Workforce Planning Planned Workforce Enhancement Infographics Pdf to reduce the time that goes into designing the presentation. This way, you can concentrate on the message while our designers take care of providing you with the right template for the situation. This slide provides glimpse about need of agile methodology in workforce planning and management and how agile framework can evolve it. It includes continuous activity, awareness, more efficient, optimizes work, innovation, etc.
Technology Adoption Life Cycle Ppt PowerPoint Presentation Icon Infographics
This is a technology adoption life cycle ppt powerpoint presentation icon infographics. This is a five stage process. The stages in this process are adoption curve, crossing the chasm, hype cycle.
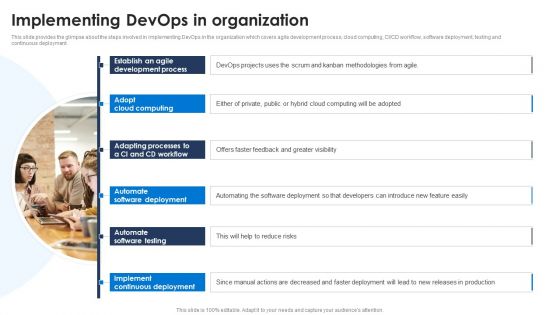
Implementing Devops In Organization Ppt PowerPoint Presentation File Infographics PDF
This slide provides the glimpse about the steps involved in implementing DevOps in the organization which covers agile development process, cloud computing, CI or CD workflow, software deployment, testing and continuous deployment. Slidegeeks is here to make your presentations a breeze with Implementing Devops In Organization Ppt PowerPoint Presentation File Infographics PDF With our easy to use and customizable templates, you can focus on delivering your ideas rather than worrying about formatting. With a variety of designs to choose from, you are sure to find one that suits your needs. And with animations and unique photos, illustrations, and fonts, you can make your presentation pop. So whether you are giving a sales pitch or presenting to the board, make sure to check out Slidegeeks first.
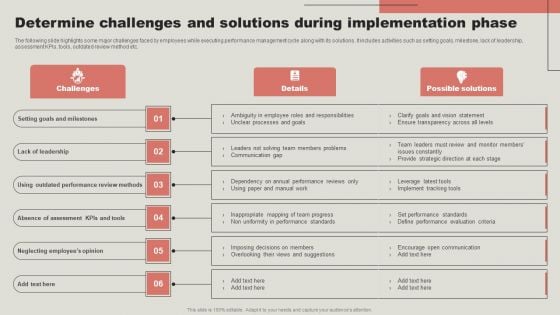
Determine Challenges And Solutions During Implementation Phase Infographics PDF
The following slide highlights some major challenges faced by employees while executing performance management cycle along with its solutions. It includes activities such as setting goals, milestone, lack of leadership, assessment KPIs, tools, outdated review method etc. This Determine Challenges And Solutions During Implementation Phase Infographics PDF from Slidegeeks makes it easy to present information on your topic with precision. It provides customization options, so you can make changes to the colors, design, graphics, or any other component to create a unique layout. It is also available for immediate download, so you can begin using it right away. Slidegeeks has done good research to ensure that you have everything you need to make your presentation stand out. Make a name out there for a brilliant performance.
Business Daigram Four Step Business Infographics And Icons Presentation Templets
This business slide has been designed with four intersecting circles with icons. Our above given Venn diagram with intersecting circles can be used illustrate the similarities. Download this diagram slide to make business process related presentations.
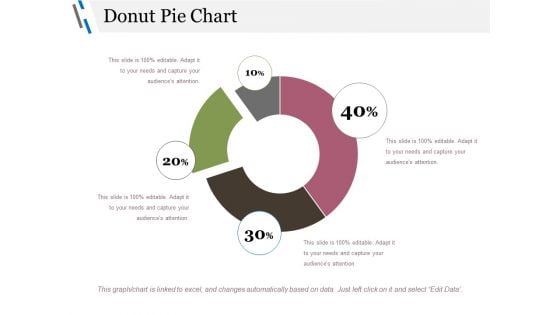
Donut Pie Chart Ppt PowerPoint Presentation Gallery Infographics
This is a donut pie chart ppt powerpoint presentation gallery infographics. This is a four stage process. The stages in this process are chart, business, management, percentage, process.
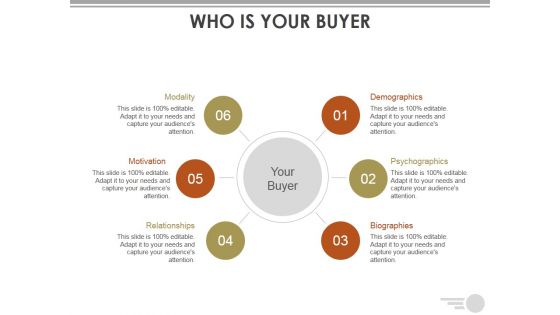
Who Is Your Buyer Ppt PowerPoint Presentation Visual Aids Infographics
This is a who is your buyer ppt powerpoint presentation visual aids infographics. This is a six stage process. The stages in this process are demographics, psychographics, biographies, relationships, motivation.

Project Monitoring And Control Ppt PowerPoint Presentation Inspiration Infographics
This is a project monitoring and control ppt powerpoint presentation inspiration infographics. This is a three stage process. The stages in this process are monitoring controls, continuous controls, ccm.
Six Stages Project Planning Cycle With Icons Ppt Powerpoint Presentation Infographics Objects
This is a six stages project planning cycle with icons ppt powerpoint presentation infographics objects. This is a six stage process. The stages in this process are cycle diagram, circular process, cyclical process.
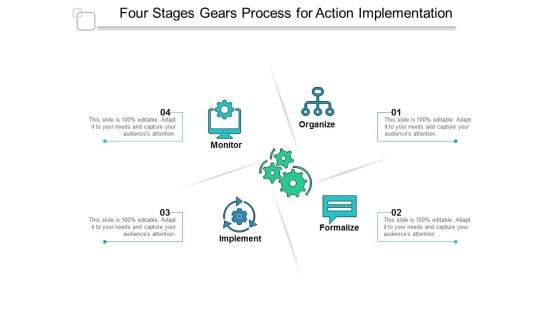
Four Stages Gears Process For Action Implementation Ppt Powerpoint Presentation Infographics Skills
This is a four stages gears process for action implementation ppt powerpoint presentation infographics skills. This is a four stage process. The stages in this process are cycle diagram, circular process, cyclical process.
Seven Stages Stage Cyclic Process With Business Planning Icons Ppt Powerpoint Presentation Infographics Microsoft
This is a seven stages stage cyclic process with business planning icons ppt powerpoint presentation infographics microsoft. This is a seven stage process. The stages in this process are cycle diagram, circular process, cyclical process.
Eleven Steps Workflow Management With Icons Ppt PowerPoint Presentation Infographics Slides
This is a eleven steps workflow management with icons ppt powerpoint presentation infographics slides. This is a eleven stage process. The stages in this process are 10 circle, 10 circular diagram, 10 cycle.
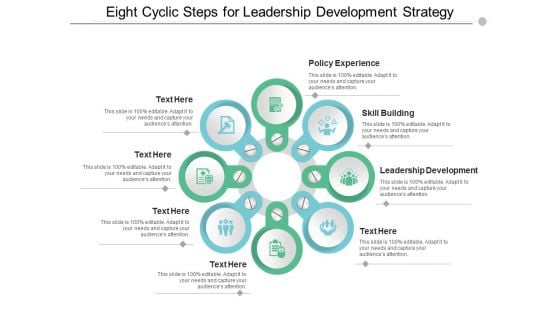
eight cyclic steps for leadership development strategy ppt powerpoint presentation styles infographics
This is a eight cyclic steps for leadership development strategy ppt powerpoint presentation styles infographics. This is a eight stage process. The stages in this process are cycle diagram, circular process, cyclical process.
Gear In Hands With Money Icons Powerpoint Templates
This business diagram displays circular gear steps infographic. This business diagram has been designed with graphic of gear with icons. Use this diagram to depict business planning process in your presentations.
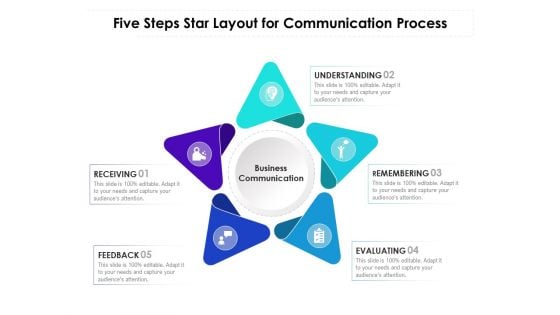
Five Steps Star Layout For Communication Process Ppt PowerPoint Presentation Infographics Skills PDF
Presenting this set of slides with name five steps star infographic for risk analysis ppt powerpoint presentation inspiration background images pdf. This is a five stage process. The stages in this process are understanding, remembering, evaluating, feedback, receiving. This is a completely editable PowerPoint presentation and is available for immediate download. Download now and impress your audience.
Eleven Business Steps With Text Holders And Icons Ppt PowerPoint Presentation Infographics Guidelines
This is a eleven business steps with text holders and icons ppt powerpoint presentation infographics guidelines. This is a eleven stage process. The stages in this process are 10 circle, 10 circular diagram, 10 cycle.
Ten Business Steps With Text Holders And Icons Ppt PowerPoint Presentation Infographics Example
This is a ten business steps with text holders and icons ppt powerpoint presentation infographics example. This is a ten stage process. The stages in this process are 10 circle, 10 circular diagram, 10 cycle.
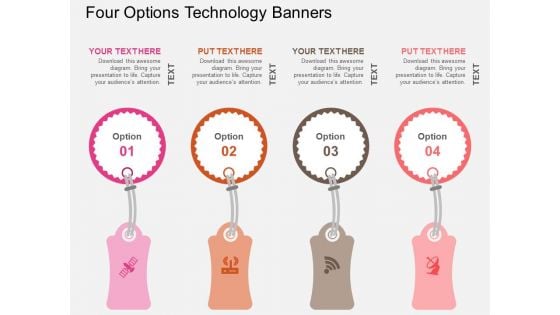
Four Options Technology Banners Powerpoint Templates
This business slide contains circular infographic. This diagram is suitable to present team plan for financial growth. Download this diagram for schematic representation of any information. Visual effect of this slide helps in maintaining the flow of the discussion and provides more clarity to the subject.
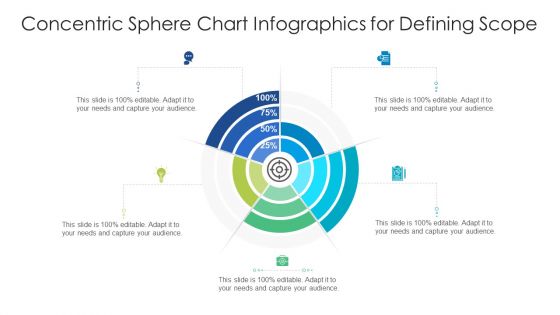
Concentric Sphere Chart Infographics For Defining Scope Ppt Gallery Slide Portrait PDF
Presenting concentric sphere chart infographics for defining scope ppt gallery slide portrait pdf to dispense important information. This template comprises five stages. It also presents valuable insights into the topics including concentric sphere chart infographics for defining scope. This is a completely customizable PowerPoint theme that can be put to use immediately. So, download it and address the topic impactfully.

9 Process Diagram Infographics For Relevant Cost Ppt PowerPoint Presentation Model Slideshow PDF
Presenting 9 process diagram infographics for relevant cost ppt powerpoint presentation model slideshow pdf to dispense important information. This template comprises nine stages. It also presents valuable insights into the topics including 9 process diagram infographics for relevant cost. This is a completely customizable PowerPoint theme that can be put to use immediately. So, download it and address the topic impactfully.
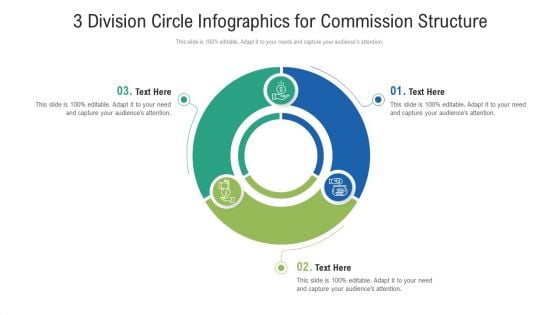
3 Division Circle Infographics For Commission Structure Ppt PowerPoint Presentation File Designs PDF
Presenting 3 division circle infographics for commission structure ppt powerpoint presentation file designs pdf to dispense important information. This template comprises three stages. It also presents valuable insights into the topics including 3 division circle infographics for commission structure. This is a completely customizable PowerPoint theme that can be put to use immediately. So, download it and address the topic impactfully.
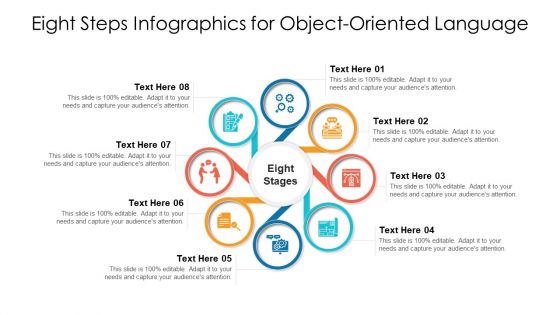
Eight Steps Infographics For Object Oriented Language Ppt PowerPoint Presentation Gallery Display PDF
Presenting eight steps infographics for object oriented language ppt powerpoint presentation gallery display pdf to dispense important information. This template comprises eight stages. It also presents valuable insights into the topics including eight steps infographics for object oriented language. This is a completely customizable PowerPoint theme that can be put to use immediately. So, download it and address the topic impactfully.
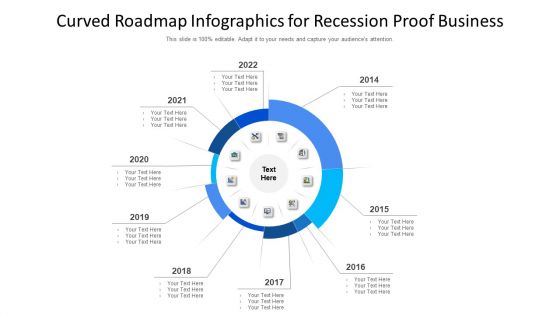
Curved Roadmap Infographics For Recession Proof Business Ppt PowerPoint Presentation File Background Image PDF
Presenting curved roadmap infographics for recession proof business ppt powerpoint presentation file background image pdf to dispense important information. This template comprises nine stages. It also presents valuable insights into the topics including curved roadmap infographics for recession proof business. This is a completely customizable PowerPoint theme that can be put to use immediately. So, download it and address the topic impactfully.
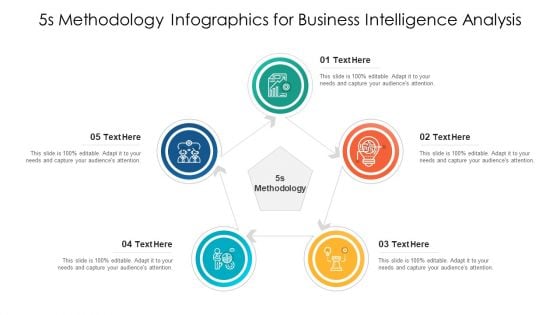
5S Methodology Infographics For Business Intelligence Analysis Ppt PowerPoint Presentation Model Background PDF
Presenting 5s methodology infographics for business intelligence analysis ppt powerpoint presentation model background pdf to dispense important information. This template comprises five stages. It also presents valuable insights into the topics including 5s methodology infographics for business intelligence analysis. This is a completely customizable PowerPoint theme that can be put to use immediately. So, download it and address the topic impactfully.
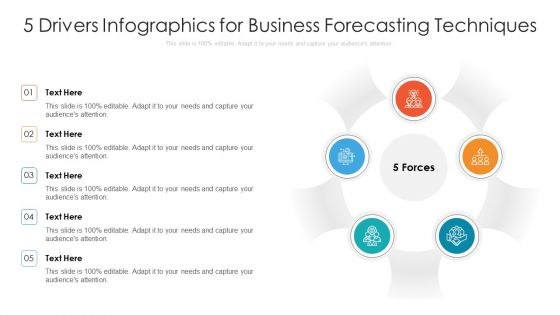
5 Drivers Infographics For Business Forecasting Techniques Ppt PowerPoint Presentation Gallery Example Topics PDF
Presenting 5 drivers infographics for business forecasting techniques ppt powerpoint presentation gallery example topics pdf to dispense important information. This template comprises five stages. It also presents valuable insights into the topics including 5 drivers infographics for business forecasting techniques. This is a completely customizable PowerPoint theme that can be put to use immediately. So, download it and address the topic impactfully.


 Continue with Email

 Home
Home


