Infographic Circular
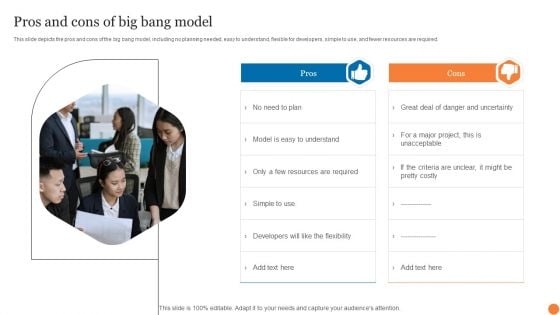
Pros And Cons Of Big Bang Model Phases Of Software Development Procedure Infographics PDF
This slide represents the pricing for software development life cycle models, such as the waterfall model, RAD model, spiral, V-model, agile, iterative, and the big bang.Do you have an important presentation coming up Are you looking for something that will make your presentation stand out from the rest Look no further than Pros And Cons Of Big Bang Model Phases Of Software Development Procedure Infographics PDF. With our professional designs, you can trust that your presentation will pop and make delivering it a smooth process. And with Slidegeeks, you can trust that your presentation will be unique and memorable. So why wait Grab Pros And Cons Of Big Bang Model Phases Of Software Development Procedure Infographics PDF today and make your presentation stand out from the rest.

CRM Pipeline Administration Determine Essential Pipeline Metrics Ppt Infographics Show PDF
This slide provides information regarding the essential pipeline metrics such as opportunity dollar size vs. average won deal size, opportunity age vs. win cycle and win rate. Find highly impressive CRM Pipeline Administration Determine Essential Pipeline Metrics Ppt Infographics Show PDF on Slidegeeks to deliver a meaningful presentation. You can save an ample amount of time using these presentation templates. No need to worry to prepare everything from scratch because Slidegeeks experts have already done a huge research and work for you. You need to download CRM Pipeline Administration Determine Essential Pipeline Metrics Ppt Infographics Show PDF for your upcoming presentation. All the presentation templates are 100 percent editable and you can change the color and personalize the content accordingly. Download now.
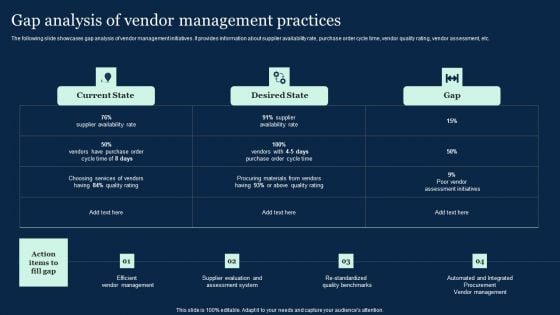
Gap Analysis Of Vendor Management Practices Effective Vendor Management For Enhancing Infographics PDF
The following slide showcases gap analysis of vendor management initiatives. It provides information about supplier availability rate, purchase order cycle time, vendor quality rating, vendor assessment, etc. Formulating a presentation can take up a lot of effort and time, so the content and message should always be the primary focus. The visuals of the PowerPoint can enhance the presenters message, so our Gap Analysis Of Vendor Management Practices Effective Vendor Management For Enhancing Infographics PDF was created to help save time. Instead of worrying about the design, the presenter can concentrate on the message while our designers work on creating the ideal templates for whatever situation is needed. Slidegeeks has experts for everything from amazing designs to valuable content, we have put everything into Gap Analysis Of Vendor Management Practices Effective Vendor Management For Enhancing Infographics PDF
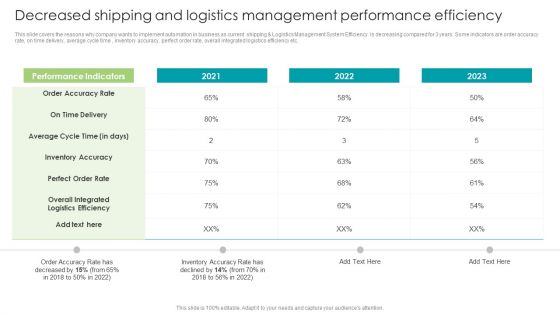
Robotic Process Automation Decreased Shipping And Logistics Management Performance Infographics PDF
This slide covers the reasons why company wants to implement automation in business as current shipping and Logistics Management System Efficiency is decreasing compared for 3 years. Some indicators are order accuracy rate, on time delivery, average cycle time , inventory accuracy, perfect order rate, overall integrated logistics efficiency etc. Crafting an eye-catching presentation has never been more straightforward. Let your presentation shine with this tasteful yet straightforward Robotic Process Automation Decreased Shipping And Logistics Management Performance Infographics PDF template. It offers a minimalistic and classy look that is great for making a statement. The colors have been employed intelligently to add a bit of playfulness while still remaining professional. Construct the ideal Robotic Process Automation Decreased Shipping And Logistics Management Performance Infographics PDF that effortlessly grabs the attention of your audience Begin now and be certain to wow your customers
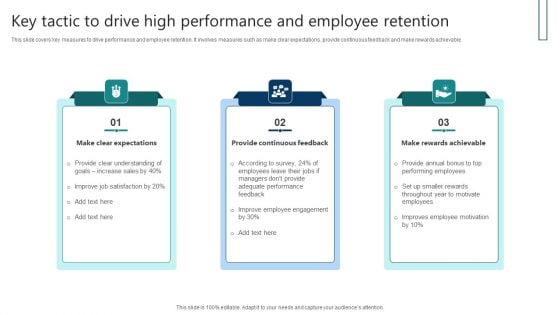
Key Tactic To Drive High Performance And Employee Retention Infographics PDF
This slide covers key measures to drive performance and employee retention. It involves measures such as make clear expectations, provide continuous feedback and make rewards achievable. Presenting Key Tactic To Drive High Performance And Employee Retention Infographics PDF to dispense important information. This template comprises three stages. It also presents valuable insights into the topics including Make Clear Expectations, Provide Continuous Feedback, Make Rewards Achievable. This is a completely customizable PowerPoint theme that can be put to use immediately. So, download it and address the topic impactfully.
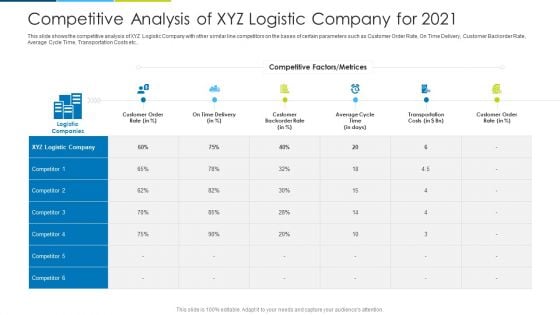
Competitive Analysis Of XYZ Logistic Company For 2021 Ppt Infographics Aids PDF
This slide shows the competitive analysis of XYZ Logistic Company with other similar line competitors on the bases of certain parameters such as Customer Order Rate, On Time Delivery, Customer Backorder Rate, Average Cycle Time, Transportation Costs etc. Deliver an awe inspiring pitch with this creative competitive analysis of xyz logistic company for 2021 ppt infographics aids pdf bundle. Topics like customer order rate, on time delivery, customer backorder rate, average cycle time, transportation costs can be discussed with this completely editable template. It is available for immediate download depending on the needs and requirements of the user.
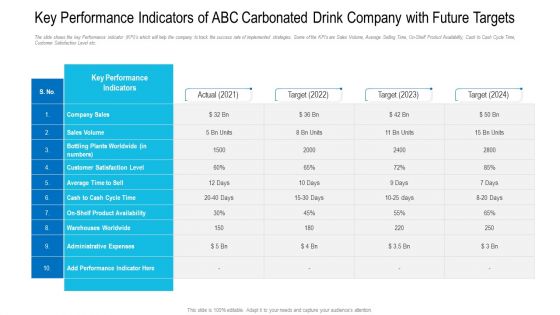
Key Performance Indicators Of ABC Carbonated Drink Company With Future Targets Infographics PDF
The slide shows the key Performance Indicator KPI s which will help the company to track the success rate of implemented strategies. Some of the KPIs are Sales Volume, Average Selling Time, On-Shelf Product Availability, Cash to Cash Cycle Time, Customer Satisfaction Level etc. Deliver and pitch your topic in the best possible manner with this key performance indicators of abc carbonated drink company with future targets infographics pdf. Use them to share invaluable insights on company sales, sales volume, average time to sell, cash to cash cycle time and impress your audience. This template can be altered and modified as per your expectations. So, grab it now.
Business Process Holding Cost Evaluation Process Ppt PowerPoint Presentation Icon Infographics PDF
Following slide exhibits process ownership roles in six sigma management. It includes- life cycle cost, purchase cost and sunk cost management. It includes major elements such as- evaluation and research, internal management, regulatory and so on Persuade your audience using this business process holding cost evaluation process ppt powerpoint presentation icon infographics pdf. This PPT design covers five stages, thus making it a great tool to use. It also caters to a variety of topics including overhead costs, purchase cost, utilization cost, life cycle cost, sunk cost. Download this PPT design now to present a convincing pitch that not only emphasizes the topic but also showcases your presentation skills.

Stakeholder Management Strategy With Interest And Actions Ppt PowerPoint Presentation Infographics Structure PDF
Showcasing this set of slides titled stakeholder management strategy with interest and actions ppt powerpoint presentation infographics structure pdf. The topics addressed in these templates are partner in the development and delivery of the communication plan, ability to continue business as usual and potential impact on exiting contracts, the successful delivery of the project on budget and on time. All the content presented in this PPT design is completely editable. Download it and make adjustments in color, background, font etc. as per your unique business setting.
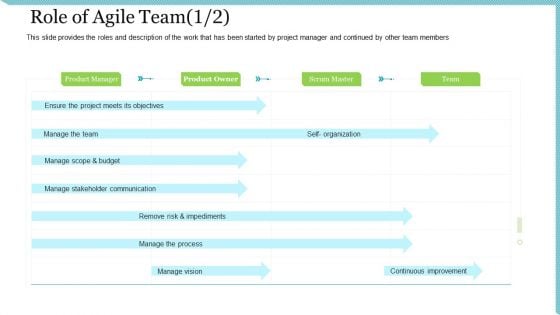
Agile Delivery Methodology For IT Project Role Of Agile Team Organization Ppt Infographics Outfit PDF
This slide provides the roles and description of the work that has been started by project manager and continued by other team members. Deliver an awe inspiring pitch with this creative agile delivery methodology for IT project role of agile team organization ppt infographics outfIT pdf bundle. Topics like self organization, manage stakeholder communication, manage scope budget, manage the team, ensure the project meets its objectives can be discussed with this completely editable template. It is available for immediate download depending on the needs and requirements of the user.

Discipline Agile Delivery Software Development Agile Delivery Agile Development Method Infographics PDF
This slide is covering adaption of an Iterative-Incremental development, where each sprint will be of three weeks. Analysis and design will be completed before the start of coding of the sprint and will be done concurrently with the coding and continuous integration of the previous sprint. Deliver and pitch your topic in the best possible manner with this discipline agile delivery software development agile delivery agile development method infographics pdf. Use them to share invaluable insights on product backlog, sprint backlog, production deployment, analysis, development and impress your audience. This template can be altered and modified as per your expectations. So, grab it now.
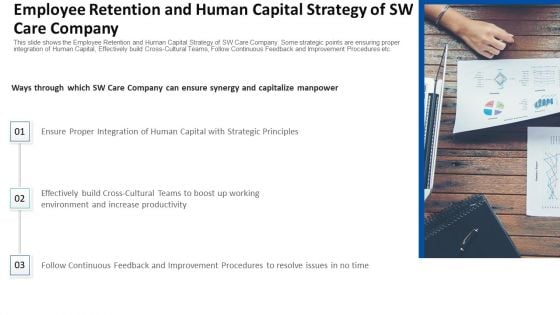
Employee Retention And Human Capital Strategy Of SW Care Company Ppt Infographics Diagrams PDF
This slide shows the Employee Retention and Human Capital Strategy of SW Care Company. Some strategic points are ensuring proper integration of Human Capital, Effectively build Cross Cultural Teams, Follow Continuous Feedback and Improvement Procedures etc. This is a employee retention and human capital strategy of sw care company ppt infographics diagrams pdf template with various stages. Focus and dispense information on three stages using this creative set, that comes with editable features. It contains large content boxes to add your information on topics like environment, strategic principles, improvement procedures. You can also showcase facts, figures, and other relevant content using this PPT layout. Grab it now.
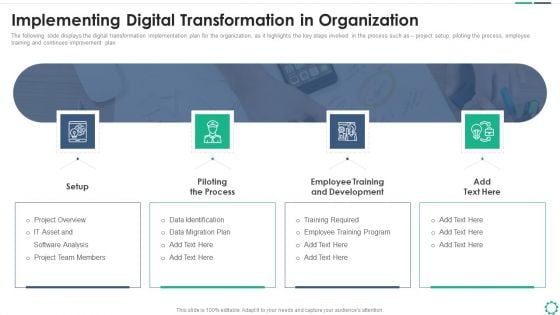
Digitalization Plan For Business Modernization Implementing Digital Transformation In Organization Infographics PDF
The following slide displays the digital transformation implementation plan for the organization, as it highlights the key steps involved in the process such as project setup, piloting the process, employee training and continues improvement plan. This is a digitalization plan for business modernization implementing digital transformation in organization infographics pdf template with various stages. Focus and dispense information on four stages using this creative set, that comes with editable features. It contains large content boxes to add your information on topics like setup, piloting the process, employee training and development. You can also showcase facts, figures, and other relevant content using this PPT layout. Grab it now.
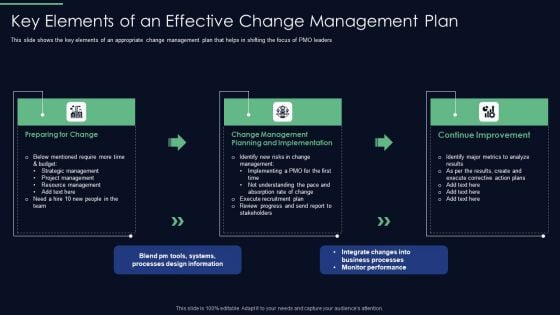
Responsibilities Project Management Office Implementing Digitalization Key Elements Of An Effective Infographics PDF
This slide shows the key elements of an appropriate change management plan that helps in shifting the focus of PMO leaders This is a responsibilities project management office implementing digitalization key elements of an effective infographics pdf template with various stages. Focus and dispense information on three stages using this creative set, that comes with editable features. It contains large content boxes to add your information on topics like planning implementation, change management, continue improvement. You can also showcase facts, figures, and other relevant content using this PPT layout. Grab it now.
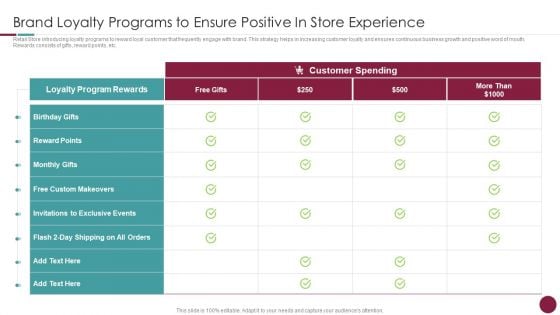
Incorporation Of Experience Brand Loyalty Programs To Ensure Positive In Store Infographics PDF
Retail Store introducing loyalty programs to reward loyal customer that frequently engage with brand. This strategy helps in increasing customer loyalty and ensures continuous business growth and positive word of mouth. Rewards consists of gifts, reward points, etc. Deliver an awe inspiring pitch with this creative incorporation of experience brand loyalty programs to ensure positive in store infographics pdf bundle. Topics like loyalty program rewards, free custom makeovers, customer spending can be discussed with this completely editable template. It is available for immediate download depending on the needs and requirements of the user.
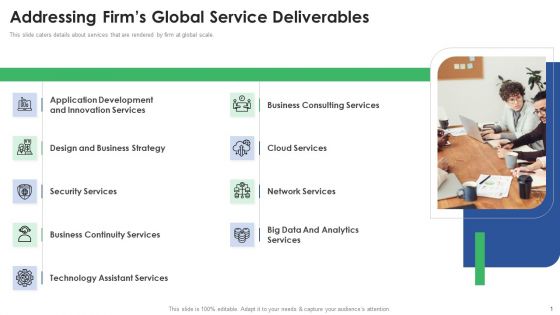
Stakeholder Deck Presentation Services Addressing Firms Global Service Deliverables Infographics PDF
This slide caters details about services that are rendered by firm at global scale. This is a Stakeholder Deck Presentation Services Addressing Firms Global Service Deliverables Infographics PDF template with various stages. Focus and dispense information on nine stages using this creative set, that comes with editable features. It contains large content boxes to add your information on topics like Application Development, Innovation Services, Security Services, Business Continuity Services. You can also showcase facts, figures, and other relevant content using this PPT layout. Grab it now.
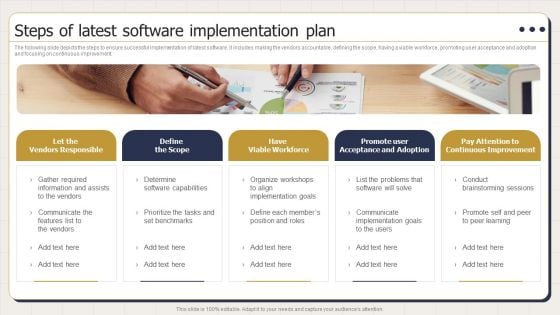
Steps Of Latest Software Implementation Plan Ppt PowerPoint Presentation Outline Infographics PDF
The following slide depicts the steps to ensure successful implementation of latest software. It includes making the vendors accountable, defining the scope, having a viable workforce, promoting user acceptance and adoption and focusing on continuous improvement. Presenting Steps Of Latest Software Implementation Plan Ppt PowerPoint Presentation Outline Infographics PDF to dispense important information. This template comprises one stage. It also presents valuable insights into the topics including Vendors Responsible, Viable Workforce, Acceptance Adoption. This is a completely customizable PowerPoint theme that can be put to use immediately. So, download it and address the topic impactfully.
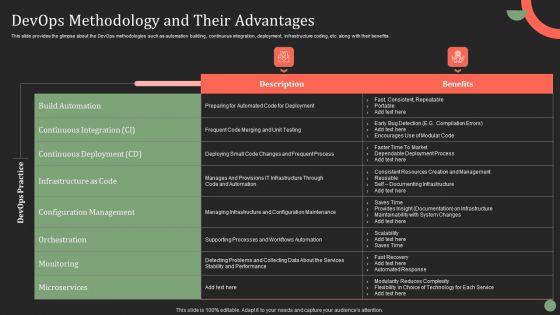
Devops Methodology And Their Advantages Ppt PowerPoint Presentation File Infographics PDF
This slide provides the glimpse about the DevOps methodologies such as automation building, continuous integration, deployment, infrastructure coding, etc. along with their benefits. Make sure to capture your audiences attention in your business displays with our gratis customizable Devops Methodology And Their Advantages Ppt PowerPoint Presentation File Infographics PDF. These are great for business strategies, office conferences, capital raising or task suggestions. If you desire to acquire more customers for your tech business and ensure they stay satisfied, create your own sales presentation with these plain slides.
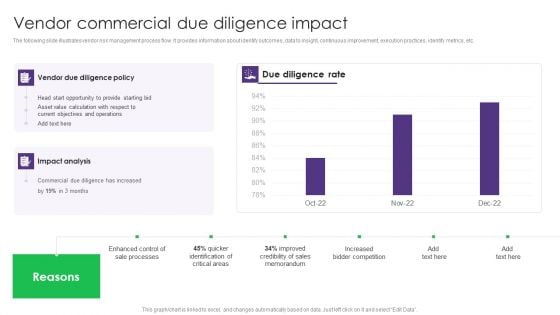
Vendor Commercial Due Diligence Impact Vendor Management System Deployment Infographics PDF
The following slide illustrates vendor risk management process flow. It provides information about identify outcomes, data to insight, continuous improvement, execution practices, identify metrics, etc. The Vendor Commercial Due Diligence Impact Vendor Management System Deployment Infographics PDF is a compilation of the most recent design trends as a series of slides. It is suitable for any subject or industry presentation, containing attractive visuals and photo spots for businesses to clearly express their messages. This template contains a variety of slides for the user to input data, such as structures to contrast two elements, bullet points, and slides for written information. Slidegeeks is prepared to create an impression.
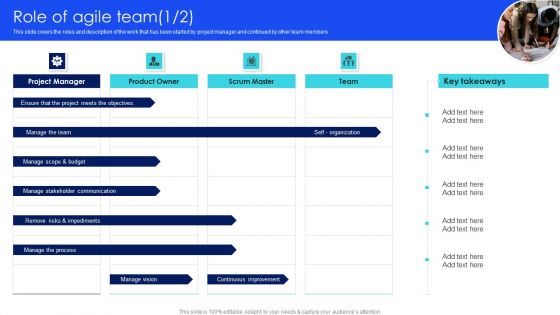
IT Agile Framework Role Of Agile Team Ppt Infographics Maker PDF
This slide covers the roles and description of the work that has been started by project manager and continued by other team members Present like a pro with IT Agile Framework Role Of Agile Team Ppt Infographics Maker PDF Create beautiful presentations together with your team, using our easy-to-use presentation slides. Share your ideas in real-time and make changes on the fly by downloading our templates. So whether youre in the office, on the go, or in a remote location, you can stay in sync with your team and present your ideas with confidence. With Slidegeeks presentation got a whole lot easier. Grab these presentations today.
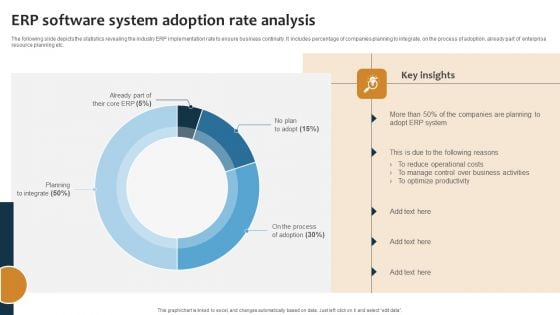
Improving Business Procedures Enterprise Resource Planning System ERP Software System Adoption Rate Infographics PDF
The following slide depicts the statistics revealing the industry ERP implementation rate to ensure business continuity. It includes percentage of companies planning to integrate, on the process of adoption, already part of enterprise resource planning etc. Make sure to capture your audiences attention in your business displays with our gratis customizable Improving Business Procedures Enterprise Resource Planning System ERP Software System Adoption Rate Infographics PDF. These are great for business strategies, office conferences, capital raising or task suggestions. If you desire to acquire more customers for your tech business and ensure they stay satisfied, create your own sales presentation with these plain slides.
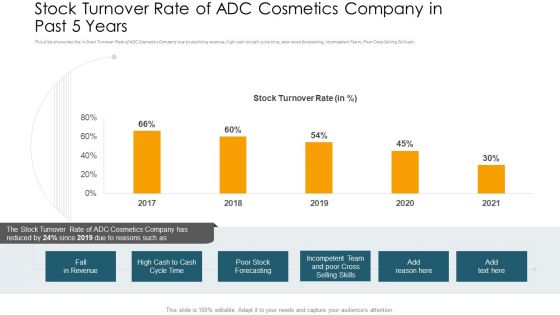
Stock Turnover Rate Of ADC Cosmetics Company In Past 5 Years Infographics PDF
This slide shows decline in Stock Turnover Rate of ADC Cosmetics Company due to declining revenue, high cash to cash cycle time, poor stock forecasting, Incompetent Team, Poor Cross Selling Skills etc. Deliver and pitch your topic in the best possible manner with this stock turnover rate of adc cosmetics company in past 5 years infographics pdf. Use them to share invaluable insights on stock turnover rate, 2017 to 2021 and impress your audience. This template can be altered and modified as per your expectations. So, grab it now.
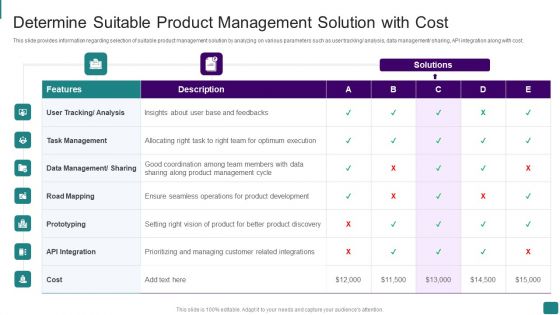
Strategic Guide To Launch New Product In Market Determine Suitable Product Management Solution Infographics PDF
This slide provides information regarding selection of suitable product management solution by analyzing on various parameters such as user tracking analysis, data management sharing, API integration along with cost. Deliver and pitch your topic in the best possible manner with this strategic guide to launch new product in market determine suitable product management solution infographics pdf Use them to share invaluable insights on coordination among team, members with data sharing, along product management cycle and impress your audience. This template can be altered and modified as per your expectations. So, grab it now.
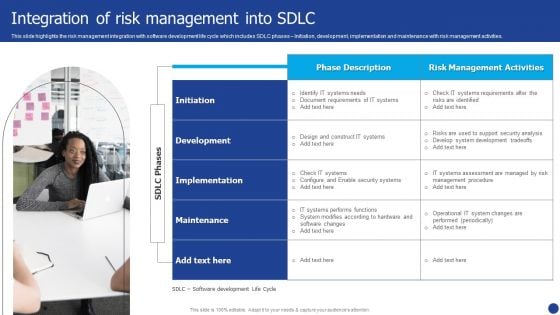
Information Technology Threat Mitigation Methods Integration Of Risk Management Into Sdlc Infographics PDF
This slide highlights the risk management integration with software development life cycle which includes SDLC phases Initiation, development, implementation and maintenance with risk management activities. This is a Information Technology Threat Mitigation Methods Integration Of Risk Management Into Sdlc Infographics PDF template with various stages. Focus and dispense information on one stages using this creative set, that comes with editable features. It contains large content boxes to add your information on topics like Development, Implementation, Risk Management Activities. You can also showcase facts, figures, and other relevant content using this PPT layout. Grab it now.
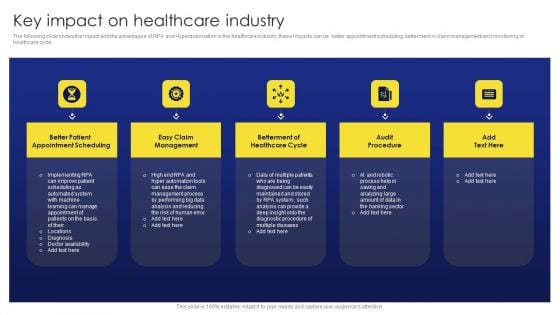
Deployment Procedure Of Hyper Automation Key Impact On Healthcare Industry Infographics PDF
The following slide shows the impact and the advantages of RPA and Hyperautomation in the healthcare industry, these impacts can be better appointment scheduling, betterment in claim management and monitoring of healthcare cycle. From laying roadmaps to briefing everything in detail, our templates are perfect for you. You can set the stage with your presentation slides. All you have to do is download these easy to edit and customizable templates. Deployment Procedure Of Hyper Automation Key Impact On Healthcare Industry Infographics PDF will help you deliver an outstanding performance that everyone would remember and praise you for. Do download this presentation today.
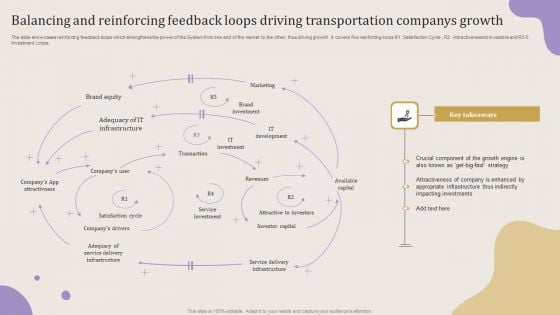
Balancing And Reinforcing Feedback Loops Driving Transportation Companys Growth Infographics PDF
The slide showcases reinforcing feedback loops which strengthens the power of the System from one end of the market to the other, thus driving growth. It covers five reinforcing loops R1 Satisfaction Cycle, R2 Attractiveness to Investors and R3 5 Investment Loops. Showcasing this set of slides titled Balancing And Reinforcing Feedback Loops Driving Transportation Companys Growth Infographics PDF. The topics addressed in these templates are Marketing, Brand Equity, Brand Investment. All the content presented in this PPT design is completely editable. Download it and make adjustments in color, background, font etc. as per your unique business setting.
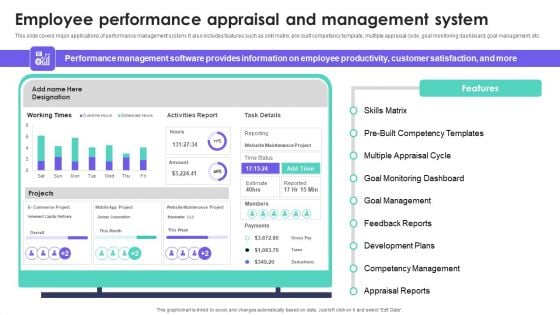
HRMS Execution Plan Employee Performance Appraisal And Management System Infographics PDF
This slide covers major applications of performance management system. It also includes features such as skill matrix, pre-built competency template, multiple appraisal cycle, goal monitoring dashboard, goal management, etc. Take your projects to the next level with our ultimate collection of HRMS Execution Plan Employee Performance Appraisal And Management System Infographics PDF. Slidegeeks has designed a range of layouts that are perfect for representing task or activity duration, keeping track of all your deadlines at a glance. Tailor these designs to your exact needs and give them a truly corporate look with your own brand colors they will make your projects stand out from the rest.
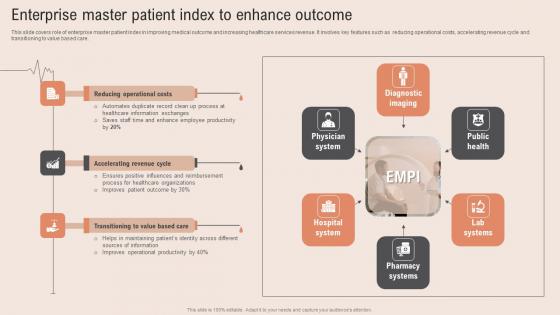
Enterprise Master Patient Healthcare Information Tech To Enhance Medical Facilities Infographics Pdf
This slide covers role of enterprise master patient index in improving medical outcome and increasing healthcare services revenue. It involves key features such as reducing operational costs, accelerating revenue cycle and transitioning to value based care. Whether you have daily or monthly meetings, a brilliant presentation is necessary. Enterprise Master Patient Healthcare Information Tech To Enhance Medical Facilities Infographics Pdf can be your best option for delivering a presentation. Represent everything in detail using Enterprise Master Patient Healthcare Information Tech To Enhance Medical Facilities Infographics Pdf and make yourself stand out in meetings. The template is versatile and follows a structure that will cater to your requirements. All the templates prepared by Slidegeeks are easy to download and edit. Our research experts have taken care of the corporate themes as well. So, give it a try and see the results. This slide covers role of enterprise master patient index in improving medical outcome and increasing healthcare services revenue. It involves key features such as reducing operational costs, accelerating revenue cycle and transitioning to value based care.
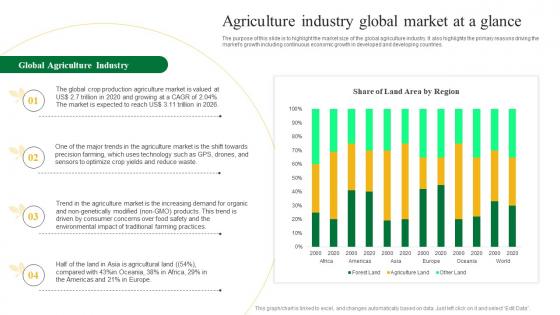
Agriculture Industry Global Market Agriculture Business Plan Go To Market Strategy Infographics Pdf
The purpose of this slide is to highlight the market size of the global agriculture industry. It also highlights the primary reasons driving the markets growth including continuous economic growth in developed and developing countries. Make sure to capture your audiences attention in your business displays with our gratis customizable Agriculture Industry Global Market Agriculture Business Plan Go To Market Strategy Infographics Pdf. These are great for business strategies, office conferences, capital raising or task suggestions. If you desire to acquire more customers for your tech business and ensure they stay satisfied, create your own sales presentation with these plain slides. The purpose of this slide is to highlight the market size of the global agriculture industry. It also highlights the primary reasons driving the markets growth including continuous economic growth in developed and developing countries.
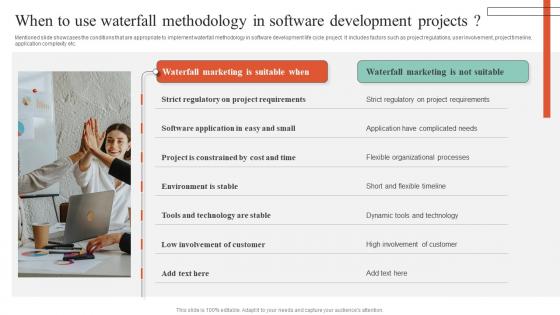
When To Use Waterfall Methodology In Software Executing Guide For Waterfall Infographics Pdf
Mentioned slide showcases the conditions that are appropriate to implement waterfall methodology in software development life cycle project. It includes factors such as project regulations, user involvement, project timeline, application complexity etc. The best PPT templates are a great way to save time, energy, and resources. Slidegeeks have 100 percent editable powerpoint slides making them incredibly versatile. With these quality presentation templates, you can create a captivating and memorable presentation by combining visually appealing slides and effectively communicating your message. Download When To Use Waterfall Methodology In Software Executing Guide For Waterfall Infographics Pdf from Slidegeeks and deliver a wonderful presentation. Mentioned slide showcases the conditions that are appropriate to implement waterfall methodology in software development life cycle project. It includes factors such as project regulations, user involvement, project timeline, application complexity etc.
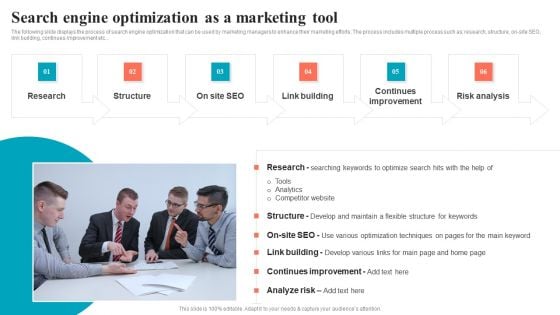
Brand Positioning Through Successful Search Engine Optimization As A Marketing Tool Infographics PDF
The following slide displays the process of search engine optimization that can be used by marketing managers to enhance their marketing efforts. The process includes multiple process such as research, structure, on site SEO, link building, continues improvement etc. This modern and well arranged Brand Positioning Through Successful Search Engine Optimization As A Marketing Tool Infographics PDF provides lots of creative possibilities. It is very simple to customize and edit with the Powerpoint Software. Just drag and drop your pictures into the shapes. All facets of this template can be edited with Powerpoint no extra software is necessary. Add your own material, put your images in the places assigned for them, adjust the colors, and then you can show your slides to the world, with an animated slide included.
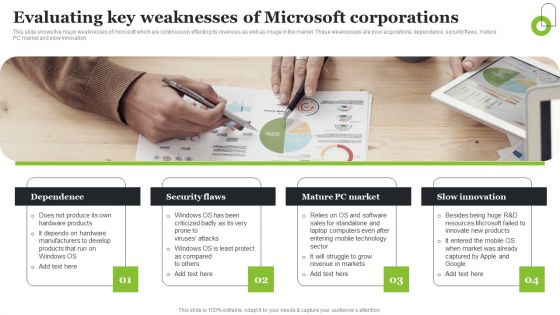
Microsoft Strategic Plan To Become Market Leader Evaluating Key Weaknesses Of Microsoft Corporations Infographics PDF
This slide shows five major weaknesses of microsoft which are continuously effecting its revenues as well as image in the market. These weaknesses are poor acquisitions, dependance, security flaws, mature PC market and slow innovation. Take your projects to the next level with our ultimate collection of Microsoft Strategic Plan To Become Market Leader Evaluating Key Weaknesses Of Microsoft Corporations Infographics PDF. Slidegeeks has designed a range of layouts that are perfect for representing task or activity duration, keeping track of all your deadlines at a glance. Tailor these designs to your exact needs and give them a truly corporate look with your own brand colors they will make your projects stand out from the rest

Manufacturing Quality Assurance And Control Measures Dashboard To Evaluate Manufacturing Quality Infographics PDF
This slide showcases the KPIs that would help a business organization to evaluate improvements in the new production planning and control system. It includes total production, defective production, production rate, average cycle duration, etc. This modern and well arranged Manufacturing Quality Assurance And Control Measures Dashboard To Evaluate Manufacturing Quality Infographics PDF provides lots of creative possibilities. It is very simple to customize and edit with the Powerpoint Software. Just drag and drop your pictures into the shapes. All facets of this template can be edited with Powerpoint, no extra software is necessary. Add your own material, put your images in the places assigned for them, adjust the colors, and then you can show your slides to the world, with an animated slide included.
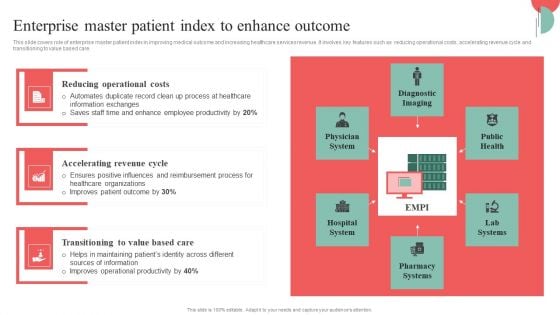
Incorporating HIS To Enhance Healthcare Services Enterprise Master Patient Index To Enhance Outcome Infographics PDF
This slide covers role of enterprise master patient index in improving medical outcome and increasing healthcare services revenue. It involves key features such as reducing operational costs, accelerating revenue cycle and transitioning to value based care. Present like a pro with Incorporating HIS To Enhance Healthcare Services Enterprise Master Patient Index To Enhance Outcome Infographics PDF Create beautiful presentations together with your team, using our easy to use presentation slides. Share your ideas in real time and make changes on the fly by downloading our templates. So whether you are in the office, on the go, or in a remote location, you can stay in sync with your team and present your ideas with confidence. With Slidegeeks presentation got a whole lot easier. Grab these presentations today.
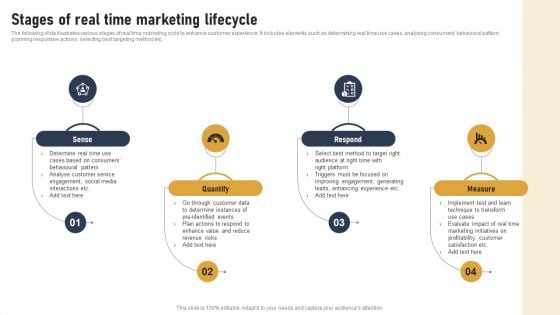
Incorporating Real Time Marketing For Improved Consumer Stages Of Real Time Marketing Lifecycle Infographics PDF
The following slide illustrates various stages of real time marketing cycle to enhance customer experience. It includes elements such as determining real time use cases, analyzing consumers behavioral pattern, planning responsive actions, selecting best targeting method etc. The Incorporating Real Time Marketing For Improved Consumer Stages Of Real Time Marketing Lifecycle Infographics PDF is a compilation of the most recent design trends as a series of slides. It is suitable for any subject or industry presentation, containing attractive visuals and photo spots for businesses to clearly express their messages. This template contains a variety of slides for the user to input data, such as structures to contrast two elements, bullet points, and slides for written information. Slidegeeks is prepared to create an impression.
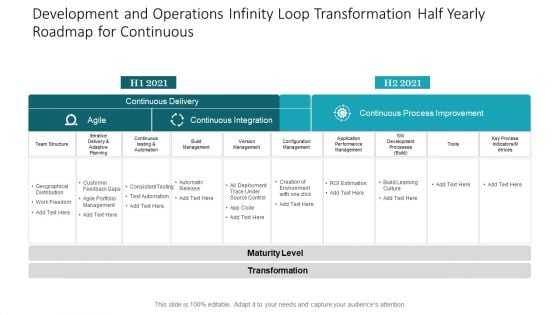
Development And Operations Infinity Loop Transformation Half Yearly Roadmap For Continuous Infographics
Presenting our jaw dropping development and operations infinity loop transformation half yearly roadmap for continuous infographics. You can alternate the color, font size, font type, and shapes of this PPT layout according to your strategic process. This PPT presentation is compatible with Google Slides and is available in both standard screen and widescreen aspect ratios. You can also download this well researched PowerPoint template design in different formats like PDF, JPG, and PNG. So utilize this visually appealing design by clicking the download button given below.
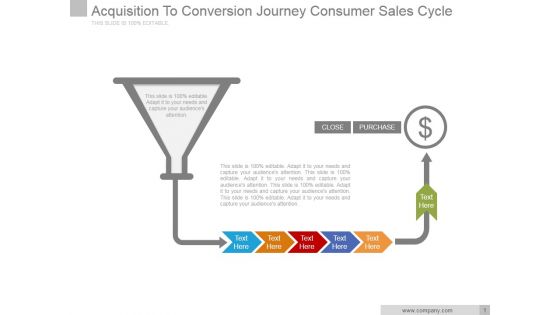
Acquisition To Conversion Journey Consumer Sales Cycle Ppt PowerPoint Presentation Infographics
This is a acquisition to conversion journey consumer sales cycle ppt powerpoint presentation infographics. This is a one stage process. The stages in this process are business, marketing, management, symbol, arrow, funnel.
Project Management Life Cycle Start Up Execution And Close Out Ppt PowerPoint Presentation Icon Infographics
This is a project management life cycle start up execution and close out ppt powerpoint presentation icon infographics. This is a four stage process. The stages in this process are 4 phases, process, planning.
Challenges Of Consumer Engagement With Icons Ppt PowerPoint Presentation Portfolio Infographics
Presenting this set of slides with name challenges of consumer engagement with icons ppt powerpoint presentation portfolio infographics. This is a four stage process. The stages in this process are customer engagement, consumer retention, satisfaction process. This is a completely editable PowerPoint presentation and is available for immediate download. Download now and impress your audience.
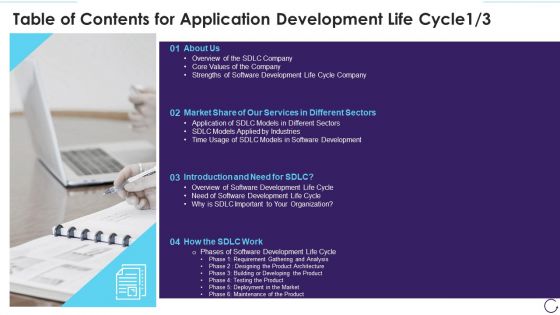
Table Of Contents For Application Development Life Cycle Market Infographics PDF
Presenting strengths of software development life cycle company topics pdf to provide visual cues and insights. Share and navigate important information on four stages that need your due attention. This template can be used to pitch topics like market, services, company, development, organization. In addtion, this PPT design contains high resolution images, graphics, etc, that are easily editable and available for immediate download.
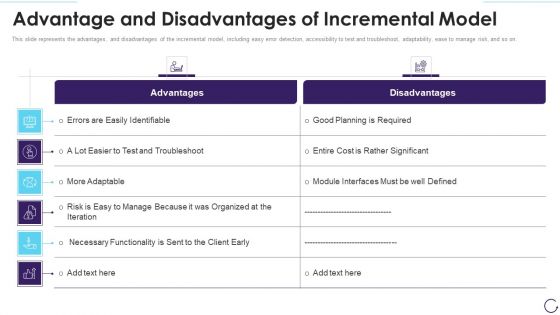
Application Development Life Cycle Advantage And Disadvantages Of Incremental Model Infographics PDF
This slide represents the advantages, and disadvantages of the incremental model, including easy error detection, accessibility to test and troubleshoot, adaptability, ease to manage risk, and so on. This is a 30 60 90 days plan for software development life cycle structure pdf template with various stages. Focus and dispense information on two stages using this creative set, that comes with editable features. It contains large content boxes to add your information on topics like advantage and disadvantages of incremental model. You can also showcase facts, figures, and other relevant content using this PPT layout. Grab it now.
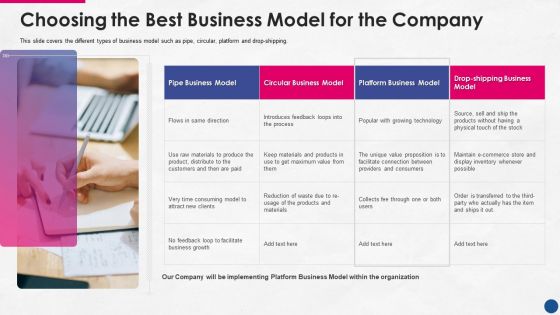
Incorporating Platform Business Model In The Organization Choosing The Best Business Model For The Company Infographics PDF
This slide covers the different types of business model such as pipe, circular, platform and drop-shipping. Presenting incorporating platform business model in the organization choosing the best business model for the company infographics pdf to provide visual cues and insights. Share and navigate important information on one stages that need your due attention. This template can be used to pitch topics like pipe, circular, platform, drop shipping. In addtion, this PPT design contains high resolution images, graphics, etc, that are easily editable and available for immediate download.
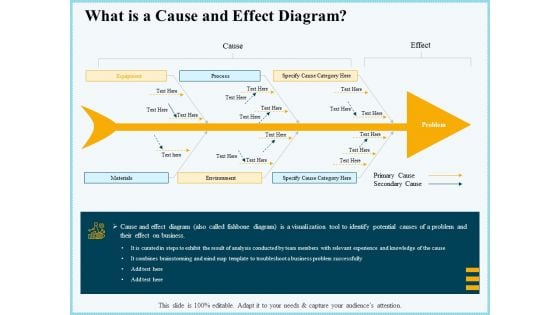
Vicious Circle Effect On Quality Assurance What Is A Cause And Effect Diagram Ppt Infographics Deck PDF
Presenting vicious circle effect on quality assurance what is a cause and effect diagram ppt infographics deck pdf to provide visual cues and insights. Share and navigate important information on two stages that need your due attention. This template can be used to pitch topics like equipment, process, specify cause category here, materials, environment, primary cause, secondary cause, problem. In addtion, this PPT design contains high-resolution images, graphics, etc, that are easily editable and available for immediate download.
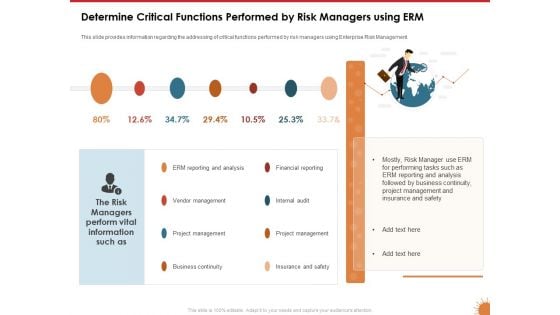
Impact Of COVID 19 On The Hospitality Industry Determine Critical Functions Performed By Risk Managers Using ERM Infographics PDF
Presenting this set of slides with name impact of covid 19 on the hospitality industry determine critical functions performed by risk managers using erm infographics pdf. This is a one stage process. The stages in this process are erm reporting and analysis, vendor management, project management, business continuity, financial reporting, internal audit, insurance and safety. This is a completely editable PowerPoint presentation and is available for immediate download. Download now and impress your audience.
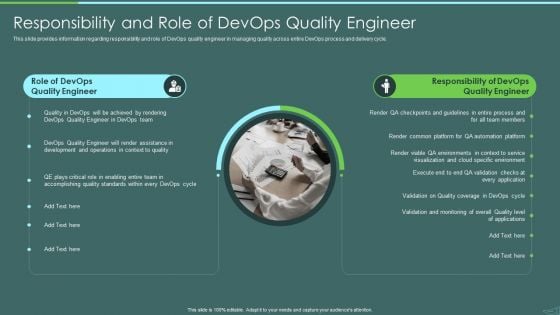
Devops Quality Assurance And Testing To Improve Speed And Quality IT Responsibility And Role Of Devops Infographics PDF
This slide provides information regarding responsibility and role of DevOps quality engineer in managing quality across entire DevOps process and delivery cycle. Presenting devops quality assurance and testing to improve speed and quality it responsibility and role of devops infographics pdf to provide visual cues and insights. Share and navigate important information on two stages that need your due attention. This template can be used to pitch topics like role of devops quality engineer, responsibility of devops quality engineer. In addtion, this PPT design contains high resolution images, graphics, etc, that are easily editable and available for immediate download.
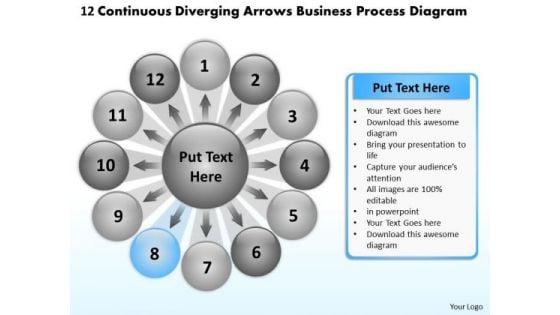
Diverging Arrows Business Process Diagram Relative Cycle PowerPoint Templates
We present our diverging arrows business process diagram Relative Cycle PowerPoint templates.Download our Arrows PowerPoint Templates because It can Conjure up grand ideas with our magical PowerPoint Templates and Slides. Leave everyone awestruck by the end of your presentation. Download and present our Process and flows PowerPoint Templates because you can Refine them all as you take them through the numerous filtering stages of the funnel of your quality control process. Use our Flow charts PowerPoint Templates because you can Trigger audience minds with your interesting ideas. Download our Business PowerPoint Templates because your thoughts are pointed and sharp as arrows. Present our Marketing PowerPoint Templates because Our PowerPoint Templates and Slides are designed to help you succeed. They have all the ingredients you need.Use these PowerPoint slides for presentations relating to Arrow, business, chart, circle, circular,cycle, design, development, diagram,flow, flowchart, flowchart, gears, graphic,blue, implementation, infographic,lifecycle, management, model, optimize, output, process, recycle, recycling. The prominent colors used in the PowerPoint template are Blue, Black, Gray. People tell us our diverging arrows business process diagram Relative Cycle PowerPoint templates help you meet deadlines which are an element of today's workplace. Just browse and pick the slides that appeal to your intuitive senses. Professionals tell us our development PowerPoint templates and PPT Slides are Bright. We assure you our diverging arrows business process diagram Relative Cycle PowerPoint templates are designed by a team of presentation professionals. PowerPoint presentation experts tell us our cycle PowerPoint templates and PPT Slides are Efficient. We assure you our diverging arrows business process diagram Relative Cycle PowerPoint templates are readymade to fit into any presentation structure. People tell us our circular PowerPoint templates and PPT Slides are the best it can get when it comes to presenting. Leave a good taste with our Diverging Arrows Business Process Diagram Relative Cycle PowerPoint Templates. They always add to the fare.
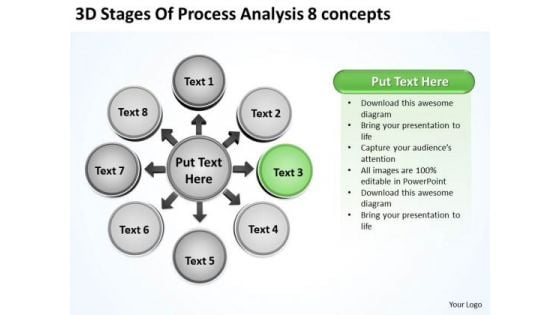
3d Stages Of Process Analysis 8 Concepts Cycle Spoke Diagram PowerPoint Templates
We present our 3d stages of process analysis 8 concepts Cycle Spoke Diagram PowerPoint templates.Download our Shapes PowerPoint Templates because you can Educate your team with the attention to be paid. Use our Process and Flows PowerPoint Templates because the colour coding of our templates are specifically designed to highlight you points. Use our Success PowerPoint Templates because the success of your venture depends on the performance of every team member. Download and present our Circle Charts PowerPoint Templates because our templates illustrates your ability. Present our Business PowerPoint Templates because you watch them slowly start to savour the flavour you have served them.Use these PowerPoint slides for presentations relating to Arrow, art, blank, blue, business, chart,circular, clip, clipart, clockwise, colorful,copyspace, corporate, curving, cycle,diagram, directional, financial, flow,graph, graphic, green, illustration,infographic, modern, pie, process, red,round, segments, seven, shape, slices,stages, steps,. The prominent colors used in the PowerPoint template are Green dark , Gray, White. The feedback we get is that our 3d stages of process analysis 8 concepts Cycle Spoke Diagram PowerPoint templates are Appealing. The feedback we get is that our blank PowerPoint templates and PPT Slides are Dynamic. Presenters tell us our 3d stages of process analysis 8 concepts Cycle Spoke Diagram PowerPoint templates are Functional. The feedback we get is that our business PowerPoint templates and PPT Slides will help them to explain complicated concepts. PowerPoint presentation experts tell us our 3d stages of process analysis 8 concepts Cycle Spoke Diagram PowerPoint templates are Splendid. Customers tell us our clip PowerPoint templates and PPT Slides are Festive. Your ideas will raise the stocks. Gain equity with our 3d Stages Of Process Analysis 8 Concepts Cycle Spoke Diagram PowerPoint Templates.
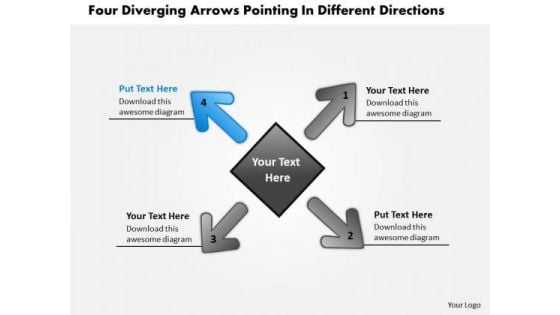
Diverging Arrows Pointing Different Direction Cycle Network PowerPoint Templates
We present our diverging arrows pointing different direction Cycle Network PowerPoint templates.Download our Arrows PowerPoint Templates because this graphics helps you to prove how they mesh to motivate the company team and provide the steam to activate the composite machine. Download and present our Process and flows PowerPoint Templates because this Slide offers an excellent background to build up the various stages of your business process. Download and present our Flow charts PowerPoint Templates because you can Determine your targets and sequence them as per your priorities. Download our Business PowerPoint Templates because a lot of dissimilar elements needing to gel to strike the deal. Use our Marketing PowerPoint Templates because customer satisfaction is a mantra of the marketplace. Building a loyal client base is an essential element of your business.Use these PowerPoint slides for presentations relating to Arrow, business, chart, circle, circular,cycle, design, development, diagram,flow, flowchart, flowchart, gears, graphic,blue, implementation, infographic,lifecycle, management, model, optimize, output, process, recycle, recycling. The prominent colors used in the PowerPoint template are Orange, Black, Gray. People tell us our diverging arrows pointing different direction Cycle Network PowerPoint templates are Nice. Professionals tell us our diagram PowerPoint templates and PPT Slides are Energetic. We assure you our diverging arrows pointing different direction Cycle Network PowerPoint templates are Precious. PowerPoint presentation experts tell us our circle PowerPoint templates and PPT Slides are Splendid. We assure you our diverging arrows pointing different direction Cycle Network PowerPoint templates are Wistful. People tell us our diagram PowerPoint templates and PPT Slides are Awesome. Grab the attention of your audience with our Diverging Arrows Pointing Different Direction Cycle Network PowerPoint Templates. Just download, type and present.
Curve Line Diagram With Icons Powerpoint Template
Our above slide contains diagram of curve line infographic. This infographic slide helps to exhibit business analysis. Use this diagram to impart more clarity to data and to create more sound impact on viewers.
Ten Staged Business Circle And Icons Powerpoint Template
This business slide displays infographic of ten staged business circle chart. Download this diagram to display information in visual manner. Visual effect of this diagram helps in maintaining the flow of the discussion and provides more clarity to the subject.
Cycle Of Option Tags With Six Icons Powerpoint Template
Our above business slide contains infographic cycle diagram. This slide is suitable to present six business options. Develop your strategy and communicate with your team with this professional slide design.
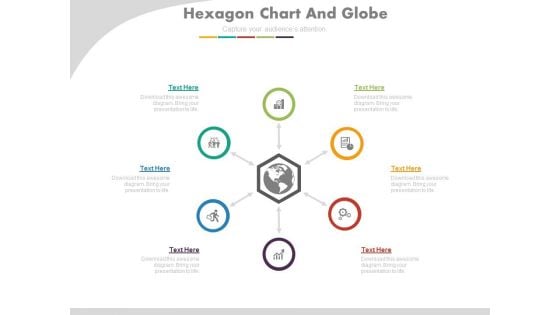
Hub And Spokes Chart For Global Business Planning Powerpoint Slides
Our above PPT slide contains hub and spokes infographic diagram. This business diagram helps to steps for global business planning. Use this diagram to impart more clarity to subject and to create more sound impact on viewers.
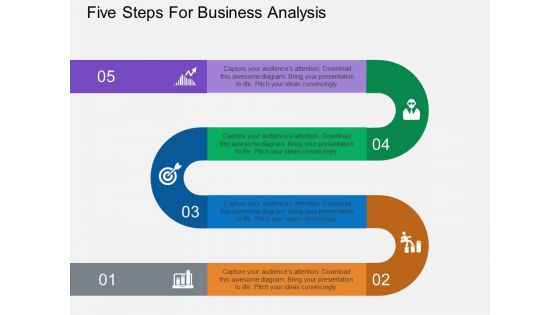
Five Steps For Business Analysis Powerpoint Template
Our above business diagram contains zigzag infographic layout. This slide is suitable to present marketing research and strategy. Use this business diagram to present your work in a more smart and precise manner.
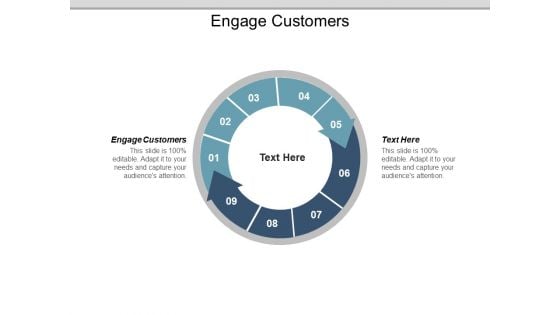
Engage Customers Ppt PowerPoint Presentation Summary Portrait
This is a business structure comparison chart ppt powerpoint presentation infographic template vector. This is a three stage process. The stages in this process are business structure comparison chart.

Zigzag Timeline With Six Arrows Powerpoint Templates
Our above business diagram contains zigzag infographic layout. This slide is suitable to present marketing research and strategy. Use this business diagram to present your work in a more smart and precise manner.
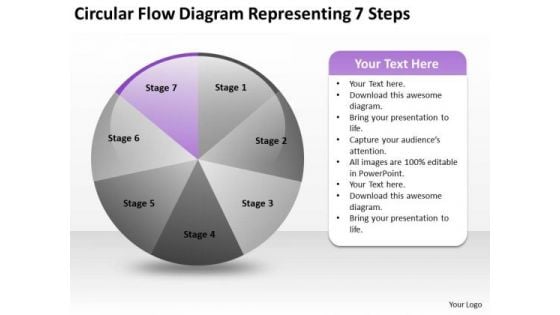
Flow Diagram Representing 7 Steps Business Plan Template PowerPoint Slides
We present our flow diagram representing 7 steps business plan template PowerPoint Slides.Use our Circle Charts PowerPoint Templates because Our PowerPoint Templates and Slides will weave a web of your great ideas. They are gauranteed to attract even the most critical of your colleagues. Download and present our Flow Charts PowerPoint Templates because Our PowerPoint Templates and Slides will fulfill your every need. Use them and effectively satisfy the desires of your audience. Present our Process and Flows PowerPoint Templates because You can Bait your audience with our PowerPoint Templates and Slides. They will bite the hook of your ideas in large numbers. Download our Business PowerPoint Templates because You have gained great respect for your brilliant ideas. Use our PowerPoint Templates and Slides to strengthen and enhance your reputation. Use our Success PowerPoint Templates because Our PowerPoint Templates and Slides has conjured up a web of all you need with the help of our great team. Use them to string together your glistening ideas.Use these PowerPoint slides for presentations relating to Pie, chart, round, flow, slices, steps, process, graph, wheel, corporate, business, blank, curving, diagram, copyspace, graphic,directional, shape, modern, cycle, illustration, circular, clipart, stages, seven, segments, clip, infographic, art, work, financial. The prominent colors used in the PowerPoint template are Purple, Gray, White. No idea is too far fetched for our Flow Diagram Representing 7 Steps Business Plan Template PowerPoint Slides. They will help you think it through.
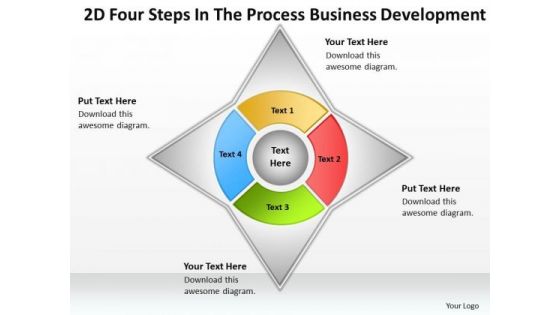
2d Four Steps In The Process Business Development Ppt Plan Ideas PowerPoint Slides
We present our 2d four steps in the process business development ppt plan ideas PowerPoint Slides.Use our Business PowerPoint Templates because our PowerPoint Templates and Slides will give your ideas the shape. Use our Marketing PowerPoint Templates because You can Channelise the thoughts of your team with our PowerPoint Templates and Slides. Urge them to focus on the goals you have set. Present our Process and Flows PowerPoint Templates because You can Zap them with our PowerPoint Templates and Slides. See them reel under the impact. Download and present our Stars PowerPoint Templates because Our PowerPoint Templates and Slides are aesthetically designed to attract attention. We gaurantee that they will grab all the eyeballs you need. Download our Shapes PowerPoint Templates because Our PowerPoint Templates and Slides help you meet the demand of the Market. Just browse and pick the slides that appeal to your intuitive senses.Use these PowerPoint slides for presentations relating to 3d,seven, decoration, model, form, step, order, flow, business, plan, concept, vector, success, rotation, presentation, tasks, symbol, template, diagram, circle, brochure,scheme, element, marketing, technology, idea, development, management, graph, cycle, piece, circular, system, options, strategy, project, processes, infographic, levels, connected, part, background, structure. The prominent colors used in the PowerPoint template are Yellow, Red, Green. Our 2d Four Steps In The Process Business Development Ppt Plan Ideas PowerPoint Slides give you excellent support. Get a firm base to work upon.
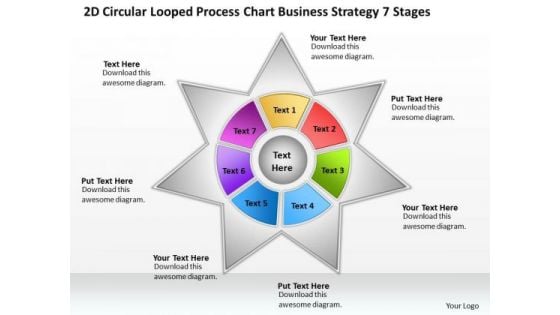
Business Strategy Consultant 7 Stages Ppt Plan Template PowerPoint Slides
We present our business strategy consultant 7 stages ppt plan template PowerPoint Slides.Use our Business PowerPoint Templates because you can Set pulses racing with our PowerPoint Templates and Slides. They will raise the expectations of your team. Download our Marketing PowerPoint Templates because Our PowerPoint Templates and Slides are truly out of this world. Even the MIB duo has been keeping tabs on our team. Present our Process and Flows PowerPoint Templates because You can Rise to the occasion with our PowerPoint Templates and Slides. You will bring your audience on their feet in no time. Use our Stars PowerPoint Templates because You can Connect the dots. Fan expectations as the whole picture emerges. Download our Shapes PowerPoint Templates because You can Flag mark the road ahead with our PowerPoint Templates and Slides. They will unfurl your brilliant plans to your audience.Use these PowerPoint slides for presentations relating to 3d,seven, decoration, model, form, step, order, flow, business, plan, concept, vector, success, rotation, presentation, tasks, symbol, template, diagram, circle, brochure,scheme, element, marketing, technology, idea, development, management, graph, cycle, piece, circular, system, options, strategy, project, processes, infographic, levels, connected, part, background, structure. The prominent colors used in the PowerPoint template are Yellow, Red, Green. Facilitate change with our Business Strategy Consultant 7 Stages Ppt Plan Template PowerPoint Slides. Gain audience acceptance faster.
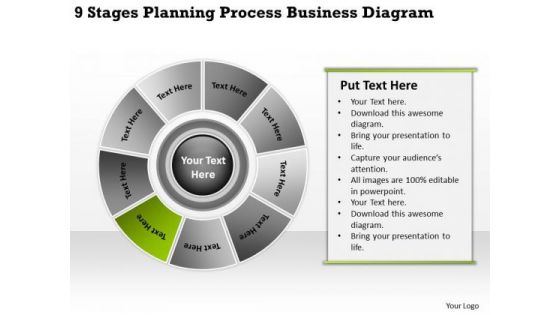
Process Business PowerPoint Theme Diagram Continuity Plans Templates
We present our process business powerpoint theme diagram continuity plans templates.Download and present our Circle Charts PowerPoint Templates because It can Bubble and burst with your ideas. Present our Business PowerPoint Templates because Our PowerPoint Templates and Slides will bullet point your ideas. See them fall into place one by one. Use our Shapes PowerPoint Templates because our PowerPoint Templates and Slides will give your ideas the shape. Present our Communication PowerPoint Templates because It will let you Set new benchmarks with our PowerPoint Templates and Slides. They will keep your prospects well above par. Download our Process and Flows PowerPoint Templates because You canTake a leap off the starting blocks with our PowerPoint Templates and Slides. They will put you ahead of the competition in quick time.Use these PowerPoint slides for presentations relating to steps, flow, diagram, chart, process, graph, wheel, pie, stages, segments, green, corporate, red, business, blank, arrow, yellow, curving, copyspace, slices, graphic, directional, shape, modern, cycle, illustration, circular, round, clipart, seven, colorful, clip, blue, infographic, art, work, puzzle, clockwise, financial. The prominent colors used in the PowerPoint template are Green, Gray, Black. Apply your brains in the correct direction. Our Process Business PowerPoint Theme Diagram Continuity Plans Templates will align them accurately.
Process Business PowerPoint Theme Diagram Plans Format Templates
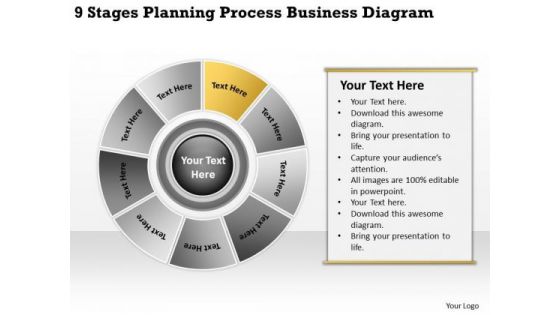
We present our process business powerpoint theme diagram plans format templates.Use our Circle Charts PowerPoint Templates because Our PowerPoint Templates and Slides have the Brilliant backdrops. Guaranteed to illuminate the minds of your audience. Present our Business PowerPoint Templates because Our PowerPoint Templates and Slides has conjured up a web of all you need with the help of our great team. Use them to string together your glistening ideas. Use our Shapes PowerPoint Templates because It will Strengthen your hand with your thoughts. They have all the aces you need to win the day. Present our Communication PowerPoint Templates because Our PowerPoint Templates and Slides will let your team Walk through your plans. See their energy levels rise as you show them the way. Download our Process and Flows PowerPoint Templates because Our PowerPoint Templates and Slides will effectively help you save your valuable time. They are readymade to fit into any presentation structure. Use these PowerPoint slides for presentations relating to steps, flow, diagram, chart, process, graph, wheel, pie, stages, segments, green, corporate, red, business, blank, arrow, yellow, curving, copyspace, slices, graphic, directional, shape, modern, cycle, illustration, circular, round, clipart, seven, colorful, clip, blue, infographic, art, work, puzzle, clockwise, financial. The prominent colors used in the PowerPoint template are Yellow, Gray, Black. There is no destination too far for our Process Business PowerPoint Theme Diagram Plans Format Templates. They willget you there within a jiffy.


 Continue with Email

 Home
Home


