Infographic Icons
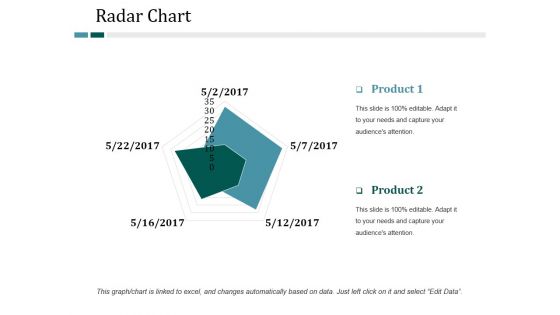
Radar Chart Ppt PowerPoint Presentation Infographic Template Backgrounds
This is a radar chart ppt powerpoint presentation infographic template backgrounds. This is a two stage process. The stages in this process are radar chart, finance, marketing, strategy, business.

Column Chart Ppt PowerPoint Presentation Infographic Template Slides
This is a column chart ppt powerpoint presentation infographic template slides. This is a two stage process. The stages in this process are column chart, finance, marketing, strategy, business.
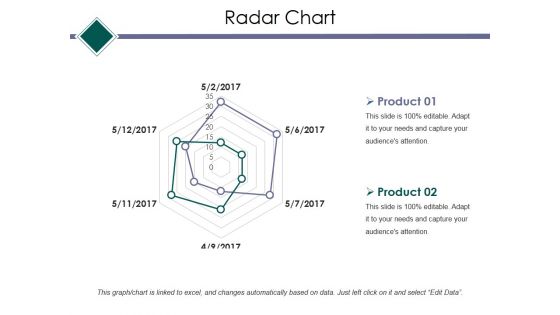
Radar Chart Ppt PowerPoint Presentation Infographic Template Example Topics
This is a radar chart ppt powerpoint presentation infographic template example topics. This is a two stage process. The stages in this process are radar chart, finance, marketing, strategy, business.
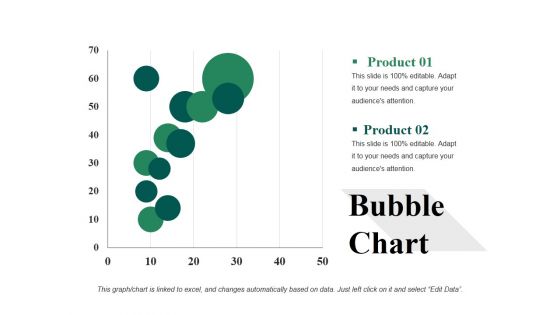
Bubble Chart Ppt PowerPoint Presentation Infographic Template Example 2015
This is a bubble chart ppt powerpoint presentation infographic template example 2015. This is a two stage process. The stages in this process are analysis, strategy, finance, business, bubble chart.
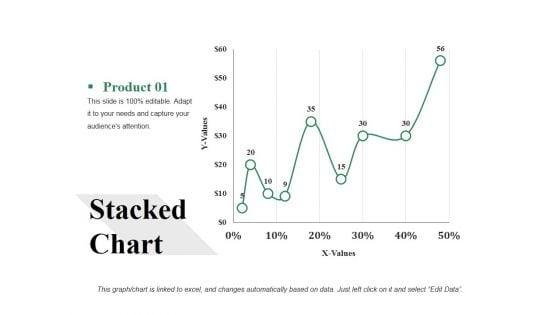
Stacked Chart Ppt PowerPoint Presentation Gallery Infographic Template
This is a stacked chart ppt powerpoint presentation gallery infographic template. This is a one stage process. The stages in this process are stacked chart, finance, analysis, marketing, business.
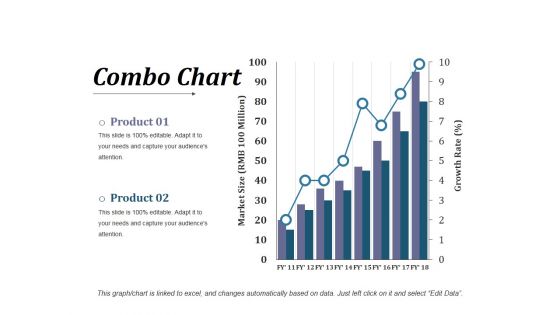
Combo Chart Ppt PowerPoint Presentation Infographic Template Visuals
This is a combo chart ppt powerpoint presentation infographic template visuals. This is a three stage process. The stages in this process are business, finance, strategy, analysis, combo chart.
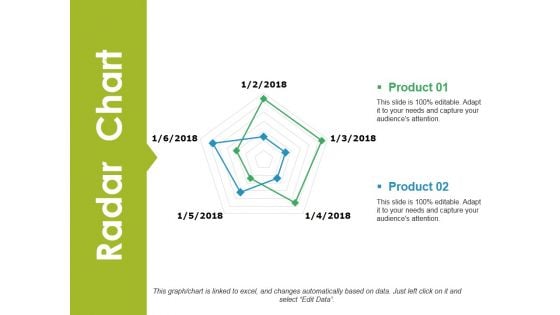
Radar Chart Ppt PowerPoint Presentation Infographic Template Tips
This is a radar chart ppt powerpoint presentation infographic template tips. This is a two stage process. The stages in this process are radar chart, business, finance, analysis, strategy.
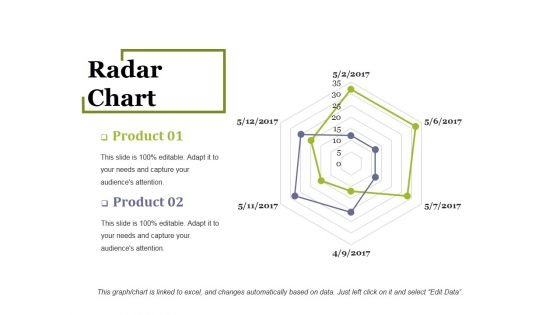
Radar Chart Ppt PowerPoint Presentation Infographic Template Outline
This is a radar chart ppt powerpoint presentation infographic template outline. This is a two stage process. The stages in this process are radar chart, finance, analysis, management, business.
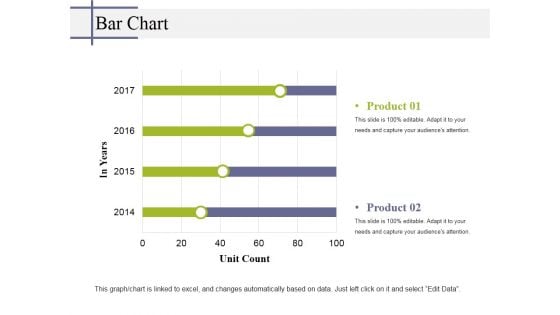
Bar Chart Ppt PowerPoint Presentation Infographic Template Tips
This is a bar chart ppt powerpoint presentation infographic template tips. This is a two stage process. The stages in this process are bar chart, finance, marketing, strategy, business.
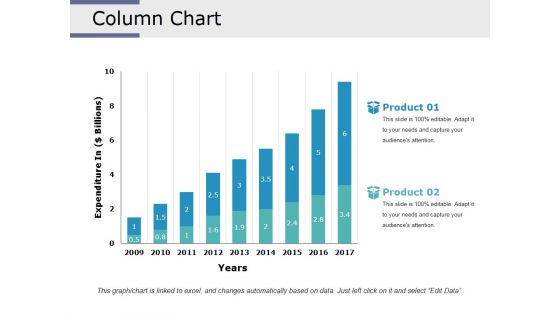
Column Chart Ppt PowerPoint Presentation Infographic Template Designs Download
This is a column chart ppt powerpoint presentation infographic template designs download. This is a two stage process. The stages in this process are column chart, analysis, finance, marketing, strategy, business.
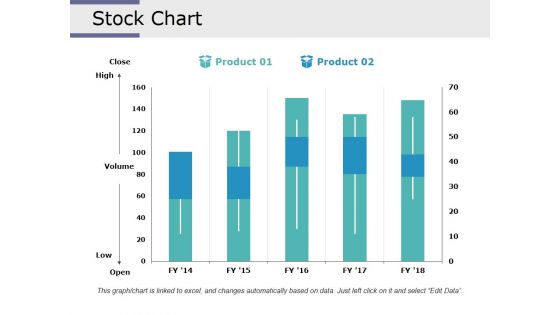
Stock Chart Ppt PowerPoint Presentation Infographic Template Design Inspiration
This is a stock chart ppt powerpoint presentation infographic template design inspiration. This is a two stage process. The stages in this process are stock chart, finance, analysis, business, marketing.
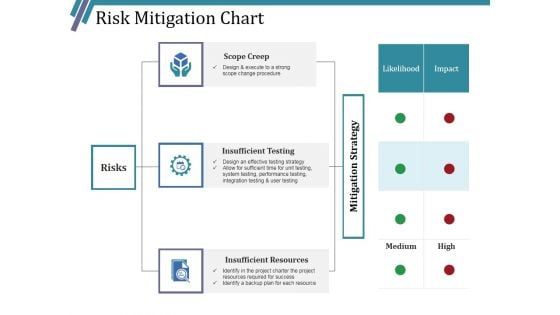
Risk Mitigation Chart Ppt PowerPoint Presentation Infographic Template Layouts
This is a risk mitigation chart ppt powerpoint presentation infographic template layouts. This is a three stage process. The stages in this process are scope creep, insufficient testing, insufficient resources, risks.
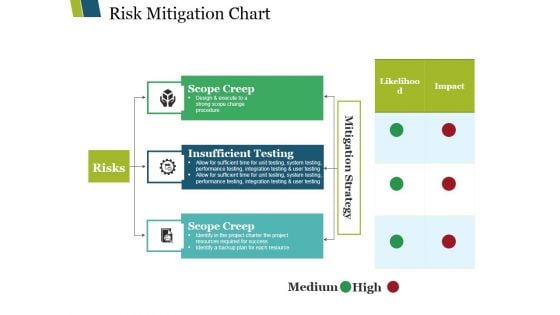
Risk Mitigation Chart Ppt PowerPoint Presentation Infographic Template Elements
This is a risk mitigation chart ppt powerpoint presentation infographic template elements. This is a three stage process. The stages in this process are scope creep, insufficient testing, insufficient resources, risks.
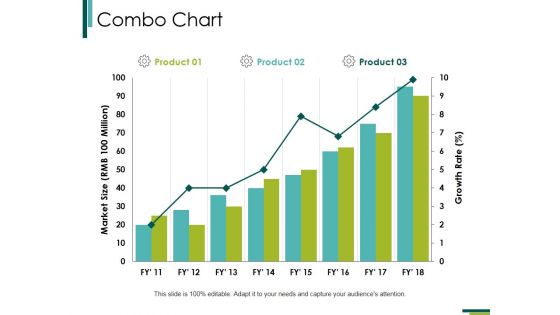
Combo Chart Ppt PowerPoint Presentation Infographic Template Slide Portrait
This is a combo chart ppt powerpoint presentation infographic template slide portrait. This is a three stage process. The stages in this process are combo chart, finance, marketing, strategy, business, growth.
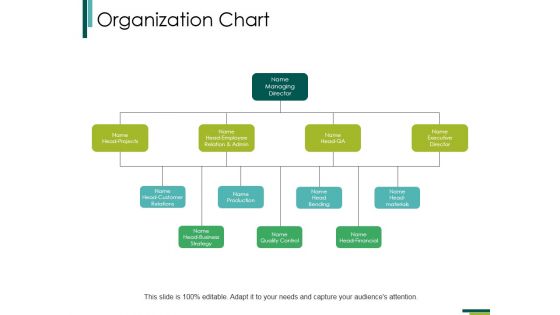
Organization Chart Ppt PowerPoint Presentation Infographic Template Files
This is a organization chart ppt powerpoint presentation infographic template files. This is a four stage process. The stages in this process are managing director, head projects, head business strategy, quality control.
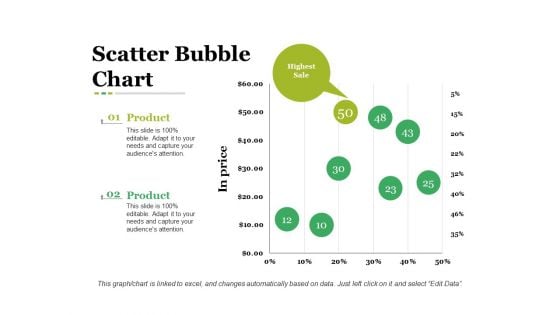
Scatter Bubble Chart Ppt PowerPoint Presentation Infographic Template Graphic Images
This is a scatter bubble chart ppt powerpoint presentation infographic template graphic images. This is a two stage process. The stages in this process are business, in price, bubble chart, marketing, strategy.
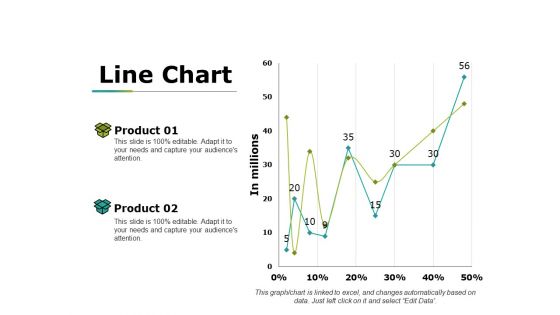
Line Chart Ppt PowerPoint Presentation Infographic Template Design Ideas
This is a line chart ppt powerpoint presentation infographic template design ideas. This is a two stage process. The stages in this process are product, in millions, percentage, line chart, success.
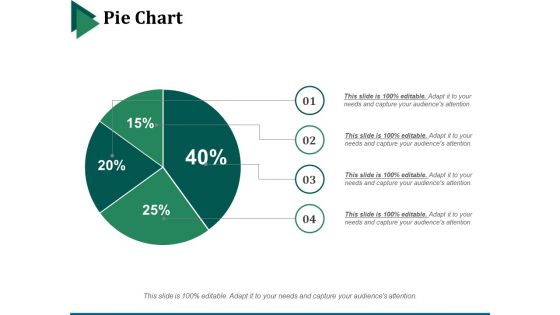
Pie Chart Ppt PowerPoint Presentation Infographic Template Backgrounds
This is a pie chart ppt powerpoint presentation infographic template backgrounds. This is a four stage process. The stages in this process are pie chart, marketing, strategy, finance, analysis.
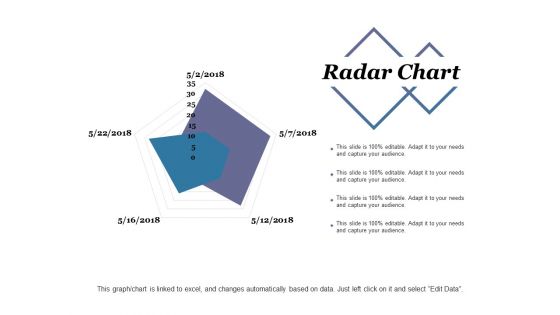
Radar Chart Ppt PowerPoint Presentation Infographic Template Sample
This is a radar chart ppt powerpoint presentation infographic template sample. This is a two stage process. The stages in this process are radar chart, finance, marketing, strategy, analysis.
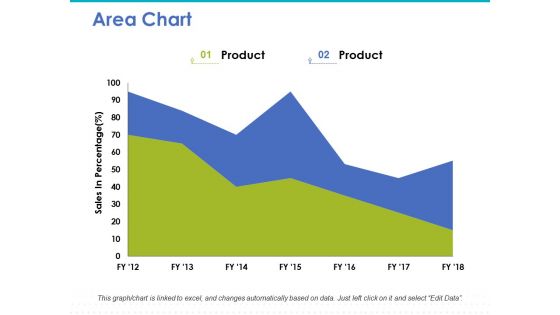
Area Chart Ppt PowerPoint Presentation Infographic Template Inspiration
This is a area chart ppt powerpoint presentation infographic template inspiration. This is a two stage process. The stages in this process are area chart, marketing, strategy, finance, planning.
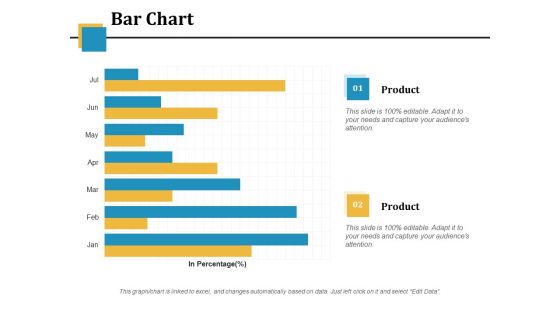
Bar Chart Ppt PowerPoint Presentation Infographic Template Picture
This is a bar chart ppt powerpoint presentation infographic template picture. This is a two stage process. The stages in this process are financial, in percentage, business, marketing, bar chart.
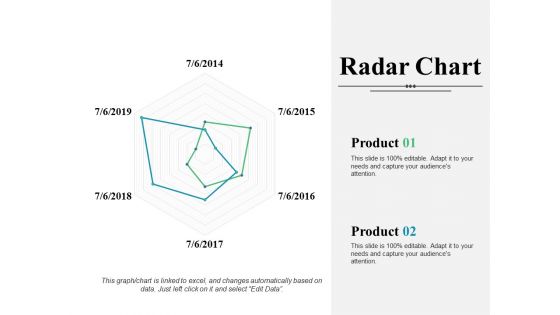
Radar Chart Ppt PowerPoint Presentation Infographic Template Introduction
This is a radar chart ppt powerpoint presentation infographic template introduction. This is a two stage process. The stages in this process are radar chart, finance, marketing, strategy, analysis, business.

Area Chart Ppt PowerPoint Presentation Infographic Template Designs
This is a area chart ppt powerpoint presentation infographic template designs. This is a two stage process. The stages in this process are area chart, finance, marketing, strategy, business.
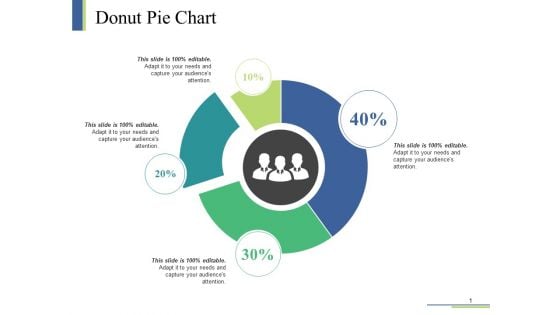
Donut Pie Chart Ppt PowerPoint Presentation Visual Aids Infographic Template
This is a donut pie chart ppt powerpoint presentation visual aids infographic template. This is a four stage process. The stages in this process are donut pie chart, finance, planning, management, marketing.
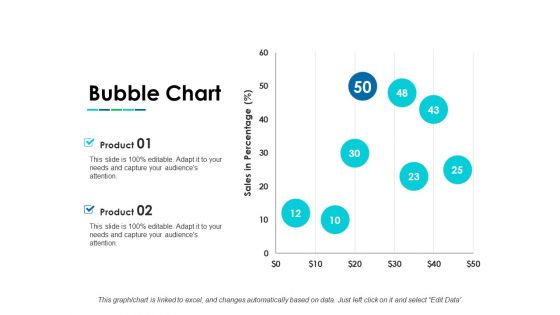
Bubble Chart Ppt PowerPoint Presentation Infographic Template Layouts
This is a bubble chart ppt powerpoint presentation infographic template layouts. This is a two stage process. The stages in this process are bubble chart, product, sales in percentage, growth.
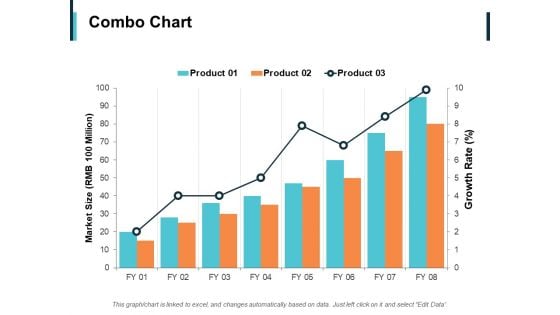
Combo Chart Finance Ppt PowerPoint Presentation Infographic Template Outline
This is a combo chart finance ppt powerpoint presentation infographic template outline. This is a three stage process. The stages in this process are combo chart, finance, analysis, business, investment.
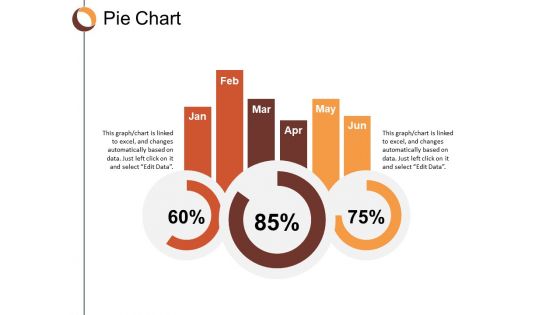
Pie Chart Finance Ppt Powerpoint Presentation Infographic Template Clipart
This is a pie chart finance ppt powerpoint presentation infographic template clipart. This is a three stage process. The stages in this process are pie chart, finance, marketing, business, analysis.

Area Chart Product Percentage Ppt PowerPoint Presentation Infographic Template Slide
This is a area chart product percentage ppt powerpoint presentation infographic template slide. This is a four stage process. The stages in this process are area chart, finance, marketing, management, investment.
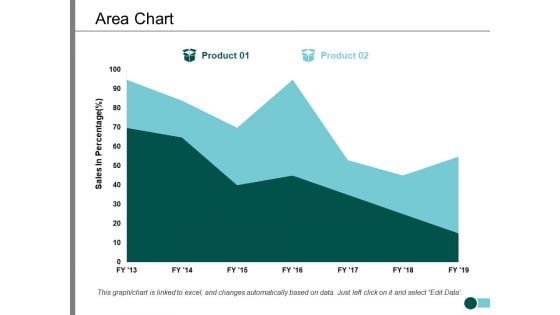
Area Chart Percentage Product Ppt PowerPoint Presentation Infographic Template Slide
This is a area chart percentage product ppt powerpoint presentation infographic template slide. This is a two stage process. The stages in this process are area chart, finance, marketing, management, investment.
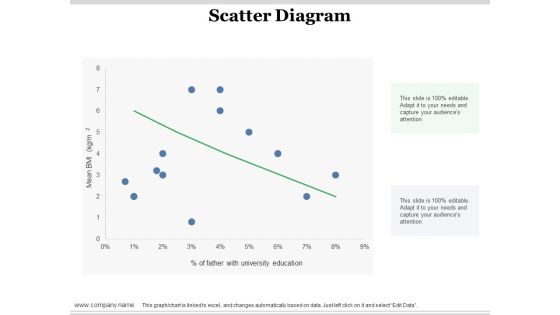
Scatter Diagram Ppt PowerPoint Presentation Infographic Template Design Ideas
This is a scatter diagram ppt powerpoint presentation infographic template design ideas. This is a one stage process. The stages in this process are scatter diagram, finance, in percentage, business, bar graph.
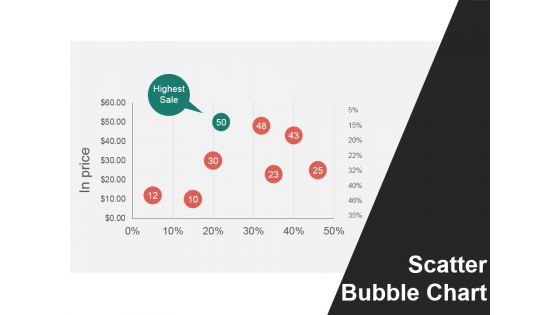
Scatter Bubble Chart Ppt PowerPoint Presentation Show Infographic Template
This is a scatter bubble chart ppt powerpoint presentation show infographic template. This is a six stage process. The stages in this process are in price, scatter bubble chart, highest sale.
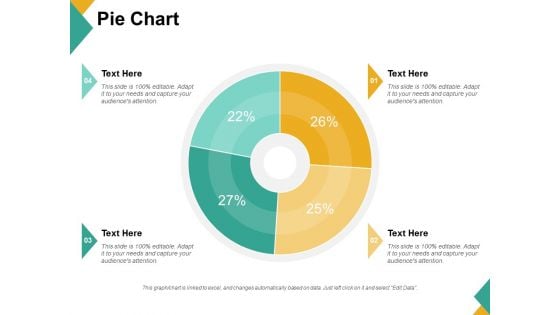
Pie Chart Ppt PowerPoint Presentation Infographic Template Graphics Example
This is a pie chart ppt powerpoint presentation infographic template graphics example. This is a four stage process. The stages in this process are pie chart, finance, marketing, strategy, business.
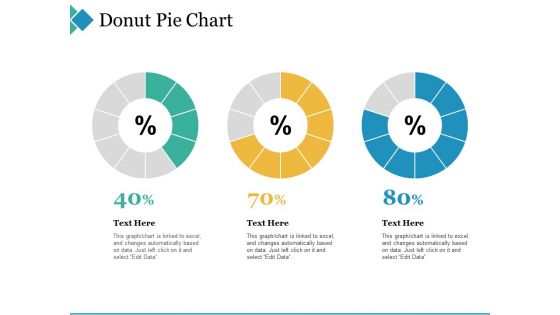
Donut Pie Chart Ppt PowerPoint Presentation Infographic Template Example 2015
This is a donut pie chart ppt powerpoint presentation infographic template example 2015. This is a three stage process. The stages in this process are donut pie chart, finance, marketing, strategy, business.
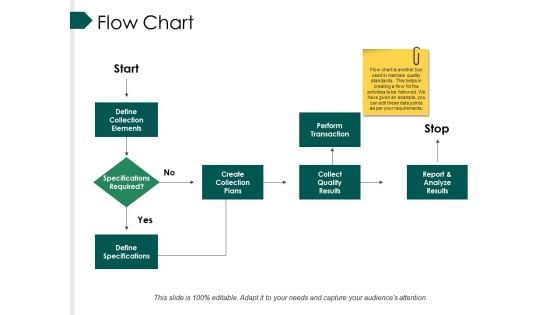
Flow Chart Ppt PowerPoint Presentation Infographic Template Mockup
This is a flow chart ppt powerpoint presentation infographic template mockup. This is a four stage process. The stages in this process are define collection elements, create collection plans, perform, transaction, collect quality results.
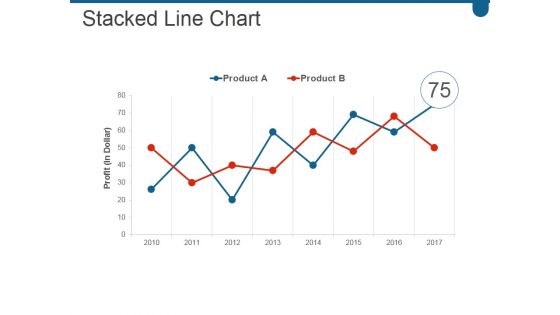
Stacked Line Chart Ppt PowerPoint Presentation Infographic Template Show
This is a stacked line chart ppt powerpoint presentation infographic template show. This is a two stage process. The stages in this process are business, marketing, growth, success, line.
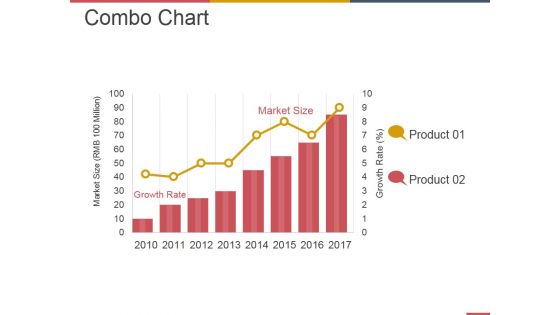
Combo Chart Ppt PowerPoint Presentation Infographic Template Deck
This is a combo chart ppt powerpoint presentation infographic template deck. This is a eight stage process. The stages in this process are business, strategy, marketing, analysis, growth strategy, market size.

Combo Chart Ppt PowerPoint Presentation Infographic Template Influencers
This is a combo chart ppt powerpoint presentation infographic template influencers. This is a three stage process. The stages in this process are market size rmb million, growth rate.
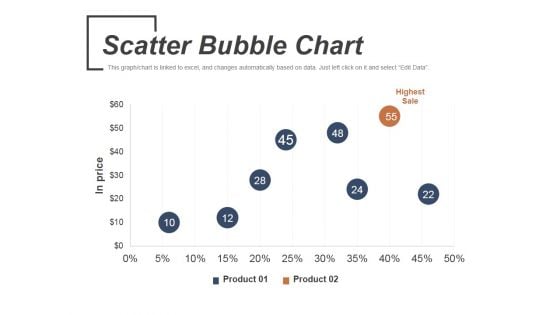
Scatter Bubble Chart Ppt PowerPoint Presentation Infographic Template Graphics
This is a scatter bubble chart ppt powerpoint presentation infographic template graphics. This is a two stage process. The stages in this process are highest sale, product, in price.
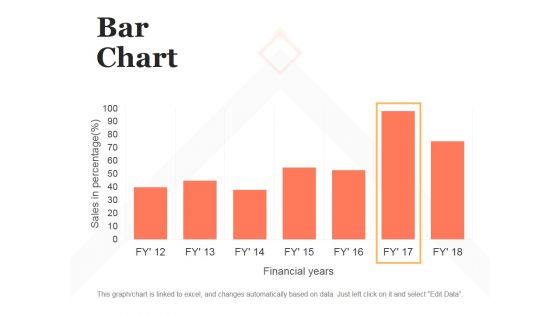
Bar Chart Ppt PowerPoint Presentation Infographic Template Brochure
This is a bar chart ppt powerpoint presentation infographic template brochure. This is a seven stage process. The stages in this process are bar graph, finance, marketing, strategy, analysis, business.
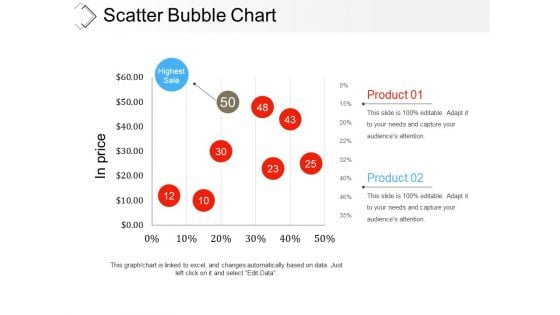
Scatter Bubble Chart Ppt PowerPoint Presentation Infographic Template Examples
This is a scatter bubble chart ppt powerpoint presentation infographic template examples. This is a two stage process. The stages in this process are highest sale, product, in price, finance, business.
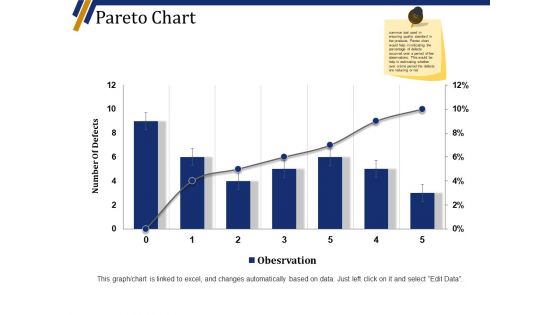
Pareto Chart Ppt PowerPoint Presentation File Infographic Template
This is a pareto chart ppt powerpoint presentation file infographic template. This is a six stage process. The stages in this process are number of defects, business, marketing, graph.
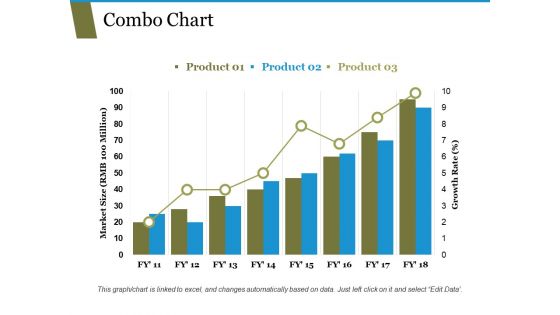
Combo Chart Ppt PowerPoint Presentation Ideas Infographic Template
This is a combo chart ppt powerpoint presentation ideas infographic template. This is a three stage process. The stages in this process are market size growth rate, graph, business, strategy.
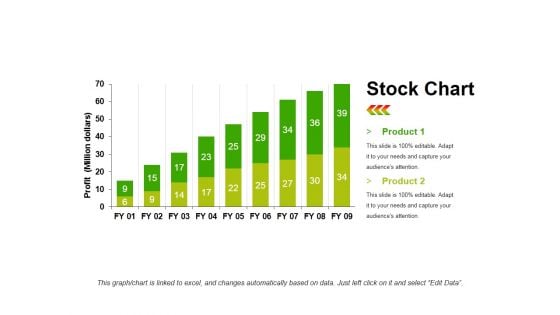
Stock Chart Template 1 Ppt PowerPoint Presentation Infographic Template Objects
This is a stock chart template 1 ppt powerpoint presentation infographic template objects. This is a two stage process. The stages in this process are product, profit, bar graph, growth, success.
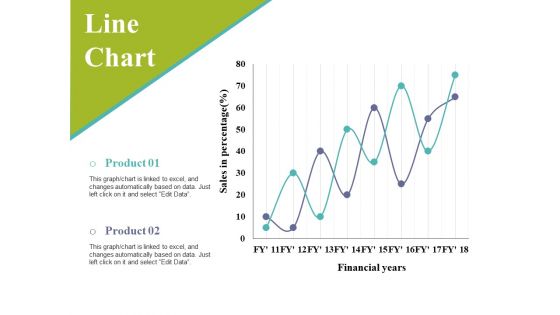
Line Chart Ppt PowerPoint Presentation Infographic Template Slides
This is a line chart ppt powerpoint presentation infographic template slides. This is a two stage process. The stages in this process are sales in percentage, financial years, business, marketing, graph.
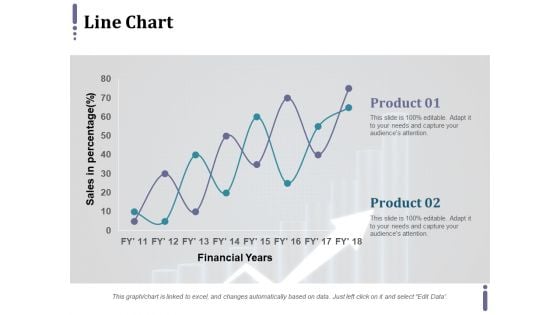
Line Chart Ppt PowerPoint Presentation Infographic Template Master Slide
This is a line chart ppt powerpoint presentation infographic template master slide. This is a two stage process. The stages in this process are product, financial years, sales in percentage.
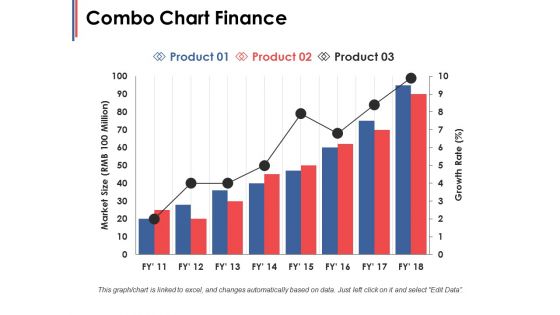
Combo Chart Finance Ppt PowerPoint Presentation Infographic Template Microsoft
This is a combo chart finance ppt powerpoint presentation infographic template microsoft. This is a three stage process. The stages in this process are finance, marketing, management, investment, analysis.
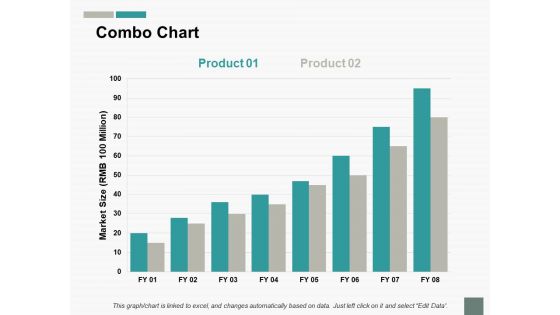
Combo Chart Finance Ppt PowerPoint Presentation Infographic Template Graphics
This is a combo chart finance ppt powerpoint presentation infographic template graphics. This is a two stage process. The stages in this process are growth, finance, marketing, management, investment.
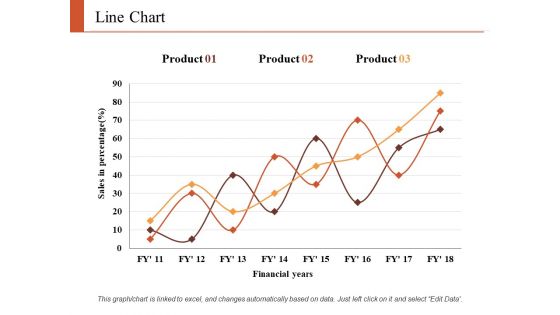
Line Chart Finance Ppt PowerPoint Presentation Infographic Template Graphics Tutorials
This is a line chart finance ppt powerpoint presentation infographic template graphics tutorials. This is a three stage process. The stages in this process are finance, marketing, analysis, business, investment.
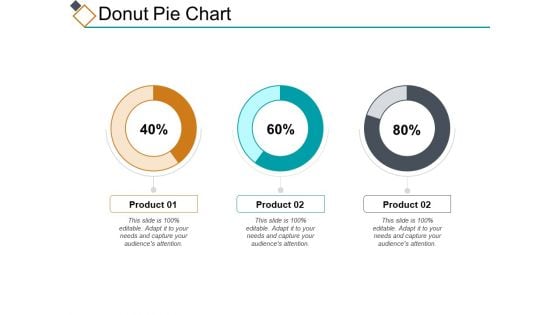
Donut Pie Chart Ppt PowerPoint Presentation Infographic Template Slides
This is a donut pie chart ppt powerpoint presentation infographic template slides. This is a three stage process. The stages in this process are percentage, product, business, management, marketing.
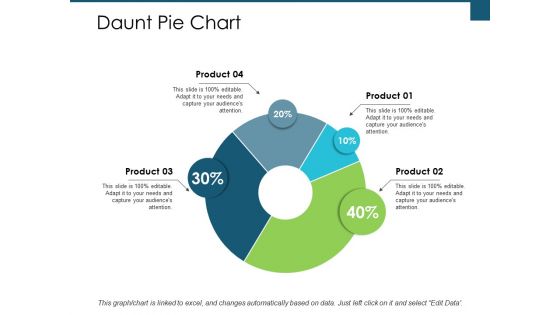
Daunt Pie Chart Investment Ppt PowerPoint Presentation Infographic Template Aids
This is a daunt pie chart investment ppt powerpoint presentation infographic template aids. This is a four stage process. The stages in this process are finance, analysis, business, investment, marketing.
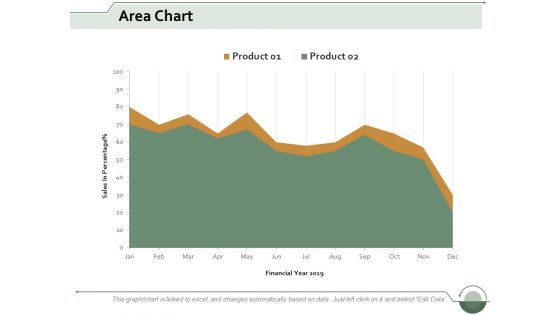
Area Chart Finance Ppt Powerpoint Presentation Infographic Template Clipart Images
This is a area chart finance ppt powerpoint presentation infographic template clipart images. This is a two stage process. The stages in this process are area bar, finance, marketing, management, analysis.
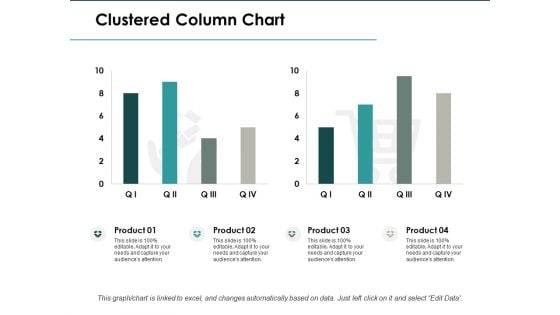
Clustered Column Chart Investment Ppt PowerPoint Presentation Infographic Template Clipart
This is a clustered column chart investment ppt powerpoint presentation infographic template clipart. This is a four stage process. The stages in this process are finance, analysis, business, investment, marketing.
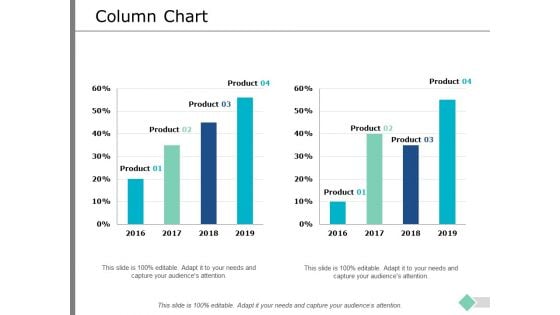
Column Chart Marketing Finance Ppt PowerPoint Presentation Infographic Template Rules
This is a column chart marketing finance ppt powerpoint presentation infographic template rules. This is a two stage process. The stages in this process are finance, analysis, business, investment, marketing.
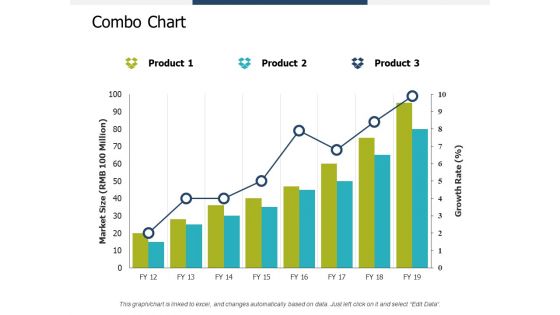
Combo Chart Investment Ppt PowerPoint Presentation Summary Infographic Template
This is a combo chart investment ppt powerpoint presentation summary infographic template. This is a three stage process. The stages in this process are finance, analysis, business, investment, marketing.
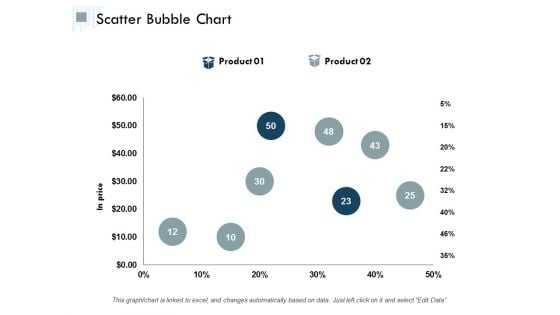
Scatter Bubble Chart Ppt PowerPoint Presentation Infographic Template Graphics Design
This is a scatter bubble chart ppt powerpoint presentation infographic template graphics design. This is a two stage process. The stages in this process are finance, analysis, business, investment, marketing.
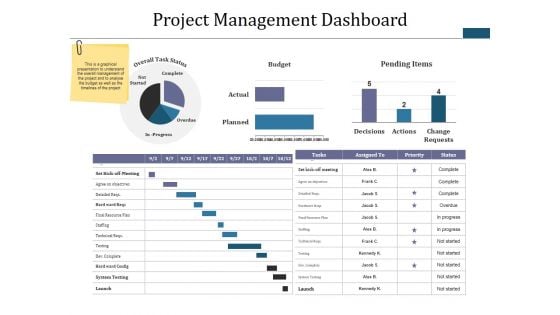
Project Management Dashboard Ppt PowerPoint Presentation Infographic Template Diagrams
This is a project management dashboard ppt powerpoint presentation infographic template diagrams. This is a three stage process. The stages in this process are budget, pending items, complete, overdue, not started.
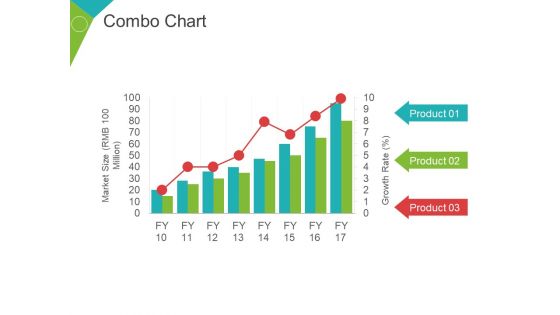
Combo Chart Ppt PowerPoint Presentation Infographic Template Graphic Images
This is a combo chart ppt powerpoint presentation infographic template graphic images. This is a three stage process. The stages in this process are market size, growth rate, percentage, business, marketing.
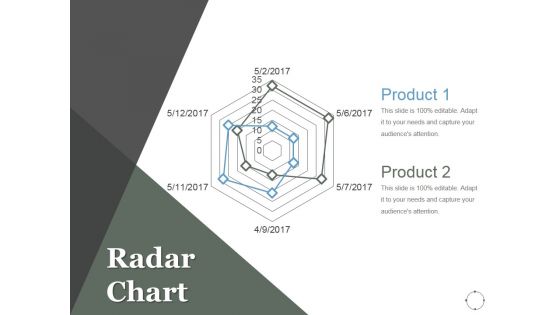
Radar Chart Ppt PowerPoint Presentation Layouts Infographic Template
This is a radar chart ppt powerpoint presentation layouts infographic template. This is a two stage process. The stages in this process are business, marketing, product, radar chart, strategy.
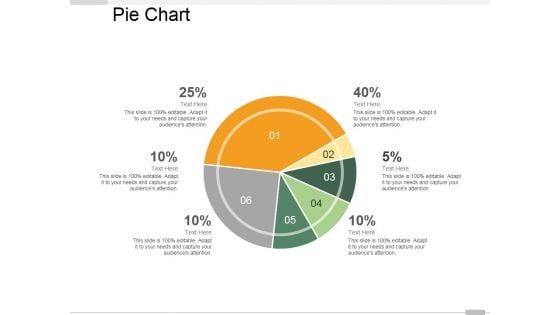
Pie Chart Ppt PowerPoint Presentation Infographic Template Master Slide
This is a pie chart ppt powerpoint presentation infographic template master slide. This is a six stage process. The stages in this process are pie chart, marketing, finance, analysis, business.

Pie Chart Ppt PowerPoint Presentation Infographic Template Example 2015
This is a pie chart ppt powerpoint presentation infographic template example 2015. This is a five stage process. The stages in this process are pie chart, finance, marketing, strategy, business.
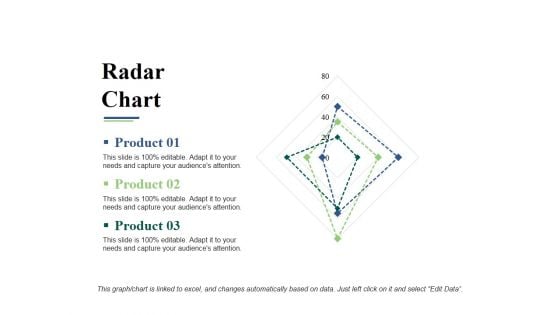
Radar Chart Ppt PowerPoint Presentation Infographic Template Microsoft
This is a radar chart ppt powerpoint presentation infographic template microsoft. This is a three stage process. The stages in this process are product, radar chart, shapes, business, marketing.
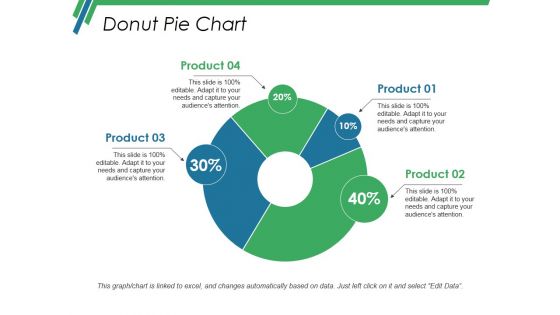
Donut Pie Chart Ppt PowerPoint Presentation Infographic Template Vector
This is a donut pie chart ppt powerpoint presentation infographic template vector. This is a four stage process. The stages in this process are donut pie chart, finance, analysis, business, strategy.
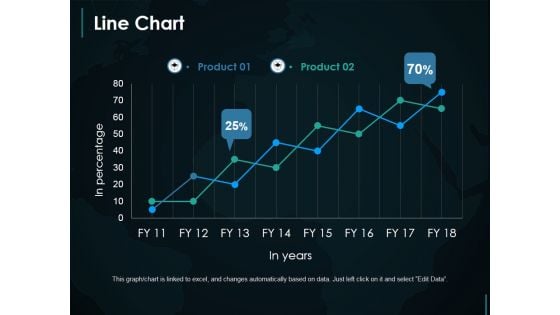
Line Chart Ppt PowerPoint Presentation Infographic Template Demonstration
This is a line chart ppt powerpoint presentation infographic template demonstration. This is a two stage process. The stages in this process are line chart, growth, finance, marketing, strategy.
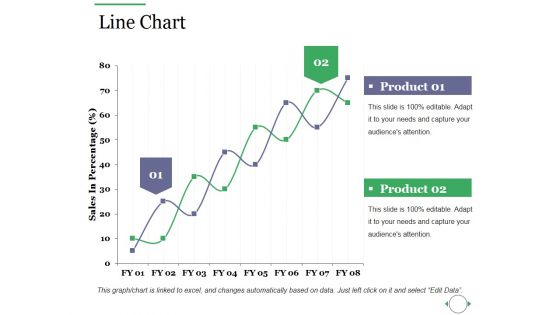
Line Chart Ppt PowerPoint Presentation Infographic Template Slideshow
This is a line chart ppt powerpoint presentation infographic template slideshow. This is a two stage process. The stages in this process are line chart, growth, strategy, business, marketing.

Pie Chart Ppt PowerPoint Presentation Infographic Template Summary
This is a pie chart ppt powerpoint presentation infographic template summary. This is a four stage process. The stages in this process are pie chart, marketing, strategy, analysis, business.

Radar Chart Ppt PowerPoint Presentation Inspiration Infographic Template
This is a radar chart ppt powerpoint presentation inspiration infographic template. This is a two stage process. The stages in this process are radar chart, product, business, finance, marketing.
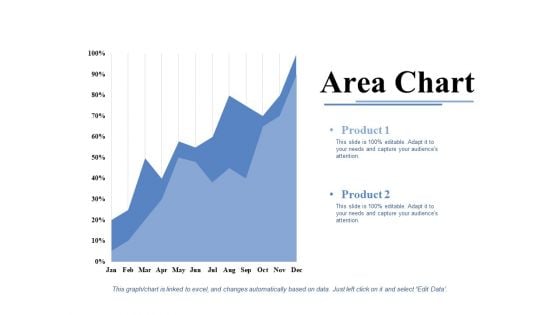
Area Chart Ppt PowerPoint Presentation Infographic Template Model
This is a area chart ppt powerpoint presentation infographic template model. This is a two stage process. The stages in this process are product, area chart, growth, percentage, success.
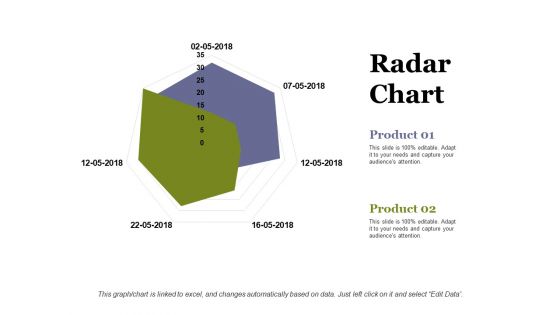
Radar Chart Ppt PowerPoint Presentation Infographic Template Information
This is a radar chart ppt powerpoint presentation infographic template information. This is a two stage process. The stages in this process are radar chart, product, business, marketing, shape.
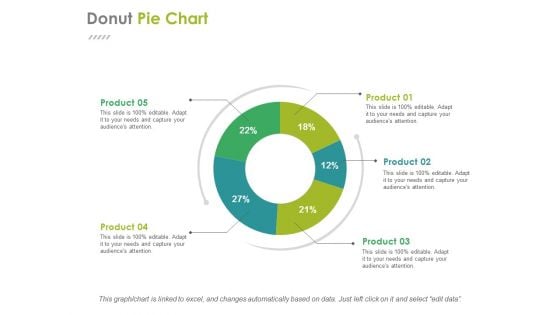
Donut Pie Chart Ppt PowerPoint Presentation File Infographic Template
This is a donut pie chart ppt powerpoint presentation file infographic template. This is a five stage process. The stages in this process are business, management, process, percentage, chart.
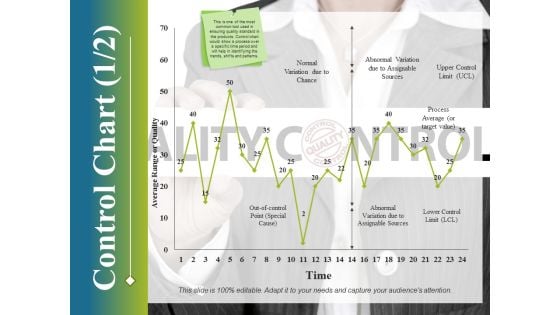
Control Chart Template 1 Ppt PowerPoint Presentation Infographic Template Deck
This is a control chart template 1 ppt powerpoint presentation infographic template deck. This is a one stage process. The stages in this process are control chart, growth, finance, marketing, strategy, business.

Radar Chart Ppt PowerPoint Presentation Professional Infographic Template
This is a radar chart ppt powerpoint presentation professional infographic template. This is a two stage process. The stages in this process are product, finance, shape, radar chart, business.
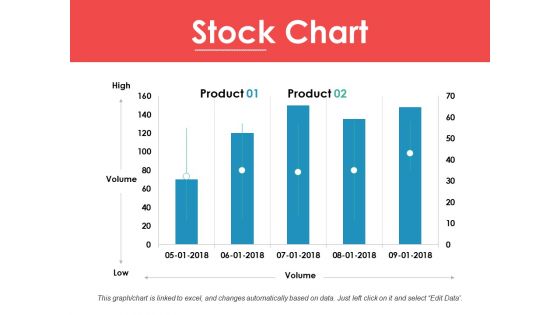
Stock Chart Ppt PowerPoint Presentation Ideas Infographic Template
This is a stock chart ppt powerpoint presentation ideas infographic template. This is a two stage process. The stages in this process are high, volume, low, product, stock chart.
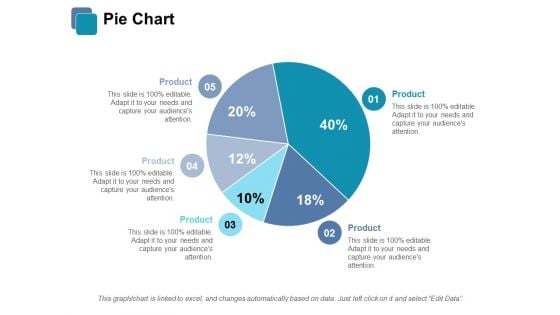
Pie Chart Ppt PowerPoint Presentation Infographic Template Vector
This is a pie chart ppt powerpoint presentation infographic template vector. This is a five stage process. The stages in this process are pie chart, finance, analysis, investment, business.
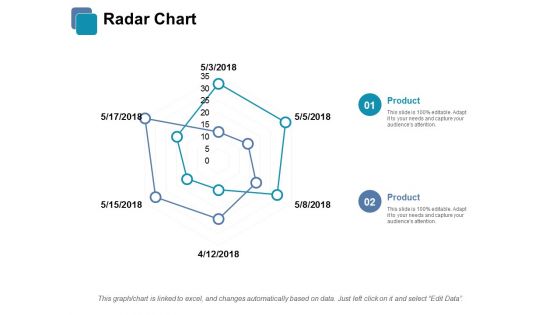
Radar Chart Ppt PowerPoint Presentation Infographic Template Visuals
This is a radar chart ppt powerpoint presentation infographic template visuals. This is a two stage process. The stages in this process are radar chart, finance, business, marketing, analysis.

Donut Chart Finance Ppt Powerpoint Presentation Infographic Template Slide Download
This is a donut chart finance ppt powerpoint presentation infographic template slide download. This is a three stage process. The stages in this process are donut chart, finance, marketing, management, analysis.
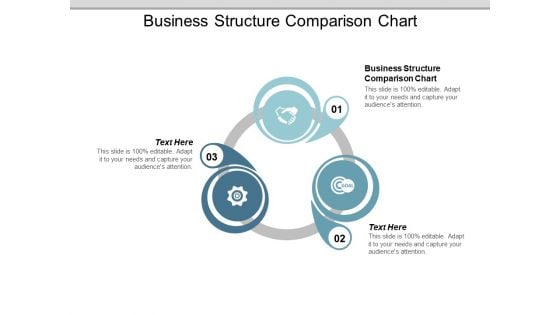
Business Structure Comparison Chart Ppt PowerPoint Presentation Infographic Template Vector
This is a business structure comparison chart ppt powerpoint presentation infographic template vector. This is a three stage process. The stages in this process are business structure comparison chart.
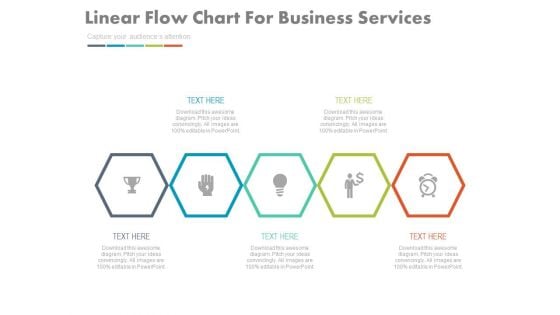
Linear Infographic Chart For Quick Business Plan Powerpoint Template
This PowerPoint template has been designed with linear infographic chart. Use this PPT slide to display quick business plan. Download this template to leave permanent impression on your audience.
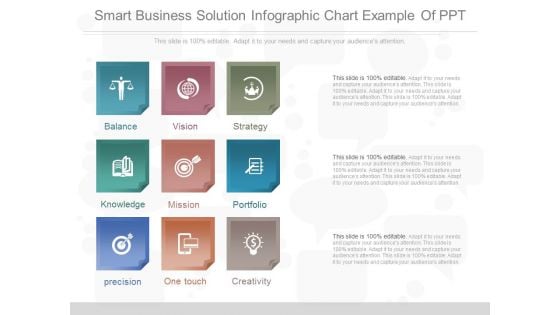
Smart Business Solution Infographic Chart Example Of Ppt
This is a smart business solution infographic chart example of ppt. This is a nine stage process. The stages in this process are balance, vision, strategy, knowledge, mission, portfolio, precision, one touch, creativity.
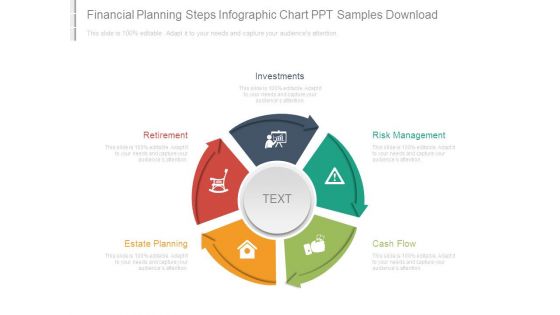
Financial Planning Steps Infographic Chart Ppt Samples Download
This is a financial planning steps infographic chart ppt samples download. This is a five stage process. The stages in this process are investments, retirement, estate planning, risk management, cash flow.
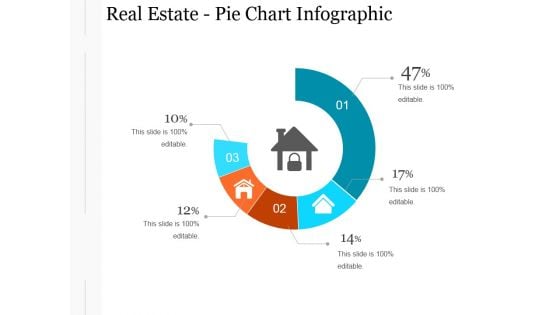
Real Estate Pie Chart Infographic Ppt PowerPoint Presentation Designs Download
This is a real estate pie chart infographic ppt powerpoint presentation designs download. This is a four stage process. The stages in this process are business, planning, management, marketing, strategy.
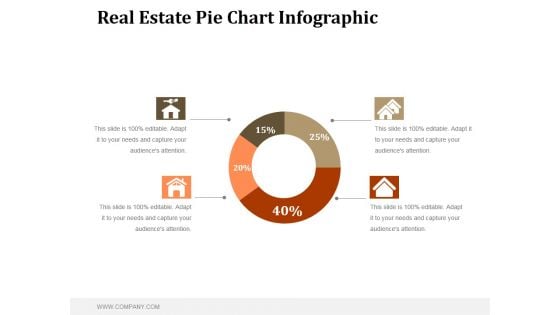
Real Estate Pie Chart Infographic Ppt PowerPoint Presentation Shapes
This is a real estate pie chart infographic ppt powerpoint presentation shapes. This is a four stage process. The stages in this process are business, marketing, management, finance, planning.
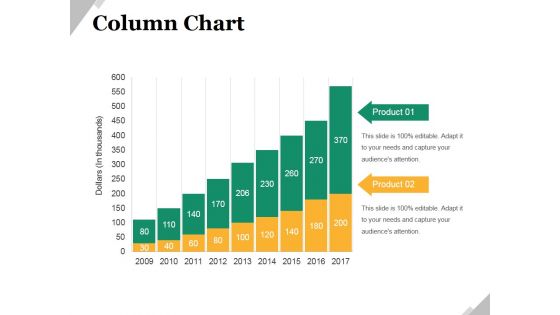
Column Chart Ppt PowerPoint Presentation Infographic Template Graphic Images
This is a column chart ppt powerpoint presentation infographic template graphic images. This is a nine stage process. The stages in this process are business, marketing, growth, product, management.
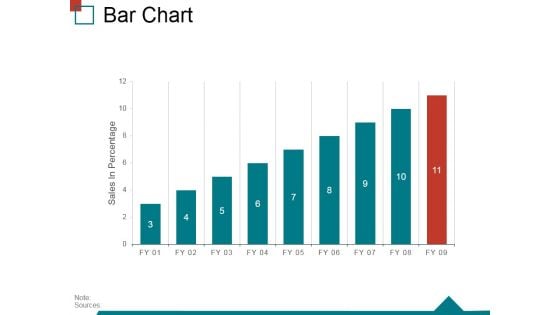
Bar Chart Ppt PowerPoint Presentation Infographic Template Skills
This is a bar chart ppt powerpoint presentation infographic template skills. This is a nine stage process. The stages in this process are sales in percentage, finance, business, marketing, strategy, success.
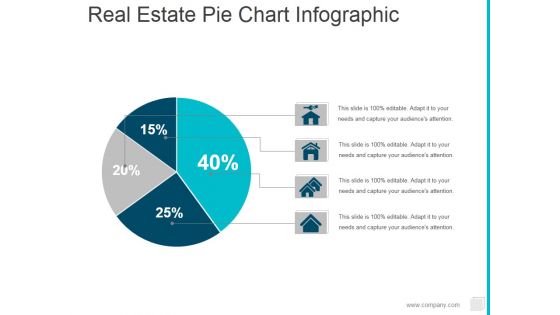
Real Estate Pie Chart Infographic Ppt PowerPoint Presentation Ideas Shapes
This is a real estate pie chart infographic ppt powerpoint presentation ideas shapes. This is a four stage process. The stages in this process are pie, finance, marketing, percentage.

Organization Chart Template Ppt PowerPoint Presentation Infographic Template Styles
This is a organization chart template ppt powerpoint presentation infographic template styles. This is a four stage process. The stages in this process are john smith, anita carol, merry doe, jess parker.
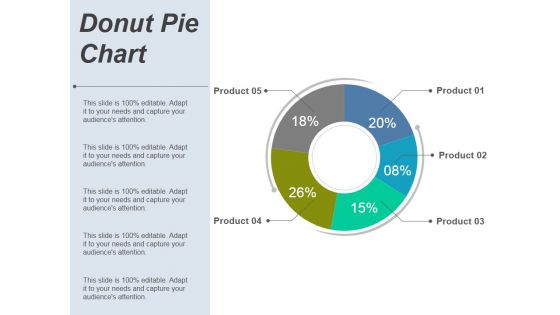
Donut Pie Chart Ppt PowerPoint Presentation Infographic Template Layout Ideas
This is a donut pie chart ppt powerpoint presentation infographic template layout ideas. This is a five stage process. The stages in this process are product, business, finance, marketing.
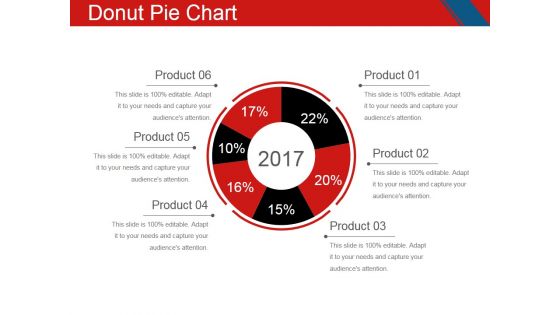
Donut Pie Chart Ppt PowerPoint Presentation Infographic Template Sample
This is a donut pie chart ppt powerpoint presentation infographic template sample. This is a six stage process. The stages in this process are business, pie, process, planning, strategy.
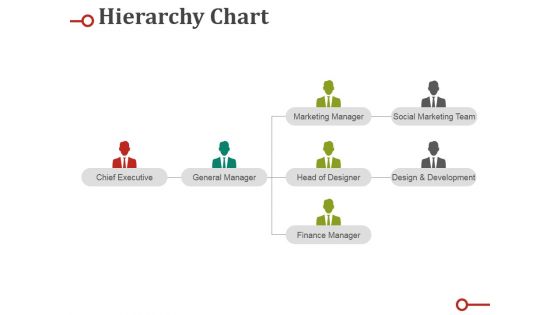
Hierarchy Chart Ppt PowerPoint Presentation Infographic Template Designs Download
This is a hierarchy chart ppt powerpoint presentation infographic template designs download. This is a four stage process. The stages in this process are chief executive, general manager, marketing manager, head of designer, finance manager.
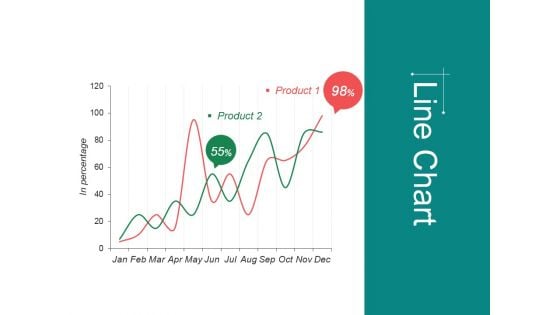
Line Chart Ppt Powerpoint Presentation Infographic Template Format
This is a line chart ppt powerpoint presentation infographic template format. This is a two stage process. The stages in this process are jan, feb, mar, apr, may, financial.
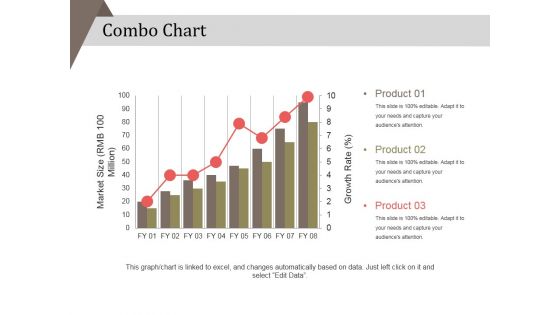
Combo Chart Ppt PowerPoint Presentation Infographic Template Brochure
This is a combo chart ppt powerpoint presentation infographic template brochure. This is a eight stage process. The stages in this process are product, market size, strategy, business, marketing.
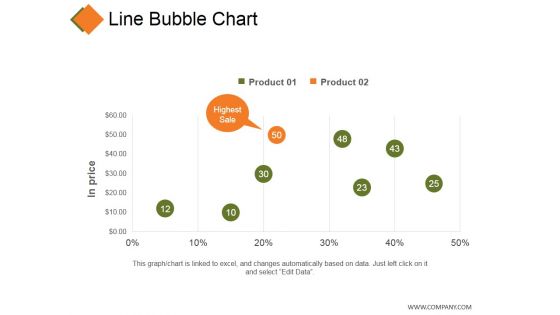
Line Bubble Chart Ppt PowerPoint Presentation Professional Infographic Template
This is a line bubble chart ppt powerpoint presentation professional infographic template. This is a five stage process. The stages in this process are product, in price, highest sale, business, finance.
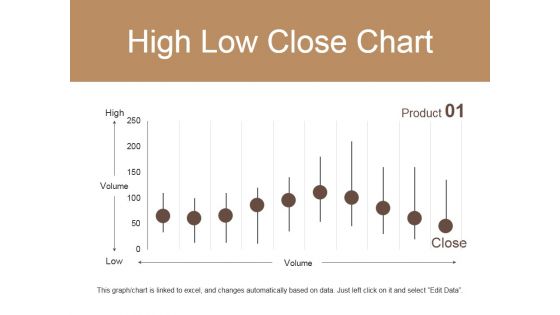
High Low Close Chart Ppt PowerPoint Presentation Infographic Template Vector
This is a high low close chart ppt powerpoint presentation infographic template vector. This is a ten stage process. The stages in this process are high, volume, low, product, close.
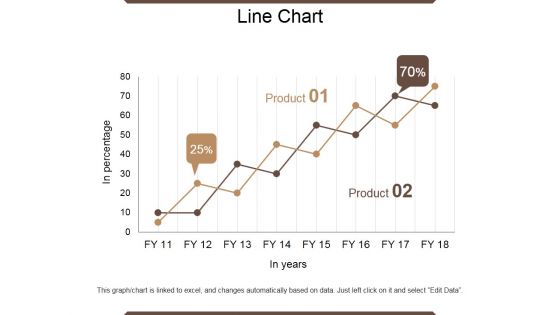
Line Chart Ppt PowerPoint Presentation Outline Infographic Template
This is a line chart ppt powerpoint presentation outline infographic template. This is a two stage process. The stages in this process are in percentage, product, in year, growth, success.
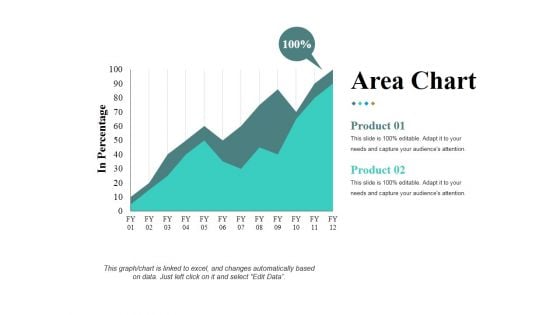
Area Chart Ppt PowerPoint Presentation Infographic Template Samples
This is a area chart ppt powerpoint presentation infographic template samples. This is a two stage process. The stages in this process are in percentage product, business, marketing, growth.
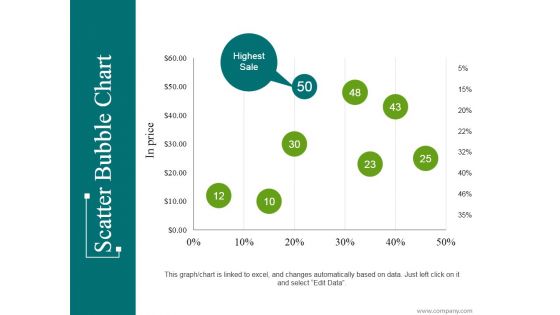
Scatter Bubble Chart Ppt PowerPoint Presentation Infographic Template Introduction
This is a scatter bubble chart ppt powerpoint presentation infographic template introduction. This is a eight stage process. The stages in this process are highest sale, business, marketing, percentage, finance.
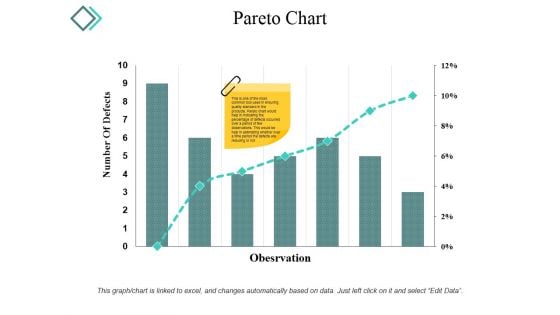
Pareto Chart Ppt PowerPoint Presentation Infographic Template Microsoft
This is a pareto chart ppt powerpoint presentation infographic template microsoft. This is a seven stage process. The stages in this process are number of defects, observation, graph, percentage, business.
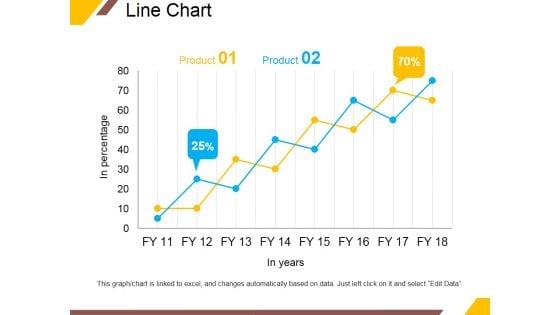
Line Chart Ppt PowerPoint Presentation Portfolio Infographic Template
This is a line chart ppt powerpoint presentation portfolio infographic template. This is a two stage process. The stages in this process are product, in years, business, percentage, growth.
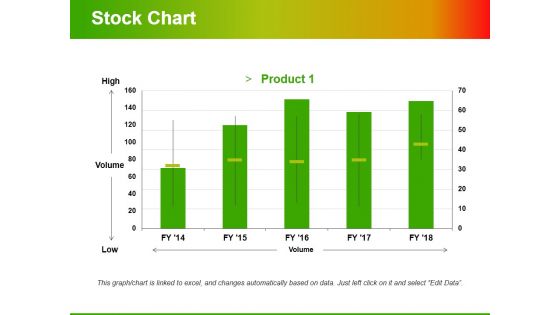
Stock Chart Template 2 Ppt PowerPoint Presentation Infographic Template Styles
This is a stock chart template 2 ppt powerpoint presentation infographic template styles. This is a one stage process. The stages in this process are high, volume, low, product, volume.
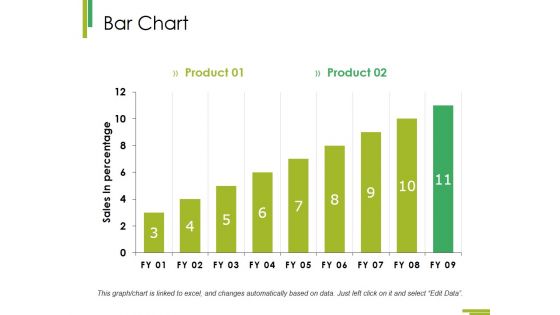
Bar Chart Ppt PowerPoint Presentation Infographic Template Master Slide
This is a bar chart ppt powerpoint presentation infographic template master slide. This is a two stage process. The stages in this process are growth, finance, business, analysis, marketing.
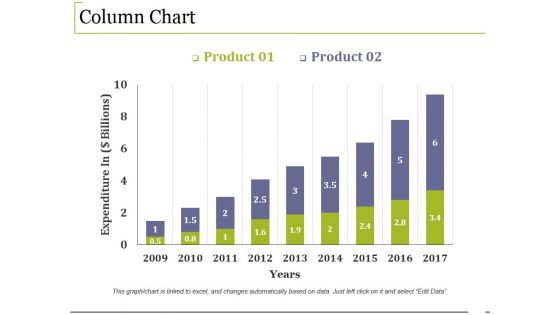
Column Chart Ppt PowerPoint Presentation Infographic Template Example File
This is a column chart ppt powerpoint presentation infographic template example file. This is a two stage process. The stages in this process are growth, finance, business, marketing, analysis.
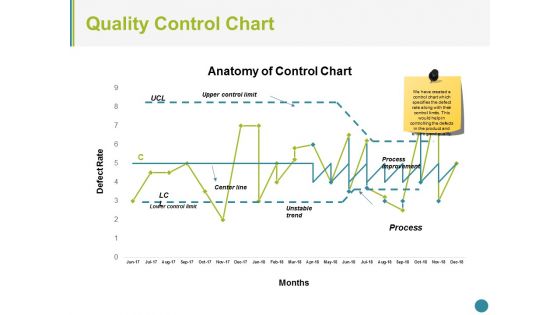
Quality Control Chart Ppt PowerPoint Presentation Infographic Template Slide Portrait
This is a quality control chart ppt powerpoint presentation infographic template slide portrait. This is a three stage process. The stages in this process are upper control limit, center line, unstable trend, process change, process improvement, lower control limit.
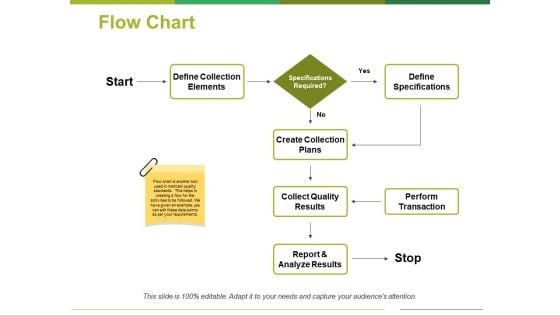
Flow Chart Ppt PowerPoint Presentation File Infographic Template
This is a flow chart ppt powerpoint presentation file infographic template. This is a seven stage process. The stages in this process are start, define specifications, perform transaction, create collection plans, report and analyze results.
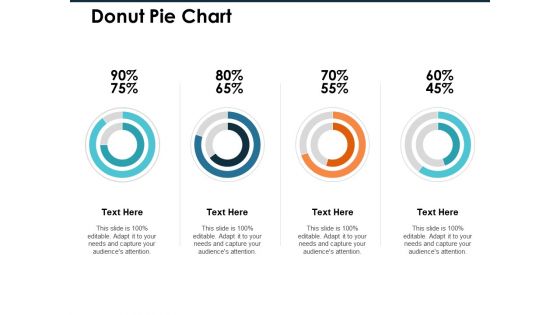
Donut Pie Chart Ppt PowerPoint Presentation Infographic Template Professional
This is a donut pie chart ppt powerpoint presentation infographic template professional. This is a four stage process. The stages in this process are finance, marketing, management, investment, analysis.
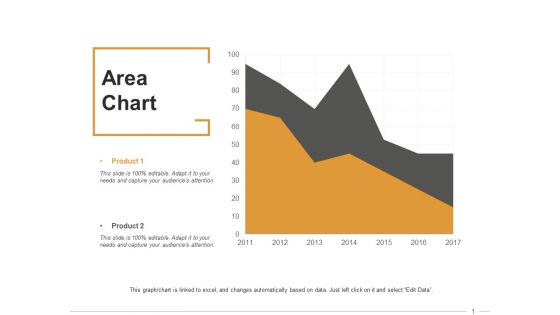
Area Chart Ppt PowerPoint Presentation Infographic Template Clipart Images
This is a area chart ppt powerpoint presentation infographic template clipart images. This is a two stage process. The stages in this process are finance, marketing, management, investment, analysis.
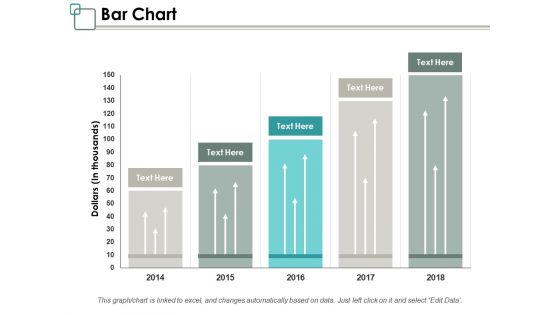
Bar Chart Ppt PowerPoint Presentation Infographic Template Graphics Design
This is a bar chart ppt powerpoint presentation infographic template graphics design. This is a five stage process. The stages in this process are management, marketing, business, percentage, product.
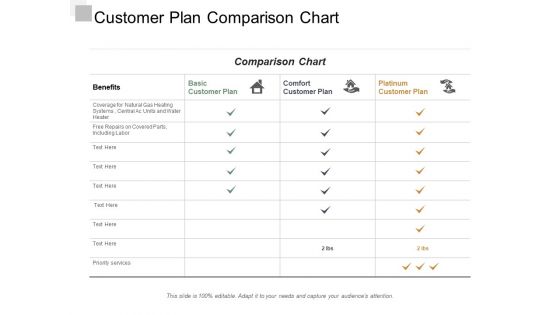
Customer Plan Comparison Chart Ppt Powerpoint Presentation Infographic Template Portrait
This is a customer plan comparison chart ppt powerpoint presentation infographic template portrait. This is a four stage process. The stages in this process are customer service strategy, customer service plan, customer service approach.
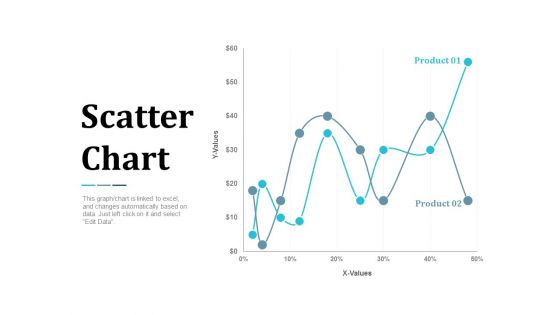
Scatter Chart Analysis Marketing Ppt Powerpoint Presentation Summary Infographic Template
This is a scatter chart analysis marketing ppt powerpoint presentation summary infographic template. This is a two stage process. The stages in this process are finance, marketing, management, investment, analysis.
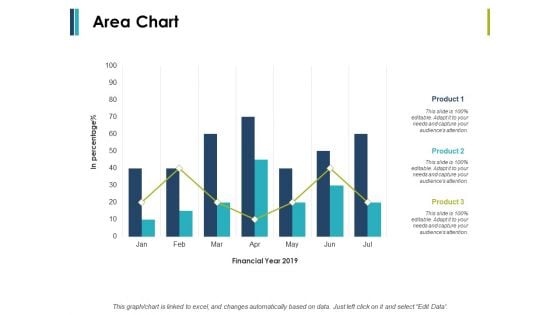
Area Chart Finance Ppt PowerPoint Presentation Infographic Template Model
This is a area chart finance ppt powerpoint presentation infographic template model. This is a two stage process. The stages in this process are finance, marketing, management, investment, analysis.
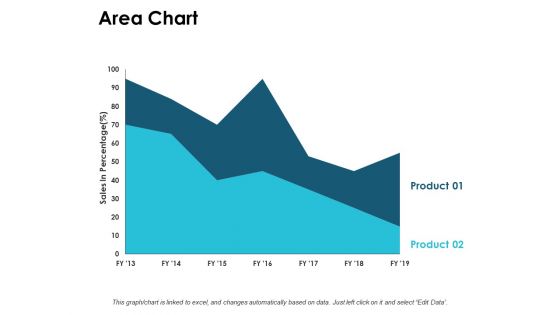
Area Chart Finance Ppt PowerPoint Presentation Infographic Template Graphics Template
This is a area chart finance ppt powerpoint presentation infographic template graphics template. This is a two stage process. The stages in this process are finance, marketing, management, investment, analysis.
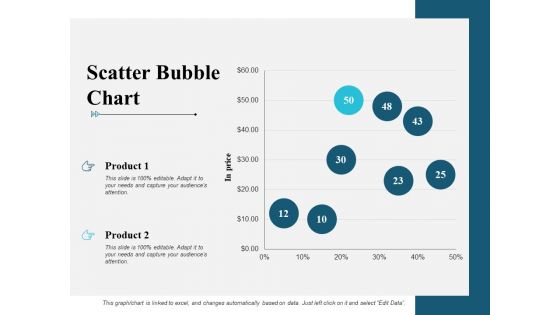
Scatter Bubble Chart Graph Ppt PowerPoint Presentation Infographic Template Maker
This is a scatter bubble chart graph ppt powerpoint presentation infographic template maker. This is a two stage process. The stages in this process are finance, marketing, management, investment, analysis.
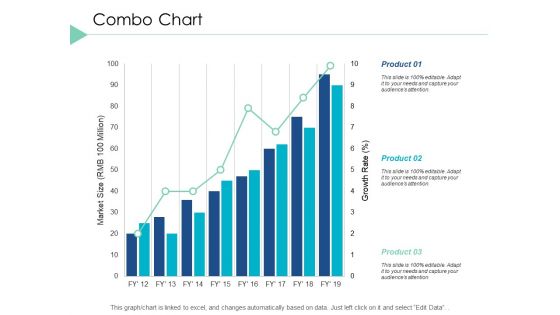
Combo Chart Graph Ppt PowerPoint Presentation Infographic Template Layout Ideas
This is a combo chart graph ppt powerpoint presentation infographic template layout ideas. This is a three stage process. The stages in this process are finance, marketing, analysis, investment, million.
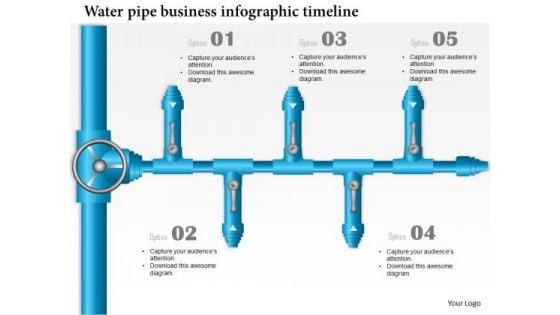
Business Framework Water Pipe Business Infographic Timeline PowerPoint Presentation
This slide contains a pipeline shape diagram with five stages. This water pipe business infographic may be used for business and sales related presentations. This interesting pipeline diagram may also be used to display five stages of a sales process.
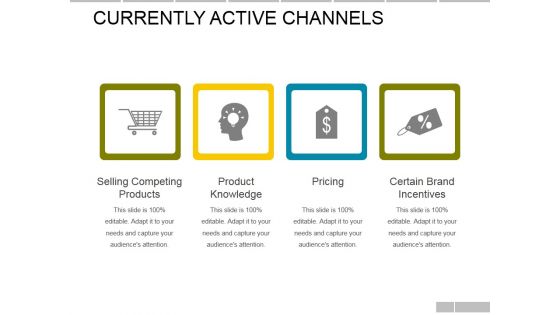
Currently Active Channels Template Ppt PowerPoint Presentation Infographic Template Themes
This is a currently active channels template ppt powerpoint presentation infographic template themes. This is a four stage process. The stages in this process are product knowledge, selling competing products, certain brand incentives, pricing.
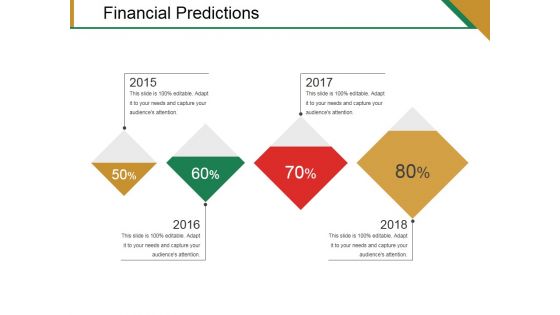
Financial Predictions Template 1 Ppt PowerPoint Presentation Infographic Template Themes
This is a financial predictions template 1 ppt powerpoint presentation infographic template themes. This is a four stage process. The stages in this process are business, finance, marketing, strategy, analysis, success.

Financial Projections Balance Sheet Ppt PowerPoint Presentation Infographic Template Themes
This is a financial projections balance sheet ppt powerpoint presentation infographic template themes. This is a two stage process. The stages in this process are balance sheet, trade payable, total fixed assets, current assets.

Sponsorship Opportunities Template 5 Ppt PowerPoint Presentation Infographic Template Themes
This is a sponsorship opportunities template 5 ppt powerpoint presentation infographic template themes. This is a three stage process. The stages in this process are presenting sponsor, supporting sponsor, gourmet sponsor.
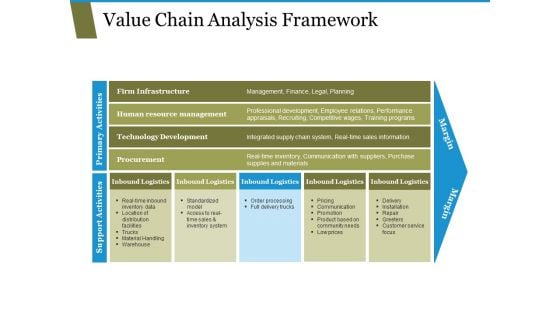
Value Chain Analysis Framework Ppt PowerPoint Presentation Infographic Template Themes
This is a value chain analysis framework ppt powerpoint presentation infographic template themes. This is a one stage process. The stages in this process are procurement, technology development, human resource management, infrastructure, inbound logistics.
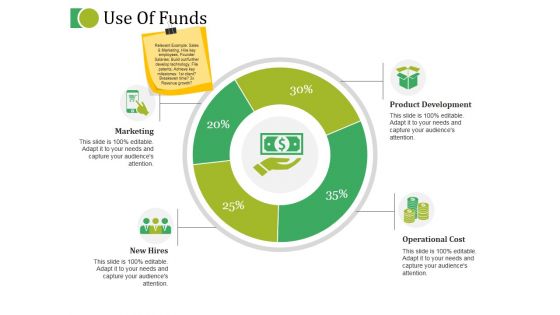
Use Of Funds Ppt PowerPoint Presentation Infographic Template Themes
This is a use of funds ppt powerpoint presentation infographic template themes. This is a four stage process. The stages in this process are marketing, product development, new hires, operational cost.
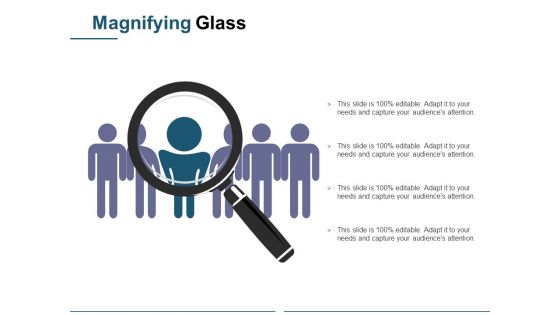
Magnifying Glass Ppt PowerPoint Presentation Infographic Template Themes
This is a magnifying glass ppt powerpoint presentation infographic template themes. This is a one stage process. The stages in this process are business, marketing, magnifying glass, management, technology.
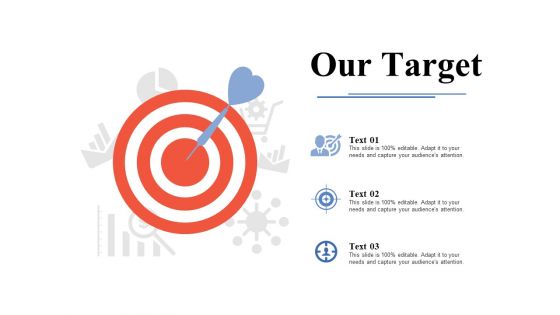
Our Target Ppt PowerPoint Presentation Infographic Template Themes
This is a our target ppt powerpoint presentation infographic template themes. This is a three stage process. The stages in this process are our goals, target, success, business, achievement.

Have Themed Office Days Ppt PowerPoint Presentation Show Infographic Template
This is a have themed office days ppt powerpoint presentation show infographic template. This is a four stage process. The stages in this process are finance, marketing, management, investment, analysis.
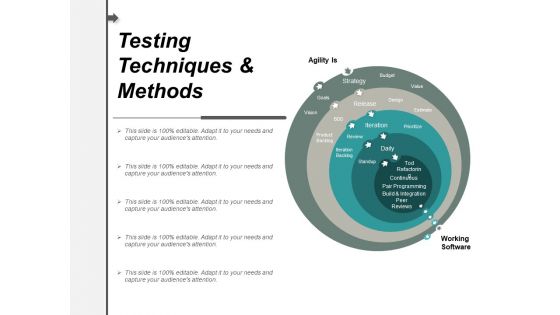
Testing Techniques And Methods Ppt PowerPoint Presentation Infographic Template Themes
This is a testing techniques and methods ppt powerpoint presentation infographic template themes. This is a five stage process. The stages in this process are quality assurance, quality analysis, qa, testing process, bugs analysis.
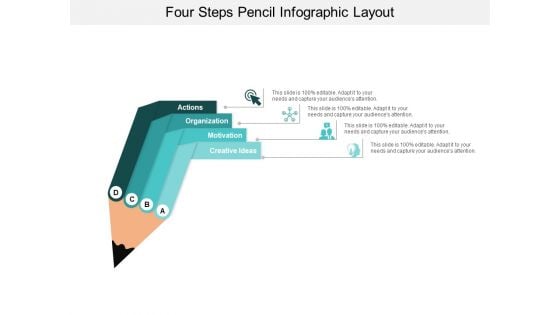
Four Steps Pencil Infographic Layout Ppt PowerPoint Presentation Show Themes
This is a four steps pencil infographic layout ppt powerpoint presentation show themes. This is a four stage process. The stages in this process are step up process, step up cycle, step up procedure.
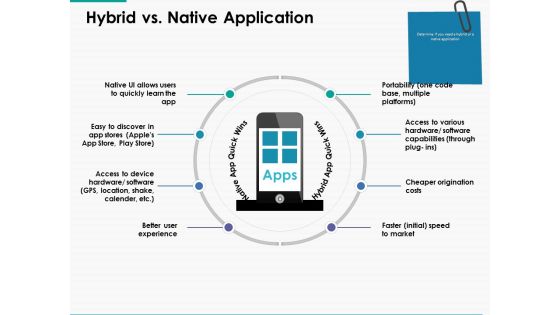
Hybrid Vs Native Application Ppt Powerpoint Presentation Infographic Template Themes
This is a hybrid vs native application ppt powerpoint presentation infographic template themes. This is a six stage process. The stages in this process are business, management, planning, strategy, marketing.
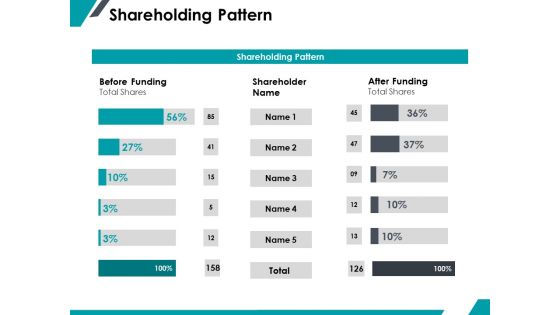
Shareholding Pattern Ppt PowerPoint Presentation Infographic Template Professional
This is a shareholding pattern ppt powerpoint presentation infographic template professional. The topics discussed in this diagram are finance, marketing, management, investment, analysis. This is a completely editable PowerPoint presentation, and is available for immediate download.
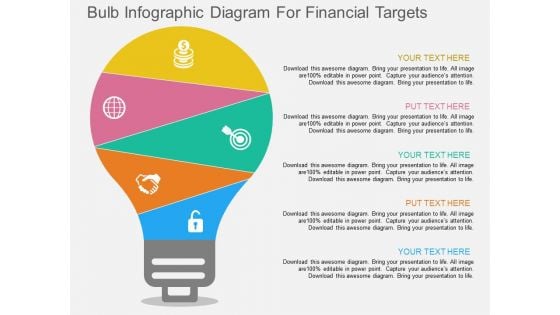
Bulb Infographic Diagram For Financial Targets Powerpoint Template
This PowerPoint template has been designed with bulb infographic diagram. Download this diagram slide to display financial targets. You can edit text, color, shade and style of this diagram as per you need.
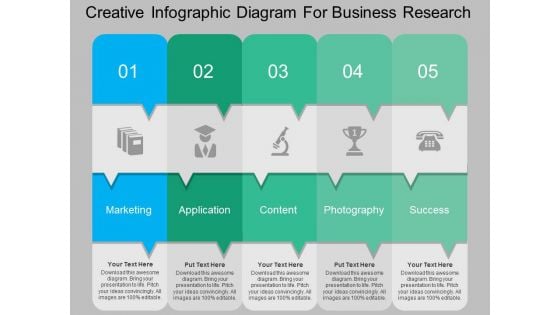
Creative Infographic Diagram For Business Research Powerpoint Template
The above PowerPoint template displays creative infographic diagram. Download this business diagram slide for business research. Refine your thoughts with this slide. Narrow them down to the very best.
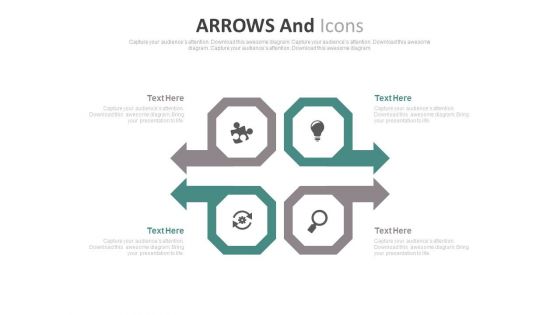
Infographic Diagram For Business Idea Generation Powerpoint Slides
Emphatically define your message with our above template which contains infographic diagram. Download this diagram slide to display business planning and idea generation. Grab the attention of your listeners with this slide.

Infographic Diagram For Global Business Process Powerpoint Template
Our above PowerPoint template has been designed with infographic diagram. This PPT slide is suitable to present global business process. Use this business diagram to present your work in a more smart and precise manner.
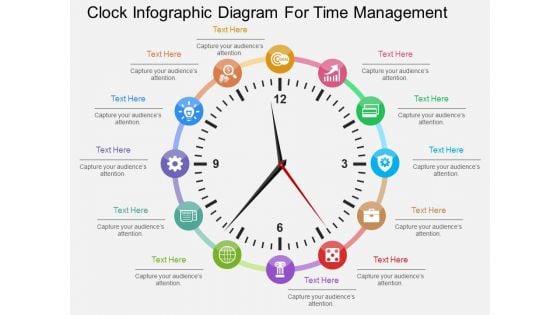
Clock Infographic Diagram For Time Management Powerpoint Template
Clock infographic diagram has been displayed in this PowerPoint template. This PowerPoint template helps to exhibit strategic thinking and time management. Use this diagram to build an exclusive presentation.
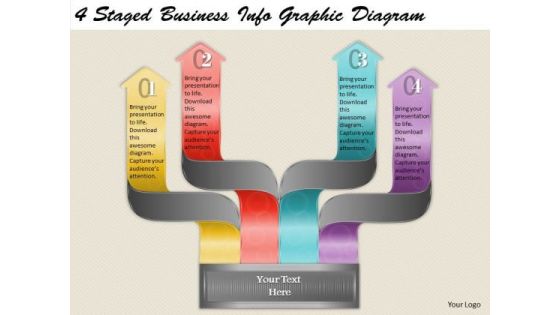
Timeline Ppt Template 4 Staged Business Infographic Diagram
Be A Donor Of Great Ideas. Display Your Charity On Our Timeline Ppt Template 4 Staged Business Infographic Diagram Powerpoint Templates. Make A Donation Of Your Ideas. Our Arrows Powerpoint Templates Will Convey Your Charitable Attitude.
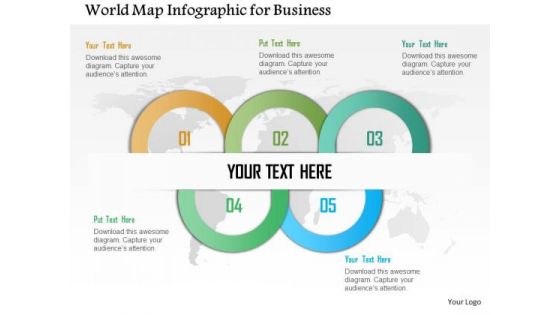
Business Diagram World Map Infographic For Business Presentation Template
World map infographic has been used to design this power point template. This diagram contains the concept of global marketing strategy. Amplify your thoughts via this appropriate business template.
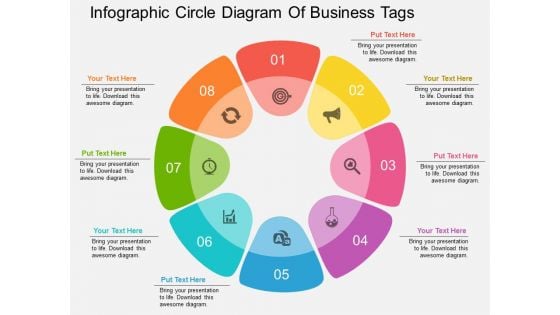
Infographic Circle Diagram Of Business Tags Powerpoint Template
Create dynamic presentations with our professional template containing circular infographic layout. This diagram is useful to display eight steps of any process. Download this template to leave permanent impression on your audience.
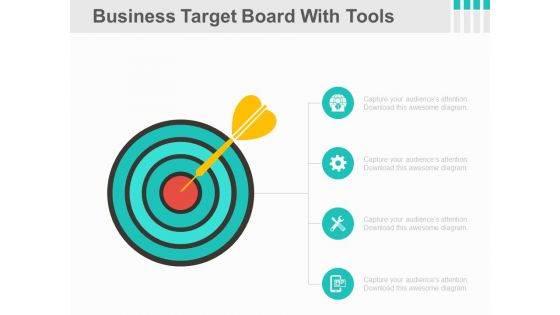
Infographic Diagram To Focus On Goals Powerpoint Slides
This PPT slide contains infographic target diagram. You may download this PPT slide to keep focus your team towards business goals. Impress your audiences by using this PPT slide.

Business Infographic Diagram With Quote Layout Powerpoint Slides
This PowerPoint template has been designed with business infographic diagram and quote layout. You may use this layout to display quotes for business success. Download this slide to prepare for change ahead to enhance the future.
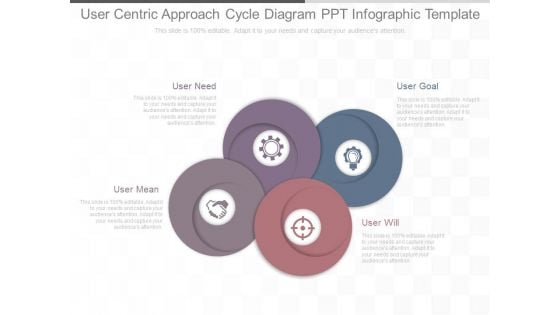
User Centric Approach Cycle Diagram Ppt Infographic Template
This is a user centric approach cycle diagram ppt infographic template. This is a four stage process. The stages in this process are user goal, user will, user mean, user need.
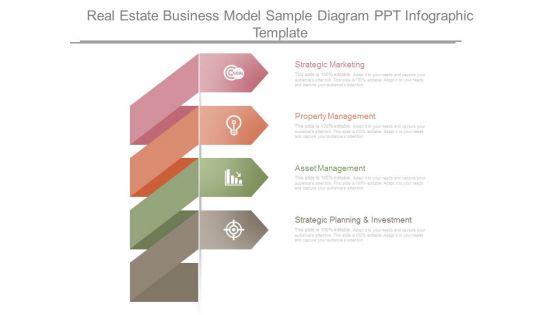
Real Estate Business Model Sample Diagram Ppt Infographic Template
This is a real estate business model sample diagram ppt infographic template. This is a four stage process. The stages in this process are strategic marketing, property management, asset management, strategic planning and investment.
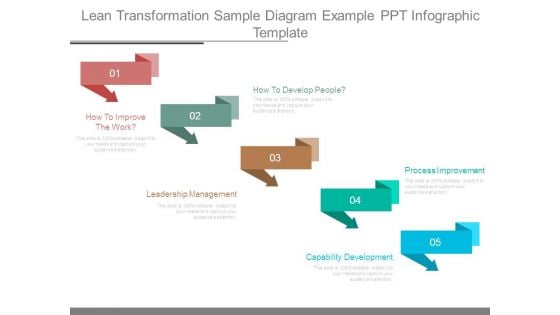
Lean Transformation Sample Diagram Example Ppt Infographic Template
This is a lean transformation sample diagram example ppt infographic template. This is a five stage process. The stages in this process are how to improve the work, how to develop people, leadership management, capability development, process improvement.
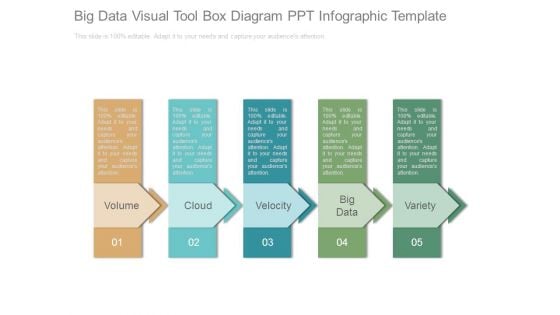
Big Data Visual Tool Box Diagram Ppt Infographic Template
This is a big data visual tool box diagram ppt infographic template. This is a five stage process. The stages in this process are volume, cloud, velocity, big data, variety.
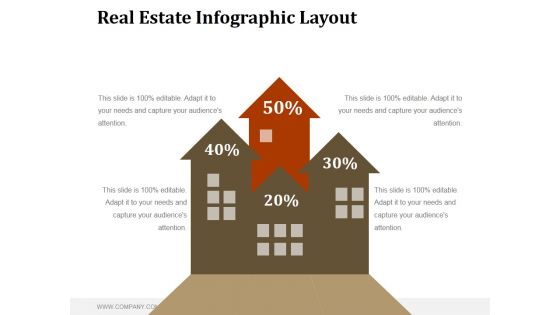
Real Estate Infographic Layout Ppt PowerPoint Presentation Diagrams
This is a real estate infographic layout ppt powerpoint presentation diagrams. This is a four stage process. The stages in this process are business, marketing, finance, sales plan, management.

Business Model Template 2 Ppt PowerPoint Presentation Infographic Template Diagrams
This is a business model template 2 ppt powerpoint presentation infographic template diagrams. This is a four stage process. The stages in this process are research and plan, price compare, book, on the trip.
Mind Map Ppt PowerPoint Presentation Infographic Template Diagrams
This is a mind map ppt powerpoint presentation infographic template diagrams. This is a five stage process. The stages in this process are mind map, brainstorming, innovation, business, knowledge.
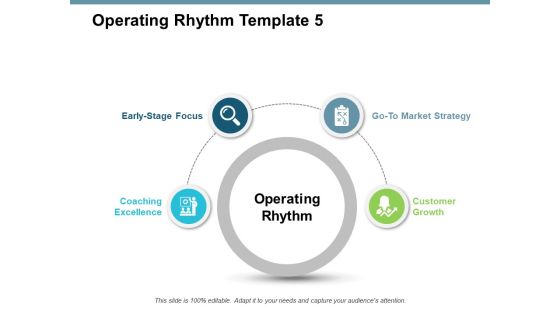
Operating Rhythm Template Business Ppt PowerPoint Presentation Infographic Template Diagrams
This is a operating rhythm template business ppt powerpoint presentation infographic template diagrams. This is a four stage process. The stages in this process are marketing, business, management, planning, strategy.
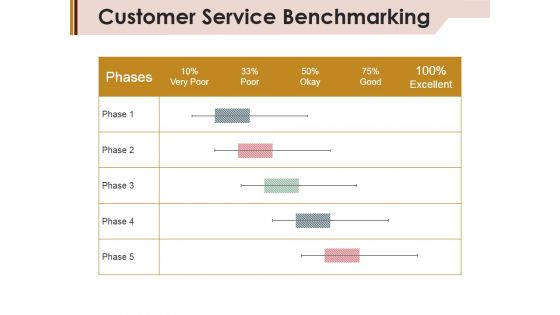
Customer Service Benchmarking Ppt Powerpoint Presentation Infographic Template Gallery
This is a customer service benchmarking ppt powerpoint presentation infographic template gallery. This is a five stage process. The stages in this process are phases, poor, very poor, okay.
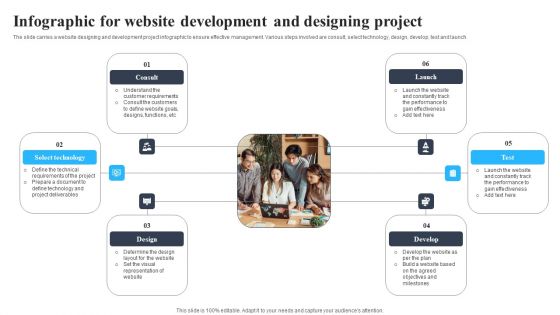
Infographic For Website Development And Designing Project Diagrams PDF
The slide carries a website designing and development project infographic to ensure effective management. Various steps involved are consult, select technology, design, develop, test and launch Presenting Infographic For Website Development And Designing Project Diagrams PDF to dispense important information. This template comprises eight stages. It also presents valuable insights into the topics including Consult, Select Technology, Design . This is a completely customizable PowerPoint theme that can be put to use immediately. So, download it and address the topic impactfully.
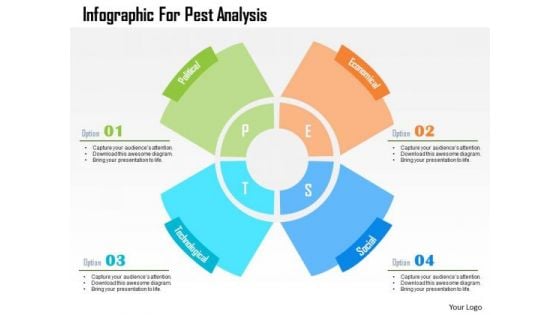
Business Diagram Infographic For Pest Analysis Presentation Template
Our above slide contains infographic for pest analysis. PEST Analysis is a simple and widely used tool that helps you analyze the Political, Economic, Socio-Cultural, and Technological changes in your business environment.
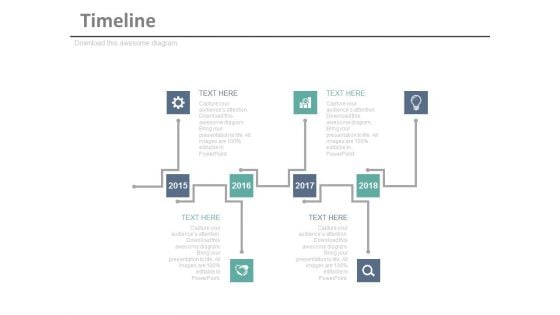
Timeline Infographic Diagram For Business Achievements Powerpoint Slides
This timeline infographic template can be used for multiple purposes including event planning, new milestones and tasks. This PPT slide may be helpful to display financial strategy timeline. Download this PowerPoint timeline template to make impressive presentations.
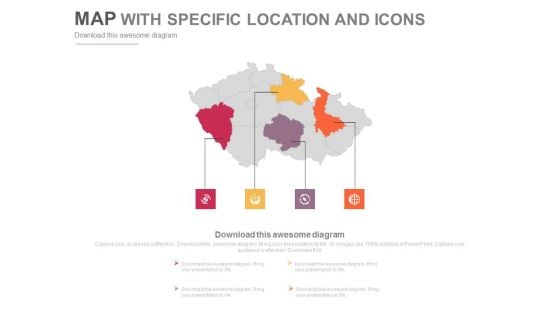
Infographic Map Diagram With Four Points Powerpoint Slides
This PowerPoint template displays infographic map design. This PPT template can be used in business presentations to depict economic growth of highlighted states. This slide can also be used by school students for educational projects.
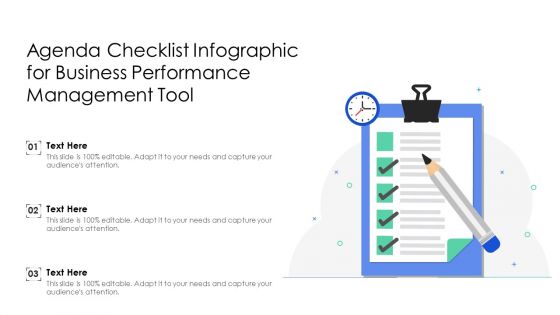
Agenda Checklist Infographic For Business Performance Management Tool Themes PDF
Persuade your audience using this agenda checklist infographic for business performance management tool themes pdf. This PPT design covers three stages, thus making it a great tool to use. It also caters to a variety of topics including agenda checklist infographic for business performance management tool. Download this PPT design now to present a convincing pitch that not only emphasizes the topic but also showcases your presentation skills.

Three Point Infographic Diagram For Distribution Strategy Formats PDF
Persuade your audience using this three point infographic diagram for distribution strategy formats pdf. This PPT design covers three stages, thus making it a great tool to use. It also caters to a variety of topics including Three Point Infographic Diagram For Distribution Strategy. Download this PPT design now to present a convincing pitch that not only emphasizes the topic but also showcases your presentation skills.
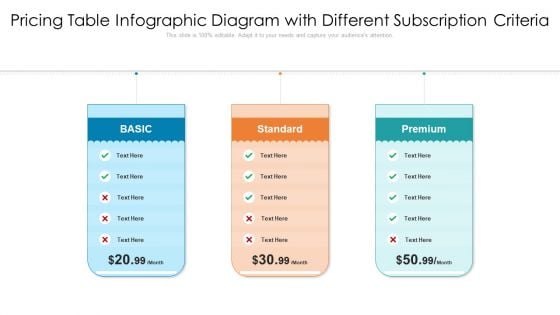
Pricing Table Infographic Diagram With Different Subscription Criteria Microsoft PDF
Persuade your audience using this pricing table infographic diagram with different subscription criteria microsoft pdf. This PPT design covers three stages, thus making it a great tool to use. It also caters to a variety of topics including pricing table infographic diagram with different subscription criteria. Download this PPT design now to present a convincing pitch that not only emphasizes the topic but also showcases your presentation skills.
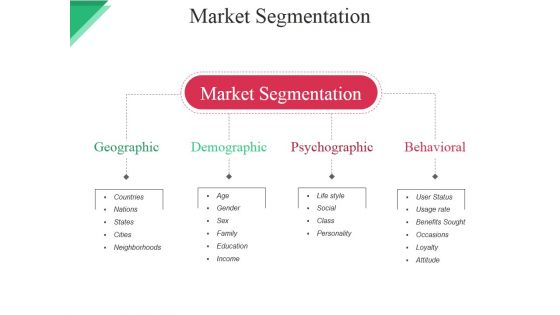
Market Segmentation Ppt PowerPoint Presentation Infographic Template Layout
This is a market segmentation ppt powerpoint presentation infographic template layout. This is a four stage process. The stages in this process are market segmentation, geographic, demographic, psychographic, behavioral.
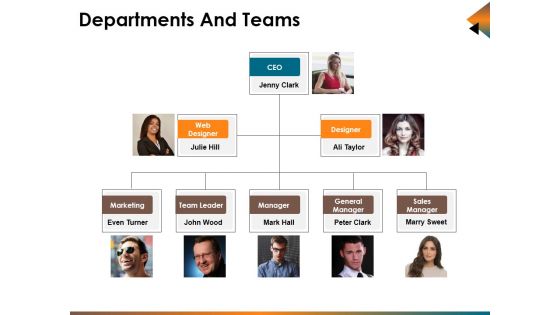
Departments And Teams Ppt PowerPoint Presentation Infographic Template Brochure
This is a departments and teams ppt powerpoint presentation infographic template brochure. This is a three stage process. The stages in this process are even turner, john wood, mark hall, peter clark, marry sweet.
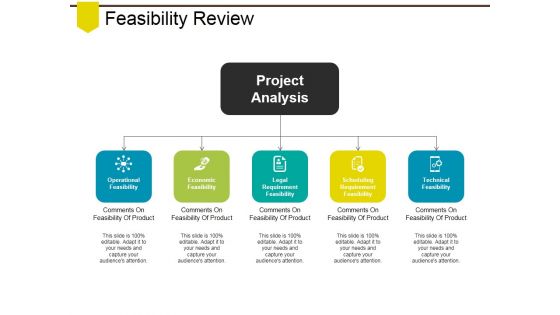
Feasibility Review Ppt PowerPoint Presentation Infographic Template Demonstration
This is a feasibility review ppt powerpoint presentation infographic template demonstration. This is a three stage process. The stages in this process are operational feasibility, economic feasibility, legal requirement feasibility, scheduling requirement feasibility, technical feasibility.
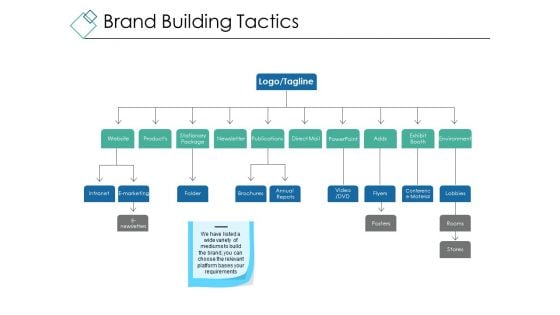
Brand Building Tactics Ppt PowerPoint Presentation Gallery Infographic Template
This is a brand building tactics ppt powerpoint presentation gallery infographic template. This is a three stage process. The stages in this process are website, stationary package, newsletter, publications, direct mail, powerpoint.
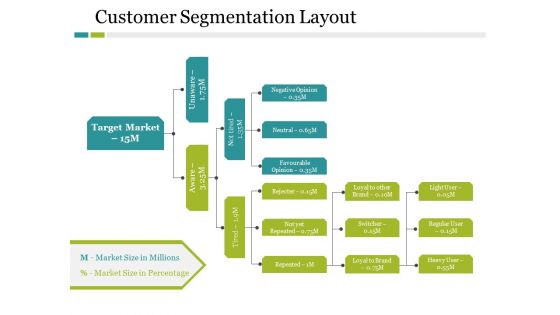
Customer Segmentation Layout Ppt PowerPoint Presentation Infographic Template Pictures
This is a customer segmentation layout ppt powerpoint presentation infographic template pictures. This is a six stage process. The stages in this process are loyal to other, switcher, loyal to brand, light user, regular user.
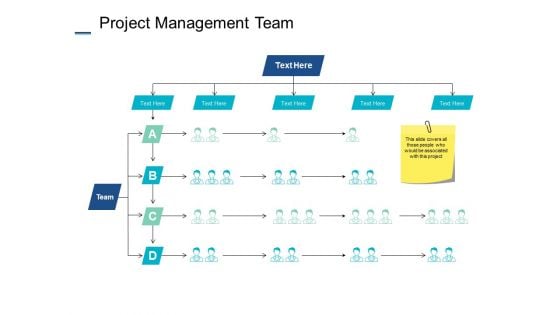
Project Management Team Ppt PowerPoint Presentation Infographic Template Deck
This is a project management team ppt powerpoint presentation infographic template deck. This is a four stage process. The stages in this process are business, planning, strategy, marketing, management.
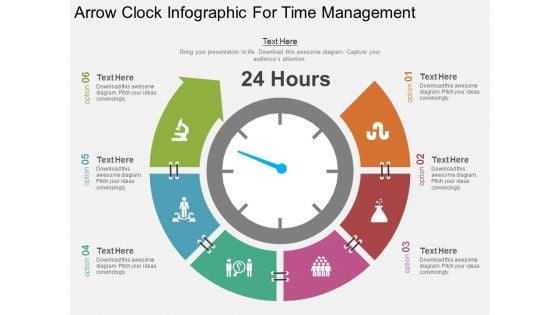
Arrow Clock Infographic For Time Management Powerpoint Template
This PowerPoint template has been designed with arrow clock infographic diagram. This diagram is useful to exhibit concepts related to time management. This diagram slide can be used to make impressive presentations.
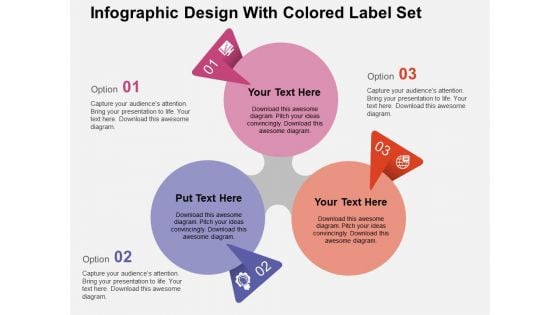
Infographic Design With Colored Label Set Powerpoint Templates
This diagram contains colored label infographic set. Download this diagram slide to display business planning and management. This diagram is editable you can edit text, color, shade and style as per you need.
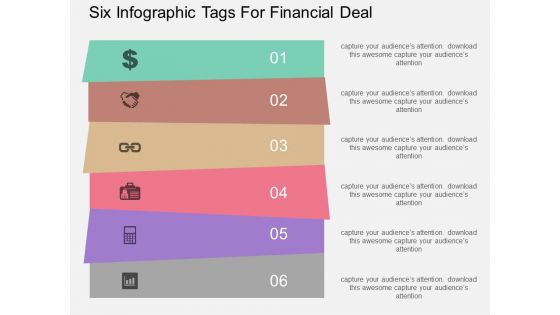
Six Infographic Tags For Financial Deal Powerpoint Template
This PowerPoint template has been designed with diagram of six infographic tags. This business diagram helps to exhibit financial deal and planning. Use this diagram to build an exclusive presentation.
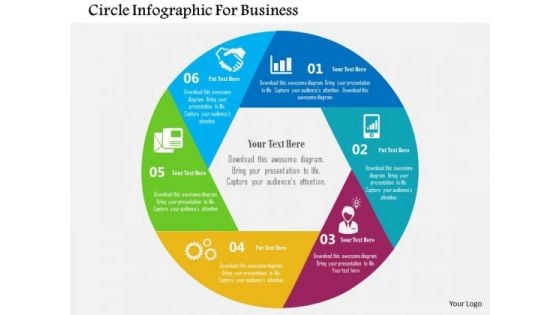
Business Diagram Circle Infographic For Business Presentation Template
This business diagram displays circle infographic. This business diagram has been designed with graphic of circle with icons. Use this diagram to depict business planning process in your presentations.
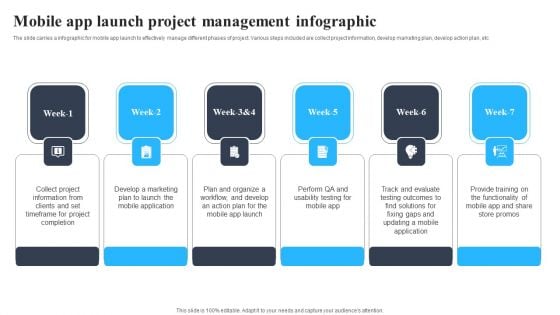
Mobile App Launch Project Management Infographic Brochure PDF
The slide carries a infographic for mobile app launch to effectively manage different phases of project. Various steps included are collect project information, develop marketing plan, develop action plan, etc Presenting Mobile App Launch Project Management Infographic Brochure PDF to dispense important information. This template comprises six stages. It also presents valuable insights into the topics including Completion, Mobile Application, Application. This is a completely customizable PowerPoint theme that can be put to use immediately. So, download it and address the topic impactfully.
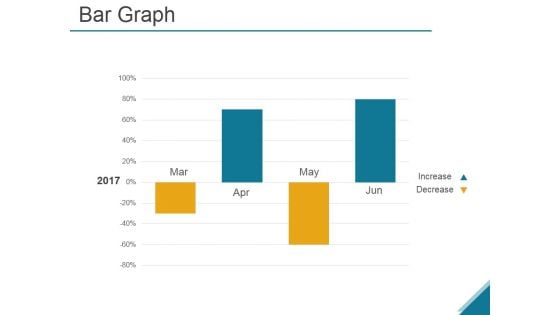
Bar Graph Ppt PowerPoint Presentation Infographic Template Background
This is a bar graph ppt powerpoint presentation infographic template background. This is a four stage process. The stages in this process are business, strategy, analysis, growth, chart and graph.
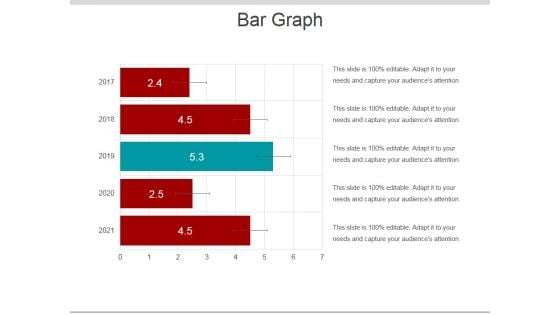
Bar Graph Ppt PowerPoint Presentation Infographic Template Deck
This is a bar graph ppt powerpoint presentation infographic template deck. This is a five stage process. The stages in this process are bar chart, business, marketing, strategy, planning.
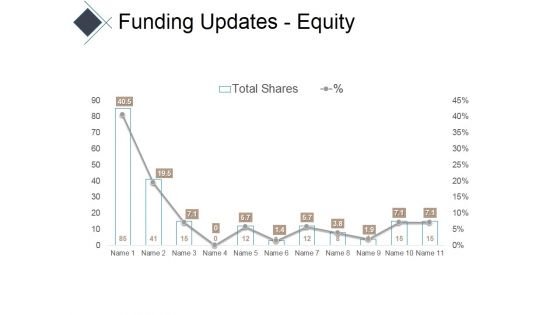
Funding Updates Equity Ppt PowerPoint Presentation Infographic Template Portfolio
This is a funding updates equity ppt powerpoint presentation infographic template portfolio. This is a eleven stage process. The stages in this process are charts, area, marketing, business, success.
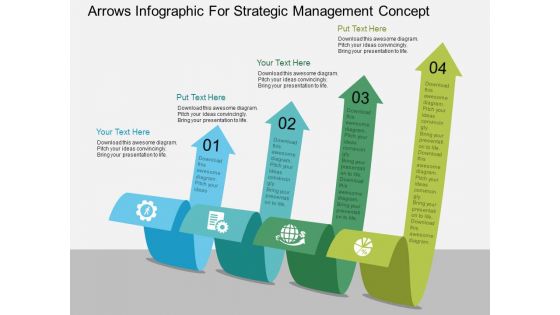
Arrows Infographic For Strategic Management Concept Powerpoint Template
Our above PPT slide contains four curved arrows infographic design. This business diagram helps to depict business information for strategic management. Use this diagram to impart more clarity to data and to create more sound impact on viewers.
Banners Infographic For Corporate Business Strategy Powerpoint Template
This business slide contains four infographic tags. This diagram is suitable to present corporate business strategy. Visual effect of this diagram helps in maintaining the flow of the discussion and provides more clarity to the subject.
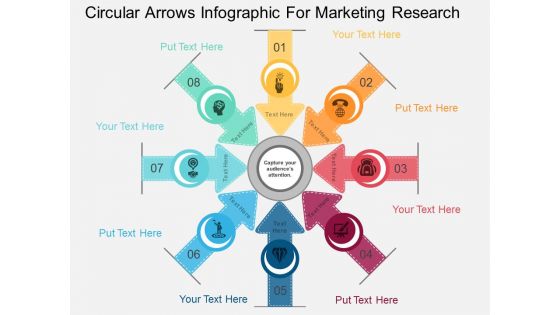
Circular Arrows Infographic For Marketing Research Powerpoint Template
This PPT slide has been designed with circular arrows infographic diagram. This business diagram is suitable for marketing research and analysis. This professional slide helps in making an instant impact on viewers.
Infographic Tags For Global Business Communication Powerpoint Slides
This PowerPoint slide has been designed with five infographic tags. This PPT diagram may be used to display global business communication. This diagram slide can be used to make impressive presentations.
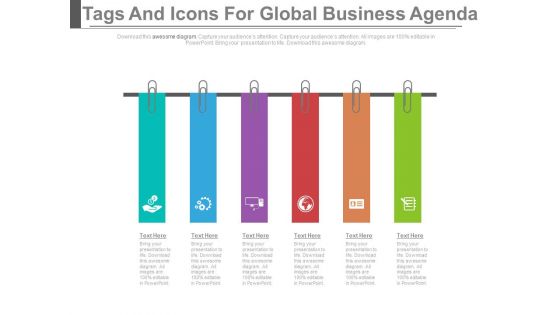
Six Infographic Tags For Global Business Agenda Powerpoint Template
Our above PPT slide contains diagram of six infographic tags. This PowerPoint template may be used to display global business agenda. Use this diagram to create more sound impact on viewers.
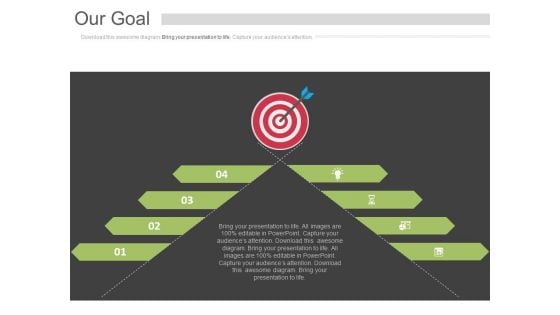
Four Steps Our Goal Infographic Design Powerpoint Slides
This PowerPoint template has been designed with our goal infographic diagram. Download this PPT slide to define and achieve goals with more success. This diagram may be used for goal planning related topics.
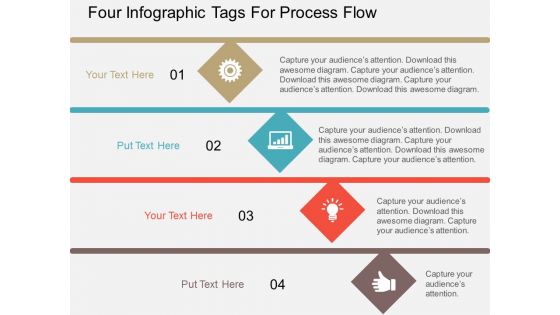
Four Infographic Tags For Process Flow Powerpoint Template
This PowerPoint diagram contains four infographic tags. Download this diagram slide to represent process flow. This is editable slide you can edit text, color, shade and style as per you need.
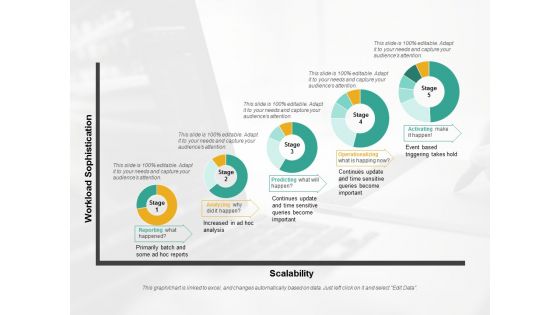
Predictive Analytics Stages Ppt PowerPoint Presentation Infographic Template Structure
This is a predictive analytics stages ppt powerpoint presentation infographic template structure. This is a five stage process. The stages in this process are business, donut chart, finance, marketing, strategy.
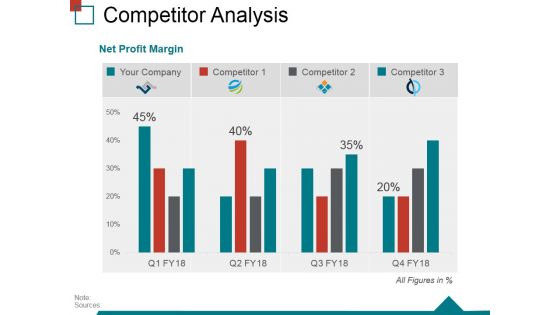
Competitor Analysis Template 3 Ppt PowerPoint Presentation Infographic Template Shapes
This is a competitor analysis template 3 ppt powerpoint presentation infographic template shapes. This is a four stage process. The stages in this process are your company, market share, competitor, analysis.
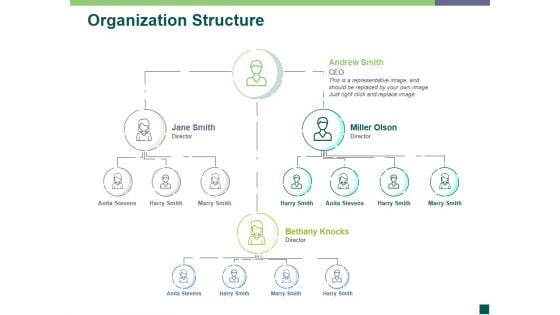
Organization Structure Template 4 Ppt PowerPoint Presentation Infographic Template Slide
This is a organization structure template 4 ppt powerpoint presentation infographic template slide. This is a three stage process. The stages in this process are business, organization structure, communication, management, planning.
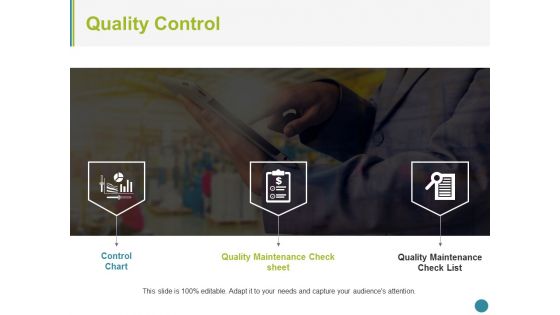
Quality Control Ppt PowerPoint Presentation Infographic Template Deck
This is a quality control ppt powerpoint presentation infographic template deck. This is a three stage process. The stages in this process are control chart, quality maintenance check sheet, quality maintenance check list.
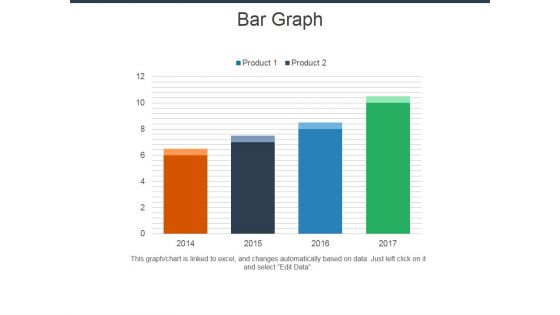
Bar Graph Ppt Powerpoint Presentation Infographic Template Smartart
This is a bar graph ppt powerpoint presentation infographic template smartart. This is a four stage process. The stages in this process are bar graph, business, management, strategy, planning.
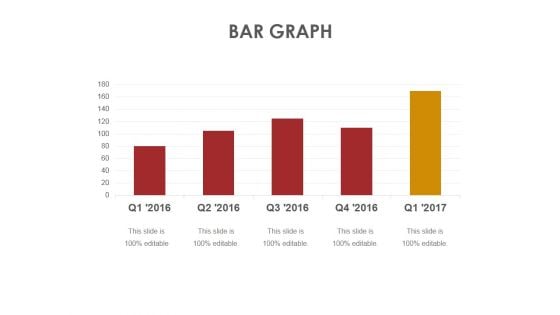
Bar Graph Ppt PowerPoint Presentation Gallery Infographic Template
This is a bar graph ppt powerpoint presentation gallery infographic template. This is a five stage process. The stages in this process are business, marketing, analysis, strategy, bar graph.
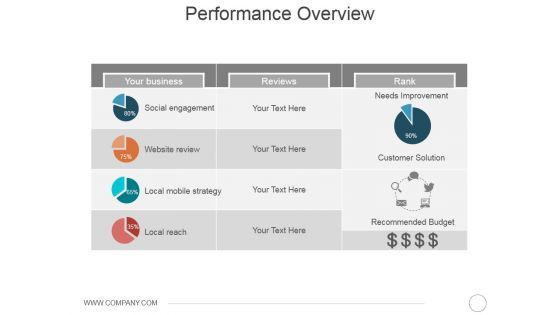
Performance Overview Ppt PowerPoint Presentation Infographic Template Slide
This is a performance overview ppt powerpoint presentation infographic template slide. This is a four stage process. The stages in this process are social engagement, website review, local mobile strategy, local reach.

Staff With Professional Qualification Ppt PowerPoint Presentation Infographic Template Introduction
This is a staff with professional qualification ppt powerpoint presentation infographic template introduction. This is a five stage process. The stages in this process are below bachelor degree, bachelor degree, postgraduate.

 Home
Home