Infographic Icons

Combo Chart Ppt PowerPoint Presentation Infographics Good
This is a combo chart ppt powerpoint presentation infographics good. This is a three stage process. The stages in this process are combo chart, finance, analysis, business, marketing.
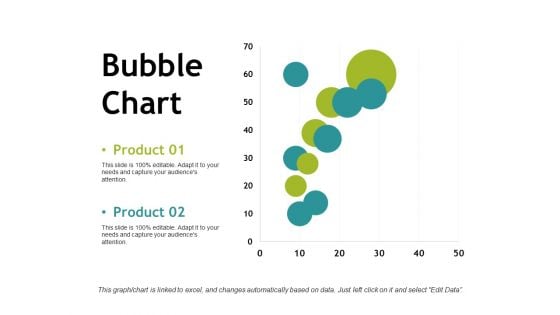
Bubble Chart Ppt PowerPoint Presentation Infographics Example
This is a bubble chart ppt powerpoint presentation infographics example. This is a two stage process. The stages in this process are business, bubble chart, marketing, strategy, finance.
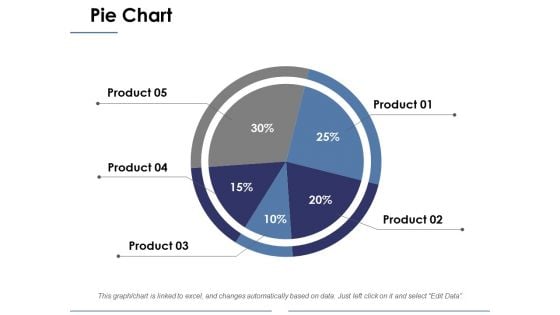
Pie Chart Ppt PowerPoint Presentation Infographics Shapes
This is a pie chart ppt powerpoint presentation infographics shapes. This is a five stage process. The stages in this process are business, pie chart, marketing, percentage, strategy.
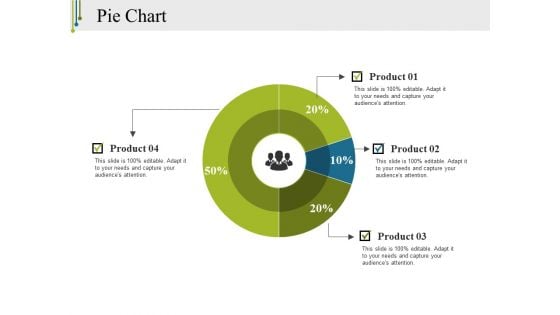
Pie Chart Ppt PowerPoint Presentation Infographics Clipart
This is a pie chart ppt powerpoint presentation infographics clipart. This is a four stage process. The stages in this process are pie chart, finance, marketing, strategy, business.
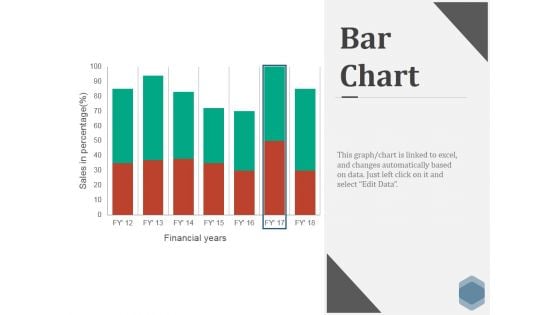
Bar Chart Ppt PowerPoint Presentation Infographics Skills
This is a bar chart ppt powerpoint presentation infographics skills. This is a seven stage process. The stages in this process are business, marketing, strategy, finance, bar.

Bubble Chart Ppt PowerPoint Presentation Infographics Guide
This is a bubble chart ppt powerpoint presentation infographics guide. This is a two stage process. The stages in this process are business, marketing, strategy, finance, planning.

Combo Chart Ppt PowerPoint Presentation Infographics Ideas
This is a combo chart ppt powerpoint presentation infographics ideas. This is a four stage process. The stages in this process are bar graph, marketing, strategy, finance, analysis.
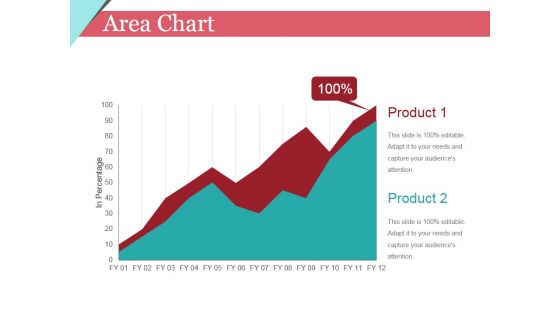
Area Chart Ppt PowerPoint Presentation Infographics Backgrounds
This is a area chart ppt powerpoint presentation infographics backgrounds. This is a two stage process. The stages in this process are business, marketing, chart, growth, product.
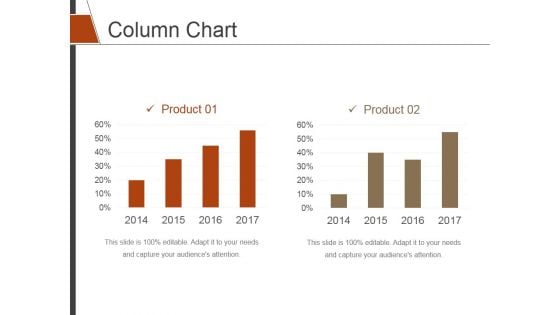
Column Chart Ppt PowerPoint Presentation Infographics Display
This is a column chart ppt powerpoint presentation infographics display. This is a two stage process. The stages in this process are column chart, finance, marketing, strategy, analysis.
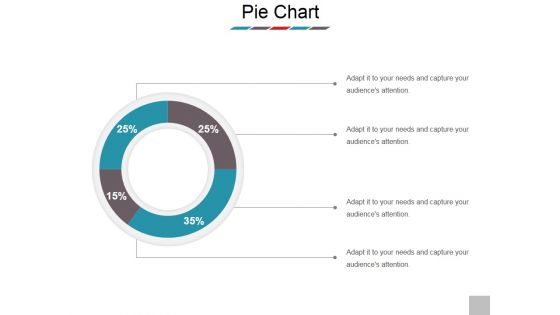
Pie Chart Ppt PowerPoint Presentation Infographics Files
This is a pie chart ppt powerpoint presentation infographics files. This is a four stage process. The stages in this process are pie chart, process, marketing, business, success.
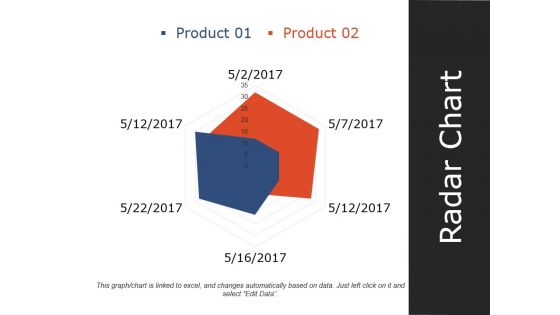
Radar Chart Ppt PowerPoint Presentation Infographics Slideshow
This is a radar chart ppt powerpoint presentation infographics slideshow. This is a two stage process. The stages in this process are product, radar chart, shape, management, marketing.
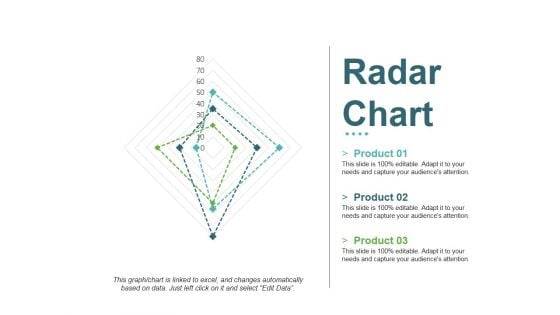
Radar Chart Ppt PowerPoint Presentation Infographics Ideas
This is a radar chart ppt powerpoint presentation infographics ideas. This is a three stage process. The stages in this process are product, business, shapes, marketing, radar chart.

Bubble Chart Ppt PowerPoint Presentation Infographics Images
This is a bubble chart ppt powerpoint presentation infographics images. This is a two stage process. The stages in this process are product, bubble chart, business, growth, success.
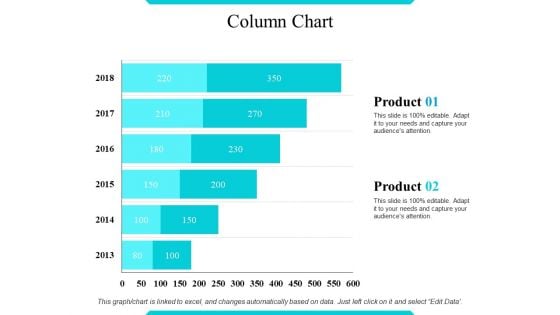
Column Chart Ppt PowerPoint Presentation Infographics Styles
This is a column chart ppt powerpoint presentation infographics styles. This is a two stage process. The stages in this process are product, column chart, business.
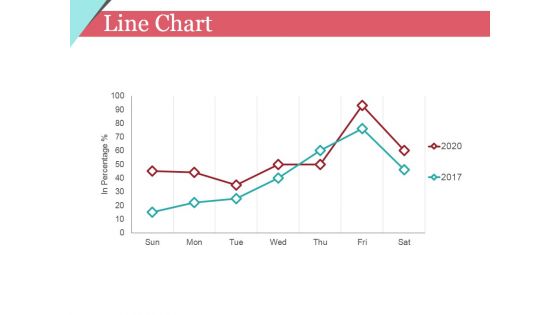
Line Chart Ppt PowerPoint Presentation Infographics Ideas
This is a line chart ppt powerpoint presentation infographics ideas. This is a two stage process. The stages in this process are growth, graph, marketing.
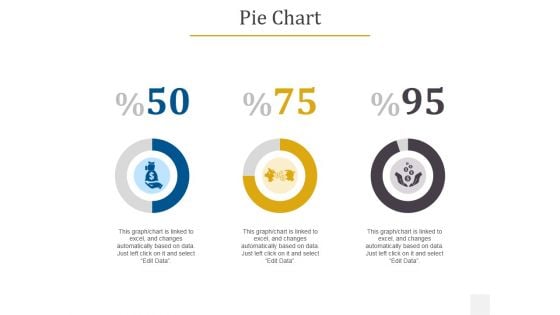
Pie Chart Ppt PowerPoint Presentation Infographics Aids
This is a pie chart ppt powerpoint presentation infographics aids. This is a three stage process. The stages in this process are business, finance, management, strategy, planning.

Column Chart Ppt PowerPoint Presentation Infographics Portrait
This is a column chart ppt powerpoint presentation infographics portrait. This is a two stage process. The stages in this process are product, year, time planning, business, step.
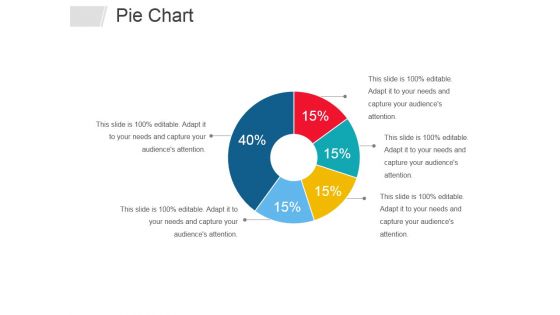
Pie Chart Ppt PowerPoint Presentation Infographics Templates
This is a pie chart ppt powerpoint presentation infographics templates. This is a five stage process. The stages in this process are business, percentage, management, process.
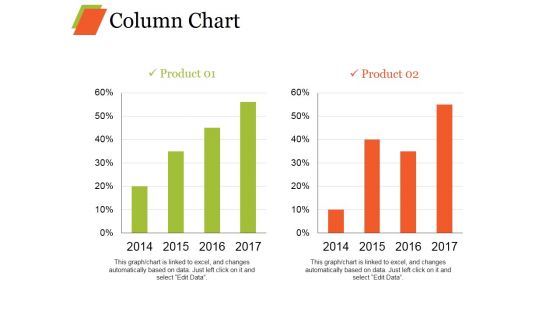
Column Chart Ppt PowerPoint Presentation Infographics Model
This is a column chart ppt powerpoint presentation infographics model. This is a two stage process. The stages in this process are bar graph, growth, product, percentage, year.
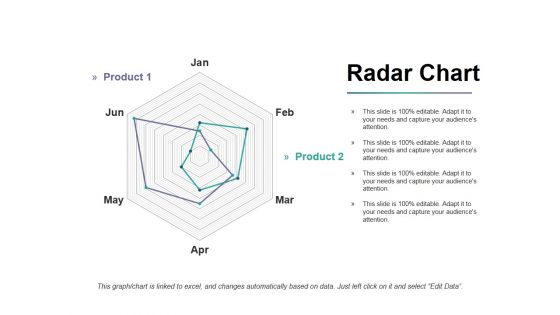
Radar Chart Ppt PowerPoint Presentation Infographics Portfolio
This is a radar chart ppt powerpoint presentation infographics portfolio. This is a two stage process. The stages in this process are product, finance, shapes, business, marketing.
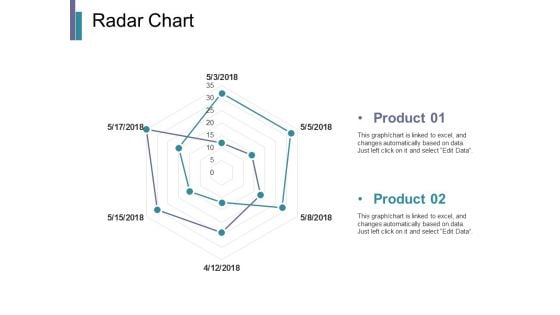
Radar Chart Ppt PowerPoint Presentation Infographics Pictures
This is a radar chart ppt powerpoint presentation infographics pictures. This is a two stage process. The stages in this process are business, marketing, strategy, planning, finance.
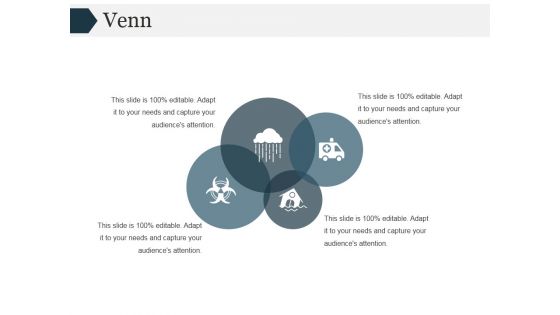
Venn Ppt PowerPoint Presentation Infographics Smartart
This is a venn ppt powerpoint presentation infographics smartart. This is a four stage process. The stages in this process are venn, marketing, sale, analysis, business, management.
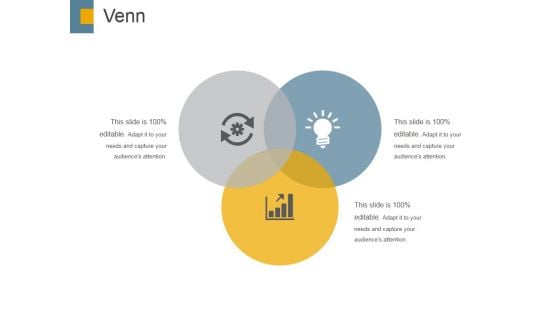
Venn Ppt PowerPoint Presentation Infographics Background Image
This is a venn ppt powerpoint presentation infographics background image. This is a three stage process. The stages in this process are venn, business, marketing, success, strategy.
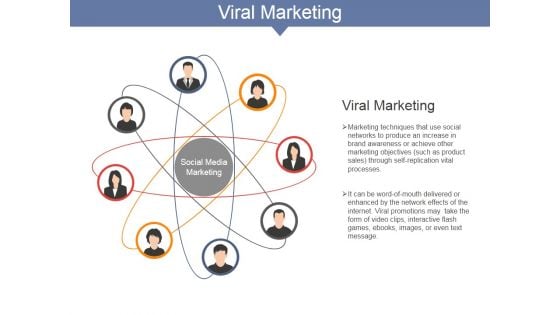
Viral Marketing Ppt PowerPoint Presentation Infographics Example
This is a viral marketing ppt powerpoint presentation infographics example. This is a eight stage process. The stages in this process are viral marketing, social media marketing.

Venn Ppt PowerPoint Presentation Infographics Show
This is a venn ppt powerpoint presentation infographics show. This is a four stage process. The stages in this venn, analysis, business, management, strategy.
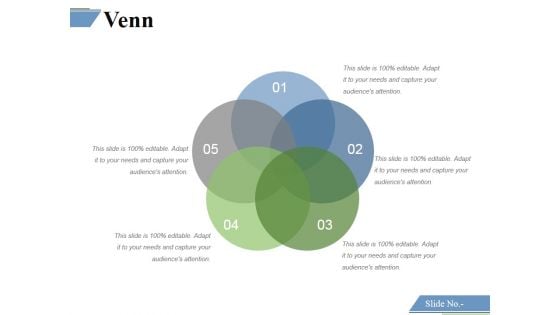
Venn Ppt PowerPoint Presentation Infographics Graphics
This is a venn ppt powerpoint presentation infographics graphics. This is a five stage process. The stages in this process are venn, marketing, strategy, analysis, business.

Venn Ppt PowerPoint Presentation Infographics Template
This is a venn ppt powerpoint presentation infographics template. This is a three stage process. The stages in this process are venn, intersect, business, marketing.

Venn Ppt PowerPoint Presentation Infographics Visual Aids
This is a venn ppt powerpoint presentation infographics visual aids. This is a four stage process. The stages in this process are venn, business, planning, marketing, management.
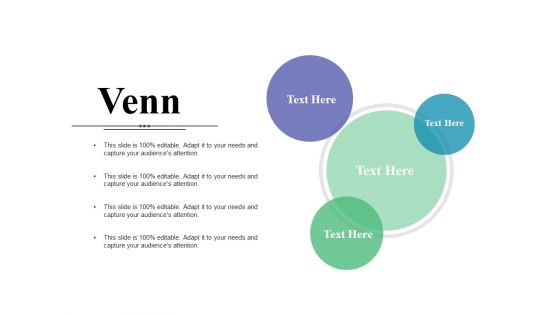
Venn Ppt PowerPoint Presentation Infographics Inspiration
This is a venn ppt powerpoint presentation infographics inspiration. This is a four stage process. The stages in this process are venn, marketing, strategy, business, sale.
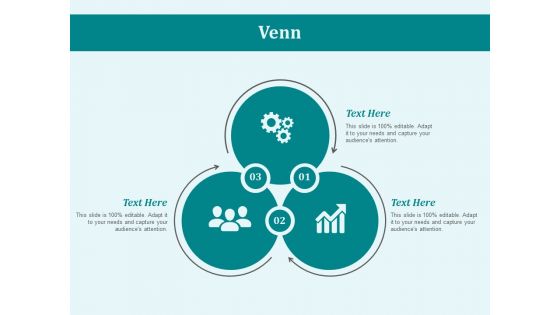
Venn Business Ppt PowerPoint Presentation Infographics Background
This is a venn business ppt powerpoint presentation infographics background. This is a three stage process. The stages in this process are business, marketing, management, venn.
Infographics Option Banner With Umbrella Powerpoint Templates
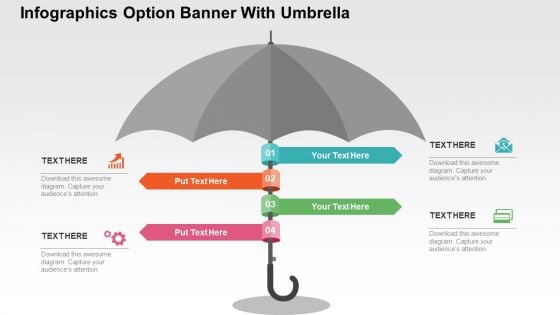
Who doesn?t want to have a secure life? Be it financial security, safety of your child or safe environment at home and at work place. Well we hope for that but we can definitely save you from making ugly PowerPoint presentations. Above is the slide which is of umbrella with four options and along with it are four icons. This slide is one of our most downloaded PowerPoint slides and can be used to depict safety and security of any kind. The umbrella here can be used to indicate the safety, security, protection so you can choose this slide to show why it is safe to be associated with your company, or with your business, with your school, how your money is safe and secured in your bank or how it is safe if you pay online and much more. It is a multipurpose slide and can easily be modified as you want. Choose this slide to make your PowerPoint presentation look even more fantastic.

Our Goal Ppt PowerPoint Presentation Infographics Themes
This is a our goal ppt powerpoint presentation infographics themes. This is a six stage process. The stages in this process are goal, success, management, marketing.

Email Marketing Ppt PowerPoint Presentation Infographics Themes
This is a email marketing ppt powerpoint presentation infographics themes. This is a one stage process. The stages in this process are email marketing.
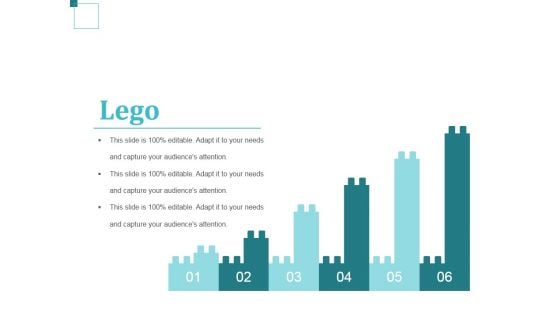
Lego Ppt PowerPoint Presentation Infographics Themes
This is a lego ppt powerpoint presentation infographics themes. This is a six stage process. The stages in this process are business, strategy, analysis, marketing, lego.

Client Testimonials Ppt PowerPoint Presentation Infographics Themes
This is a client testimonials ppt powerpoint presentation infographics themes. This is a two stage process. The stages in this process are sales manager, founder ceo.
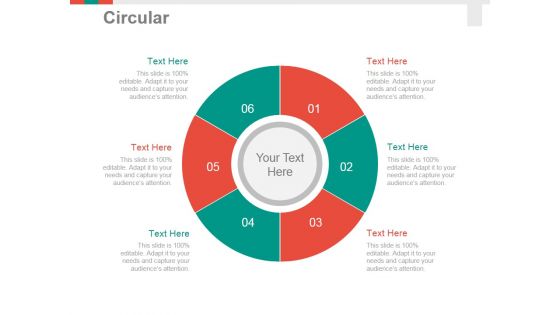
Circular Ppt PowerPoint Presentation Infographics Themes
This is a circular ppt powerpoint presentation infographics themes. This is a six stage process. The stages in this process are business, process, management, strategy, success.
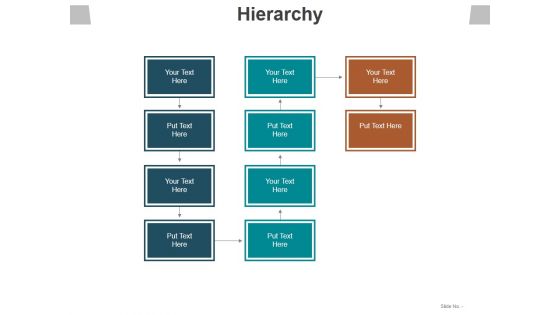
Hierarchy Ppt PowerPoint Presentation Infographics Themes
This is a hierarchy ppt powerpoint presentation infographics themes. This is a three stage process. The stages in this process are hierarchy, business, marketing, plan, management.
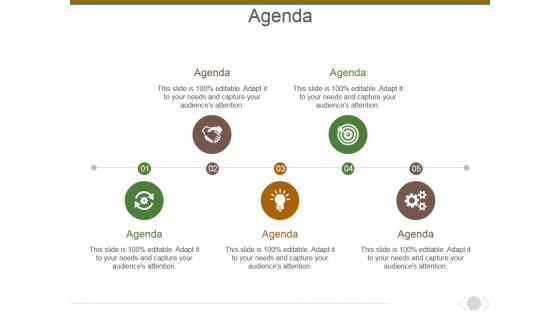
Agenda Ppt PowerPoint Presentation Infographics Themes
This is a agenda ppt powerpoint presentation infographics themes. This is a five stage process. The stages in this process are agenda, business, marketing, management, planning.
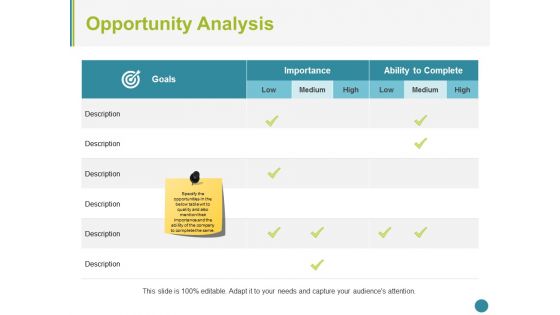
Opportunity Analysis Ppt PowerPoint Presentation Infographics Themes
This is a Opportunity Analysis Ppt PowerPoint Presentation Infographics Themes. This is a three stage process. The stages in this process are opportunity analysis, low, medium, high, business.
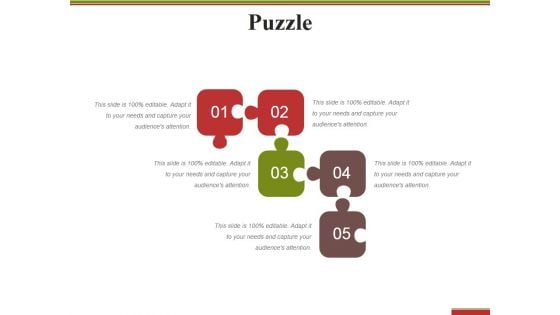
Puzzle Ppt PowerPoint Presentation Infographics Diagrams
This is a puzzle ppt powerpoint presentation infographics diagrams. This is a five stage process. The stages in this process are puzzle, problem, solution, business, marketing.

Thank You Ppt PowerPoint Presentation Infographics Diagrams
This is a thank you ppt powerpoint presentation infographics diagrams. This is a two stage process. The stages in this process are thank you, communication, planning, business, management.
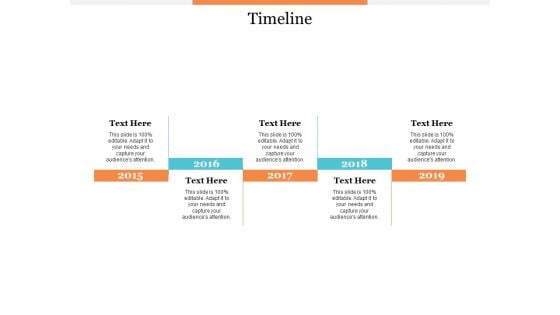
Timeline Roadmap Ppt PowerPoint Presentation Infographics Diagrams
This is a timeline roadmap ppt powerpoint presentation infographics diagrams. This is a five stage process. The stages in this process are business, management, marketing, timeline, roadmap.
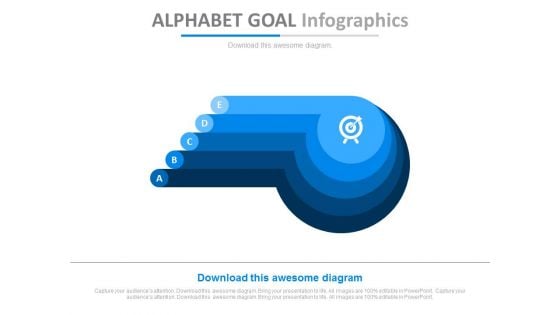
Five Steps Alphabet Goal Infographics Powerpoint Slides
This PPT slide contains unique graphic design of alphabetic steps with goals icon. You may use this PPT slide to display strategy for target achievement. Impress your audiences by using this PPT slide.
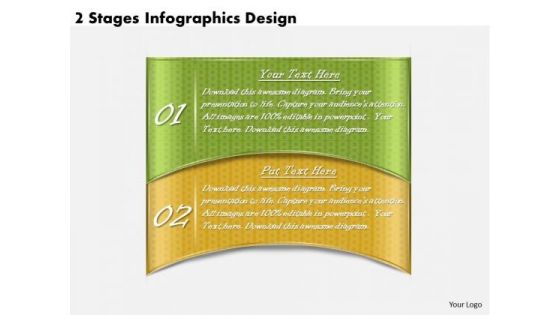
Timeline Ppt Template 2 Stages Infographics Design
Analyze Ailments On Our Timeline Ppt Template 2 Stages Infographics Design Powerpoint Templates. Bring Out The Thinking Doctor In You. Dock Your Thoughts With Our Background Powerpoint Templates. They Will Launch Them Into Orbit.
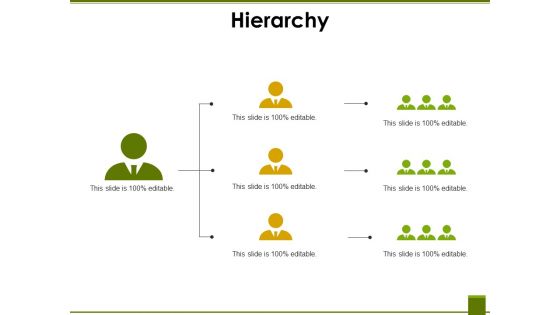
Hierarchy Ppt PowerPoint Presentation Infographics Deck
This is a hierarchy ppt powerpoint presentation infographics deck. This is a three stage process. The stages in this process are hierarchy, chart, business, marketing.
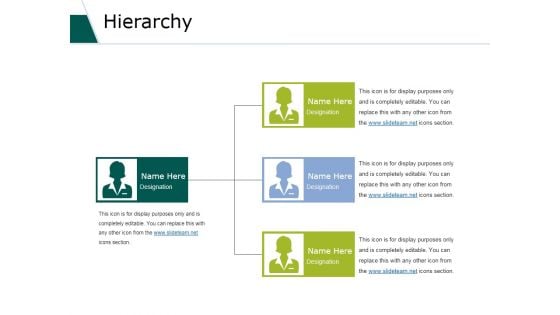
Hierarchy Ppt PowerPoint Presentation Infographics Example
This is a hierarchy ppt powerpoint presentation infographics example. This is a three stage process. The stages in this process are business, marketing, organization, analysis, communication.
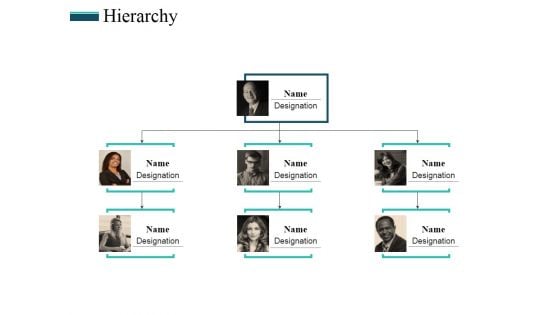
Hierarchy Ppt PowerPoint Presentation Infographics Demonstration
This is a hierarchy ppt powerpoint presentation infographics demonstration. This is a three stage process. The stages in this process are structure, people, communication, management, teamwork.
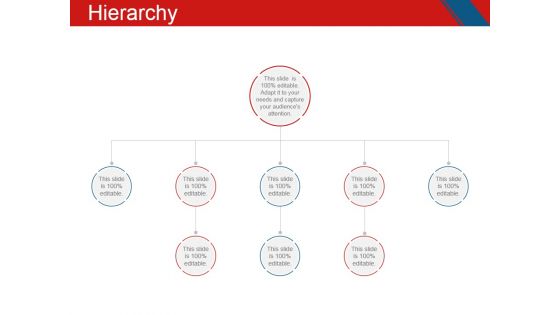
Hierarchy Ppt PowerPoint Presentation Infographics Graphic Images
This is a hierarchy ppt powerpoint presentation infographics graphic images. This is a eight stage process. The stages in this process are business, chart, organization, process, structure.
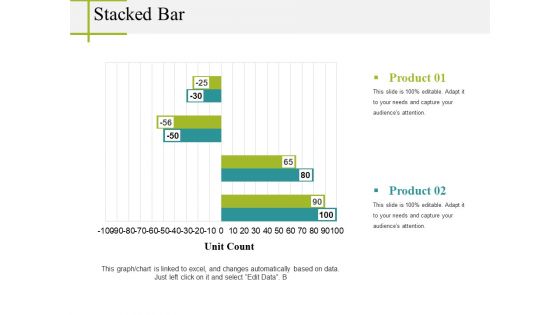
Stacked Bar Ppt PowerPoint Presentation Infographics Portrait
This is a stacked bar ppt powerpoint presentation infographics portrait. This is a two stage process. The stages in this process are unit count, business, marketing, graph, strategy.
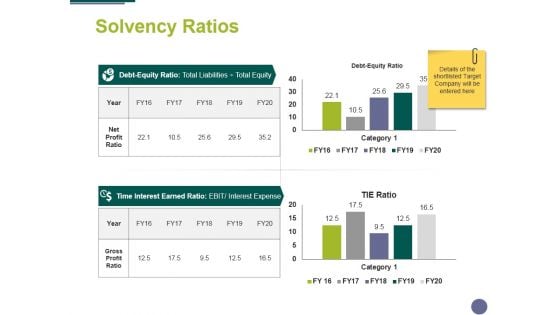
Solvency Ratios Ppt PowerPoint Presentation Infographics Portrait
This is a solvency ratios ppt powerpoint presentation infographics portrait. This is a two stage process. The stages in this process are compere, finance, marketing, analysis, business.
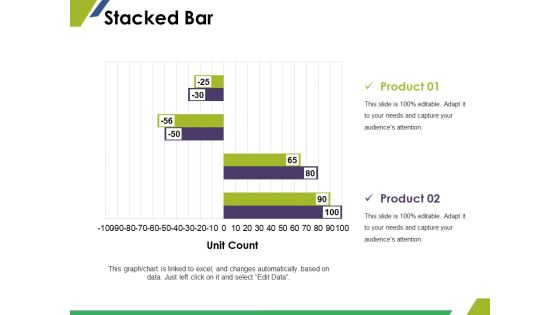
Stacked Bar Ppt PowerPoint Presentation Infographics Clipart
This is a stacked bar ppt powerpoint presentation infographics clipart. This is a two stage process. The stages in this process are finance, marketing, business, unit count, graph.
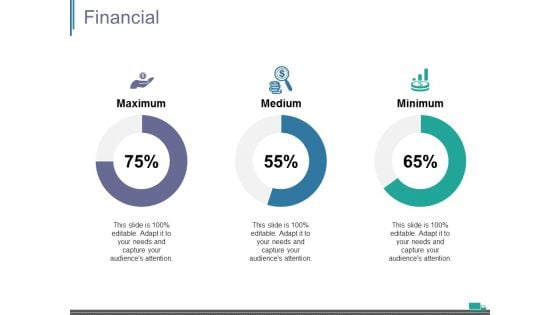
Financial Ppt PowerPoint Presentation Infographics Portrait
This is a financial ppt powerpoint presentation infographics portrait. This is a three stage process. The stages in this process are maximum, medium, minimum.
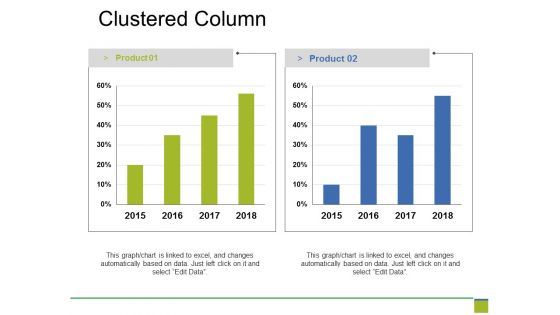
Clustered Column Ppt PowerPoint Presentation Infographics Professional
This is a clustered column ppt powerpoint presentation infographics professional. This is a two stage process. The stages in this process are business, marketing, strategy, planning, finance.
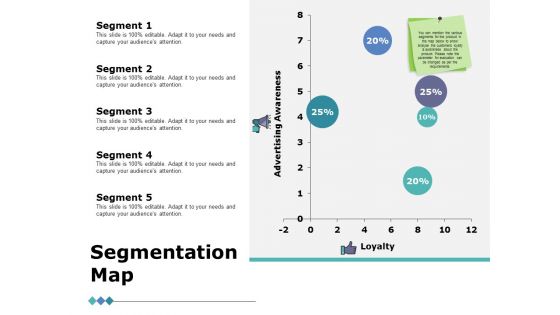
Segmentation Map Ppt PowerPoint Presentation Infographics Guide
This is a segmentation map ppt powerpoint presentation infographics guide. This is a five stage process. The stages in this process are business, marketing, strategy, planning, finance.
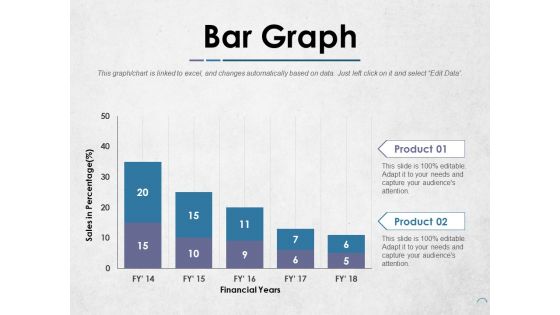
Bar Graph Ppt PowerPoint Presentation Infographics Templates
This is a bar graph ppt powerpoint presentation infographics templates. This is a two stage process. The stages in this process are product, financial years, sales in percentage.
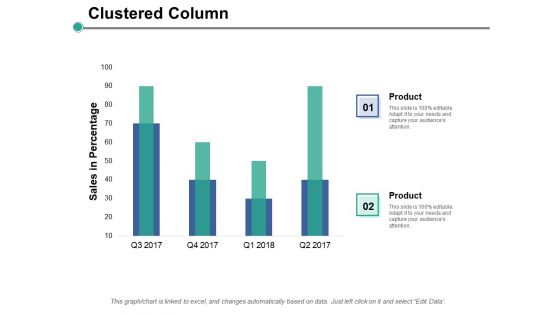
Clustered Column Ppt PowerPoint Presentation Infographics Picture
This is a clustered column ppt powerpoint presentation infographics picture. This is a two stage process. The stages in this process are finance, marketing, management, investment, analysis.
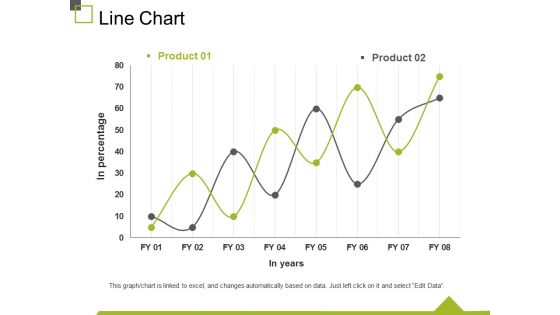
Line Chart Ppt PowerPoint Presentation Infographics Display
This is a line chart ppt powerpoint presentation infographics display. This is a two stage process. The stages in this process are in percentage, in years, chart, business, marketing.
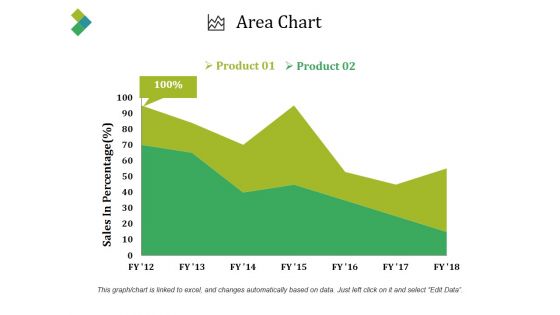
Area Chart Ppt PowerPoint Presentation Infographics Good
This is a area chart ppt powerpoint presentation infographics good. This is a two stage process. The stages in this process are sales in percentage, product, area chart, business, percentage.
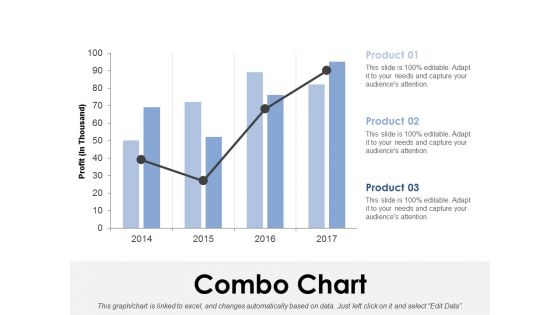
Combo Chart Ppt PowerPoint Presentation Infographics Sample
This is a combo chart ppt powerpoint presentation infographics sample. This is a three stage process. The stages in this process are combo chart, finance, analysis, marketing, strategy, business.
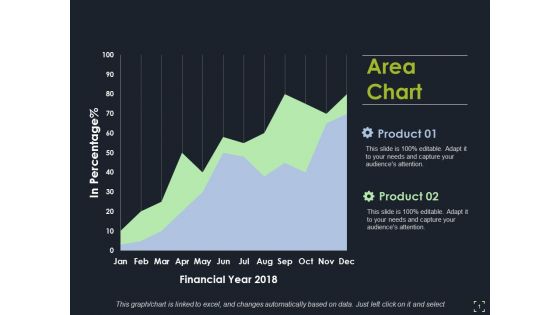
Area Chart Ppt PowerPoint Presentation Infographics Images
This is a area chart ppt powerpoint presentation infographics images. This is a two stage process. The stages in this process are area chart, finance, marketing, analysis, strategy, business.

 Home
Home