Infographic Icons
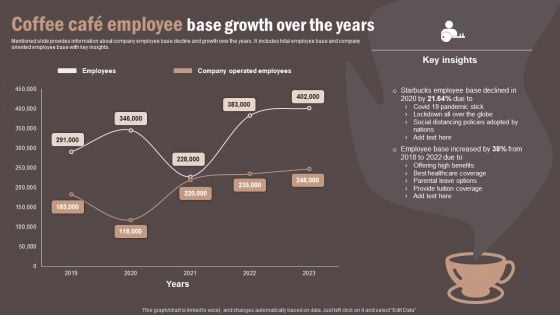
Coffee Cafe Employee Base Growth Over The Years Infographics PDF
Mentioned slide provides information about company employee base decline and growth over the years. It includes total employee base and company oriented employee base with key insights. Do you have to make sure that everyone on your team knows about any specific topic I yes, then you should give Coffee Cafe Employee Base Growth Over The Years Infographics PDF a try. Our experts have put a lot of knowledge and effort into creating this impeccable Coffee Cafe Employee Base Growth Over The Years Infographics PDF You can use this template for your upcoming presentations, as the slides are perfect to represent even the tiniest detail. You can download these templates from the Slidegeeks website and these are easy to edit. So grab these today.
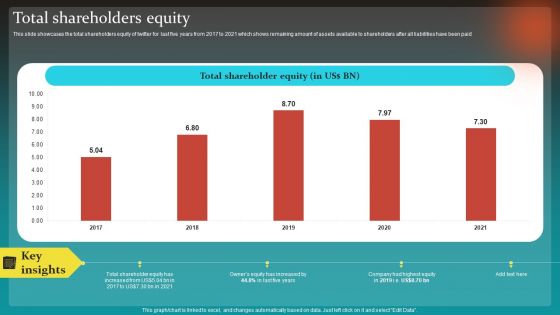
Social Network Business Summary Total Shareholders Equity Infographics PDF
This slide showcases the total shareholders equity of twitter for last five years from 2017 to 2021 which shows remaining amount of assets available to shareholders after all liabilities have been paid Do you have to make sure that everyone on your team knows about any specific topic I yes, then you should give Social Network Business Summary Total Shareholders Equity Infographics PDF a try. Our experts have put a lot of knowledge and effort into creating this impeccable Social Network Business Summary Total Shareholders Equity Infographics PDF. You can use this template for your upcoming presentations, as the slides are perfect to represent even the tiniest detail. You can download these templates from the Slidegeeks website and these are easy to edit. So grab these today.
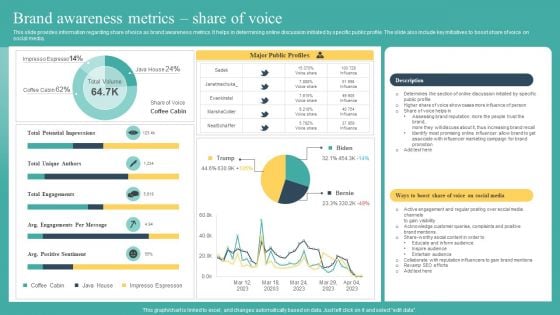
Brand Awareness Metrics Share Of Voice Ppt Infographics Show PDF
This slide provides information regarding share of voice as brand awareness metrics. It helps in determining online discussion initiated by specific public profile. The slide also include key initiatives to boost share of voice on social media. Here you can discover an assortment of the finest PowerPoint and Google Slides templates. With these templates, you can create presentations for a variety of purposes while simultaneously providing your audience with an eye catching visual experience. Download Brand Awareness Metrics Share Of Voice Ppt Infographics Show PDF to deliver an impeccable presentation. These templates will make your job of preparing presentations much quicker, yet still, maintain a high level of quality. Slidegeeks has experienced researchers who prepare these templates and write high quality content for you. Later on, you can personalize the content by editing the Brand Awareness Metrics Share Of Voice Ppt Infographics Show PDF.
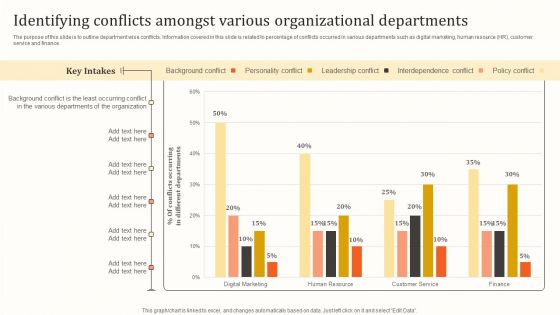
Identifying Conflicts Amongst Various Organizational Departments Infographics PDF
The purpose of this slide is to outline department wise conflicts. Information covered in this slide is related to percentage of conflicts occurred in various departments such as digital marketing, human resource HR, customer service and finance. Find highly impressive Identifying Conflicts Amongst Various Organizational Departments Infographics PDF on Slidegeeks to deliver a meaningful presentation. You can save an ample amount of time using these presentation templates. No need to worry to prepare everything from scratch because Slidegeeks experts have already done a huge research and work for you. You need to download Identifying Conflicts Amongst Various Organizational Departments Infographics PDF for your upcoming presentation. All the presentation templates are 100 percent editable and you can change the color and personalize the content accordingly. Download now.
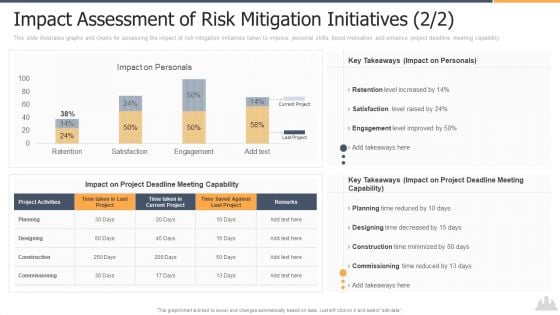
Impact Assessment Of Risk Mitigation Initiatives 2 2 Infographics PDF
This slide illustrates graphs and charts for assessing the impact of risk mitigation initiatives taken to improve project quality and reduce overall cost during project lifecycle. Deliver and pitch your topic in the best possible manner with this impact assessment of risk mitigation initiatives 2 2 infographics pdf. Use them to share invaluable insights on retention, satisfaction, engagement and impress your audience. This template can be altered and modified as per your expectations. So, grab it now.

Resource Administration Accounting Scorecard With Inventory Value Infographics PDF
This graph or chart is linked to excel, and changes automatically based on data. Just left click on it and select Edit Data. Deliver and pitch your topic in the best possible manner with this Resource Administration Accounting Scorecard With Inventory Value Infographics PDF. Use them to share invaluable insights on Current Inventory, Stock Positions, Missing Stock and impress your audience. This template can be altered and modified as per your expectations. So, grab it now.
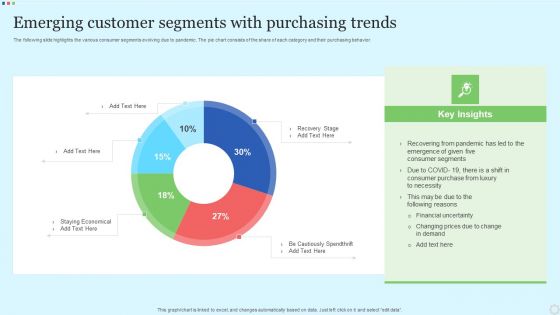
Emerging Customer Segments With Purchasing Trends Infographics PDF
The following slide highlights the various consumer segments evolving due to pandemic. The pie chart consists of the share of each category and their purchasing behavior. Showcasing this set of slides titled Emerging Customer Segments With Purchasing Trends Infographics PDF. The topics addressed in these templates are Recovery Stage, Cautiously Spendthrift, Staying Economical. All the content presented in this PPT design is completely editable. Download it and make adjustments in color, background, font etc. as per your unique business setting.
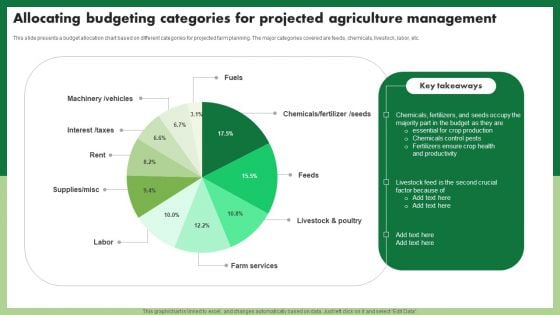
Allocating Budgeting Categories For Projected Agriculture Management Infographics PDF
This slide presents a budget allocation chart based on different categories for projected farm planning. The major categories covered are feeds, chemicals, livestock, labor, etc. Showcasing this set of slides titled Allocating Budgeting Categories For Projected Agriculture Management Infographics PDF. The topics addressed in these templates are Machinery Vehicles, Interest Taxes. All the content presented in this PPT design is completely editable. Download it and make adjustments in color, background, font etc. as per your unique business setting.
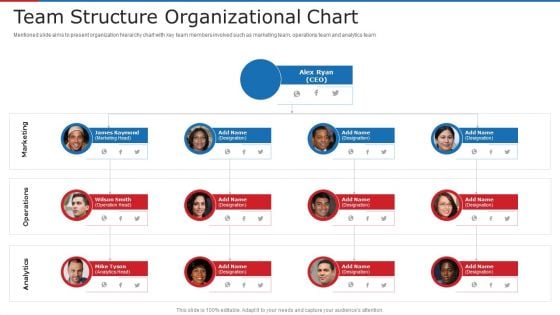
Team Structure Organizational Chart Ppt Infographics Example Introduction PDF
Mentioned slide aims to present organization hierarchy chart with key team members involved such as marketing team, operations team and analytics team. This is a team structure organizational chart ppt infographics example introduction pdf template with various stages. Focus and dispense information on four stages using this creative set, that comes with editable features. It contains large content boxes to add your information on topics like team structure organizational chart. You can also showcase facts, figures, and other relevant content using this PPT layout. Grab it now.
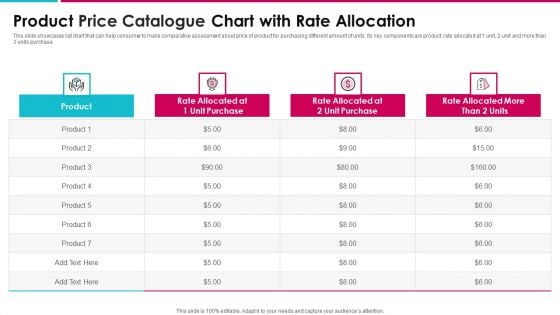
Product Price Catalogue Chart With Rate Allocation Infographics PDF
This slide showcases list chart that can help consumer to make comparative assessment about price of product for purchasing different amount of units. Its key components are product, rate allocated at 1 unit, 2 unit and more than 3 units purchase Pitch your topic with ease and precision using this product price catalogue chart with rate allocation infographics pdf. This layout presents information on product price catalogue chart with rate allocation. It is also available for immediate download and adjustment. So, changes can be made in the color, design, graphics or any other component to create a unique layout.
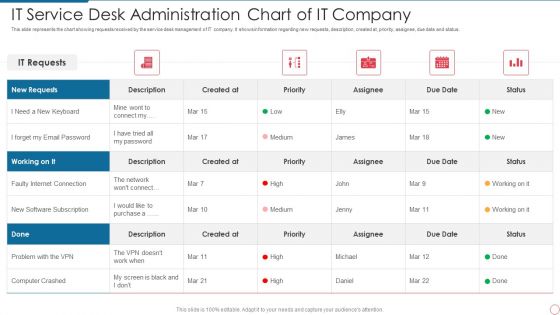
IT Service Desk Administration Chart Of IT Company Infographics PDF
This slide represents the chart showing requests received by the service desk management of IT company. It shows information regarding new requests, description, created at, priority, assignee, due date and status. Showcasing this set of slides titled IT Service Desk Administration Chart Of IT Company Infographics PDF. The topics addressed in these templates are It Service Desk Administration Chart Of It Company. All the content presented in this PPT design is completely editable. Download it and make adjustments in color, background, font etc. as per your unique business setting.
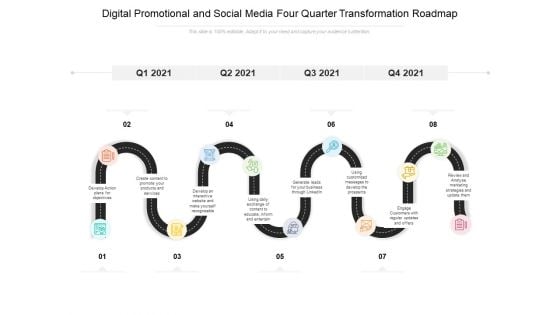
Digital Promotional And Social Media Four Quarter Transformation Roadmap Infographics
Utilize our pre build digital promotional and social media four quarter transformation roadmap infographics to present your plan of action in the most effective way. Reduce the paperwork and showcase how different activities are linked to each other by incorporating this attention grabbing PowerPoint theme. This completely editable roadmap PPT layout is suitable to fit all your needs and to have a structured outline of the entire process flow using color coding. Provide guidelines to your teammates about the progression process by employing our PPT theme. Team members can easily be designated into teams by accessing the work milestones to be accomplished within the timeframe. You can easily modify the PowerPoint slide according to real time situations. Download our stunning digital promotional and social media four quarter transformation roadmap infographics, and you are good to go to prove your expertise in strategic planning.
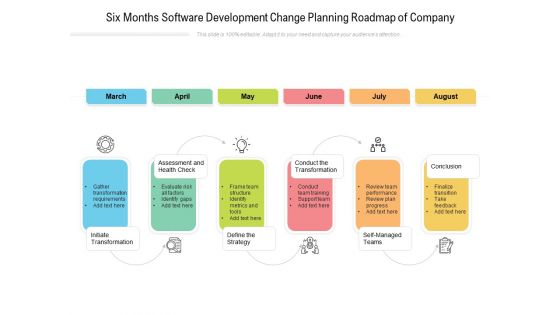
Six Months Software Development Change Planning Roadmap Of Company Infographics
Utilize our pre build six months software development change planning roadmap of company infographics to present your plan of action in the most effective way. Reduce the paperwork and showcase how different activities are linked to each other by incorporating this attention grabbing PowerPoint theme. This completely editable roadmap PPT layout is suitable to fit all your needs and to have a structured outline of the entire process flow using color coding. Provide guidelines to your teammates about the progression process by employing our PPT theme. Team members can easily be designated into teams by accessing the work milestones to be accomplished within the timeframe. You can easily modify the PowerPoint slide according to real time situations. Download our stunning six months software development change planning roadmap of company infographics, and you are good to go to prove your expertise in strategic planning.
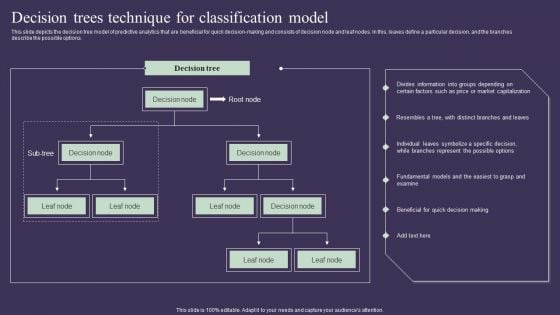
Projection Model Decision Trees Technique For Classification Model Infographics PDF
This slide depicts the decision tree model of predictive analytics that are beneficial for quick decision-making and consists of decision node and leaf nodes. In this, leaves define a particular decision, and the branches describe the possible options. If you are looking for a format to display your unique thoughts, then the professionally designed Projection Model Decision Trees Technique For Classification Model Infographics PDF is the one for you. You can use it as a Google Slides template or a PowerPoint template. Incorporate impressive visuals, symbols, images, and other charts. Modify or reorganize the text boxes as you desire. Experiment with shade schemes and font pairings. Alter, share or cooperate with other people on your work. Download Projection Model Decision Trees Technique For Classification Model Infographics PDF and find out how to give a successful presentation. Present a perfect display to your team and make your presentation unforgettable.
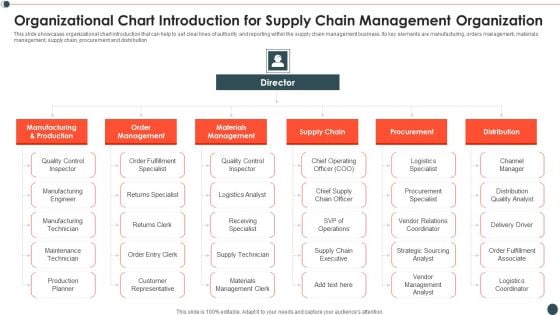
Organizational Chart Introduction For Supply Chain Management Organization Infographics PDF
This slide showcases organizational chart introduction that can help to set clear lines of authority and reporting within the supply chain management business. Its key elements are manufacturing, orders management, materials management, supply chain, procurement and distribution.Showcasing this set of slides titled Organizational Chart Introduction For Supply Chain Management Organization Infographics PDF The topics addressed in these templates are Manufacturing Production, Order Management, Materials Management All the content presented in this PPT design is completely editable. Download it and make adjustments in color, background, font etc. as per your unique business setting.
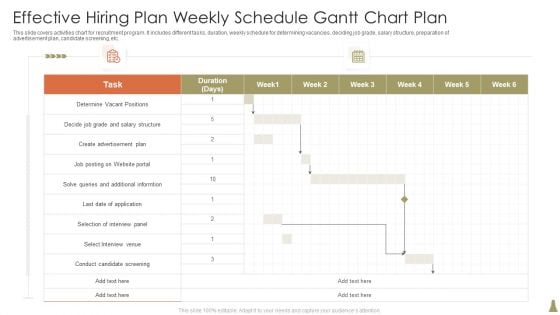
Effective Hiring Plan Weekly Schedule Gantt Chart Plan Infographics PDF
This slide covers activities chart for recruitment program. It includes different tasks, duration, weekly schedule for determining vacancies, deciding job grade, salary structure, preparation of advertisement plan, candidate screening, etc. Pitch your topic with ease and precision using this Effective Hiring Plan Weekly Schedule Gantt Chart Plan Infographics PDF. This layout presents information on Determine, Advertisement Plan, Informtion. It is also available for immediate download and adjustment. So, changes can be made in the color, design, graphics or any other component to create a unique layout.
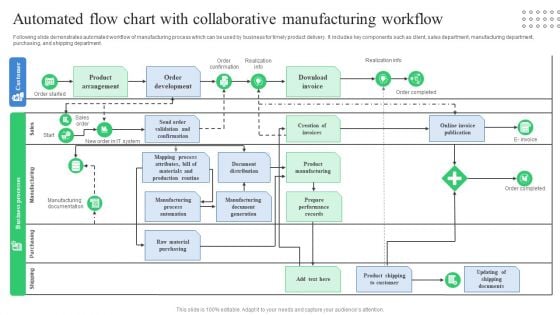
Automated Flow Chart With Collaborative Manufacturing Workflow Infographics PDF
Following slide demonstrates automated workflow of manufacturing process which can be used by business for timely product delivery. It includes key components such as client, sales department, manufacturing department, purchasing, and shipping department. Showcasing this set of slides titled Automated Flow Chart With Collaborative Manufacturing Workflow Infographics PDF. The topics addressed in these templates are Product Arrangement, Order Development, Download Invoice. All the content presented in this PPT design is completely editable. Download it and make adjustments in color, background, font etc. as per your unique business setting.
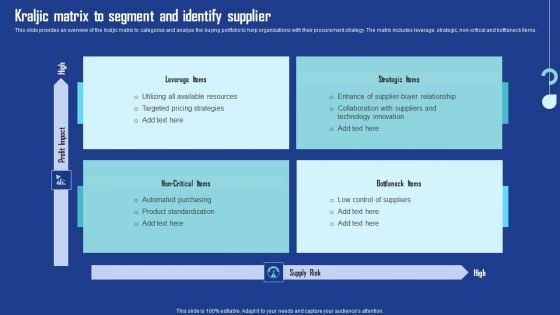
Kraljic Matrix To Segment And Identify Supplier Infographics PDF
This slide provides an overview of the kraljic matrix to categorize and analyze the buying portfolio to help organizations with their procurement strategy. The matrix includes leverage, strategic, non-critical and bottleneck items. This Kraljic Matrix To Segment And Identify Supplier Infographics PDF is perfect for any presentation, be it in front of clients or colleagues. It is a versatile and stylish solution for organizing your meetings. The Kraljic Matrix To Segment And Identify Supplier Infographics PDF features a modern design for your presentation meetings. The adjustable and customizable slides provide unlimited possibilities for acing up your presentation. Slidegeeks has done all the homework before launching the product for you. So, do not wait, grab the presentation templates today
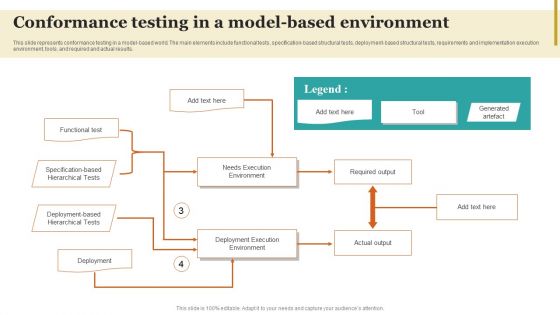
Conformance Testing In A Model Based Environment Infographics PDF
This slide represents conformance testing in a model-based world. The main elements include functional tests, specification-based structural tests, deployment-based structural tests, requirements and implementation execution environment, tools, and required and actual results. Formulating a presentation can take up a lot of effort and time, so the content and message should always be the primary focus. The visuals of the PowerPoint can enhance the presenters message, so our Conformance Testing In A Model Based Environment Infographics PDF was created to help save time. Instead of worrying about the design, the presenter can concentrate on the message while our designers work on creating the ideal templates for whatever situation is needed. Slidegeeks has experts for everything from amazing designs to valuable content, we have put everything into Conformance Testing In A Model Based Environment Infographics PDF.
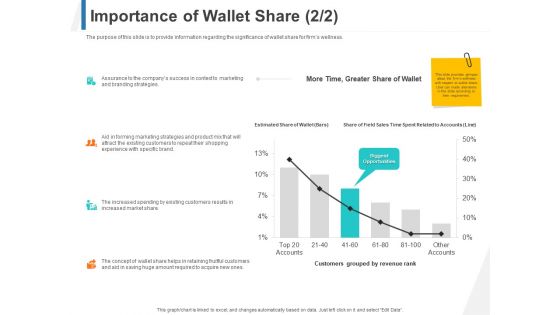
Importance Of Wallet Share Time Ppt Infographics File Formats PDF
The purpose of this slide is to provide information regarding the significance of wallet share for firms wellness. Deliver an awe-inspiring pitch with this creative importance of wallet share time ppt infographics file formats pdf bundle. Topics like branding strategies, forming marketing, strategies, product mix, increased market share can be discussed with this completely editable template. It is available for immediate download depending on the needs and requirements of the user.
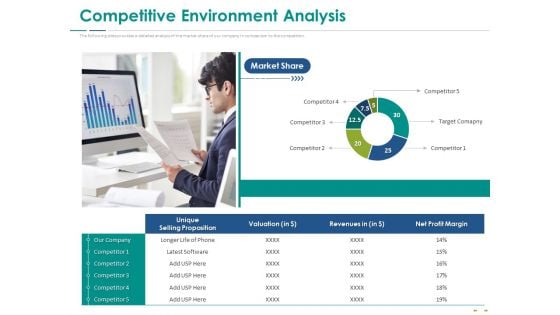
Stock Market Research Report Competitive Environment Analysis Infographics PDF
The following slide provides a detailed analysis of the market share of our company in comparison to the competition. Deliver an awe-inspiring pitch with this creative stock market research report competitive environment analysis infographics pdf bundle. Topics like market share, unique selling proposition, valuation, revenues, net profit margin can be discussed with this completely editable template. It is available for immediate download depending on the needs and requirements of the user.
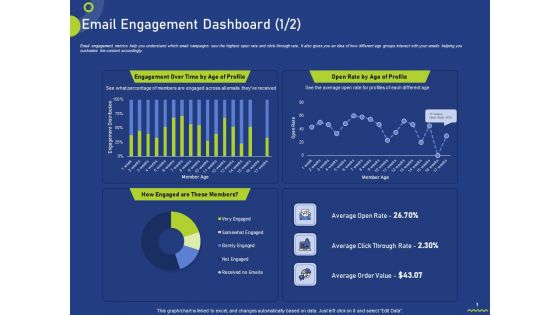
Email Engagement Dashboard Profile Ppt Infographics Images PDF
Email engagement metrics help you understand which email campaigns saw the highest open rate and click-through rate. It also gives you an idea of how different age groups interact with your emails helping you customize the content accordingly. Deliver an awe-inspiring pitch with this creative email engagement dashboard profile ppt infographics images pdf bundle. Topics like email engagement dashboard can be discussed with this completely editable template. It is available for immediate download depending on the needs and requirements of the user.
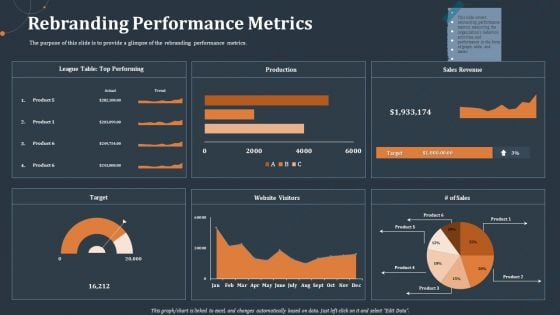
Rebranding Performance Metrics Ppt PowerPoint Presentation Infographics Layout PDF
The purpose of this slide is to provide a glimpse of the rebranding performance metrics.Deliver an awe inspiring pitch with this creative rebranding performance metrics ppt powerpoint presentation infographics layout pdf bundle. Topics like league table top performing, production, sales revenue, website visitors, target can be discussed with this completely editable template. It is available for immediate download depending on the needs and requirements of the user.
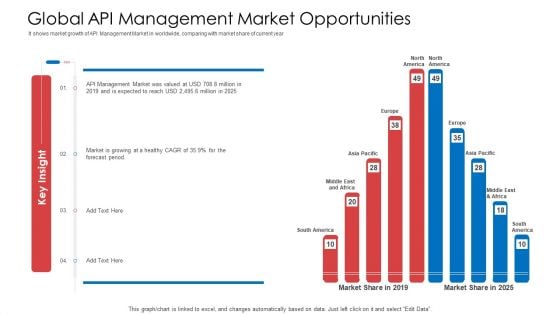
API Administration Solution Global API Management Market Opportunities Infographics PDF
It shows market growth of API Management Market in worldwide, comparing with market share of current year. Deliver an awe inspiring pitch with this creative api administration solution global api management market opportunities infographics pdf bundle. Topics like global api management market opportunities can be discussed with this completely editable template. It is available for immediate download depending on the needs and requirements of the user.
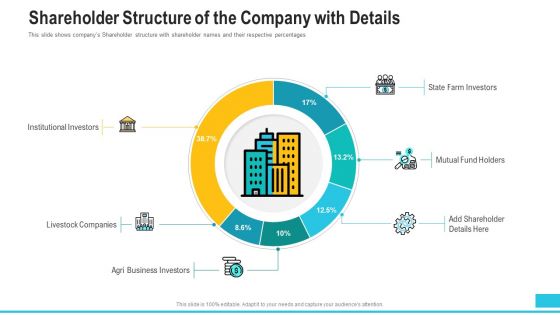
Shareholder Structure Of The Company With Details Infographics PDF
This slide shows companys Shareholder structure with shareholder names and their respective percentages. Deliver an awe inspiring pitch with this creative shareholder structure of the company with details infographics pdf bundle. Topics like institutional investors, livestock companies, state farm investors, mutual fund holders, agri business investors can be discussed with this completely editable template. It is available for immediate download depending on the needs and requirements of the user.
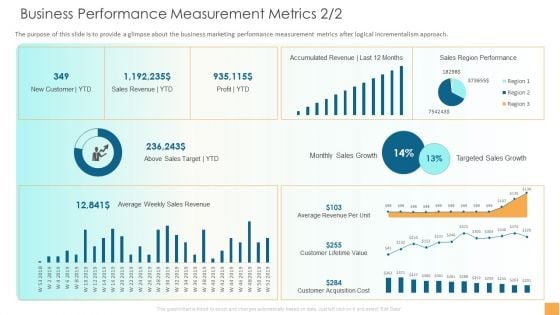
Analytical Incrementalism Business Performance Measurement Metrics Sales Infographics PDF
The purpose of this slide is to provide a glimpse about the business marketing performance measurement metrics after logical incrementalism approach. Deliver an awe-inspiring pitch with this creative analytical incrementalism business performance measurement metrics sales infographics pdf bundle. Topics like gross profit margin, revenue, quick ratio can be discussed with this completely editable template. It is available for immediate download depending on the needs and requirements of the user.
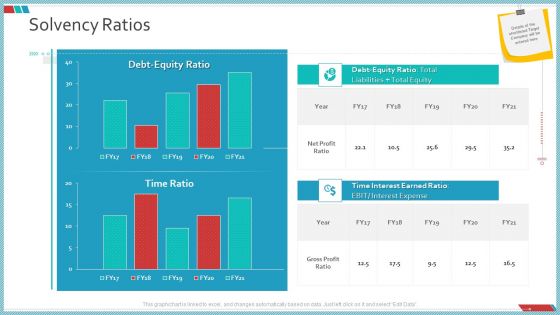
Enterprise Action Plan For Growth Solvency Ratios Infographics PDF
Deliver and pitch your topic in the best possible manner with this enterprise action plan for growth solvency ratios infographics pdf. Use them to share invaluable insights on debt equity ratio total liabilities total equity, time interest earned ratio ebit or interest expense, debt equity ratio and impress your audience. This template can be altered and modified as per your expectations. So, grab it now.
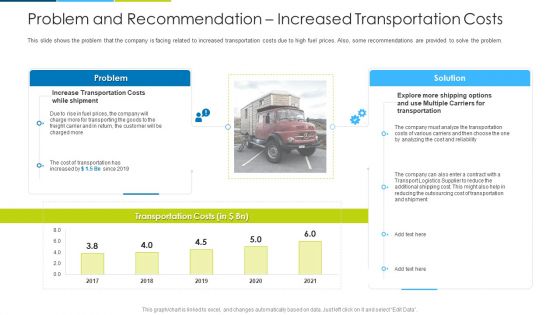
Problem And Recommendation Increased Transportation Costs Ppt Infographics Templates PDF
This slide shows the problem that the company is facing related to increased transportation costs due to high fuel prices. Also, some recommendations are provided to solve the problem. Deliver and pitch your topic in the best possible manner with this problem and recommendation increased transportation costs ppt infographics templates pdf. Use them to share invaluable insights on problem, solution, transportation costs and impress your audience. This template can be altered and modified as per your expectations. So, grab it now.
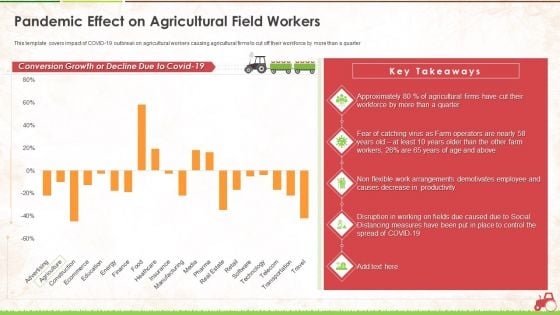
Pandemic Effect On Agricultural Field Workers Ppt Infographics Information PDF
This template covers impact of COVID-19 outbreak on agricultural workers causing agricultural firms to cut off their workforce by more than a quarter. Deliver an awe-inspiring pitch with this creative pandemic effect on agricultural field workers ppt infographics information pdf. bundle. Topics like pandemic effect on agricultural field workers can be discussed with this completely editable template. It is available for immediate download depending on the needs and requirements of the user.
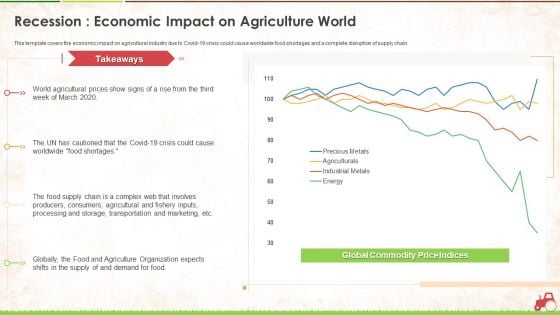
Recession Economic Impact On Agriculture World Ppt Infographics Structure PDF
This template covers the economic impact on agricultural industry due to Covid 19 crisis could cause worldwide food shortages and a complete disruption of supply chain. Deliver an awe-inspiring pitch with this creative recession economic impact on agriculture world ppt infographics structure pdf. bundle. Topics like marketing, processing, supply, agriculture organization, prices can be discussed with this completely editable template. It is available for immediate download depending on the needs and requirements of the user.
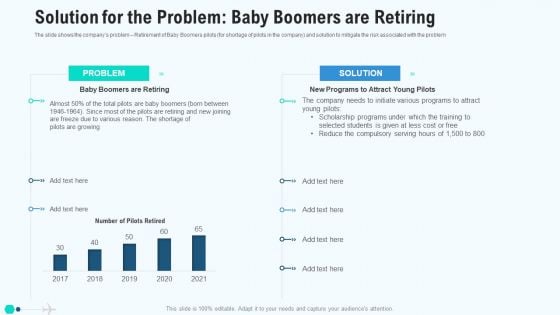
Solution For The Problem Baby Boomers Are Retiring Infographics PDF
The slide shows the companys problem Retirement of Baby Boomers pilots for shortage of pilots in the company and solution to mitigate the risk associated with the problem. Deliver an awe inspiring pitch with this creative solution for the problem baby boomers are retiring infographics pdf bundle. Topics like problem, solution can be discussed with this completely editable template. It is available for immediate download depending on the needs and requirements of the user.
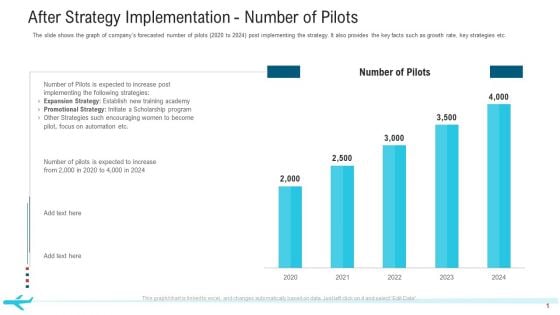
After Strategy Implementation Number Of Pilots Infographics PDF
The slide shows the graph of companys forecasted number of pilots 2020 to 2024 post implementing the strategy. It also provides the key facts such as growth rate, key strategies etc. Deliver an awe-inspiring pitch with this creative after strategy implementation number of pilots infographics pdf. bundle. Topics like after strategy implementation number of pilots. 2020 to 2024 can be discussed with this completely editable template. It is available for immediate download depending on the needs and requirements of the user.
Enterprise System Business Administration Asset Tracking Dashboard Infographics PDF
This slide covers the asset tracking dashboard wherein terminal, object type, work type, number of breakdown, stoppages, etc. are tracked. Deliver and pitch your topic in the best possible manner with this enterprise system business administration asset tracking dashboard infographics pdf. Use them to share invaluable insights on asset tracking dashboard and impress your audience. This template can be altered and modified as per your expectations. So, grab it now.
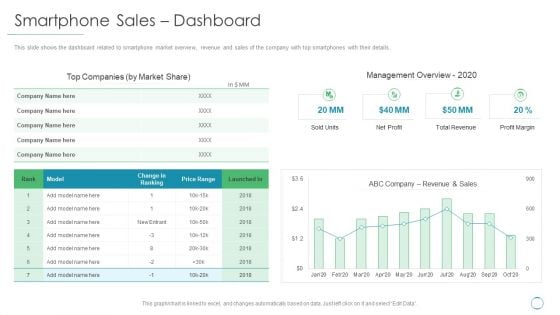
Smartphone Sales Dashboard Ppt Infographics Graphic Tips PDF
This slide shows the dashboard related to smartphone market overview, revenue and sales of the company with top smartphones with their details. Deliver an awe inspiring pitch with this creative smartphone sales dashboard ppt infographics graphic tips pdf bundle. Topics like management overview, profit margin, total revenue, net profit can be discussed with this completely editable template. It is available for immediate download depending on the needs and requirements of the user.
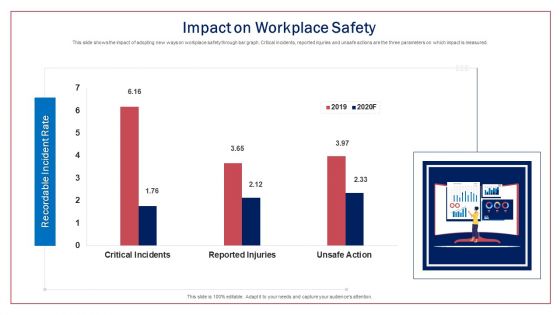
Impact On Workplace Safety Ppt Slides Infographics PDF
This slide shows the impact of adopting new ways on workplace safety through bar graph. Critical incidents, reported injuries and unsafe actions are the three parameters on which impact is measured. Deliver an awe-inspiring pitch with this creative impact on workplace safety ppt slides infographics pdf. bundle. Topics like recordable incident rate can be discussed with this completely editable template. It is available for immediate download depending on the needs and requirements of the user.
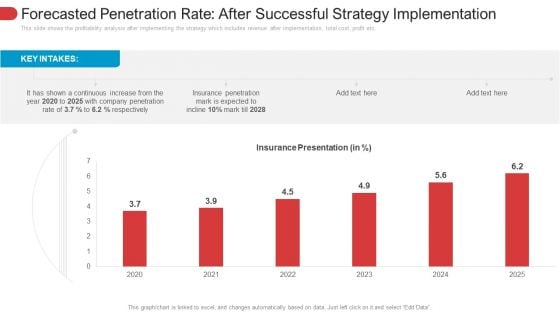
Forecasted Penetration Rate After Successful Strategy Implementation Infographics PDF
This slide shows the profitability analysis after implementing the strategy which includes revenue after implementation, total cost, profit etc. Deliver and pitch your topic in the best possible manner with this forecasted penetration rate after successful strategy implementation infographics pdf. Use them to share invaluable insights on forecasted penetration rate after successful strategy implementation and impress your audience. This template can be altered and modified as per your expectations. So, grab it now.
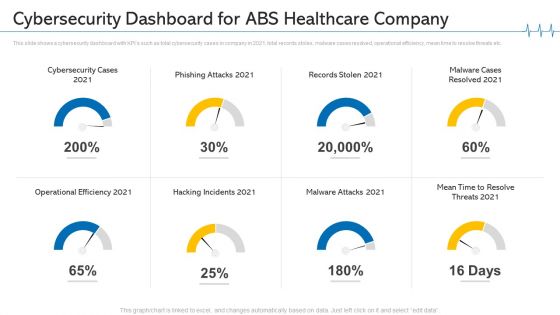
Cybersecurity Dashboard For ABS Healthcare Company Ppt Infographics Picture PDF
This slide shows a cybersecurity dashboard with KPIs such as total cybersecurity cases in company in 2021, total records stoles, malware cases resolved, operational efficiency, mean time to resolve threats etc. Deliver an awe inspiring pitch with this creative cybersecurity dashboard for ABS healthcare company ppt infographics picture pdf bundle. Topics like cybersecurity dashboard for ABS healthcare company can be discussed with this completely editable template. It is available for immediate download depending on the needs and requirements of the user.
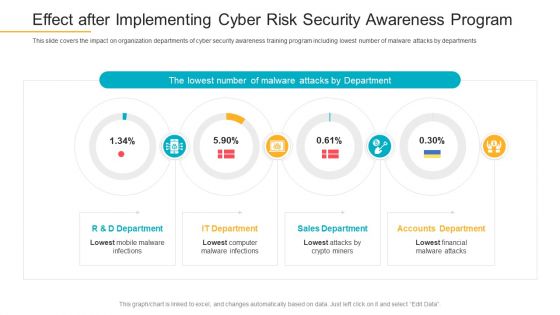
Effect After Implementing Cyber Risk Security Awareness Program Infographics PDF
This slide covers the impact on organization departments of cyber security awareness training program including lowest number of malware attacks by departments. Deliver an awe-inspiring pitch with this creative effect after implementing cyber risk security awareness program infographics pdf bundle. Topics like sales department, accounts department, it department can be discussed with this completely editable template. It is available for immediate download depending on the needs and requirements of the user.
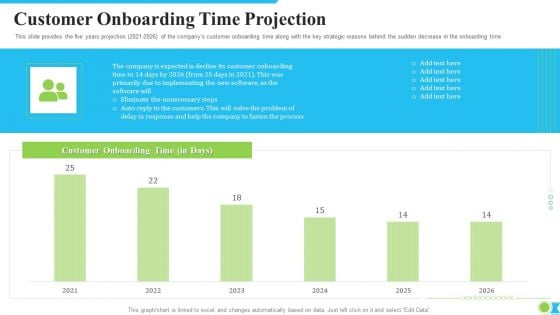
Customer Onboarding Time Projection Ppt Infographics File Formats PDF
This slide provides the five years projection 2021 2026 of the companys customer onboarding time along with the key strategic reasons behind the sudden decrease in the onboarding time. Deliver and pitch your topic in the best possible manner with this customer onboarding time projection ppt infographics file formats pdf. Use them to share invaluable insights on customer onboarding time projection and impress your audience. This template can be altered and modified as per your expectations. So, grab it now.
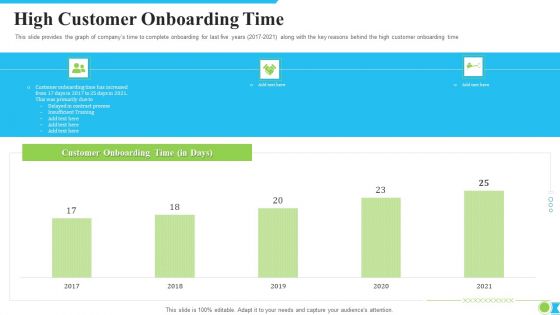
High Customer Onboarding Time Ppt Infographics Format Ideas PDF
This slide provides the graph of companys time to complete onboarding for last five years 2017 2021 along with the key reasons behind the high customer onboarding time. Deliver and pitch your topic in the best possible manner with this high customer onboarding time ppt infographics format ideas pdf. Use them to share invaluable insights on high customer onboarding time and impress your audience. This template can be altered and modified as per your expectations. So, grab it now.
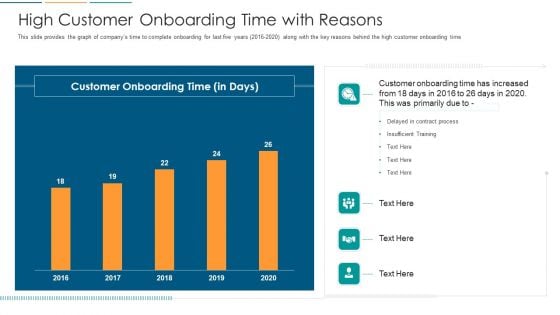
High Customer Onboarding Time With Reasons Ppt Infographics Format PDF
This slide provides the graph of companys time to complete onboarding for last five years 2016 2020 along with the key reasons behind the high customer onboarding time. Deliver an awe-inspiring pitch with this creative high customer onboarding time with reasons ppt infographics format pdf. bundle. Topics like high customer onboarding time with reasons can be discussed with this completely editable template. It is available for immediate download depending on the needs and requirements of the user.
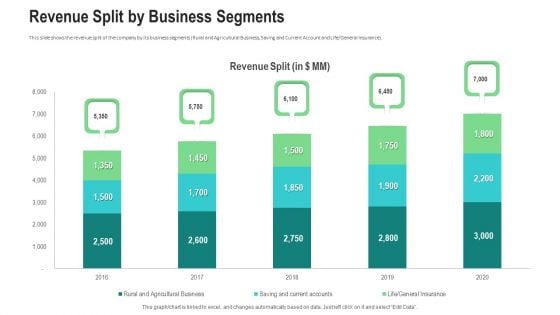
Revenue Split By Business Segments Ppt Infographics Professional PDF
This slide shows the revenue split of the company by its business segments Rural and Agricultural Business, Saving and Current Account and Life or General Insurance. Deliver an awe-inspiring pitch with this creative revenue split by business segments ppt infographics professional pdf bundle. Topics like revenue, business segments, rural and agricultural business, saving and current account, general insurance can be discussed with this completely editable template. It is available for immediate download depending on the needs and requirements of the user.
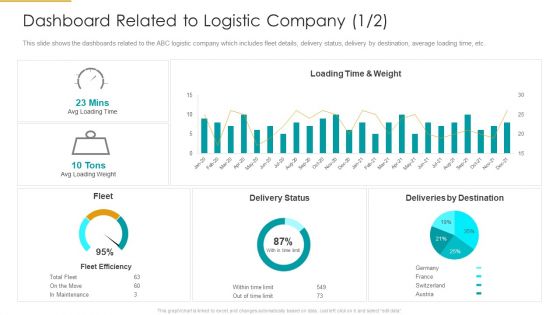
Dashboard Related To Logistic Company Loading Infographics PDF
This slide shows the dashboards related to the ABC logistic company which includes fleet details, delivery status, delivery by destination, average loading time, etc. Deliver and pitch your topic in the best possible manner with this dashboard related to logistic company loading infographics pdf. Use them to share invaluable insights on dashboard related to logistic company and impress your audience. This template can be altered and modified as per your expectations. So, grab it now.
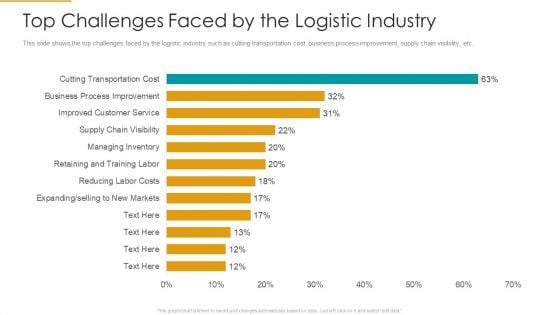
Top Challenges Faced By The Logistic Industry Infographics PDF
This slide shows the top challenges faced by the logistic industry such as cutting transportation cost, business process improvement, supply chain visibility, etc. Deliver and pitch your topic in the best possible manner with this top challenges faced by the logistic industry infographics pdf. Use them to share invaluable insights on top challenges faced by the logistic industry and impress your audience. This template can be altered and modified as per your expectations. So, grab it now.
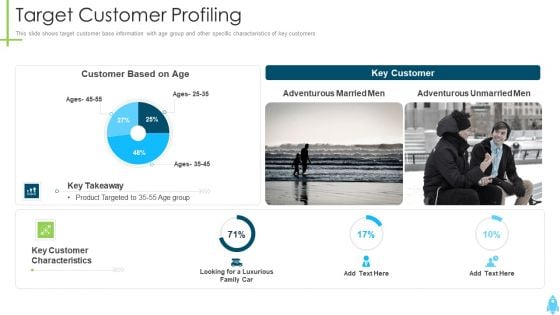
Product Kick Off Strategy Target Customer Profiling Infographics PDF
This slide shows target customer base information with age group and other specific characteristics of key customers. Deliver and pitch your topic in the best possible manner with this product kick off strategy target customer profiling infographics pdf. Use them to share invaluable insights on target customer profiling and impress your audience. This template can be altered and modified as per your expectations. So, grab it now.
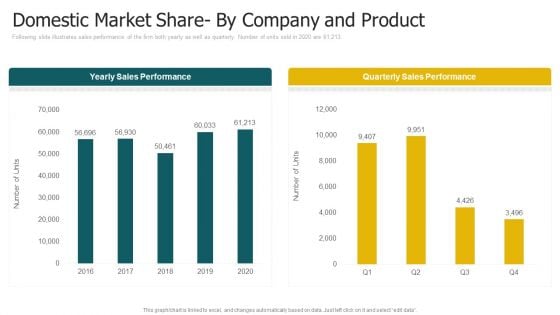
Domestic Market Share By Company And Product Sales Infographics PDF
This slide shows the domestic market share by company as well as by product. Product 2 is the most selling among other products with a share of 34 percentage. Deliver an awe inspiring pitch with this creative domestic market share by company and product sales infographics pdf bundle. Topics like domestic market share by company and product can be discussed with this completely editable template. It is available for immediate download depending on the needs and requirements of the user.
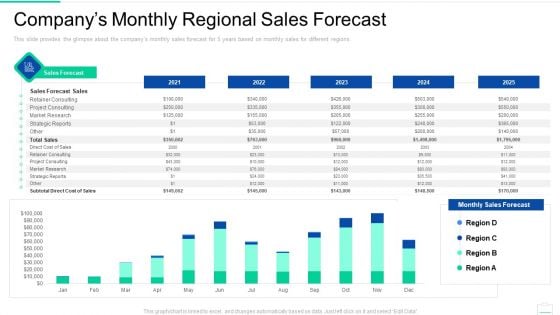
Market Area Analysis Companys Monthly Regional Sales Forecast Infographics PDF
This slide provides the glimpse about the companys monthly sales forecast for 5 years based on monthly sales for different regions.Deliver and pitch your topic in the best possible manner with this market area analysis companys monthly regional sales forecast infographics pdf. Use them to share invaluable insights on retainer consulting, market research, strategic reports and impress your audience. This template can be altered and modified as per your expectations. So, grab it now.

Meet The CEO Of Our Company Ppt Infographics Slideshow PDF
This slide provides the glimpse about the CEO of our company along with his education qualifications and skill set and image. Deliver and pitch your topic in the best possible manner with this meet the ceo of our company ppt infographics slideshow pdf. Use them to share invaluable insights on meet the ceo of our company and impress your audience. This template can be altered and modified as per your expectations. So, grab it now.

Current Construction Planning And Scheduling Efficiency Status Infographics PDF
This slide shows the current Construction Planning and Scheduling Efficiency Status in the company in terms of efficient and inefficient percentages Deliver an awe inspiring pitch with this creative current construction planning and scheduling efficiency status infographics pdf bundle. Topics like efficient, inefficient, documentation and inaccurate can be discussed with this completely editable template. It is available for immediate download depending on the needs and requirements of the user.

Regional Marketing Strategies Regional Sales Performance Metrics Dashboard Infographics PDF
This slide provides the glimpse about the sales performance metrics which focuses on regional sales based on customer demands and sales team performance. Deliver and pitch your topic in the best possible manner with this regional marketing strategies regional sales performance metrics dashboard infographics pdf. Use them to share invaluable insights on regional sales performance metrics dashboard and impress your audience. This template can be altered and modified as per your expectations. So, grab it now.
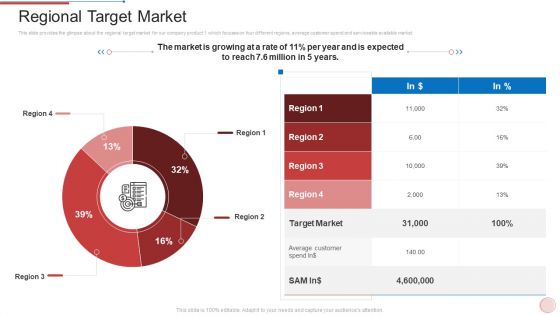
Regional Marketing Strategies Regional Target Market Infographics PDF
This slide provides the glimpse about the regional target market for our company product 1 which focuses on four different regions, average customer spend and serviceable available market. Deliver an awe inspiring pitch with this creative regional marketing strategies regional target market infographics pdf bundle. Topics like average, target market can be discussed with this completely editable template. It is available for immediate download depending on the needs and requirements of the user.
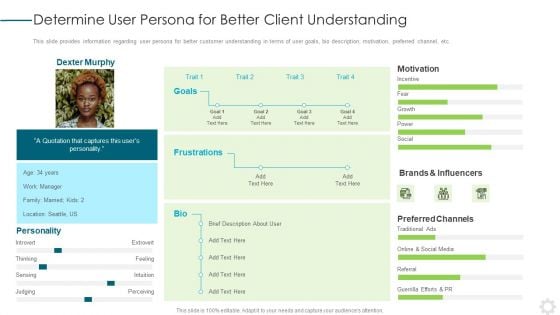
Determine User Persona For Better Client Understanding Infographics PDF
This slide provides information regarding user persona for better customer understanding in terms of user goals, bio description, motivation, preferred channel, etc.Deliver and pitch your topic in the best possible manner with this determine user persona for better client understanding infographics pdf. Use them to share invaluable insights on determine user persona for better client understanding and impress your audience. This template can be altered and modified as per your expectations. So, grab it now.
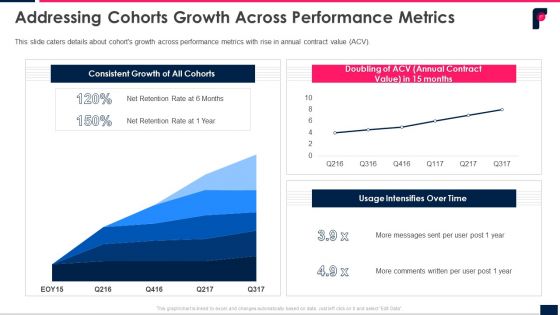
Addressing Cohorts Growth Across Performance Metrics Ppt Model Infographics PDF
This slide caters details about cohorts growth across performance metrics with rise in annual contract value ACV. Deliver and pitch your topic in the best possible manner with this addressing cohorts growth across performance metrics ppt model infographics pdf. Use them to share invaluable insights on addressing cohorts growth across performance metrics and impress your audience. This template can be altered and modified as per your expectations. So, grab it now.
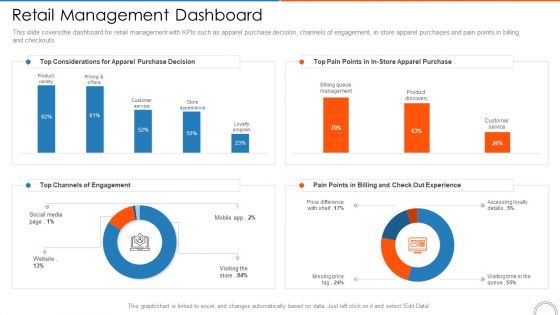
Retail Management Dashboard Retail Store Positioning Ppt Slides Infographics PDF
This slide covers the dashboard for retail management with KPIs such as apparel purchase decision, channels of engagement, in store apparel purchases and pain points in billing and checkouts. Deliver an awe inspiring pitch with this creative retail management dashboard retail store positioning ppt slides infographics pdf bundle. Topics like retail management dashboard can be discussed with this completely editable template. It is available for immediate download depending on the needs and requirements of the user.
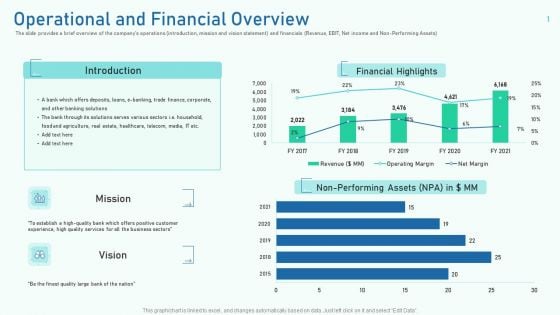
Operational And Financial Overview Ppt Infographics Designs Download PDF
The slide provides a brief overview of the companys operations introduction, mission and vision statement and financials Revenue, EBIT, Net income and Non Performing Assets.Deliver an awe-inspiring pitch with this creative operational and financial overview ppt infographics designs download pdf. bundle. Topics like financial highlights, 2017 to 2021 can be discussed with this completely editable template. It is available for immediate download depending on the needs and requirements of the user.
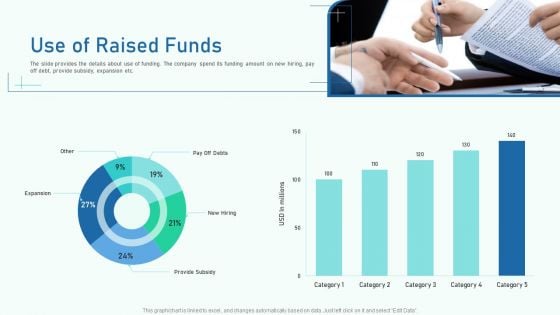
Use Of Raised Funds Ppt Infographics Graphic Images PDF
The slide provides the details about use of funding. The company spend its funding amount on new hiring, pay off debt, provide subsidy, expansion etc.Deliver an awe-inspiring pitch with this creative use of raised funds ppt infographics graphic images pdf. bundle. Topics like use of raised funds can be discussed with this completely editable template. It is available for immediate download depending on the needs and requirements of the user.
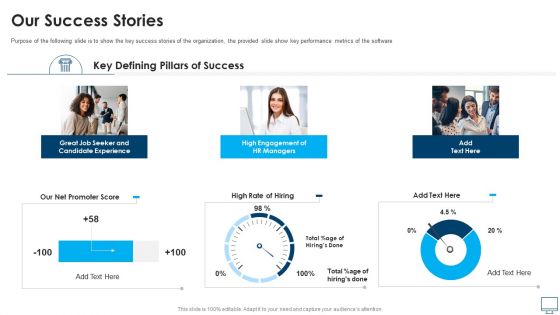
Recruitment Sector Capital Raising Elevator Our Success Stories Infographics PDF
Purpose of the following slide is to show the key success stories of the organization, the provided slide show key performance metrics of the software Deliver an awe inspiring pitch with this creative recruitment sector capital raising elevator our success stories infographics pdf bundle. Topics like candidate experience, high engagement, high rate of hiring can be discussed with this completely editable template. It is available for immediate download depending on the needs and requirements of the user.
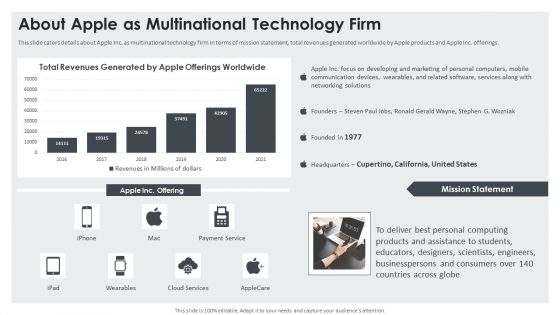
About Apple As Multinational Technology Firm Infographics PDF
This slide caters details about Apple Inc. as multinational technology firm in terms of mission statement, total revenues generated worldwide by Apple products and Apple Inc. offerings. Deliver an awe inspiring pitch with this creative about apple as multinational technology firm infographics pdf bundle. Topics like revenues, offerings, mission can be discussed with this completely editable template. It is available for immediate download depending on the needs and requirements of the user.
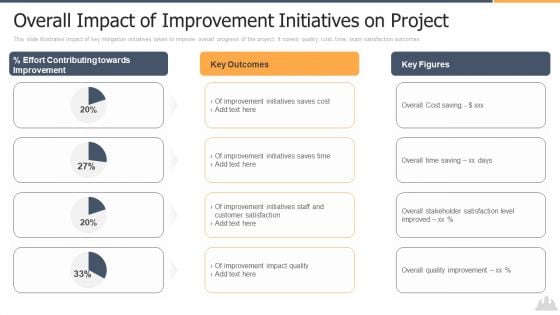
Overall Impact Of Improvement Initiatives On Project Infographics PDF
This slide illustrates impact of key mitigation initiatives taken to improve overall progress of the project. It covers quality, cost, time, team satisfaction outcomes. Deliver and pitch your topic in the best possible manner with this overall impact of improvement initiatives on project infographics pdf. Use them to share invaluable insights on improvement, initiatives, cost and impress your audience. This template can be altered and modified as per your expectations. So, grab it now.

Target Group Of Customers Hotel Investment Pitch Deck Infographics PDF
Mentioned slide depicts the key statistics about target customers group covering details about gender, age, average spend per customer and customer interests. Deliver an awe inspiring pitch with this creative target group of customers hotel investment pitch deck infographics pdf bundle. Topics like average, target customers can be discussed with this completely editable template. It is available for immediate download depending on the needs and requirements of the user.


 Continue with Email

 Home
Home


