Infographic Icons
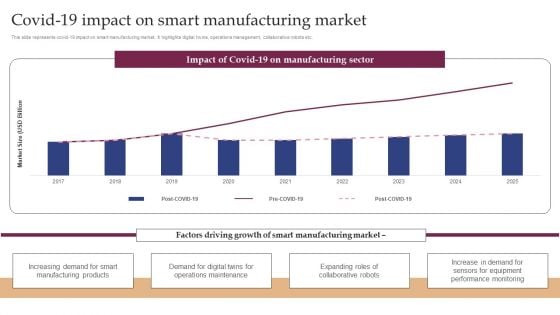
Implementing Smart Manufacturing Technology To Increase Productivity Covid 19 Impact On Smart Manufacturing Market Infographics PDF
This slide represents covid-19 impact on smart manufacturing market. It highlights digital twins, operations management, collaborative robots etc. Get a simple yet stunning designed Implementing Smart Manufacturing Technology To Increase Productivity Covid 19 Impact On Smart Manufacturing Market Infographics PDF. It is the best one to establish the tone in your meetings. It is an excellent way to make your presentations highly effective. So, download this PPT today from Slidegeeks and see the positive impacts. Our easy-to-edit Implementing Smart Manufacturing Technology To Increase Productivity Covid 19 Impact On Smart Manufacturing Market Infographics PDF can be your go-to option for all upcoming conferences and meetings. So, what are you waiting for. Grab this template today.
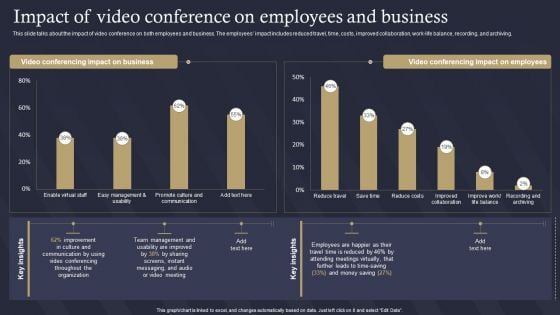
Role Of IT In Business Communication Impact Of Video Conference On Employees And Business Infographics PDF
This slide talks about the impact of video conference on both employees and business. The employees impact includes reduced travel, time, costs, improved collaboration, work-life balance, recording, and archiving. Crafting an eye-catching presentation has never been more straightforward. Let your presentation shine with this tasteful yet straightforward Role Of IT In Business Communication Impact Of Video Conference On Employees And Business Infographics PDF template. It offers a minimalistic and classy look that is great for making a statement. The colors have been employed intelligently to add a bit of playfulness while still remaining professional. Construct the ideal Role Of IT In Business Communication Impact Of Video Conference On Employees And Business Infographics PDF that effortlessly grabs the attention of your audience Begin now and be certain to wow your customers.
Brand Positioning Through Successful Content Marketing Dashboard For Effective Tracking Infographics PDF
Purpose of the following slide is to show key metrics that can help the organization to track their content marketing efforts, these metrics are ad cost, visits, cost per click etc. Create an editable Brand Positioning Through Successful Content Marketing Dashboard For Effective Tracking Infographics PDF that communicates your idea and engages your audience. Whether you are presenting a business or an educational presentation, pre designed presentation templates help save time. Brand Positioning Through Successful Content Marketing Dashboard For Effective Tracking Infographics PDF is highly customizable and very easy to edit, covering many different styles from creative to business presentations. Slidegeeks has creative team members who have crafted amazing templates. So, go and get them without any delay.
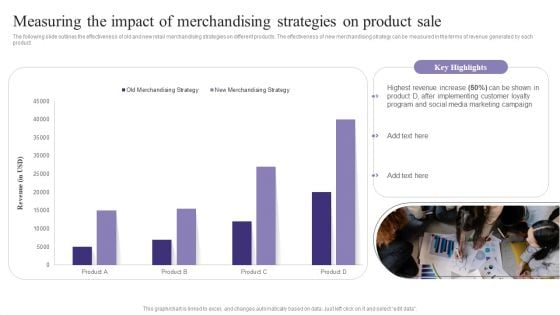
Measuring The Impact Of Merchandising Strategies On Product Sale Infographics PDF
The following slide outlines the effectiveness of old and new retail merchandising strategies on different products. The effectiveness of new merchandising strategy can be measured in the terms of revenue generated by each product. This Measuring The Impact Of Merchandising Strategies On Product Sale Infographics PDF is perfect for any presentation, be it in front of clients or colleagues. It is a versatile and stylish solution for organizing your meetings. The Measuring The Impact Of Merchandising Strategies On Product Sale Infographics PDF features a modern design for your presentation meetings. The adjustable and customizable slides provide unlimited possibilities for acing up your presentation. Slidegeeks has done all the homework before launching the product for you. So, do not wait, grab the presentation templates today.
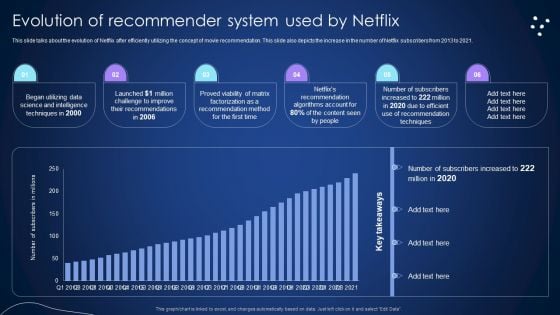
Evolution Of Recommender System Used By Netflix Integrating Recommender System To Enhance Infographics PDF
This slide talks about the evolution of Netflix after efficiently utilizing the concept of movie recommendation. This slide also depicts the increase in the number of Netflix subscribers from 2013 to 2021.Explore a selection of the finest Evolution Of Recommender System Used By Netflix Integrating Recommender System To Enhance Infographics PDF here. With a plethora of professionally designed and pre-made slide templates, you can quickly and easily find the right one for your upcoming presentation. You can use our Evolution Of Recommender System Used By Netflix Integrating Recommender System To Enhance Infographics PDF to effectively convey your message to a wider audience. Slidegeeks has done a lot of research before preparing these presentation templates. The content can be personalized and the slides are highly editable. Grab templates today from Slidegeeks.
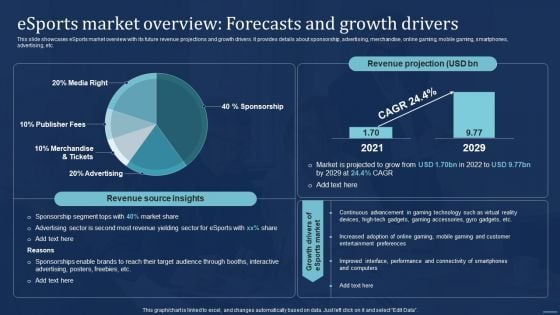
Integrating Sports Marketing Campaign Esports Market Overview Forecasts And Growth Infographics PDF
This slide showcases eSports market overview with its future revenue projections and growth drivers. It provides details about sponsorship, advertising, merchandise, online gaming, mobile gaming, smartphones, advertising, etc. Here you can discover an assortment of the finest PowerPoint and Google Slides templates. With these templates, you can create presentations for a variety of purposes while simultaneously providing your audience with an eye-catching visual experience. Download Integrating Sports Marketing Campaign Esports Market Overview Forecasts And Growth Infographics PDF to deliver an impeccable presentation. These templates will make your job of preparing presentations much quicker, yet still, maintain a high level of quality. Slidegeeks has experienced researchers who prepare these templates and write high-quality content for you. Later on, you can personalize the content by editing the Integrating Sports Marketing Campaign Esports Market Overview Forecasts And Growth Infographics PDF.
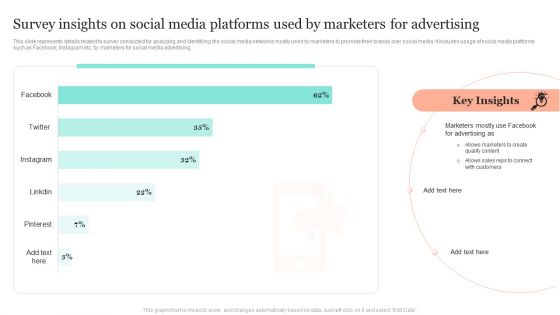
Introduction To Social Media Marketing Survey Insights On Social Media Platforms Used Infographics PDF
This slide represents details related to survey conducted for analyzing and identifying the social media networks mostly used by marketers to promote their brands over social media. It includes usage of social media platforms such as Facebook, Instagram etc. by marketers for social media advertising. Create an editable Introduction To Social Media Marketing Survey Insights On Social Media Platforms Used Infographics PDF that communicates your idea and engages your audience. Whether youre presenting a business or an educational presentation, pre-designed presentation templates help save time. Introduction To Social Media Marketing Survey Insights On Social Media Platforms Used Infographics PDF is highly customizable and very easy to edit, covering many different styles from creative to business presentations. Slidegeeks has creative team members who have crafted amazing templates. So, go and get them without any delay.
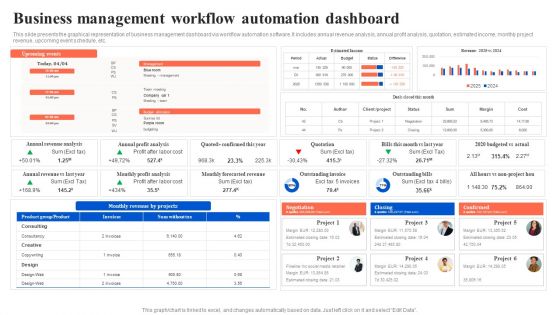
Workflow Automation For Optimizing Organizational Processes Business Management Workflow Infographics PDF
This slide presents the graphical representation of business management dashboard via workflow automation software. It includes annual revenue analysis, annual profit analysis, quotation, estimated income, monthly project revenue, upcoming event schedule, etc. Here you can discover an assortment of the finest PowerPoint and Google Slides templates. With these templates, you can create presentations for a variety of purposes while simultaneously providing your audience with an eye catching visual experience. Download Workflow Automation For Optimizing Organizational Processes Business Management Workflow Infographics PDF to deliver an impeccable presentation. These templates will make your job of preparing presentations much quicker, yet still, maintain a high level of quality. Slidegeeks has experienced researchers who prepare these templates and write high quality content for you. Later on, you can personalize the content by editing the Workflow Automation For Optimizing Organizational Processes Business Management Workflow Infographics PDF.
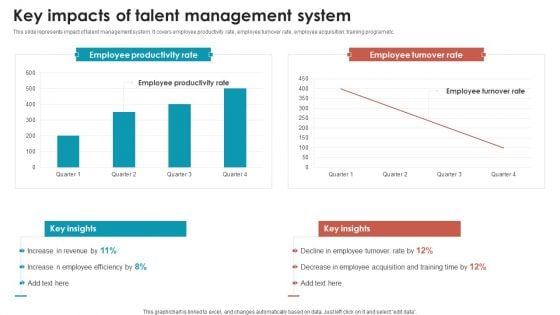
Talent Management Optimization With Workforce Staffing Key Impacts Of Talent Management System Formats PDF Infographics PDF
This slide represents impact of talent management system. It covers employee productivity rate, employee turnover rate, employee acquisition, training program etc. Find highly impressive Talent Management Optimization With Workforce Staffing Key Impacts Of Talent Management System Formats PDF Infographics PDF on Slidegeeks to deliver a meaningful presentation. You can save an ample amount of time using these presentation templates. No need to worry to prepare everything from scratch because Slidegeeks experts have already done a huge research and work for you. You need to download Talent Management Optimization With Workforce Staffing Key Impacts Of Talent Management System Formats PDF Infographics PDF for your upcoming presentation. All the presentation templates are 100 percent editable and you can change the color and personalize the content accordingly. Download now.
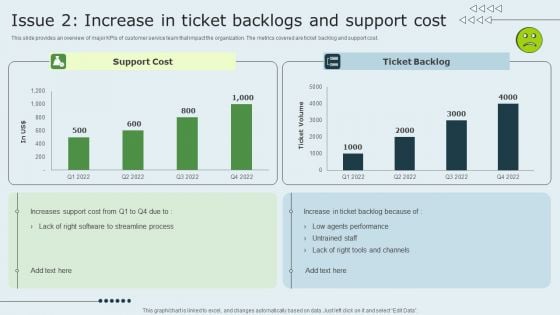
Enhancing Client Experience Issue 2 Increase In Ticket Backlogs And Support Cost Infographics PDF
This slide provides an overview of major KPIs of customer service team that impact the organization. The metrics covered are ticket backlog and support cost. Do you have an important presentation coming up Are you looking for something that will make your presentation stand out from the rest Look no further than Enhancing Client Experience Issue 2 Increase In Ticket Backlogs And Support Cost Infographics PDF. With our professional designs, you can trust that your presentation will pop and make delivering it a smooth process. And with Slidegeeks, you can trust that your presentation will be unique and memorable. So why wait Grab Enhancing Client Experience Issue 2 Increase In Ticket Backlogs And Support Cost Infographics PDF today and make your presentation stand out from the rest.
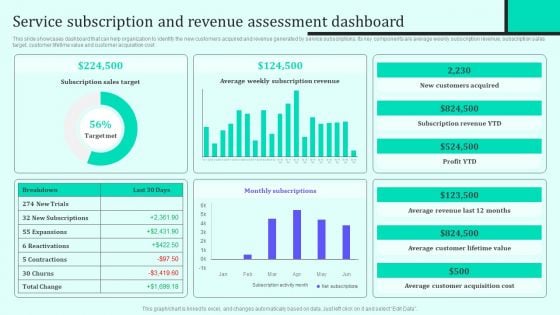
Implementing New Sales And Marketing Process For Services Service Subscription And Revenue Assessment Infographics PDF
This slide showcases dashboard that can help organization to identify the new customers acquired and revenue generated by service subscriptions. Its key components are average weekly subscription revenue, subscription sales target, customer lifetime value and customer acquisition cost. Do you have to make sure that everyone on your team knows about any specific topic I yes, then you should give Implementing New Sales And Marketing Process For Services Service Subscription And Revenue Assessment Infographics PDF a try. Our experts have put a lot of knowledge and effort into creating this impeccable Implementing New Sales And Marketing Process For Services Service Subscription And Revenue Assessment Infographics PDF. You can use this template for your upcoming presentations, as the slides are perfect to represent even the tiniest detail. You can download these templates from the Slidegeeks website and these are easy to edit. So grab these today.
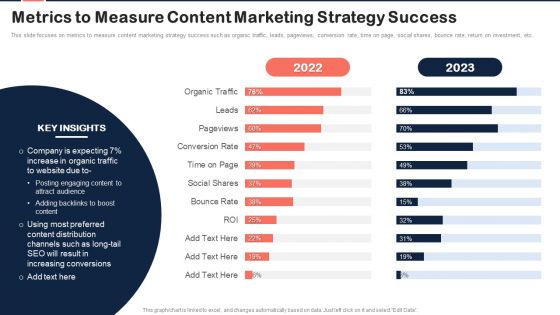
Implementing Content Marketing Plan To Nurture Leads Metrics To Measure Content Marketing Infographics PDF
This slide focuses on metrics to measure content marketing strategy success such as organic traffic, leads, pageviews, conversion rate, time on page, social shares, bounce rate, return on investment, etc. This Implementing Content Marketing Plan To Nurture Leads Metrics To Measure Content Marketing Infographics PDF is perfect for any presentation, be it in front of clients or colleagues. It is a versatile and stylish solution for organizing your meetings. The Implementing Content Marketing Plan To Nurture Leads Metrics To Measure Content Marketing Infographics PDF features a modern design for your presentation meetings. The adjustable and customizable slides provide unlimited possibilities for acing up your presentation. Slidegeeks has done all the homework before launching the product for you. So, do not wait, grab the presentation templates today.

Project Risk Management And Reduction Positive Impact Of Risk Mitigation On Project Infographics PDF
This slide provides an overview of the positive impact of risk mitigation strategies. The slide covers timely completion and reduced project costs. Explore a selection of the finest Project Risk Management And Reduction Positive Impact Of Risk Mitigation On Project Infographics PDF here. With a plethora of professionally designed and pre made slide templates, you can quickly and easily find the right one for your upcoming presentation. You can use our Project Risk Management And Reduction Positive Impact Of Risk Mitigation On Project Infographics PDF to effectively convey your message to a wider audience. Slidegeeks has done a lot of research before preparing these presentation templates. The content can be personalized and the slides are highly editable. Grab templates today from Slidegeeks.
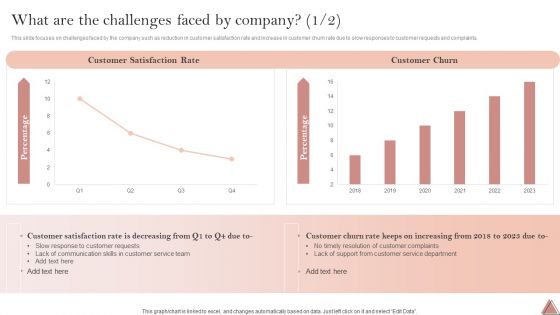
Enhancing Client Engagement What Are The Challenges Faced By Company Infographics PDF
This slide focuses on challenges faced by the company such as reduction in customer satisfaction rate and increase in customer churn rate due to slow responses to customer requests and complaints. Explore a selection of the finest Enhancing Client Engagement What Are The Challenges Faced By Company Infographics PDF here. With a plethora of professionally designed and pre-made slide templates, you can quickly and easily find the right one for your upcoming presentation. You can use our Enhancing Client Engagement What Are The Challenges Faced By Company Infographics PDF to effectively convey your message to a wider audience. Slidegeeks has done a lot of research before preparing these presentation templates. The content can be personalized and the slides are highly editable. Grab templates today from Slidegeeks.
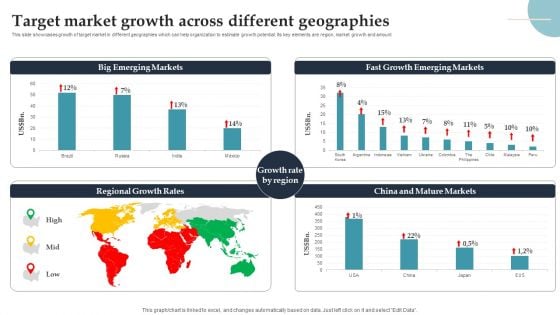
Product Rollout Techniques Target Market Growth Across Different Geographies Infographics PDF
This slide showcases growth of target market in different geographies which can help organization to estimate growth potential. Its key elements are region, market growth and amount. Find highly impressive Product Rollout Techniques Target Market Growth Across Different Geographies Infographics PDF on Slidegeeks to deliver a meaningful presentation. You can save an ample amount of time using these presentation templates. No need to worry to prepare everything from scratch because Slidegeeks experts have already done a huge research and work for you. You need to download Product Rollout Techniques Target Market Growth Across Different Geographies Infographics PDF for your upcoming presentation. All the presentation templates are 100 percent editable and you can change the color and personalize the content accordingly. Download now.
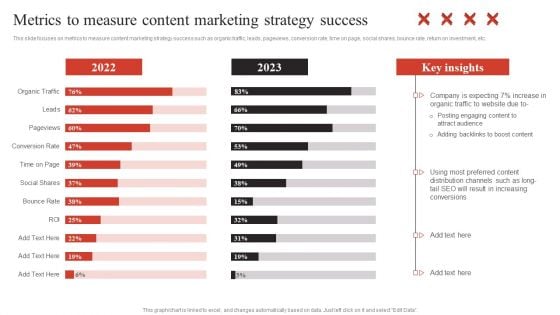
Developing Content Marketing Metrics To Measure Content Marketing Strategy Infographics PDF
This slide focuses on metrics to measure content marketing strategy success such as organic traffic, leads, pageviews, conversion rate, time on page, social shares, bounce rate, return on investment, etc. Crafting an eye-catching presentation has never been more straightforward. Let your presentation shine with this tasteful yet straightforward Developing Content Marketing Metrics To Measure Content Marketing Strategy Infographics PDF template. It offers a minimalistic and classy look that is great for making a statement. The colors have been employed intelligently to add a bit of playfulness while still remaining professional. Construct the ideal Developing Content Marketing Metrics To Measure Content Marketing Strategy Infographics PDF that effortlessly grabs the attention of your audience Begin now and be certain to wow your customers.
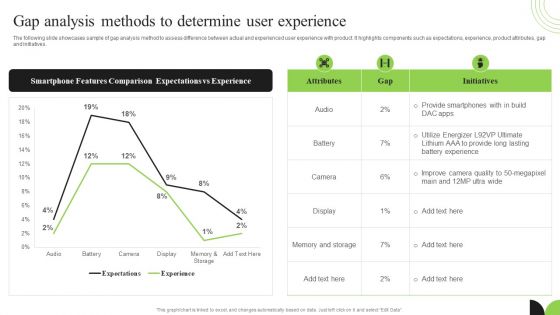
Guidebook For Executing Business Market Intelligence Gap Analysis Methods To Determine Infographics PDF
The following slide showcases sample of gap analysis method to assess difference between actual and experienced user experience with product. It highlights components such as expectations, experience, product attributes, gap and initiatives. Create an editable Guidebook For Executing Business Market Intelligence Gap Analysis Methods To Determine Infographics PDF that communicates your idea and engages your audience. Whether you are presenting a business or an educational presentation, pre designed presentation templates help save time. Guidebook For Executing Business Market Intelligence Gap Analysis Methods To Determine Infographics PDF is highly customizable and very easy to edit, covering many different styles from creative to business presentations. Slidegeeks has creative team members who have crafted amazing templates. So, go and get them without any delay.
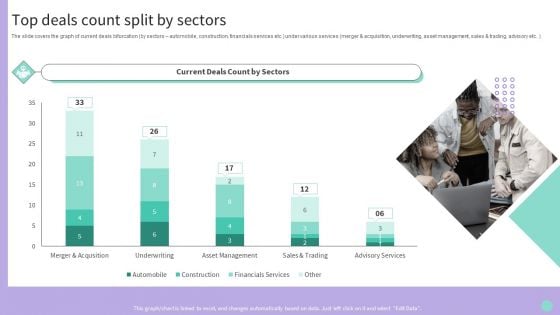
Buy Side Merger And Acquisition Advisory Top Deals Count Split By Sectors Infographics PDF
The slide covers the graph of current deals bifurcation by sectors automobile, construction, financials services etc. under various services merger and acquisition, underwriting, asset management, sales and trading, advisory etc. Do you have to make sure that everyone on your team knows about any specific topic I yes, then you should give Buy Side Merger And Acquisition Advisory Top Deals Count Split By Sectors Infographics PDF a try. Our experts have put a lot of knowledge and effort into creating this impeccable Buy Side Merger And Acquisition Advisory Top Deals Count Split By Sectors Infographics PDF. You can use this template for your upcoming presentations, as the slides are perfect to represent even the tiniest detail. You can download these templates from the Slidegeeks website and these are easy to edit. So grab these today.
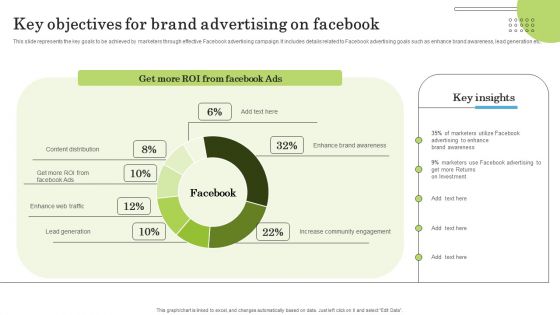
Key Objectives For Brand Advertising On Facebook Ppt PowerPoint Presentation File Infographics PDF
This slide represents the key goals to be achieved by marketers through effective Facebook advertising campaign. It includes details related to Facebook advertising goals such as enhance brand awareness, lead generation etc. Explore a selection of the finest Key Objectives For Brand Advertising On Facebook Ppt PowerPoint Presentation File Infographics PDF here. With a plethora of professionally designed and pre made slide templates, you can quickly and easily find the right one for your upcoming presentation. You can use our Key Objectives For Brand Advertising On Facebook Ppt PowerPoint Presentation File Infographics PDF to effectively convey your message to a wider audience. Slidegeeks has done a lot of research before preparing these presentation templates. The content can be personalized and the slides are highly editable. Grab templates today from Slidegeeks.
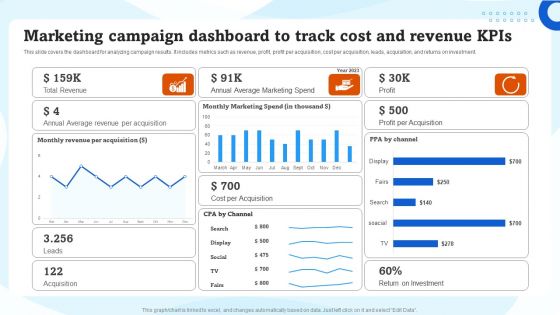
Marketing Campaign Dashboard To Track Cost And Revenue Kpis Ppt Infographics Good PDF
This slide covers the dashboard for analyzing campaign results. It includes metrics such as revenue, profit, profit per acquisition, cost per acquisition, leads, acquisition, and returns on investment. Formulating a presentation can take up a lot of effort and time, so the content and message should always be the primary focus. The visuals of the PowerPoint can enhance the presenters message, so our Marketing Campaign Dashboard To Track Cost And Revenue Kpis Ppt Infographics Good PDF was created to help save time. Instead of worrying about the design, the presenter can concentrate on the message while our designers work on creating the ideal templates for whatever situation is needed. Slidegeeks has experts for everything from amazing designs to valuable content, we have put everything into Marketing Campaign Dashboard To Track Cost And Revenue Kpis Ppt Infographics Good PDF.
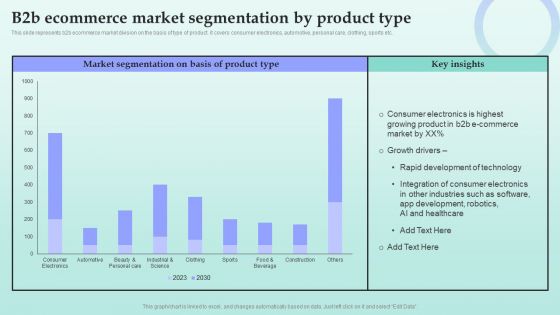
Strategies For Successful Customer Base Development In B2b M Commerce B2b Ecommerce Market Segmentation Infographics PDF
This slide represents b2b ecommerce market division on the basis of type of product. it covers consumer electronics, automotive, personal care, clothing, sports etc. Crafting an eye catching presentation has never been more straightforward. Let your presentation shine with this tasteful yet straightforward Strategies For Successful Customer Base Development In B2b M Commerce B2b Ecommerce Market Segmentation Infographics PDF template. It offers a minimalistic and classy look that is great for making a statement. The colors have been employed intelligently to add a bit of playfulness while still remaining professional. Construct the ideal Strategies For Successful Customer Base Development In B2b M Commerce B2b Ecommerce Market Segmentation Infographics PDF that effortlessly grabs the attention of your audience. Begin now and be certain to wow your customers.
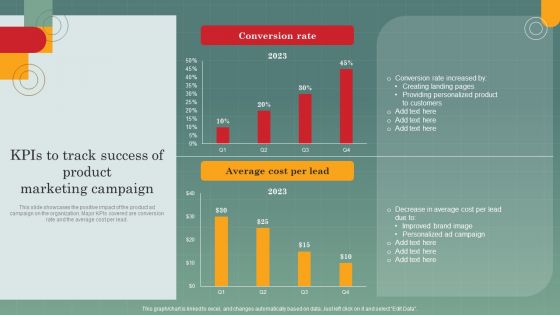
Advertising Programs Management Techniques Kpis To Track Success Of Product Marketing Campaign Infographics PDF
This slide showcases the positive impact of the product ad campaign on the organization. Major KPIs covered are conversion rate and the average cost per lead. Formulating a presentation can take up a lot of effort and time, so the content and message should always be the primary focus. The visuals of the PowerPoint can enhance the presenters message, so our Advertising Programs Management Techniques Kpis To Track Success Of Product Marketing Campaign Infographics PDF was created to help save time. Instead of worrying about the design, the presenter can concentrate on the message while our designers work on creating the ideal templates for whatever situation is needed. Slidegeeks has experts for everything from amazing designs to valuable content, we have put everything into Advertising Programs Management Techniques Kpis To Track Success Of Product Marketing Campaign Infographics PDF
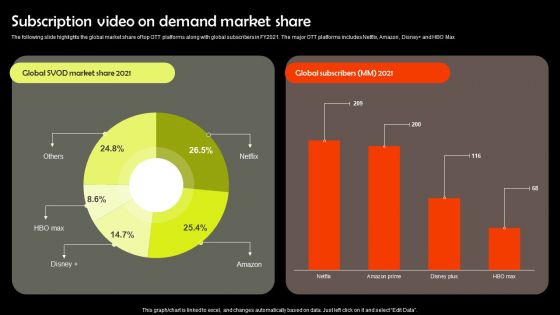
Digital Media Streaming Platform Company Profile Subscription Video On Demand Market Share Infographics PDF
The following slide highlights the global market share of top OTT platforms along with global subscribers in FY2021. The major OTT platforms includes Netflix, Amazon, Disney and HBO Max Find highly impressive Digital Media Streaming Platform Company Profile Subscription Video On Demand Market Share Infographics PDF on Slidegeeks to deliver a meaningful presentation. You can save an ample amount of time using these presentation templates. No need to worry to prepare everything from scratch because Slidegeeks experts have already done a huge research and work for you. You need to download Digital Media Streaming Platform Company Profile Subscription Video On Demand Market Share Infographics PDF for your upcoming presentation. All the presentation templates are 100 percent editable and you can change the color and personalize the content accordingly. Download now.
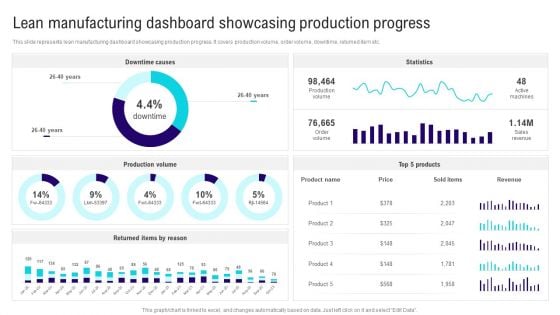
Implementing Lean Production Tool And Techniques Lean Manufacturing Dashboard Showcasing Infographics PDF
This slide represents lean manufacturing dashboard showcasing production progress. It covers production volume, order volume, downtime, returned item etc. Explore a selection of the finest Implementing Lean Production Tool And Techniques Lean Manufacturing Dashboard Showcasing Infographics PDF here. With a plethora of professionally designed and pre made slide templates, you can quickly and easily find the right one for your upcoming presentation. You can use our Implementing Lean Production Tool And Techniques Lean Manufacturing Dashboard Showcasing Infographics PDF to effectively convey your message to a wider audience. Slidegeeks has done a lot of research before preparing these presentation templates. The content can be personalized and the slides are highly editable. Grab templates today from Slidegeeks.
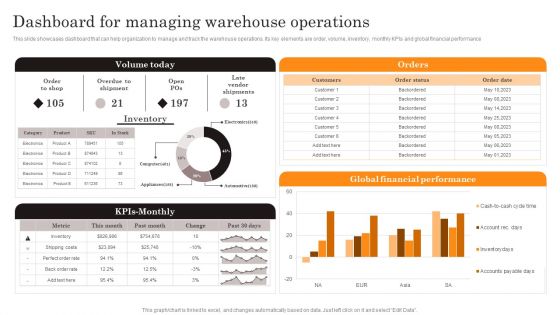
Procurement Strategies For Reducing Stock Wastage Dashboard For Managing Warehouse Infographics PDF
This slide showcases dashboard that can help organization to manage and track the warehouse operations. Its key elements are order, volume, inventory, monthly KPIs and global financial performance. Here you can discover an assortment of the finest PowerPoint and Google Slides templates. With these templates, you can create presentations for a variety of purposes while simultaneously providing your audience with an eye catching visual experience. Download Procurement Strategies For Reducing Stock Wastage Dashboard For Managing Warehouse Infographics PDF to deliver an impeccable presentation. These templates will make your job of preparing presentations much quicker, yet still, maintain a high level of quality. Slidegeeks has experienced researchers who prepare these templates and write high quality content for you. Later on, you can personalize the content by editing the Procurement Strategies For Reducing Stock Wastage Dashboard For Managing Warehouse Infographics PDF.
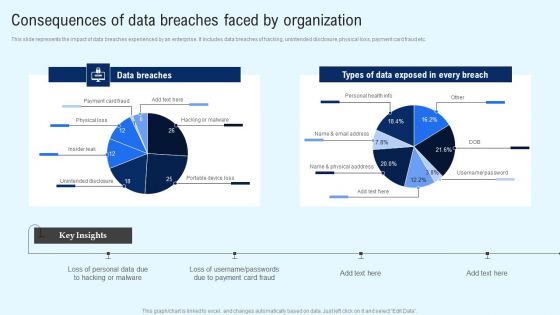
Implementing Cyber Security Incident Consequences Of Data Breaches Faced By Organization Infographics PDF
This slide represents the impact of data breaches experienced by an enterprise. It includes data breaches of hacking, unintended disclosure, physical loss, payment card fraud etc. Create an editable Implementing Cyber Security Incident Consequences Of Data Breaches Faced By Organization Infographics PDF that communicates your idea and engages your audience. Whether youre presenting a business or an educational presentation, pre designed presentation templates help save time. Implementing Cyber Security Incident Consequences Of Data Breaches Faced By Organization Infographics PDF is highly customizable and very easy to edit, covering many different styles from creative to business presentations. Slidegeeks has creative team members who have crafted amazing templates. So, go and get them without any delay.
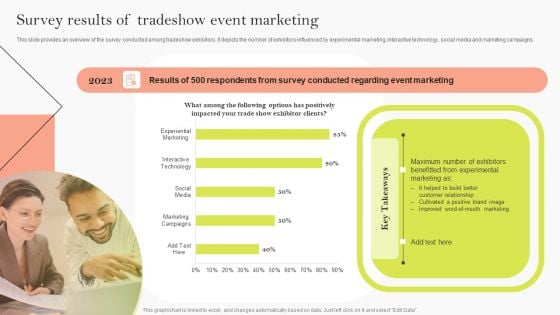
Survey Results Of Tradeshow Event Marketing Ppt Infographics Graphic Tips PDF
This slide provides an overview of the survey conducted among tradeshow exhibitors. It depicts the number of exhibitors influenced by experimental marketing, interactive technology, social media and marketing campaigns. Get a simple yet stunning designed Survey Results Of Tradeshow Event Marketing Ppt Infographics Graphic Tips PDF. It is the best one to establish the tone in your meetings. It is an excellent way to make your presentations highly effective. So, download this PPT today from Slidegeeks and see the positive impacts. Our easy to edit Survey Results Of Tradeshow Event Marketing Ppt Infographics Graphic Tips PDF can be your go to option for all upcoming conferences and meetings. So, what are you waiting for Grab this template today.
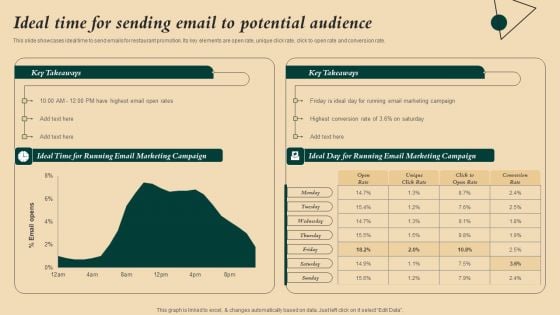
Coffeehouse Promotion Techniques To Boost Revenue Ideal Time For Sending Email To Potential Audience Infographics PDF
This slide showcases ideal time to send emails for restaurant promotion. Its key elements are open rate, unique click rate, click to open rate and conversion rate. Formulating a presentation can take up a lot of effort and time, so the content and message should always be the primary focus. The visuals of the PowerPoint can enhance the presenters message, so our Coffeehouse Promotion Techniques To Boost Revenue Ideal Time For Sending Email To Potential Audience Infographics PDF was created to help save time. Instead of worrying about the design, the presenter can concentrate on the message while our designers work on creating the ideal templates for whatever situation is needed. Slidegeeks has experts for everything from amazing designs to valuable content, we have put everything into Coffeehouse Promotion Techniques To Boost Revenue Ideal Time For Sending Email To Potential Audience Infographics PDF
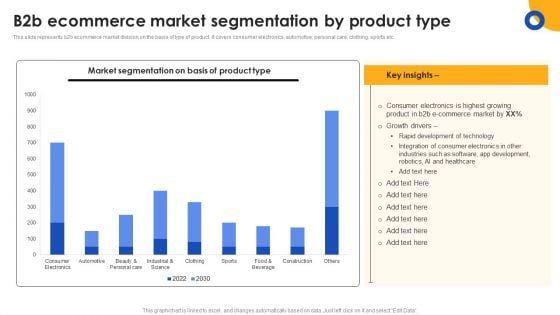
E Commerce Operations In B2b B2b Ecommerce Market Segmentation By Product Type Infographics PDF
This slide represents b2b ecommerce market division on the basis of type of product. it covers consumer electronics, automotive, personal care, clothing, sports etc. Create an editable E Commerce Operations In B2b B2b Ecommerce Market Segmentation By Product Type Infographics PDF that communicates your idea and engages your audience. Whether youre presenting a business or an educational presentation, pre designed presentation templates help save time. E Commerce Operations In B2b B2b Ecommerce Market Segmentation By Product Type Infographics PDF is highly customizable and very easy to edit, covering many different styles from creative to business presentations. Slidegeeks has creative team members who have crafted amazing templates. So, go and get them without any delay.
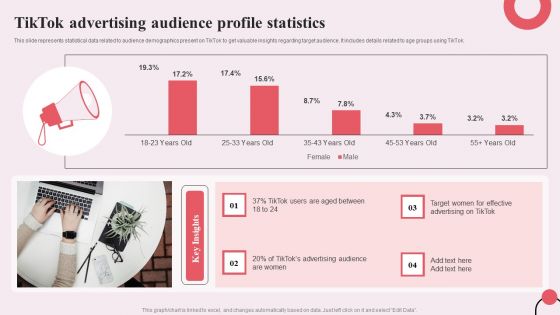
Tiktok Digital Marketing Campaign Tiktok Advertising Audience Profile Statistics Infographics PDF
This slide represents statistical data related to audience demographics present on TikTok to get valuable insights regarding target audience. It includes details related to age groups using TikTok. Crafting an eye-catching presentation has never been more straightforward. Let your presentation shine with this tasteful yet straightforward Tiktok Digital Marketing Campaign Tiktok Advertising Audience Profile Statistics Infographics PDF template. It offers a minimalistic and classy look that is great for making a statement. The colors have been employed intelligently to add a bit of playfulness while still remaining professional. Construct the ideal Tiktok Digital Marketing Campaign Tiktok Advertising Audience Profile Statistics Infographics PDF that effortlessly grabs the attention of your audience Begin now and be certain to wow your customers
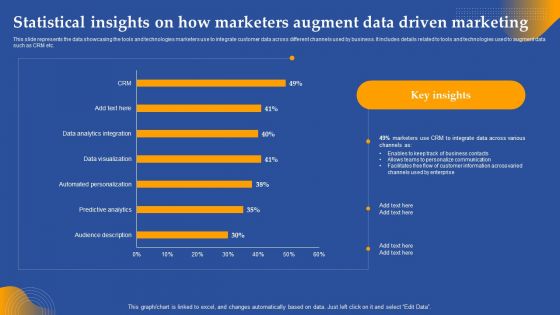
Statistical Insights On How Marketers Augment Data Driven Marketing Ppt Infographics Influencers PDF
This slide represents the data showcasing the tools and technologies marketers use to integrate customer data across different channels used by business. It includes details related to tools and technologies used to augment data such as CRM etc. Find highly impressive Statistical Insights On How Marketers Augment Data Driven Marketing Ppt Infographics Influencers PDF on Slidegeeks to deliver a meaningful presentation. You can save an ample amount of time using these presentation templates. No need to worry to prepare everything from scratch because Slidegeeks experts have already done a huge research and work for you. You need to download Statistical Insights On How Marketers Augment Data Driven Marketing Ppt Infographics Influencers PDF for your upcoming presentation. All the presentation templates are 100 percent editable and you can change the color and personalize the content accordingly. Download now.
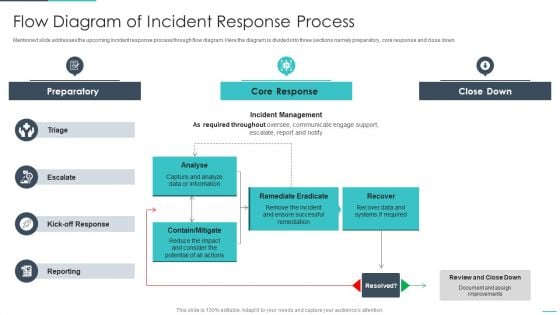
Handling Cyber Threats Digital Era Flow Diagram Of Incident Response Process Ppt Infographics Inspiration PDF
Mentioned slide addresses the upcoming incident response process through flow diagram. Here the diagram is divided into three sections namely preparatory, core response and close down. Deliver an awe inspiring pitch with this creative handling cyber threats digital era flow diagram of incident response process ppt infographics inspiration pdf bundle. Topics like preparatory, remediate eradicate, analyse can be discussed with this completely editable template. It is available for immediate download depending on the needs and requirements of the user.
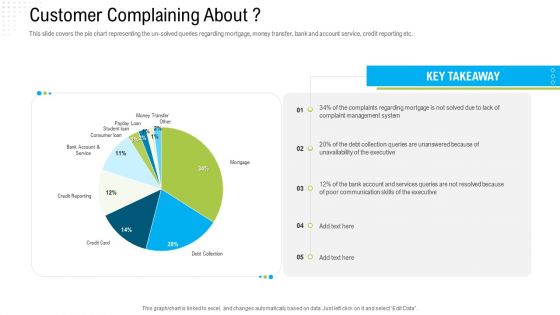
Robotization In Issues Management Customer Complaining About Ppt Infographics Layout Ideas PDF
This slide covers the pie chart representing the un-solved queries regarding mortgage, money transfer, bank and account service, credit reporting etc. Deliver an awe inspiring pitch with this creative robotization in issues management customer complaining about ppt infographics layout ideas pdf bundle. Topics like management system, communication skills, services queries can be discussed with this completely editable template. It is available for immediate download depending on the needs and requirements of the user.
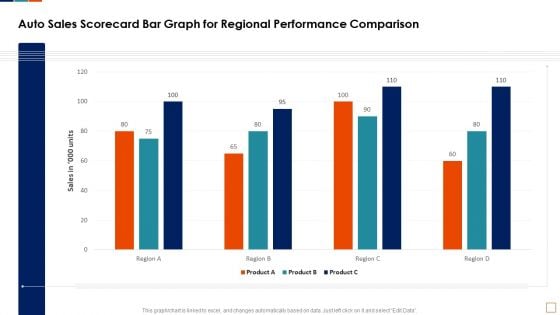
Auto Sales Scorecard Bar Graph For Regional Performance Comparison Infographics PDF
This graph or chart is linked to excel, and changes automatically based on data. Just left click on it and select Edit Data. Deliver an awe inspiring pitch with this creative Auto Sales Scorecard Bar Graph For Regional Performance Comparison Infographics PDF bundle. Topics like Auto Sales Scorecard, Bar Graph Regional, Performance Comparison Product can be discussed with this completely editable template. It is available for immediate download depending on the needs and requirements of the user.
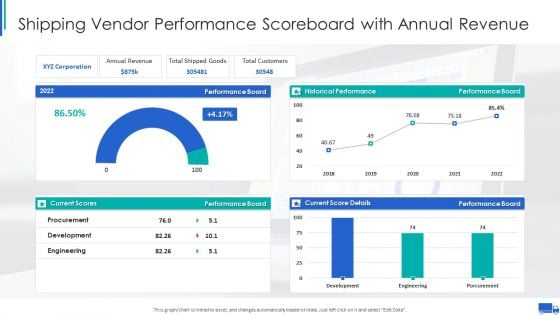
Shipping Vendor Performance Scoreboard With Annual Revenue Ppt Infographics Graphics PDF
This graph or chart is linked to excel, and changes automatically based on data. Just left click on it and select Edit Data. Deliver an awe inspiring pitch with this creative Shipping Vendor Performance Scoreboard With Annual Revenue Ppt Infographics Graphics PDF bundle. Topics like Annual Revenue Board, Total Shipped Goods, Total Customers Performance can be discussed with this completely editable template. It is available for immediate download depending on the needs and requirements of the user.
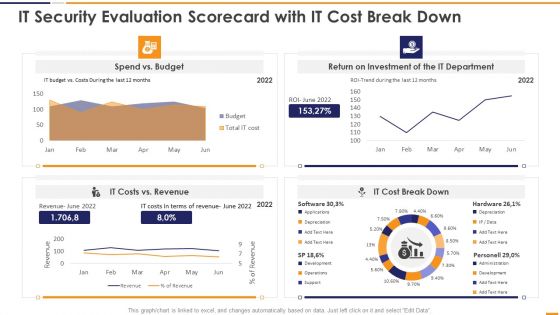
IT Security Evaluation Scorecard With It Cost Break Down Ppt Infographics Slideshow PDF
This graph or chart is linked to excel, and changes automatically based on data. Just left click on it and select Edit Data. Deliver an awe inspiring pitch with this creative IT Security Evaluation Scorecard With It Cost Break Down Ppt Infographics Slideshow PDF bundle. Topics like Spend Vs Budget, Return On Investment, IT Department Revenue, IT Costs Vs can be discussed with this completely editable template. It is available for immediate download depending on the needs and requirements of the user.
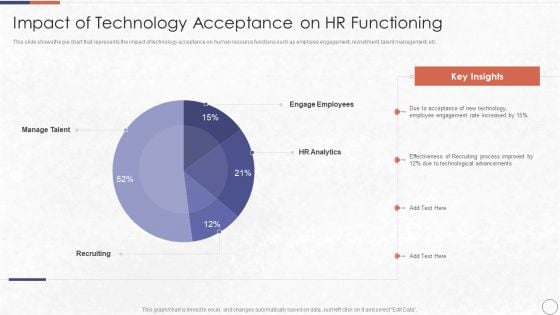
RPA In HR Operations Impact Of Technology Acceptance On HR Functioning Infographics PDF
This slide shows the pie chart that represents the impact of technology acceptance on human resource functions such as employee engagement, recruitment, talent management, etc.Deliver and pitch your topic in the best possible manner with this RPA In HR Operations Impact Of Technology Acceptance On HR Functioning Infographics PDF. Use them to share invaluable insights on Engage Employees, Manage Talent, Employee Engagement and impress your audience. This template can be altered and modified as per your expectations. So, grab it now.
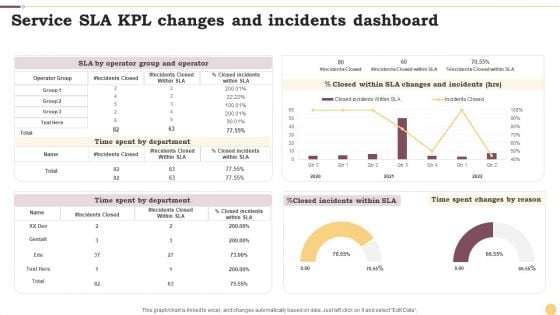
Service SLA KPL Changes And Incidents Dashboard Ppt Inspiration Infographics PDF
This graph or chart is linked to excel, and changes automatically based on data. Just left click on it and select Edit Data. Pitch your topic with ease and precision using this Service SLA KPL Changes And Incidents Dashboard Ppt Inspiration Infographics PDF. This layout presents information on Time Spent Department, Incidents Closed, Operator Group. It is also available for immediate download and adjustment. So, changes can be made in the color, design, graphics or any other component to create a unique layout.
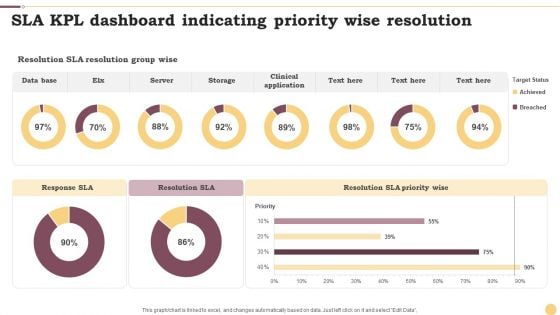
SLA KPL Dashboard Indicating Priority Wise Resolution Ppt Infographics Example File PDF
This graph or chart is linked to excel, and changes automatically based on data. Just left click on it and select Edit Data. Pitch your topic with ease and precision using this SLA KPL Dashboard Indicating Priority Wise Resolution Ppt Infographics Example File PDF. This layout presents information on Data Base, Server, Storage. It is also available for immediate download and adjustment. So, changes can be made in the color, design, graphics or any other component to create a unique layout.
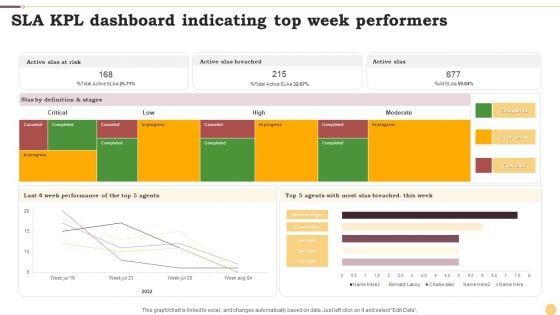
SLA KPL Dashboard Indicating Top Week Performers Ppt Infographics Examples PDF
This graph or chart is linked to excel, and changes automatically based on data. Just left click on it and select Edit Data. Showcasing this set of slides titled SLA KPL Dashboard Indicating Top Week Performers Ppt Infographics Examples PDF. The topics addressed in these templates are Active Slas Risk, Active Slas Breached, Active Slas. All the content presented in this PPT design is completely editable. Download it and make adjustments in color, background, font etc. as per your unique business setting.
ITIL Change Management Process Flow Diagram Ppt PowerPoint Presentation Infographics Background Cpb
Presenting this set of slides with name itil change management process flow diagram ppt powerpoint presentation infographics background cpb. This is an editable Powerpoint four stages graphic that deals with topics like itil change management process flow diagram to help convey your message better graphically. This product is a premium product available for immediate download and is 100 percent editable in Powerpoint. Download this now and use it in your presentations to impress your audience.
Quote Cash Process Diagram Ppt PowerPoint Presentation Infographics Templates Cpb Pdf
Presenting this set of slides with name quote cash process diagram ppt powerpoint presentation infographics templates cpb pdf. This is an editable Powerpoint three stages graphic that deals with topics like quote cash process diagram to help convey your message better graphically. This product is a premium product available for immediate download and is 100 percent editable in Powerpoint. Download this now and use it in your presentations to impress your audience.

Critical Path Network Diagram Ppt PowerPoint Presentation Infographics Deck Cpb Pdf
Presenting this set of slides with name critical path network diagram ppt powerpoint presentation infographics deck cpb pdf. This is an editable Powerpoint seven stages graphic that deals with topics like critical path network diagram to help convey your message better graphically. This product is a premium product available for immediate download and is 100 percent editable in Powerpoint. Download this now and use it in your presentations to impress your audience.
Lead Generation Initiatives Through Chatbots Linear Diagram Ppt Infographics Aids PDF
This is a lead generation initiatives through chatbots linear diagram ppt infographics aids pdf template with various stages. Focus and dispense information on four stages using this creative set, that comes with editable features. It contains large content boxes to add your information on topics like linear diagram. You can also showcase facts, figures, and other relevant content using this PPT layout. Grab it now.
Investor Pitch Deck To Generate Venture Capital Funds Circular Diagram Ppt Outline Infographics PDF
This is a investor pitch deck to generate venture capital funds circular diagram ppt outline infographics pdf template with various stages. Focus and dispense information on four stages using this creative set, that comes with editable features. It contains large content boxes to add your information on topics like circular diagram. You can also showcase facts, figures, and other relevant content using this PPT layout. Grab it now.
IT Facilities Maturity Framework For Strong Business Financial Position Circular Diagram Infographics PDF
This is a it facilities maturity framework for strong business financial position circular diagram infographics pdf template with various stages. Focus and dispense information on six stages using this creative set, that comes with editable features. It contains large content boxes to add your information on topics like circular diagram. You can also showcase facts, figures, and other relevant content using this PPT layout. Grab it now.
6 Elements Diagram For Workforce Management Ppt PowerPoint Presentation File Infographics PDF
Persuade your audience using this 6 elements diagram for workforce management ppt powerpoint presentation file infographics pdf. This PPT design covers six stages, thus making it a great tool to use. It also caters to a variety of topics including 6 elements diagram for workforce management. Download this PPT design now to present a convincing pitch that not only emphasizes the topic but also showcases your presentation skills.
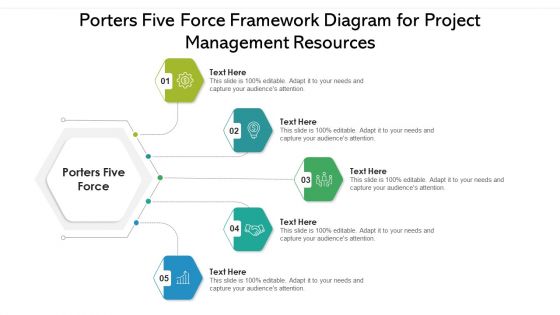
Porters Five Force Framework Diagram For Project Management Resources Ppt PowerPoint Presentation Visual Aids Infographics PDF
Persuade your audience using this porters five force framework diagram for project management resources ppt powerpoint presentation visual aids infographics pdf. This PPT design covers five stages, thus making it a great tool to use. It also caters to a variety of topics including porters five force framework diagram for project management resources . Download this PPT design now to present a convincing pitch that not only emphasizes the topic but also showcases your presentation skills.
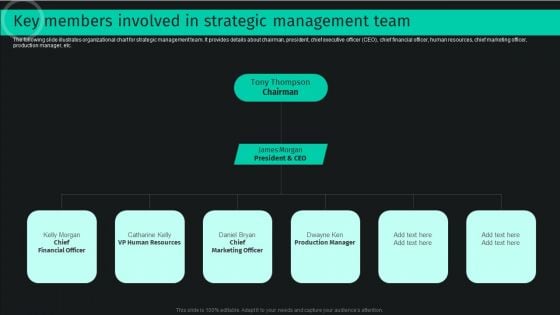
Developing And Achieving Sustainable Competitive Advantage Key Members Involved In Strategic Management Team Infographics PDF
The following slide illustrates organizational chart for strategic management team. It provides details about chairman, president, chief executive officer CEO, chief financial officer, human resources, chief marketing officer, production manager, etc. Get a simple yet stunning designed Developing And Achieving Sustainable Competitive Advantage Key Members Involved In Strategic Management Team Infographics PDF. It is the best one to establish the tone in your meetings. It is an excellent way to make your presentations highly effective. So, download this PPT today from Slidegeeks and see the positive impacts. Our easy to edit Developing And Achieving Sustainable Competitive Advantage Key Members Involved In Strategic Management Team Infographics PDF can be your go to option for all upcoming conferences and meetings. So, what are you waiting for Grab this template today.
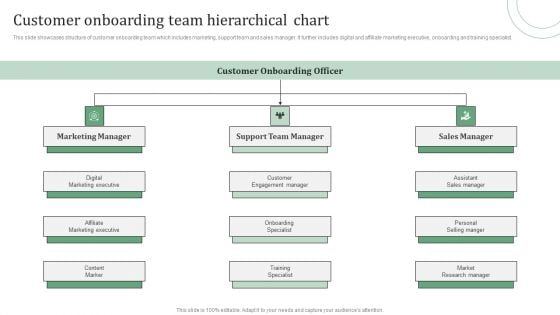
Standard Approaches For Client Onboarding Journey Customer Onboarding Team Infographics PDF
This slide showcases structure of customer onboarding team which includes marketing, support team and sales manager. It further includes digital and affiliate marketing executive, onboarding and training specialist. If you are looking for a format to display your unique thoughts, then the professionally designed Standard Approaches For Client Onboarding Journey Customer Onboarding Team Infographics PDF is the one for you. You can use it as a Google Slides template or a PowerPoint template. Incorporate impressive visuals, symbols, images, and other charts. Modify or reorganize the text boxes as you desire. Experiment with shade schemes and font pairings. Alter, share or cooperate with other people on your work. Download Standard Approaches For Client Onboarding Journey Customer Onboarding Team Infographics PDF and find out how to give a successful presentation. Present a perfect display to your team and make your presentation unforgettable.
Types Architectural Firms Ownership Structure Ppt PowerPoint Presentation Infographics Diagrams Cpb
Presenting this set of slides with name types architectural firms ownership structure ppt powerpoint presentation infographics diagrams cpb. This is an editable Powerpoint seven stages graphic that deals with topics like types architectural firms ownership structure to help convey your message better graphically. This product is a premium product available for immediate download and is 100 percent editable in Powerpoint. Download this now and use it in your presentations to impress your audience.
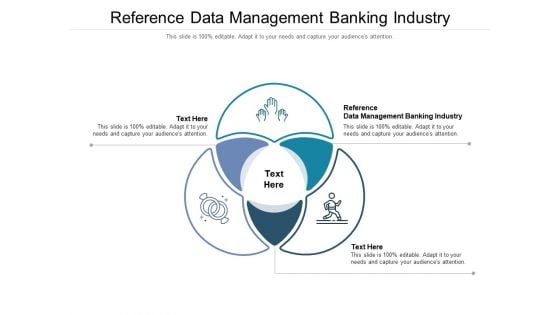
Reference Data Management Banking Industry Ppt PowerPoint Presentation Infographics Diagrams Cpb Pdf
Presenting this set of slides with name reference data management banking industry ppt powerpoint presentation infographics diagrams cpb pdf. This is an editable Powerpoint three stages graphic that deals with topics like reference data management banking industry to help convey your message better graphically. This product is a premium product available for immediate download and is 100 percent editable in Powerpoint. Download this now and use it in your presentations to impress your audience.
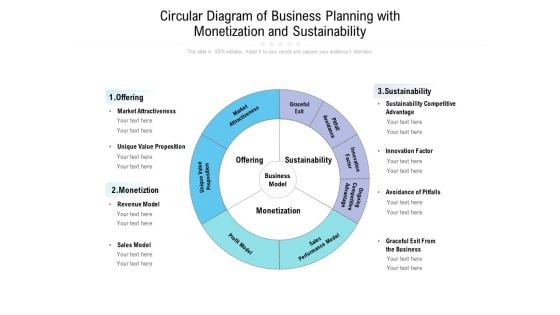
Circular Diagram Of Business Planning With Monetization And Sustainability Ppt PowerPoint Presentation Infographics Portrait PDF
Presenting this set of slides with name circular diagram of business planning with monetization and sustainability ppt powerpoint presentation infographics portrait pdf. This is a three stage process. The stages in this process are market attractiveness, unique value proposition, monetiztion, revenue model, sales model, sustainability competitive advantage, innovation factor, avoidance of pitfalls, graceful exit from the business . This is a completely editable PowerPoint presentation and is available for immediate download. Download now and impress your audience.
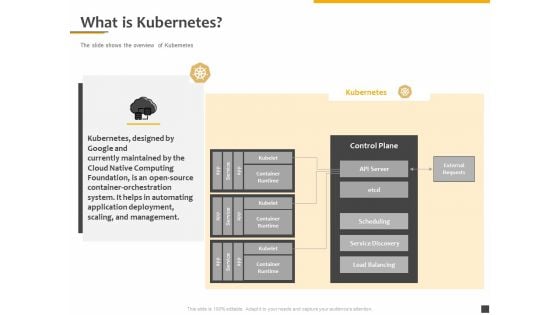
Understanding The Kubernetes Components Through Diagram What Is Kubernetes Ppt Infographics Graphics Template PDF
Presenting this set of slides with name understanding the kubernetes components through diagram what is kubernetes ppt infographics graphics template pdf. This is a one stage process. The stages in this process are kubelet, container, runtime control plane, api server, scheduling service discovery, load balancing, external requests, kubernetes. This is a completely editable PowerPoint presentation and is available for immediate download. Download now and impress your audience.
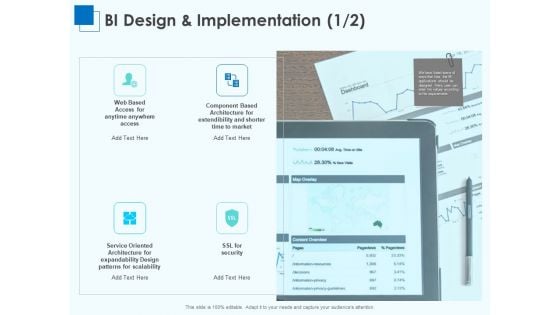
Corporate Intelligence Business Analysis BI Design And Implementation Ppt Infographics Diagrams PDF
Presenting corporate intelligence business analysis bi design and implementation ppt infographics diagrams pdf to provide visual cues and insights. Share and navigate important information on four stages that need your due attention. This template can be used to pitch topics like service oriented architecture for expandability design patterns for scalability. In addition, this PPT design contains high-resolution images, graphics, etc, that are easily editable and available for immediate download.

Woman Searching For Job On Smart Phone Ppt PowerPoint Presentation Infographics Diagrams PDF
Persuade your audience using this woman searching for job on smart phone ppt powerpoint presentation infographics diagrams pdf. This PPT design covers two stages, thus making it a great tool to use. It also caters to a variety of topics including woman searching for job on smart phone. Download this PPT design now to present a convincing pitch that not only emphasizes the topic but also showcases your presentation skills.
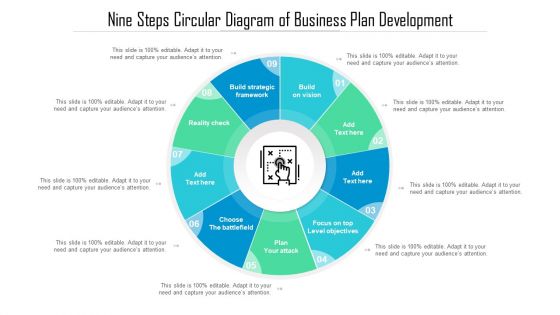
Nine Steps Circular Diagram Of Business Plan Development Ppt Infographics Format PDF
Persuade your audience using this nine steps circular diagram of business plan development ppt infographics format pdf. This PPT design covers nine stages, thus making it a great tool to use. It also caters to a variety of topics including build strategic framework, build on vision, reality check. Download this PPT design now to present a convincing pitch that not only emphasizes the topic but also showcases your presentation skills.
30 60 90 Days Scheme Of Human Resource Plan Diagram For Transaction Growth Infographics PDF
Persuade your audience using this 30 60 90 days scheme of human resource plan diagram for transaction growth infographics pdf. This PPT design covers three stages, thus making it a great tool to use. It also caters to a variety of topics including 30 60 90 days. Download this PPT design now to present a convincing pitch that not only emphasizes the topic but also showcases your presentation skills.
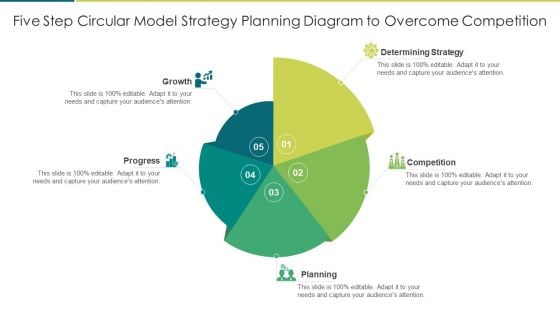
Five Step Circular Model Strategy Planning Diagram To Overcome Competition Infographics PDF
Persuade your audience using this five step circular model strategy planning diagram to overcome competition infographics pdf. This PPT design covers five stages, thus making it a great tool to use. It also caters to a variety of topics including growth, progress, competition. Download this PPT design now to present a convincing pitch that not only emphasizes the topic but also showcases your presentation skills.
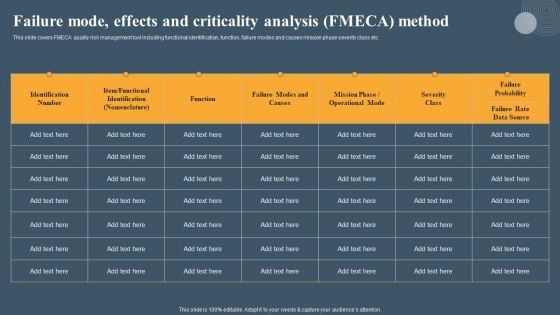
Risk Based Methodology Failure Mode Effects And Criticality Analysis FMECA Method Infographics PDF
This slide covers FMECA quality risk management tool including functional identification, function, failure modes and causes mission phase severity class etc. If you are looking for a format to display your unique thoughts, then the professionally designed Risk Based Methodology Failure Mode Effects And Criticality Analysis FMECA Method Infographics PDF is the one for you. You can use it as a Google Slides template or a PowerPoint template. Incorporate impressive visuals, symbols, images, and other charts. Modify or reorganize the text boxes as you desire. Experiment with shade schemes and font pairings. Alter, share or cooperate with other people on your work. Download Risk Based Methodology Failure Mode Effects And Criticality Analysis FMECA Method Infographics PDF and find out how to give a successful presentation. Present a perfect display to your team and make your presentation unforgettable.
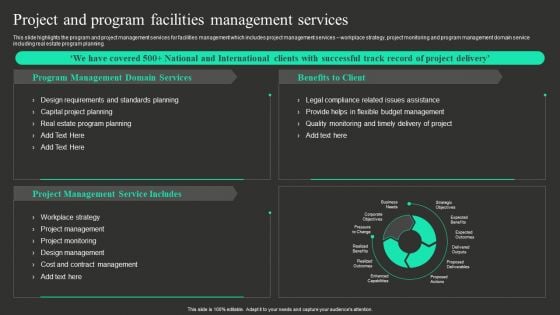
Workplace Facility Management Services Company Project And Program Facilities Management Services Infographics PDF
This slide highlights the program and project management services for facilities management which includes project management services workplace strategy, project monitoring and program management domain service including real estate program planning. Do you have an important presentation coming up Are you looking for something that will make your presentation stand out from the rest Look no further than Workplace Facility Management Services Company Project And Program Facilities Management Services Infographics PDF. With our professional designs, you can trust that your presentation will pop and make delivering it a smooth process. And with Slidegeeks, you can trust that your presentation will be unique and memorable. So why wait Grab Workplace Facility Management Services Company Project And Program Facilities Management Services Infographics PDF today and make your presentation stand out from the rest.
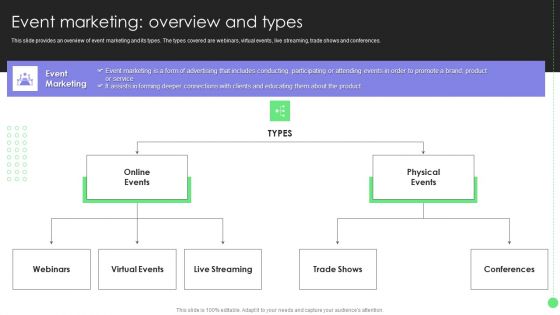
Comprehensive Guide For Launch Event Marketing Overview And Types Infographics PDF
This slide provides an overview of event marketing and its types. The types covered are webinars, virtual events, live streaming, trade shows and conferences. Do you have an important presentation coming up Are you looking for something that will make your presentation stand out from the rest Look no further than Comprehensive Guide For Launch Event Marketing Overview And Types Infographics PDF. With our professional designs, you can trust that your presentation will pop and make delivering it a smooth process. And with Slidegeeks, you can trust that your presentation will be unique and memorable. So why wait Grab Comprehensive Guide For Launch Event Marketing Overview And Types Infographics PDF today and make your presentation stand out from the rest.
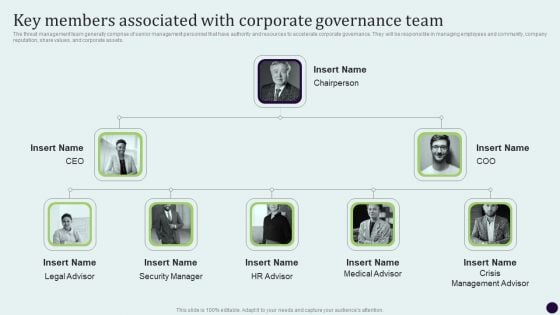
Critical Measures For Ensuring Key Members Associated With Corporate Governance Infographics PDF
The threat management team generally comprise of senior management personnel that have authority and resources to accelerate corporate governance. They will be responsible in managing employees and community, company reputation, share values, and corporate assets. Get a simple yet stunning designed Critical Measures For Ensuring Key Members Associated With Corporate Governance Infographics PDF. It is the best one to establish the tone in your meetings. It is an excellent way to make your presentations highly effective. So, download this PPT today from Slidegeeks and see the positive impacts. Our easy-to-edit Critical Measures For Ensuring Key Members Associated With Corporate Governance Infographics PDF can be your go-to option for all upcoming conferences and meetings. So, what are you waiting for Grab this template today.

Staff Performance Goals Prioritization For Quarterly Analysis Ppt PowerPoint Presentation Pictures Infographics PDF
Presenting this set of slides with name staff performance goals prioritization for quarterly analysis ppt powerpoint presentation pictures infographics pdf. The topics discussed in these slides are employee name, rio lawrence, designation marketing strategist, period q4 2020, improve client engagement, improve brand awareness, increase customer acquisitions, increase leads, sales prospects. This is a completely editable PowerPoint presentation and is available for immediate download. Download now and impress your audience.
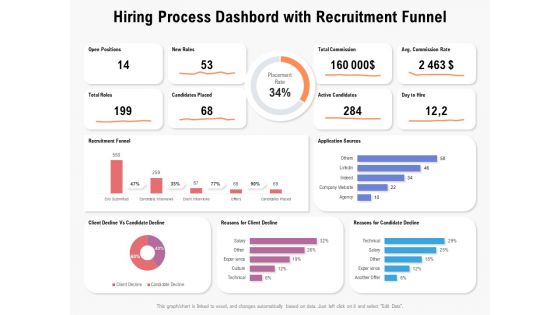
Hiring Process Dashbord With Recruitment Funnel Ppt PowerPoint Presentation Infographics Outfit PDF
Presenting this set of slides with name hiring process dashboard with recruitment funnel ppt powerpoint presentation infographics outfit pdf. The topics discussed in these slides are open positions, new roles, total commission, avg commission rate, total roles, candidates placed, active candidates, recruitment funnel, reasons for client decline, reasons for candidate decline, client decline vs candidate decline. This is a completely editable PowerPoint presentation and is available for immediate download. Download now and impress your audience.
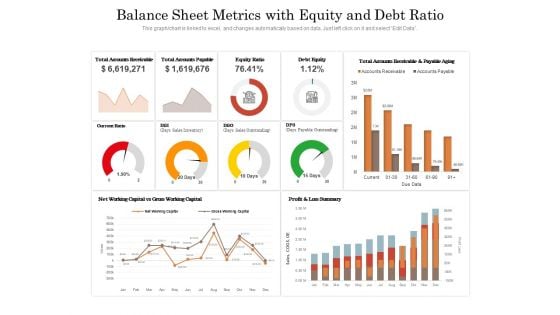
Balance Sheet Metrics With Equity And Debt Ratio Ppt PowerPoint Presentation Infographics Background Image PDF
Presenting this set of slides with name balance sheet metrics with equity and debt ratio ppt powerpoint presentation infographics background image pdf. The topics discussed in these slides are total accounts receivable, total accounts payable, equity ratio, debt equity, current ratio, profit and loss summary, total accounts receivable and payable aging. This is a completely editable PowerPoint presentation and is available for immediate download. Download now and impress your audience.
Brand Identity How Build It Brand Tracking Infographics Ppt File Graphics Tutorials PDF
Presenting this set of slides with name brand identity how build it brand tracking infographics ppt file graphics tutorials pdf. The topics discussed in these slides are 82 percent of consumers consider user generated reviews extremely valuable or valuable, 20 percent of online reviews have been pointed out as fake. This is a completely editable PowerPoint presentation and is available for immediate download. Download now and impress your audience.
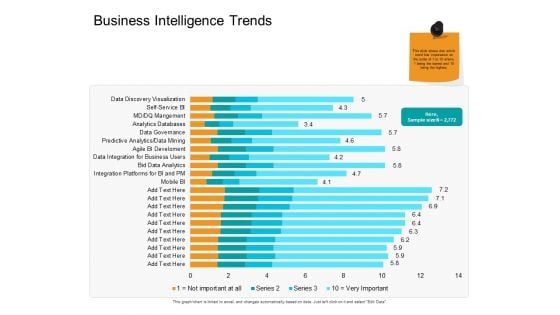
Facts Assessment Business Intelligence Trends Ppt PowerPoint Presentation Infographics Examples PDF
Presenting this set of slides with name facts assessment business intelligence trends ppt powerpoint presentation infographics examples pdf. The topics discussed in these slides are mobile bi, integration platforms bi and pm, bid data analytics, data integration for business users, agile bi development, predictive analytics, data mining, data governance, analytics databases. This is a completely editable PowerPoint presentation and is available for immediate download. Download now and impress your audience.
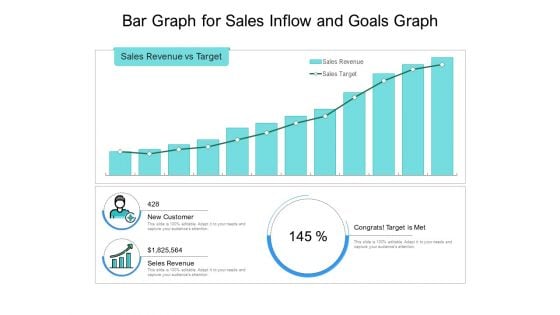
Bar Graph For Sales Inflow And Goals Graph Ppt PowerPoint Presentation Infographics Visual Aids PDF
Pitch your topic with ease and precision using this bar graph for sales inflow and goals graph ppt powerpoint presentation infographics visual aids pdf. This layout presents information on sales revenue vs target, new customer, congrats target is met. It is also available for immediate download and adjustment. So, changes can be made in the color, design, graphics or any other component to create a unique layout.
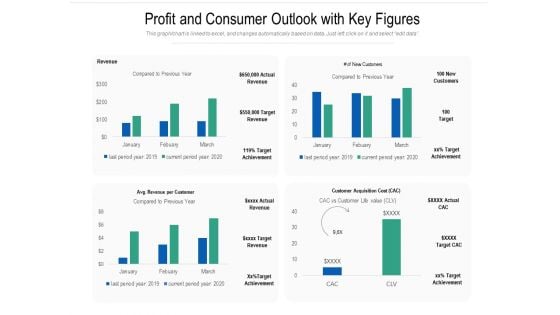
Profit And Consumer Outlook With Key Figures Ppt PowerPoint Presentation Infographics Format PDF
Pitch your topic with ease and precision using this profit and consumer outlook with key figures ppt powerpoint presentation infographics format pdf. This layout presents information on Revenue, Avg Revenue Per Customer, Customer Acquisition Cost, New Customers. It is also available for immediate download and adjustment. So, changes can be made in the color, design, graphics or any other component to create a unique layout.

Business Intelligence With Data Governance And Security Ppt PowerPoint Presentation Infographics Example PDF
Pitch your topic with ease and precision using this business intelligence with data governance and security ppt powerpoint presentation infographics example pdf. This layout presents information on data governance, data discovery, data quality management, connected clouds, security. It is also available for immediate download and adjustment. So, changes can be made in the color, design, graphics or any other component to create a unique layout.
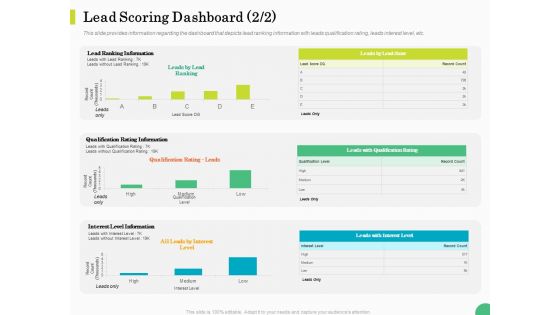
Evaluating Rank Prospects Lead Scoring Dashboard Information Ppt Infographics Topics PDF
This slide provides information regarding the dashboard that depicts lead ranking information with leads qualification rating, leads interest level, etc. Deliver an awe-inspiring pitch with this creative evaluating rank prospects lead scoring dashboard information ppt infographics topics pdf bundle. Topics like lead ranking information, qualification rating information, interest level information, qualification rating leads can be discussed with this completely editable template. It is available for immediate download depending on the needs and requirements of the user.
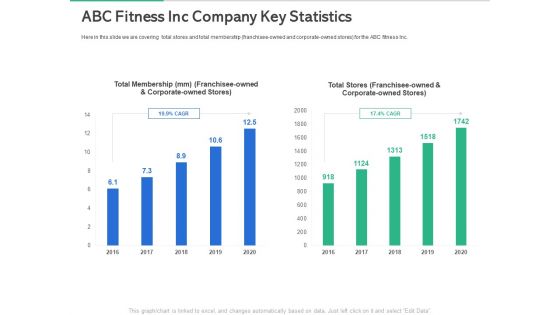
Market Overview Fitness Industry Abc Fitness Inc Company Key Statistics Infographics PDF
Here in this slide we are covering total stores and total membership franchisee-owned and corporate-owned stores for the ABC fitness Inc.Deliver an awe-inspiring pitch with this creative market overview fitness industry abc fitness inc company key statistics infographics pdf bundle. Topics like total membership, total stores can be discussed with this completely editable template. It is available for immediate download depending on the needs and requirements of the user.
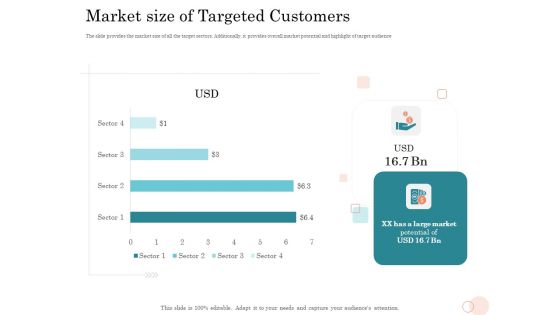
Option Pool Funding Pitch Deck Market Size Of Targeted Customers Ppt Infographics Templates PDF
The slide provides the market size of all the target sectors. Additionally, it provides overall market potential and highlight of target audience. Deliver an awe inspiring pitch with this creative option pool funding pitch deck market size of targeted customers ppt infographics templates pdf bundle. Topics like markets size of targeted customers can be discussed with this completely editable template. It is available for immediate download depending on the needs and requirements of the user.
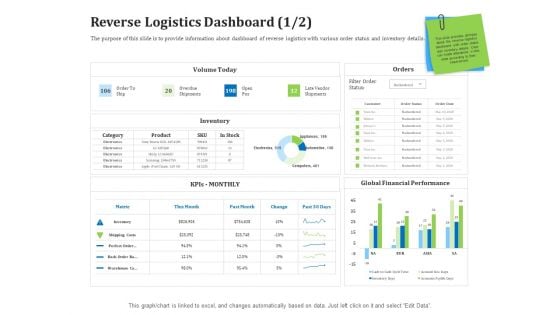
Reverse Logistics Management Reverse Logistics Dashboard Days Ppt Infographics Files PDF
The purpose of this slide is to provide information about dashboard of reverse logistics with various order status and inventory details. Deliver an awe inspiring pitch with this creative reverse logistics management reverse logistics dashboard days ppt infographics files pdf bundle. Topics like global, financial, performance, metric, inventory can be discussed with this completely editable template. It is available for immediate download depending on the needs and requirements of the user.
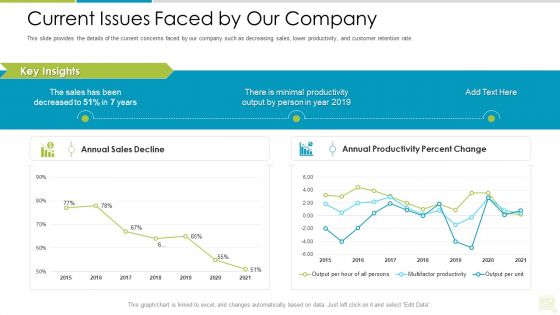
Distributor Entitlement Initiatives Current Issues Faced By Our Company Infographics PDF
This slide provides the details of the current concerns faced by our company such as decreasing sales, lower productivity, and customer retention rate. Deliver and pitch your topic in the best possible manner with this distributor entitlement initiatives current issues faced by our company infographics pdf. Use them to share invaluable insights on annual sales decline, annual productivity percent change and impress your audience. This template can be altered and modified as per your expectations. So, grab it now.
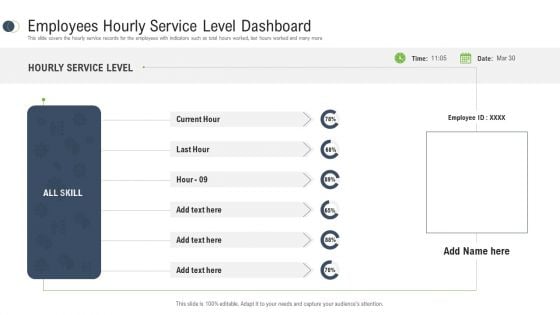
Consumer Complaint Procedure Employees Hourly Service Level Dashboard Ppt Infographics Professional PDF
This slide covers the hourly service records for the employees with indicators such as total hours worked, last hours worked and many more. Deliver and pitch your topic in the best possible manner with this consumer complaint procedure employees hourly service level dashboard ppt infographics professional pdf. Use them to share invaluable insights on employees hourly service level dashboard, hourly service level, skill and impress your audience. This template can be altered and modified as per your expectations. So, grab it now.
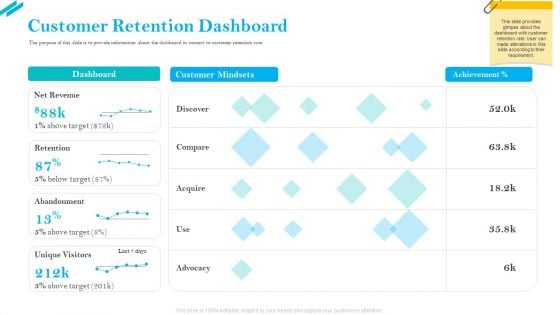
SCR For Market Customer Retention Dashboard Ppt Infographics Example Introduction PDF
The purpose of this slide is to provide information about the dashboard in context to customer retention rate. Deliver an awe-inspiring pitch with this creative SCR for market customer retention dashboard ppt infographics example introduction pdf bundle. Topics like customer retention dashboard, net revenue, retention, compare, unique visitors can be discussed with this completely editable template. It is available for immediate download depending on the needs and requirements of the user.
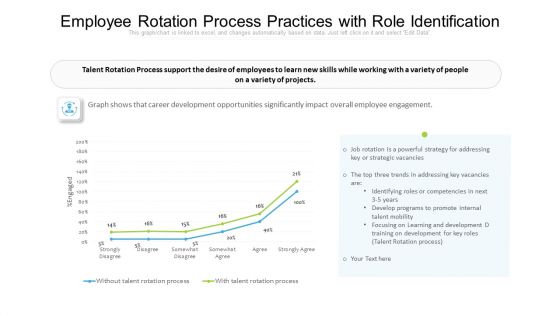
Employee Rotation Process Practices With Role Identification Ppt PowerPoint Presentation Infographics Background Image PDF
Showcasing this set of slides titled employee rotation process practices with role identification ppt powerpoint presentation infographics background image pdf. The topics addressed in these templates are job rotation is a powerful strategy for addressing key or strategic vacancies, develop programs to promote internal talent mobility, focusing on learning and development. All the content presented in this PPT design is completely editable. Download it and make adjustments in color, background, font etc. as per your unique business setting.
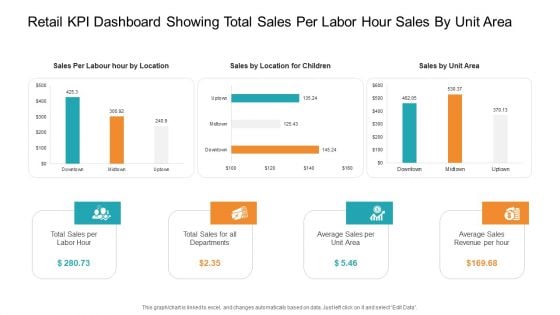
Retail KPI Dashboard Showing Total Sales Per Labor Hour Sales By Unit Area Infographics PDF
Deliver and pitch your topic in the best possible manner with this retail KPI dashboard showing total sales per labor hour sales by unit area infographics pdf. Use them to share invaluable insights on total sales per labor hour, total sales for all departments, average sales revenue per hour and impress your audience. This template can be altered and modified as per your expectations. So, grab it now.
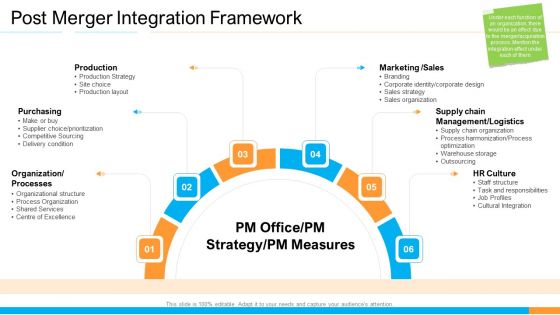
Business Takeover Plan For Inorganic Growth Profitability Ratios Gross Infographics PDF
Deliver and pitch your topic in the best possible manner with this business takeover plan for inorganic growth profitability ratios gross infographics pdf. Use them to share invaluable insights on gross profit ratio, net profit ratio, net profit after tax or net sales, gross profit or net sales and impress your audience. This template can be altered and modified as per your expectations. So, grab it now.
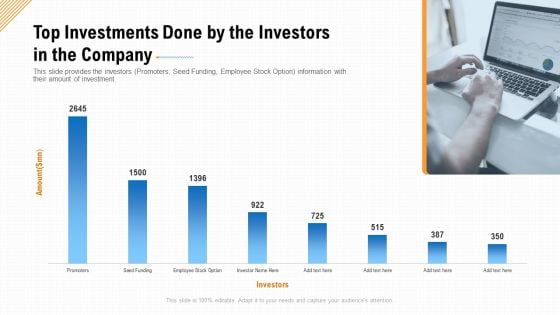
Top Investments Done By The Investors In The Company Ppt Infographics Maker PDF
This slide provides the investors Promoters, Seed Funding, Employee Stock Option information with their amount of investment. Deliver an awe inspiring pitch with this creative top investments done by the investors in the company ppt infographics maker pdf bundle. Topics like top investments done by the investors in the company can be discussed with this completely editable template. It is available for immediate download depending on the needs and requirements of the user.
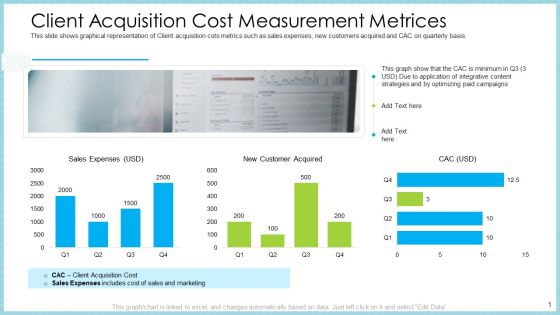
Customer Acquiring Price For Retaining New Clients Client Acquisition Cost Measurement Metrices Infographics PDF
This slide shows graphical representation of Client acquisition cots metrics such as sales expenses, new customers acquired and CAC on quarterly basis. Deliver and pitch your topic in the best possible manner with this customer acquiring price for retaining new clients client acquisition cost measurement metrices infographics pdf. Use them to share invaluable insights on client acquisition cost measurement metrices and impress your audience. This template can be altered and modified as per your expectations. So, grab it now.
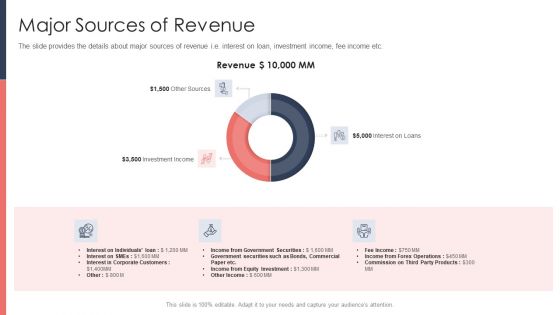
Pitch Deck For Fundraising From Post Market Financing Major Sources Of Revenue Infographics PDF
The slide provides forecasted free cash flow of the company for next five years. It provides forecasted data for Revenue, EBITDA, EBIT, Capital Expenditure, Depreciation and Amortization etc.Deliver an awe-inspiring pitch with this creative pitch deck for fundraising from post market financing major sources of revenue infographics pdf bundle. Topics like revenue, interest on loans, investment income can be discussed with this completely editable template. It is available for immediate download depending on the needs and requirements of the user.
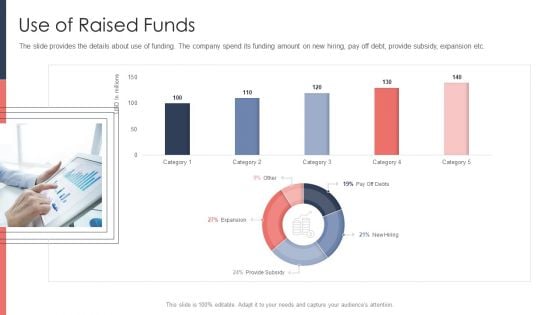
Pitch Deck For Fundraising From Post Market Financing Use Of Raised Funds Infographics PDF
The slide provides the details about use of funding. The company spend its funding amount on new hiring, pay off debt, provide subsidy, expansion etc.Deliver an awe-inspiring pitch with this creative pitch deck for fundraising from post market financing use of raised funds infographics pdf bundle. Topics like use of raised funds can be discussed with this completely editable template. It is available for immediate download depending on the needs and requirements of the user.
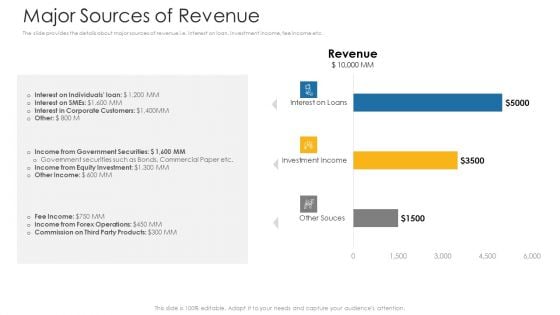
Private Equity Fundraising Investor Presentation Major Sources Of Revenue Ppt Infographics Example File PDF
The slide provides the details about major sources of revenue i.e. interest on loan, investment income, fee income etc. Deliver an awe-inspiring pitch with this creative private equity fundraising investor presentation major sources of revenue ppt infographics example file pdf. bundle. Topics like major sources of revenue can be discussed with this completely editable template. It is available for immediate download depending on the needs and requirements of the user.
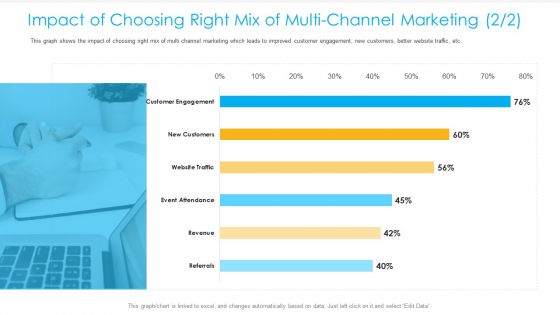
Unified Business Consumer Marketing Strategy Impact Choosing Right Mix Multi Channel Marketing Engagement Infographics PDF
This graph shows the impact of choosing right mix of multi channel marketing which leads to improved customer engagement, new customers, better website traffic, etc.Deliver an awe inspiring pitch with this creative unified business consumer marketing strategy impact choosing right mix multi channel marketing engagement infographics pdf bundle. Topics like customer engagement, new customers, event attendance can be discussed with this completely editable template. It is available for immediate download depending on the needs and requirements of the user.
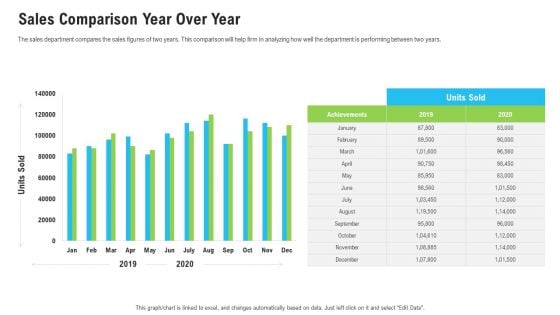
Sales Department Strategies Increase Revenues Sales Comparison Year Over Year Infographics PDF
The sales department compares the sales figures of two years. This comparison will help firm in analyzing how well the department is performing between two years. Deliver an awe-inspiring pitch with this creative sales department strategies increase revenues sales comparison year over year infographics pdf bundle. Topics like sales comparison year over year can be discussed with this completely editable template. It is available for immediate download depending on the needs and requirements of the user.
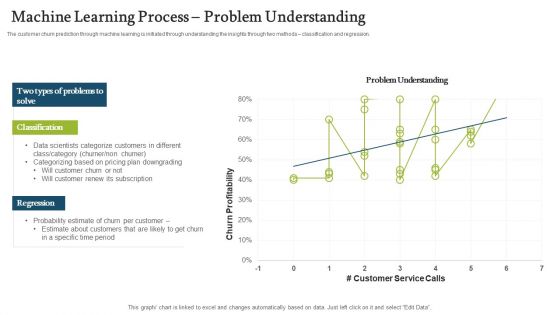
Forecasting And Managing Consumer Attrition For Business Advantage Machine Learning Process Problem Understanding Infographics PDF
The customer churn prediction through machine learning is initiated through understanding the insights through two methods classification and regression.Deliver and pitch your topic in the best possible manner with this forecasting and managing consumer attrition for business advantage machine learning process problem understanding infographics pdf Use them to share invaluable insights on classification, regression, churn profitability and impress your audience. This template can be altered and modified as per your expectations. So, grab it now.
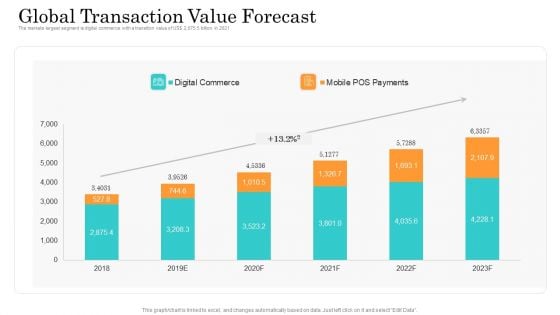
Online Payment Service Global Transaction Value Forecast Ppt Infographics Ideas PDF
The markets largest segment is digital commerce with a transition value of US dollar 2,875.5 billion in 2021. Deliver an awe-inspiring pitch with this creative online payment service global transaction value forecast ppt infographics ideas pdf bundle. Topics like global transaction value forecast can be discussed with this completely editable template. It is available for immediate download depending on the needs and requirements of the user.
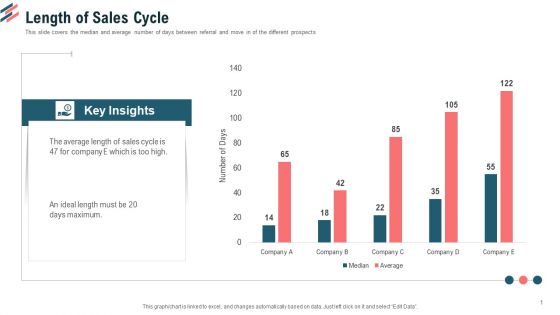
Essential Steps To Draft Sales Strategy Length Of Sales Cycle Ppt Infographics Visuals PDF
This slide covers the median and average number of days between referral and move in of the different prospects.Deliver and pitch your topic in the best possible manner with this essential steps to draft sales strategy length of sales cycle ppt infographics visuals pdf. Use them to share invaluable insights on length of sales cycle and impress your audience. This template can be altered and modified as per your expectations. So, grab it now.
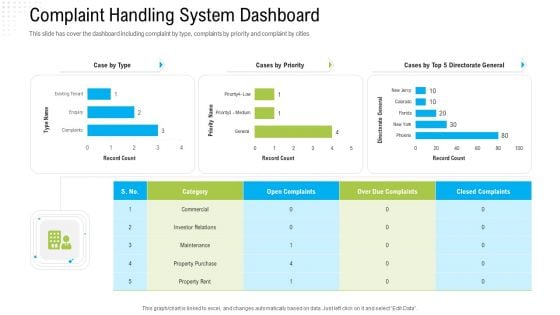
Robotization In Issues Management Complaint Handling System Dashboard Ppt Infographics Slides PDF
This slide has cover the dashboard including complaint by type, complaints by priority and complaint by cities. Deliver and pitch your topic in the best possible manner with this robotization in issues management complaint handling system dashboard ppt infographics slides pdf. Use them to share invaluable insights on property purchase, cases by priority, category and impress your audience. This template can be altered and modified as per your expectations. So, grab it now.
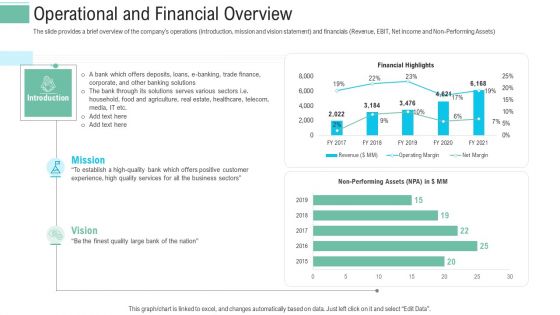
Pitch Presentation Raise Money Spot Market Operational And Financial Overview Ppt Infographics Guide PDF
The slide provides a brief overview of the companys operations introduction, mission and vision statement and financials Revenue, EBIT, Net income and Non Performing Assets. Deliver an awe-inspiring pitch with this creative pitch presentation raise money spot market operational and financial overview ppt infographics guide pdf bundle. Topics like performing assets, mission, vision can be discussed with this completely editable template. It is available for immediate download depending on the needs and requirements of the user.
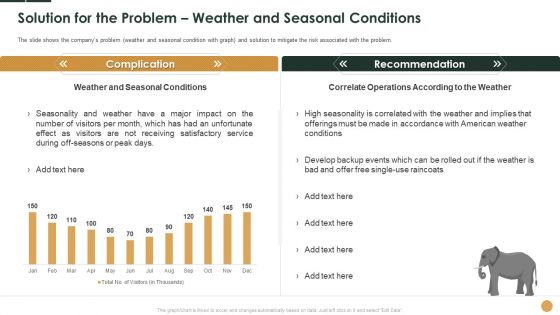
Solution For The Problem Weather And Seasonal Conditions Ppt Infographics Background Images PDF
The slide shows the companys problem weather and seasonal condition with graph and solution to mitigate the risk associated with the problem. Deliver and pitch your topic in the best possible manner with this solution for the problem weather and seasonal conditions ppt infographics background images pdf. Use them to share invaluable insights on weather and seasonal conditions, recommendation and impress your audience. This template can be altered and modified as per your expectations. So, grab it now.
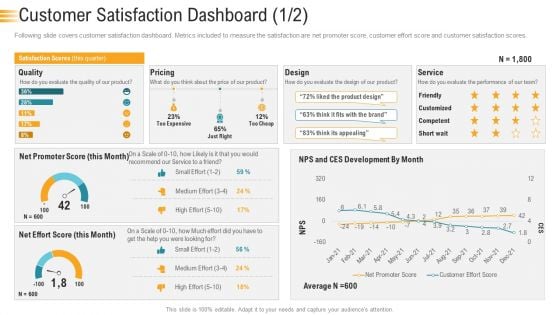
Establishing An Efficient Integrated Marketing Communication Process Customer Satisfaction Dashboard Expensive Infographics PDF
Following slide covers customer satisfaction dashboard. Metrics included to measure the satisfaction are net promoter score, customer effort score and customer satisfaction scores. Deliver an awe inspiring pitch with this creative establishing an efficient integrated marketing communication process customer satisfaction dashboard expensive infographics pdf bundle. Topics like customer satisfaction dashboard can be discussed with this completely editable template. It is available for immediate download depending on the needs and requirements of the user.
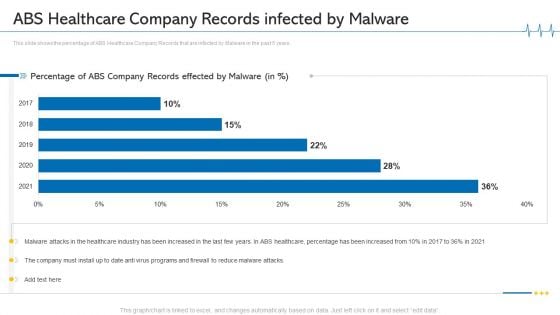
ABS Healthcare Company Records Infected By Malware Ppt File Infographics PDF
This slide shows the percentage of ABS Healthcare Company Records that are infected by Malware in the past 5 years. Deliver an awe inspiring pitch with this creative ABS healthcare company records infected by malware ppt file infographics pdf bundle. Topics like ABS healthcare company records infected by malware, 2017 to 2021 can be discussed with this completely editable template. It is available for immediate download depending on the needs and requirements of the user.
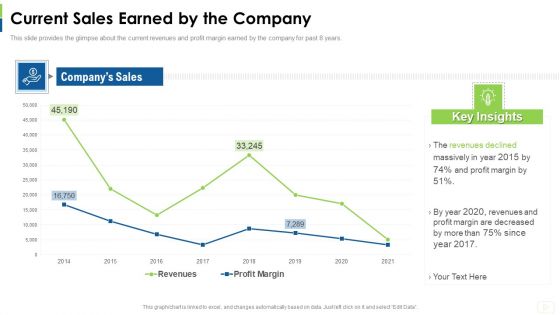
Social Platform As Profession Current Sales Earned By The Company Infographics PDF
This slide provides the glimpse about the customer and market churn rate wherein customer position is evaluated along with market status. Deliver an awe inspiring pitch with this creative social platform as profession current sales earned by the company infographics pdf bundle. Topics like current sales earned by the company can be discussed with this completely editable template. It is available for immediate download depending on the needs and requirements of the user.
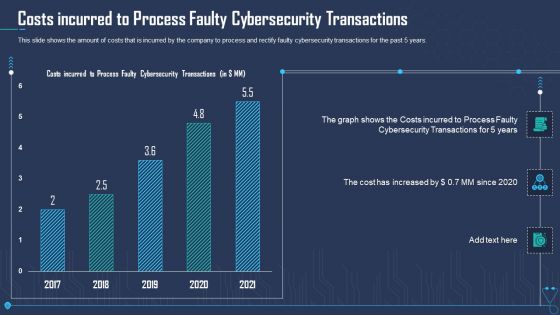
Costs Incurred To Process Faulty Cybersecurity Transactions Ppt Infographics Smartart PDF
This slide shows the amount of costs that is incurred by the company to process and rectify faulty cybersecurity transactions for the past 5 years. Deliver an awe inspiring pitch with this creative costs incurred to process faulty cybersecurity transactions ppt infographics smartart pdf bundle. Topics like costs incurred to process faulty cybersecurity transactions can be discussed with this completely editable template. It is available for immediate download depending on the needs and requirements of the user.
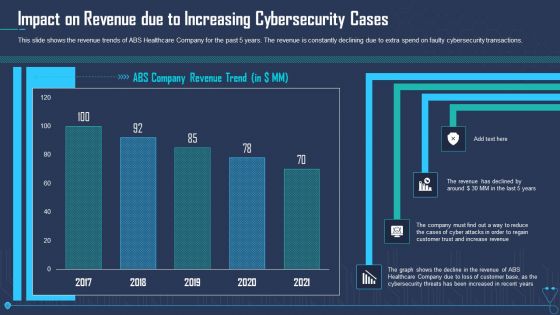
Impact On Revenue Due To Increasing Cybersecurity Cases Ppt Inspiration Infographics PDF
This slide shows the revenue trends of ABS Healthcare Company for the past 5 years. The revenue is constantly declining due to extra spend on faulty cybersecurity transactions. Deliver an awe inspiring pitch with this creative impact on revenue due to increasing cybersecurity cases ppt inspiration infographics pdf bundle. Topics like impact on revenue due to increasing cybersecurity cases can be discussed with this completely editable template. It is available for immediate download depending on the needs and requirements of the user.
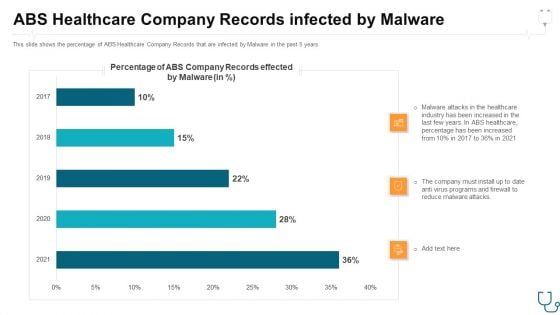
Abs Healthcare Company Records Infected By Malware Ppt Infographics Rules PDF
This slide shows the percentage of ABS Healthcare Company Records that are infected by Malware in the past 5 years. Deliver an awe-inspiring pitch with this creative abs healthcare company records infected by malware ppt infographics rules pdf. bundle. Topics like abs healthcare company records infected by malware can be discussed with this completely editable template. It is available for immediate download depending on the needs and requirements of the user.
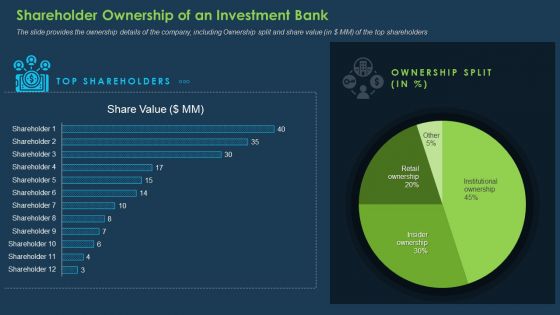
Commercial Banking Template Collection Shareholder Ownership Of An Investment Bank Infographics PDF
The slide provides the ownership details of the company, including Ownership split and share value in dollar MM of the top shareholders. Deliver an awe-inspiring pitch with this creative commercial banking template collection shareholder ownership of an investment bank infographics pdf bundle. Topics like shareholder ownership of an investment bank can be discussed with this completely editable template. It is available for immediate download depending on the needs and requirements of the user.
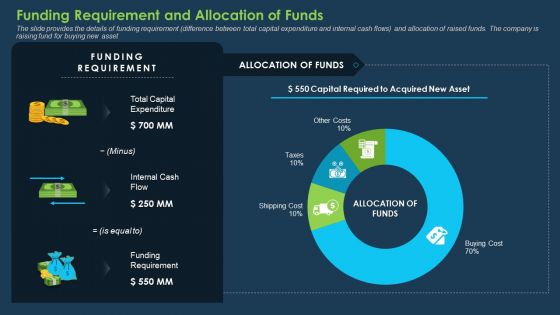
Commercial Banking Template Collection Funding Requirement And Allocation Of Funds Infographics PDF
The slide provides the details of funding requirement difference between total capital expenditure and internal cash flows and allocation of raised funds. The company is raising fund for buying new asset. Deliver an awe-inspiring pitch with this creative commercial banking template collection funding requirement and allocation of funds infographics pdf bundle. Topics like capital expenditure, internal cash flow, funding requirement can be discussed with this completely editable template. It is available for immediate download depending on the needs and requirements of the user.
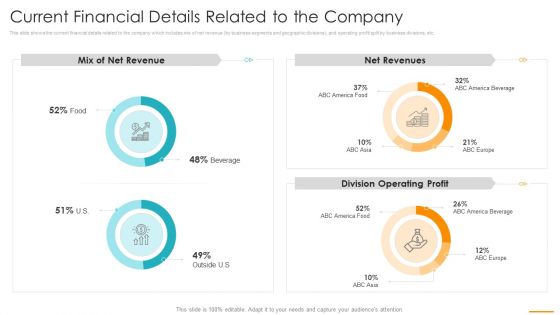
Current Financial Details Related To The Company Ppt Infographics Show PDF
This slide shows the current financial details related to the company which includes mix of net revenue by business segments and geographic divisions, and operating profit split by business divisions, etc. Deliver an awe inspiring pitch with this creative current financial details related to the company ppt infographics show pdf bundle. Topics like net revenue, operating profit, beverage can be discussed with this completely editable template. It is available for immediate download depending on the needs and requirements of the user.
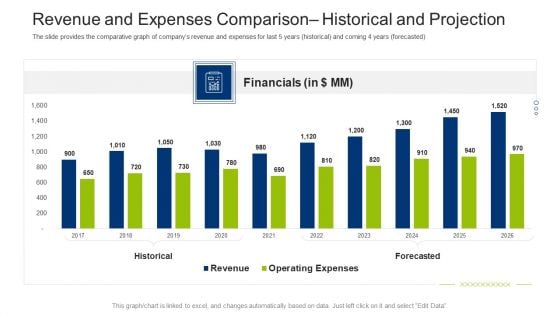
Investment Fundraising Pitch Deck From Stock Market Revenue And Expenses Comparison Historical And Projection Infographics PDF
The slide provides the comparative graph of companys revenue and expenses for last 5 years historical and coming 4 years forecasted. Deliver an awe inspiring pitch with this creative investment fundraising pitch deck from stock market revenue and expenses comparison historical and projection infographics pdf bundle. Topics like financials, historical, forecasted, revenue, expenses can be discussed with this completely editable template. It is available for immediate download depending on the needs and requirements of the user.
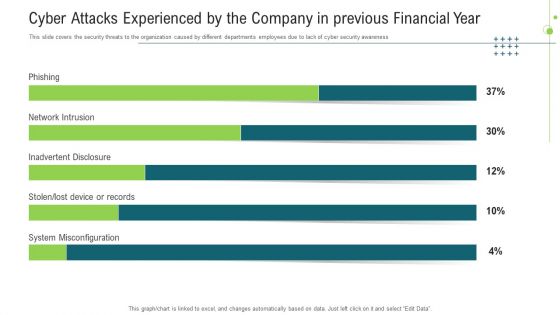
Cyber Attacks Experienced By The Company In Previous Financial Year Ppt Infographics PDF
This slide covers the security threats to the organization caused by different departments employees due to lack of cyber security awareness. Deliver an awe inspiring pitch with this creative cyber attacks experienced by the company in previous financial year ppt infographics pdf bundle. Topics like cyber attacks experienced by the company in previous financial year can be discussed with this completely editable template. It is available for immediate download depending on the needs and requirements of the user.
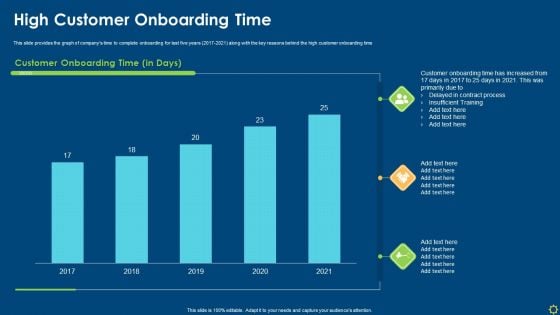
Improving Organizational Process Client Induction Procedure High Customer Onboarding Time Infographics PDF
This slide provides the graph of companys time to complete onboarding for last five years 2017-2021 along with the key reasons behind the high customer onboarding time Deliver and pitch your topic in the best possible manner with this improving organizational process client induction procedure high customer onboarding time infographics pdf. Use them to share invaluable insights on customer onboarding time, process, insufficient training and impress your audience. This template can be altered and modified as per your expectations. So, grab it now.
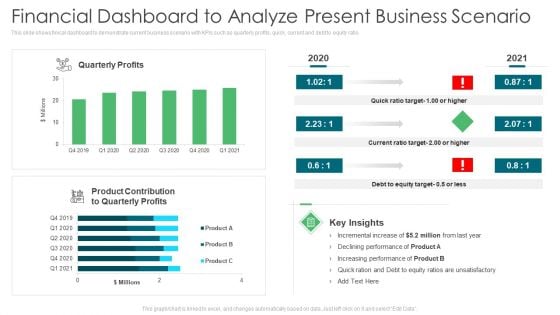
Environmental Assessment Financial Dashboard To Analyze Present Business Scenario Ppt Infographics Ideas PDF
This slide shows finical dashboard to demonstrate current business scenario with KPIs such as quarterly profits, quick, current and debt to equity ratio. Deliver an awe inspiring pitch with this creative environmental assessment financial dashboard to analyze present business scenario ppt infographics ideas pdf bundle. Topics like product contribution, increasing performance, equity target can be discussed with this completely editable template. It is available for immediate download depending on the needs and requirements of the user.
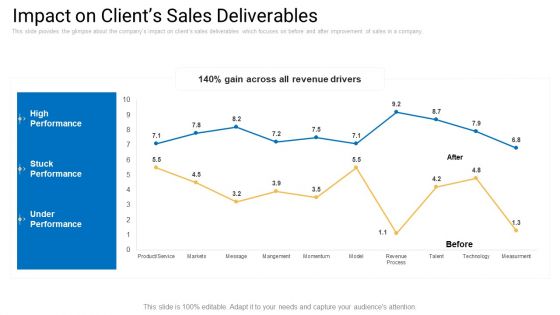
Sales Management Advisory Service Impact On Clients Sales Deliverables Infographics PDF
This slide provides the glimpse about the companys impact on clients sales deliverables which focuses on before and after improvement of sales in a company. Deliver and pitch your topic in the best possible manner with this sales management advisory service impact on clients sales deliverables infographics pdf. Use them to share invaluable insights on impact on clients sales deliverables and impress your audience. This template can be altered and modified as per your expectations. So, grab it now.
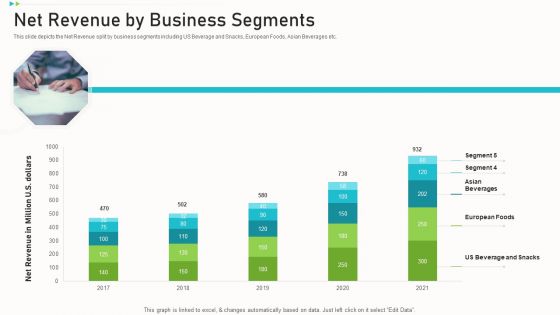
Pitch Deck Ppt Raise Funding Corporate Investors Net Revenue By Business Segments Infographics PDF
This slide depicts the Net Revenue split by business segments including US Beverage and Snacks, European Foods, Asian Beverages etc. Deliver and pitch your topic in the best possible manner with this pitch deck ppt raise funding corporate investors net revenue by business segments infographics pdf. Use them to share invaluable insights on net revenue by business segments and impress your audience. This template can be altered and modified as per your expectations. So, grab it now.
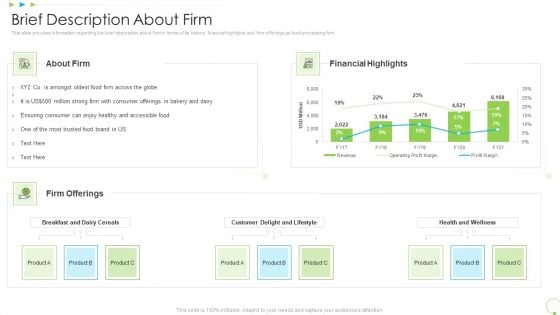
Brief Description About Firm Uplift Food Production Company Quality Standards Infographics PDF
This slide provides information regarding the brief description about firm in terms of its history, financial highlights and firm offerings as food processing firm. Deliver and pitch your topic in the best possible manner with this brief description about firm uplift food production company quality standards infographics pdf. Use them to share invaluable insights on financial, lifestyle, health and wellness and impress your audience. This template can be altered and modified as per your expectations. So, grab it now.
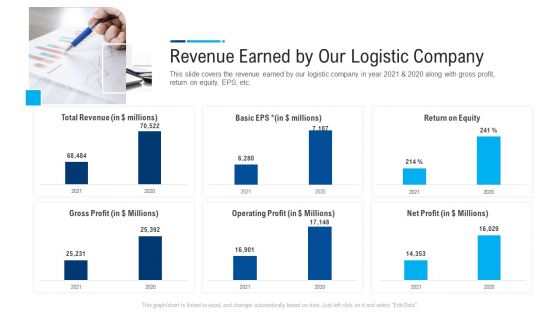
Internal And External Logistics Management Procedure Revenue Earned By Our Logistic Company Infographics PDF
This slide covers the revenue earned by our logistic company in year 2021 and 2020 along with gross profit, return on equity, EPS, etc. Deliver an awe inspiring pitch with this creative internal and external logistics management procedure revenue earned by our logistic company infographics pdf bundle. Topics like total revenue, gross profit, operating profit, return on equity can be discussed with this completely editable template. It is available for immediate download depending on the needs and requirements of the user.

Music Streaming App Market Share Of Major Music Streaming App Existing Across Globe Infographics PDF
This slide caters details about market share of major competitors existing in market across globe. Deliver an awe inspiring pitch with this creative music streaming app market share of major music streaming app existing across globe infographics pdf bundle. Topics like market share of major music streaming app existing across globe can be discussed with this completely editable template. It is available for immediate download depending on the needs and requirements of the user.
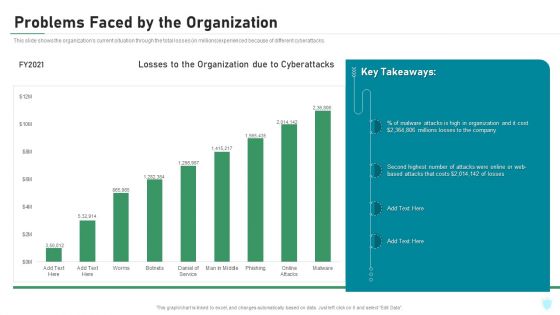
Problems Faced By The Organization IT Security IT Ppt Infographics Graphics PDF
This slide shows the organizations current situation through the total losses in millions experienced because of different cyberattacks. Deliver and pitch your topic in the best possible manner with this problems faced by the organization it security it ppt infographics graphics pdf. Use them to share invaluable insights on problems faced by the organization and impress your audience. This template can be altered and modified as per your expectations. So, grab it now.
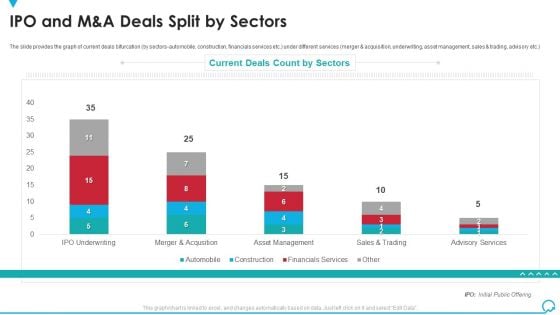
IPO And M And A Deals Split By Sectors Deal Pitchbook IPO Infographics PDF
The slide provides the graph of current deals bifurcation by sectors automobile, construction, financials services etc. under different services merger and acquisition, underwriting, asset management, sales and trading, advisory etc. Deliver an awe inspiring pitch with this creative ipo and m and a deals split by sectors deal pitchbook ipo infographics pdf bundle. Topics like financials services, sales, management can be discussed with this completely editable template. It is available for immediate download depending on the needs and requirements of the user.
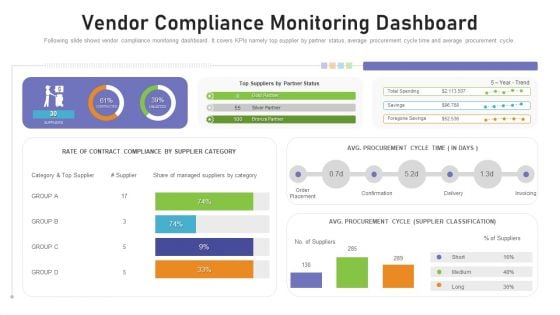
Benchmarking Supplier Operation Control Procedure Vendor Compliance Monitoring Dashboard Infographics PDF
Following slide shows vendor compliance monitoring dashboard. It covers KPIs namely top supplier by partner status, average procurement cycle time and average procurement cycle. Deliver and pitch your topic in the best possible manner with this benchmarking supplier operation control procedure vendor compliance monitoring dashboard infographics pdf. Use them to share invaluable insights on confirmation, supplier, monitoring dashboard and impress your audience. This template can be altered and modified as per your expectations. So, grab it now.
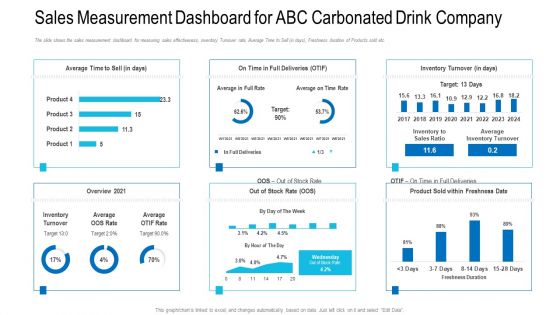
Sales Measurement Dashboard For ABC Carbonated Drink Company Ppt Infographics Ideas PDF
The slide shows the sales measurement dashboard for measuring sales effectiveness, Inventory Turnover rate, Average Time to Sell in days, Freshness duration of Products sold etc. Deliver and pitch your topic in the best possible manner with this sales measurement dashboard for abc carbonated drink company ppt infographics ideas pdf. Use them to share invaluable insights on average time, inventory turnover, product and impress your audience. This template can be altered and modified as per your expectations. So, grab it now.
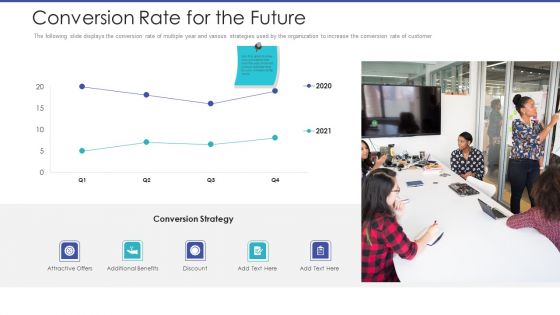
Tactical Planning For Marketing And Commercial Advancement Conversion Rate For The Future Infographics PDF
The following slide displays the conversion rate of multiple year and various strategies used by the organization to increase the conversion rate of customer. Deliver and pitch your topic in the best possible manner with this tactical planning for marketing and commercial advancement conversion rate for the future infographics pdf. Use them to share invaluable insights on attractive offers, additional benefits, discount and impress your audience. This template can be altered and modified as per your expectations. So, grab it now.
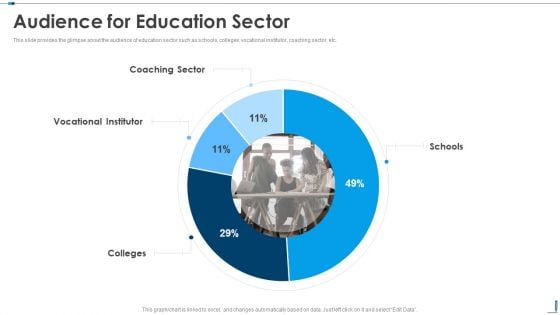
Audience For Education Sector Edutech Investor Capital Raising Pitch Deck Infographics PDF
This slide provides the glimpse about the audience of education sector such as schools, colleges, vocational institutor, coaching sector, etc. Deliver and pitch your topic in the best possible manner with this audience for education sector edutech investor capital raising pitch deck infographics pdf. Use them to share invaluable insights on audience for education sector and impress your audience. This template can be altered and modified as per your expectations. So, grab it now.
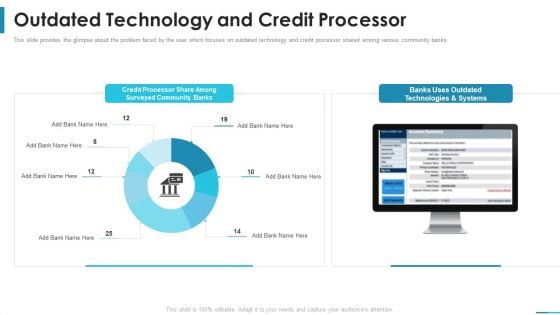
Outdated Technology And Credit Processor Series B Round Venture Funding Ppt Infographics Good PDF
This slide provides the glimpse about the problem faced by the user which focuses on outdated technology and credit processor shared among various community banks. Deliver an awe inspiring pitch with this creative outdated technology and credit processor series b round venture funding ppt infographics good pdf bundle. Topics like processor, surveyed, community, technologies can be discussed with this completely editable template. It is available for immediate download depending on the needs and requirements of the user.
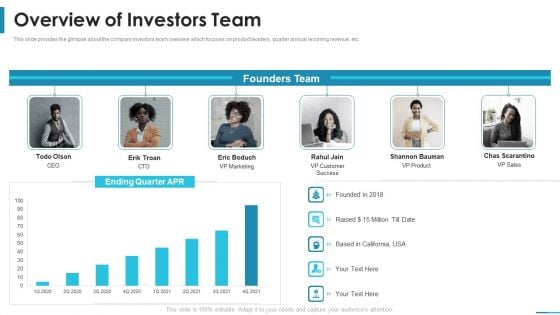
Overview Of Investors Team Series B Round Venture Funding Ppt Infographics Files PDF
This slide provides the glimpse about the company investors team overview which focuses on product leaders, quarter annual recurring revenue, etc. Deliver and pitch your topic in the best possible manner with this overview of investors team series b round venture funding ppt infographics files pdf. Use them to share invaluable insights on overview of investors team and impress your audience. This template can be altered and modified as per your expectations. So, grab it now.

 Home
Home