Infographic Icons
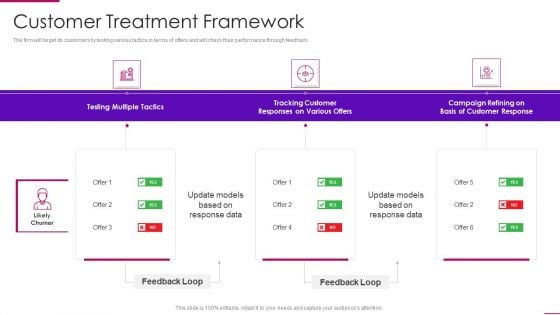
Strategies To Improve Marketing Competency Of Business Customer Treatment Framework Infographics PDF
The firm will target its customers by testing various tactics in terms of offers and will check their performance through feedback Deliver an awe inspiring pitch with this creative strategies to improve marketing competency of business customer treatment framework infographics pdf bundle. Topics like customer treatment framework can be discussed with this completely editable template. It is available for immediate download depending on the needs and requirements of the user.
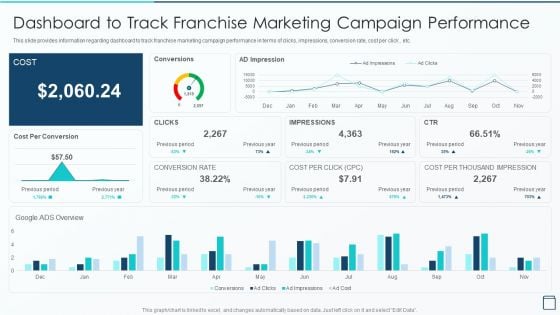
Effective Franchise Marketing Strategy Dashboard To Track Franchise Marketing Infographics PDF
This slide provides information regarding dashboard to track franchise marketing campaign performance in terms of clicks, impressions, conversion rate, cost per click , etc. Deliver and pitch your topic in the best possible manner with this Effective Franchise Marketing Strategy Dashboard To Track Franchise Marketing Infographics PDF Use them to share invaluable insights on Dashboard To Track Franchise Marketing Campaign Performance and impress your audience. This template can be altered and modified as per your expectations. So, grab it now.
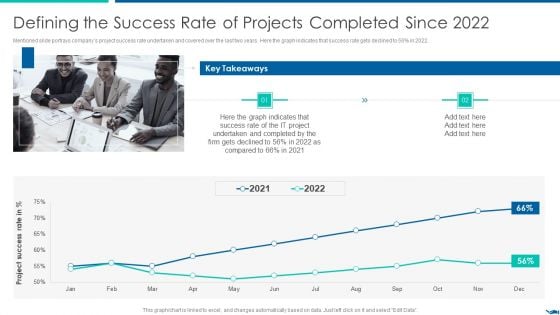
Project QA Through Agile Methodology IT Defining The Success Rate Infographics PDF
Mentioned slide portrays companys project success rate undertaken and covered over the last two years. Here the graph indicates that success rate gets declined to 56percent in 2022.Deliver an awe inspiring pitch with this creative Project QA Through Agile Methodology IT Defining The Success Rate Infographics PDF bundle. Topics like Defining The Success Rate Of Projects Completed Since 2022 can be discussed with this completely editable template. It is available for immediate download depending on the needs and requirements of the user.
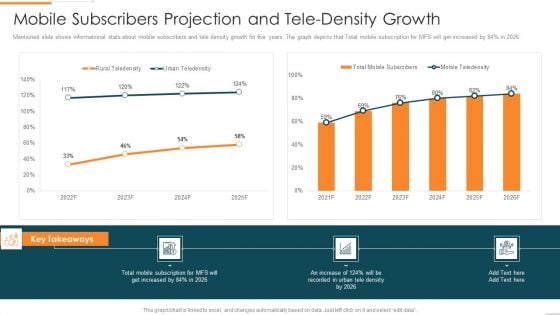
Enhanced Customer Banking Experience With Mobile Mobile Subscribers Projection Infographics PDF
Mentioned slide shows informational stats about mobile subscribers and tele density growth for five years. The graph depicts that Total mobile subscription for MFS will get increased by 84percent in 2026.Deliver an awe inspiring pitch with this creative Enhanced Customer Banking Experience With Mobile Mobile Subscribers Projection Infographics PDF bundle. Topics like Mobile Subscribers Projection And Tele-Density Growth can be discussed with this completely editable template. It is available for immediate download depending on the needs and requirements of the user.
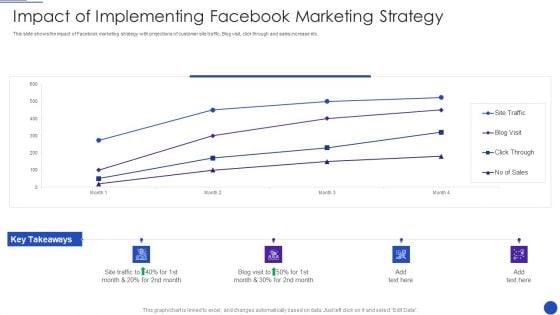
Facebook Marketing Strategies For Small Enterprise Impact Of Implementing Facebook Marketing Infographics PDF
This slide shows the impact of Facebook marketing strategy with projections of customer site traffic, Blog visit, click through and sales increase etc.Deliver an awe inspiring pitch with this creative Facebook Marketing Strategies For Small Enterprise Impact Of Implementing Facebook Marketing Infographics PDF bundle. Topics like Impact Of Implementing Facebook Marketing Strategy can be discussed with this completely editable template. It is available for immediate download depending on the needs and requirements of the user.
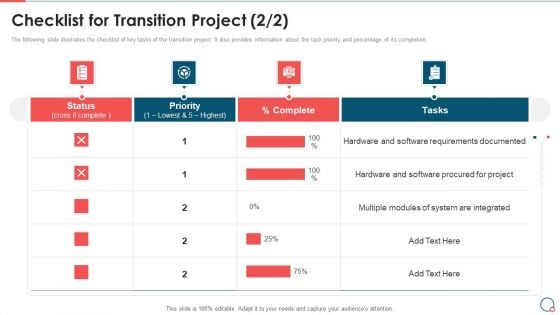
Checklist For Transition Project Information Technology Change Implementation Plan Infographics PDF
The following slide illustrates the checklist of key tasks of the transition project. It also provides information about the task priority and percentage of its completion. Deliver and pitch your topic in the best possible manner with this Checklist For Transition Project Information Technology Change Implementation Plan Infographics PDF. Use them to share invaluable insights on Status, Priority, Complete and impress your audience. This template can be altered and modified as per your expectations. So, grab it now.
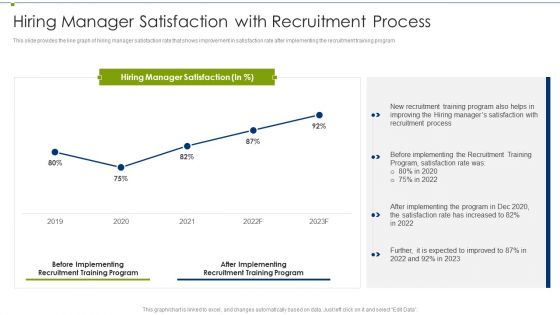
Recruitment Training Program For Workforce Hiring Manager Satisfaction With Recruitment Process Infographics PDF
This slide provides the line graph of hiring manager satisfaction rate that shows improvement in satisfaction rate after implementing the recruitment training program Deliver and pitch your topic in the best possible manner with this Recruitment Training Program For Workforce Hiring Manager Satisfaction With Recruitment Process Infographics PDF Use them to share invaluable insights on Recruitment Training Program, Improving The Hiring Managers, Recruitment Process and impress your audience. This template can be altered and modified as per your expectations. So, grab it now.
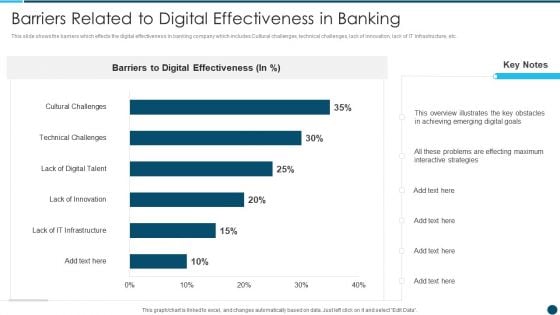
Digital Technology Adoption In Banking Industry Case Competition Barriers Related To Infographics PDF
This slide shows the barriers which effects the digital effectiveness in banking company which includes Cultural challenges, technical challenges, lack of innovation, lack of IT Infrastructure, etc.Deliver an awe inspiring pitch with this creative Digital Technology Adoption In Banking Industry Case Competition Barriers Related To Infographics PDF bundle. Topics like Achieving Emerging, Overview Illustrates, Problems Are Effecting can be discussed with this completely editable template. It is available for immediate download depending on the needs and requirements of the user.
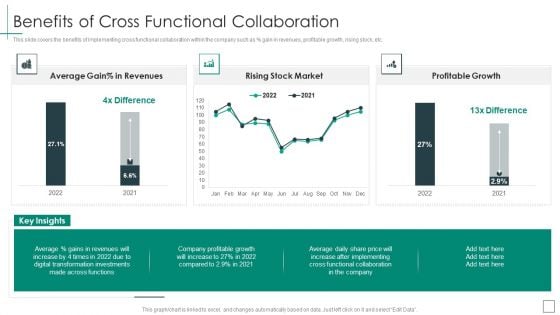
Cross Functional Teams Collaboration Benefits Of Cross Functional Collaboration Infographics PDF
This slide covers the benefits of implementing cross functional collaboration within the company such as percent gain in revenues, profitable growth, rising stock, etc. Deliver and pitch your topic in the best possible manner with this Cross Functional Teams Collaboration Benefits Of Cross Functional Collaboration Infographics PDF. Use them to share invaluable insights on Average Gain percent, Revenues Rising Stock, Market Profitable Growth and impress your audience. This template can be altered and modified as per your expectations. So, grab it now.
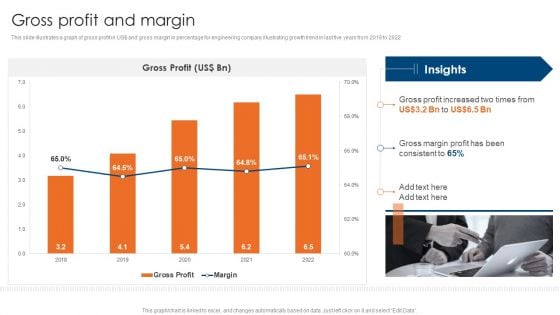
Engineering Consultancy Works Company Profile Gross Profit And Margin Infographics PDF
This slide illustrates a graph of gross profit in US doller and gross margin in percentage for engineering company illustrating growth trend in last five years from 2018 to 2022. Deliver an awe inspiring pitch with this creative Engineering Consultancy Works Company Profile Gross Profit And Margin Infographics PDF bundle. Topics like Gross Profit, Margin can be discussed with this completely editable template. It is available for immediate download depending on the needs and requirements of the user.
Essential Activities In Recruitment Process Tracking Dashboard Turnover Hiring New Employees At Workplace Infographics PDF
This slide provides information regarding tracking of essential activities associated to recruitment process and presented in dashboard. Deliver an awe inspiring pitch with this creative Essential Activities In Recruitment Process Tracking Dashboard Turnover Hiring New Employees At Workplace Infographics PDF bundle. Topics like Turnover Rate, Recruitment Conversion, Recruiting Funnel can be discussed with this completely editable template. It is available for immediate download depending on the needs and requirements of the user.
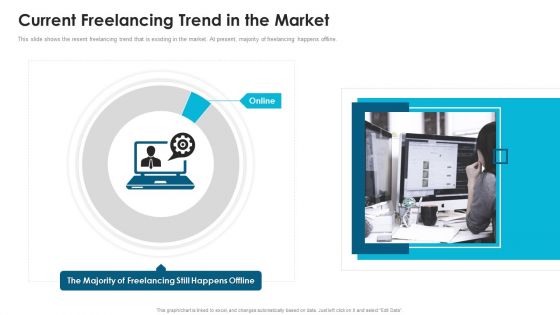
Fiverr Capital Fundraising Current Freelancing Trend In The Market Infographics PDF
This slide shows the resent freelancing trend that is existing in the market. At present, majority of freelancing happens offline. Deliver an awe inspiring pitch with this creative Fiverr Capital Fundraising Current Freelancing Trend In The Market Infographics PDF bundle. Topics like Online Majority Freelancing, Still Happens Offline can be discussed with this completely editable template. It is available for immediate download depending on the needs and requirements of the user.
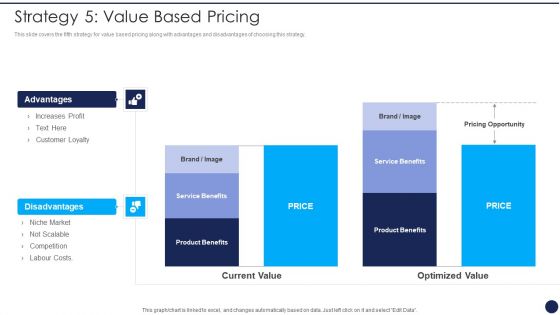
Product Pricing Strategies Analysis Strategy 5 Value Based Pricing Ppt Infographics Files PDF
This slide covers the fifth strategy for value based pricing along with advantages and disadvantages of choosing this strategy. Deliver an awe inspiring pitch with this creative Product Pricing Strategies Analysis Strategy 5 Value Based Pricing Ppt Infographics Files PDF bundle. Topics like Advantages Increases Profit, Customer Loyalty Disadvantages, Product Benefits Price can be discussed with this completely editable template. It is available for immediate download depending on the needs and requirements of the user.
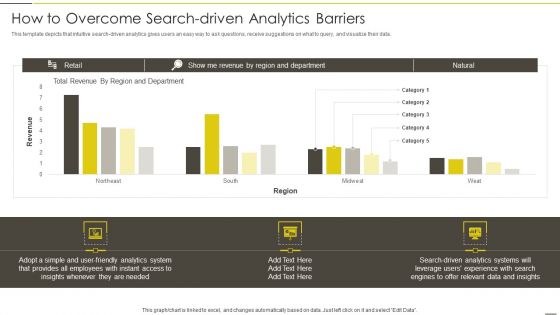
Administered Data And Analytic Quality Playbook How To Overcome Search Driven Analytics Barriers Infographics PDF
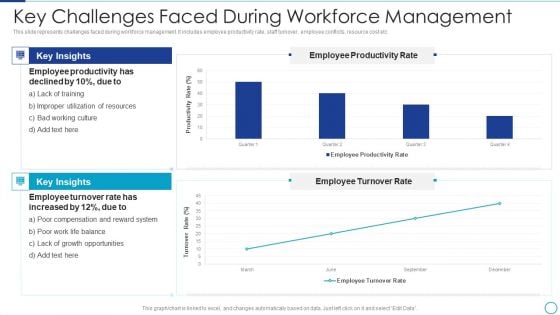
Workforce Management Strategies For Effective Hiring Process Key Challenges Faced During Infographics Microsoft PDF
This slide represents challenges faced during workforce management. It includes employee productivity rate, staff turnover, employee conflicts, resource cost etc. Deliver and pitch your topic in the best possible manner with this Workforce Management Strategies For Effective Hiring Process Key Challenges Faced During Infographics Microsoft PDF. Use them to share invaluable insights on Workforce Management, Employee Productivity, Employee Turnover and impress your audience. This template can be altered and modified as per your expectations. So, grab it now.
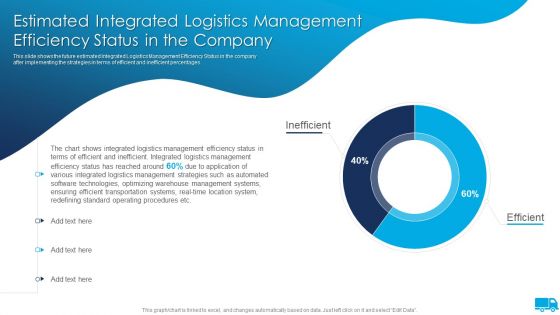
Strategies For Integrated Logistics Management Enhancing Order Efficiency Estimated Integrated Logistics Infographics PDF
This slide shows the future estimated Integrated Logistics Management Efficiency Status in the company after implementing the strategies in terms of efficient and inefficient percentages.Deliver an awe inspiring pitch with this creative Strategies For Integrated Logistics Management Enhancing Order Efficiency Estimated Integrated Logistics Infographics PDF bundle. Topics like Integrated Logistics, Inefficient Integrated, Various Integrated can be discussed with this completely editable template. It is available for immediate download depending on the needs and requirements of the user.
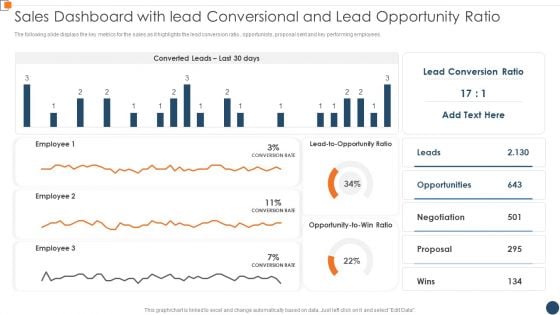
BANT Sales Lead Qualification Model Sales Dashboard With Lead Conversional And Lead Infographics PDF
The following slide displays the key metrics for the sales as it highlights the lead conversion ratio , opportunists, proposal sent and key performing employees. Deliver and pitch your topic in the best possible manner with this BANT Sales Lead Qualification Model Sales Dashboard With Lead Conversional And Lead Infographics PDF. Use them to share invaluable insights on Converted Leads, Lead Conversion, Employee Leads and impress your audience. This template can be altered and modified as per your expectations. So, grab it now.
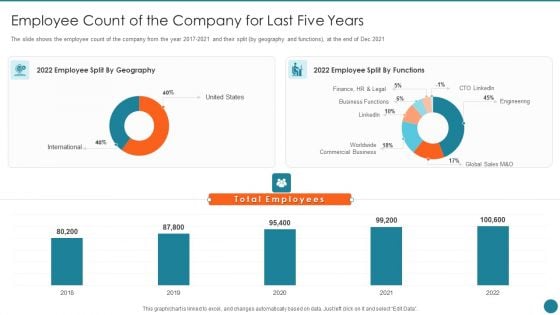
Business Overview Of An Information Technology Company Employee Count Of The Company Infographics PDF
The slide shows the employee count of the company from the year 2017 to 2021 and their split by geography and functions, at the end of Dec 2021 Deliver an awe inspiring pitch with this creative Business Overview Of An Information Technology Company Employee Count Of The Company Infographics PDF bundle. Topics like Employee Geography, Engineering, Business Functions can be discussed with this completely editable template. It is available for immediate download depending on the needs and requirements of the user.
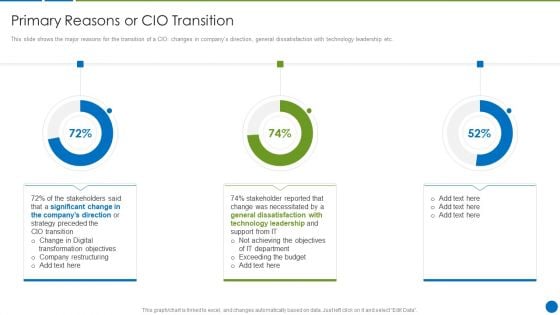
CIO Evolution To Improve Technology Plan For The Organization Primary Reasons Or CIO Transition Infographics PDF
This slide shows the major reasons for the transition of a CIO changes in companys direction, general dissatisfaction with technology leadership etc.Deliver and pitch your topic in the best possible manner with this CIO Evolution To Improve Technology Plan For The Organization Primary Reasons Or CIO Transition Infographics PDF Use them to share invaluable insights on General Dissatisfaction, Technology Leadership, Achieving The Objectives and impress your audience. This template can be altered and modified as per your expectations. So, grab it now.
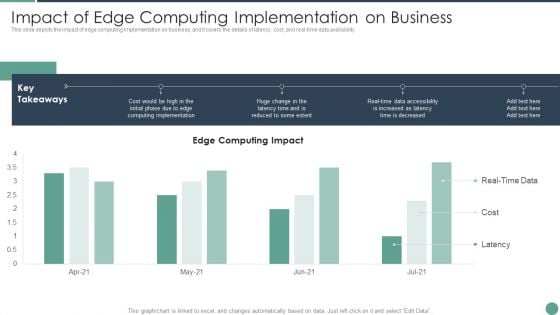
Distributed Computing Impact Of Edge Computing Implementation On Business Infographics PDF
This slide depicts the impact of edge computing implementation on business, and it covers the details of latency, cost, and real-time data availability.Deliver an awe inspiring pitch with this creative Distributed Computing Impact Of Edge Computing Implementation On Business Infographics PDF bundle. Topics like Computing Implementation, Increased Latency, Reduced Extent can be discussed with this completely editable template. It is available for immediate download depending on the needs and requirements of the user.
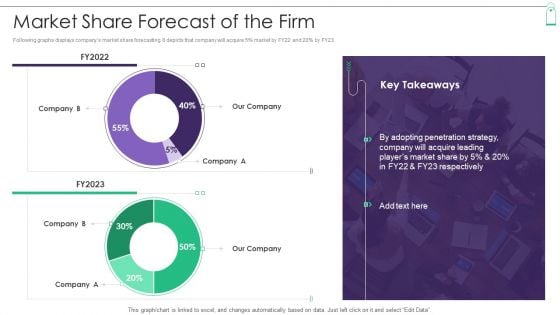
New Product Sales Strategy And Marketing Market Share Forecast Of The Firm Infographics PDF
Following graphs displays companys market share forecasting. It depicts that company will acquire 5 percent market by FY22 and 20 percent by FY23. Deliver and pitch your topic in the best possible manner with this New Product Sales Strategy And Marketing Market Share Forecast Of The Firm Infographics PDF. Use them to share invaluable insights on Market Share Forecast and impress your audience. This template can be altered and modified as per your expectations. So, grab it now.
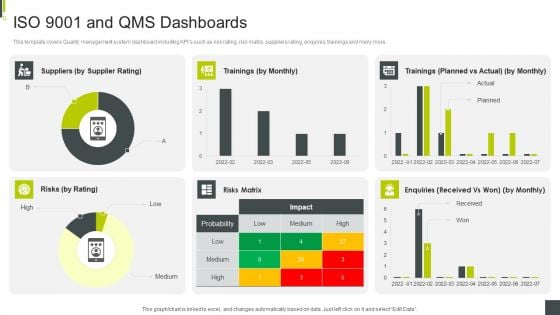
ISO 9001 And Qms Dashboards ISO 9001 Certification Procedure Infographics PDF
This template covers Quality management system dashboard including KPIs such as risk rating, risk matrix, suppliers rating, enquires, trainings and many more. Deliver an awe inspiring pitch with this creative ISO 9001 And Qms Dashboards ISO 9001 Certification Procedure Infographics PDF bundle. Topics like Risks Matrix, Probability, Planned can be discussed with this completely editable template. It is available for immediate download depending on the needs and requirements of the user.

ISO 9001 Quality Assurance Software Accreditation Business Quality Management And Audit Schedule Dashboard Infographics PDF
This template covers Quality management system dashboard including KPIs such as outstanding actions, scheduled audits, item to attend to, and immediate actions required. Deliver an awe inspiring pitch with this creative ISO 9001 Quality Assurance Software Accreditation Business Quality Management And Audit Schedule Dashboard Infographics PDF bundle. Topics like Customer Satisfaction, Management Review Meeting, Business Continuity can be discussed with this completely editable template. It is available for immediate download depending on the needs and requirements of the user.

Cios Methodologies To Improve IT Spending Determine Overall It Cost Breakdown Infographics PDF
This slide provides information regarding overall It cost breakdown and overspend assessment to determine major areas where cost are high, and budget is overspend. Deliver and pitch your topic in the best possible manner with this Cios Methodologies To Improve IT Spending Determine Overall It Cost Breakdown Infographics PDF Use them to share invaluable insights on Technician Utilization, Abandonment, Service Level and impress your audience. This template can be altered and modified as per your expectations. So, grab it now.
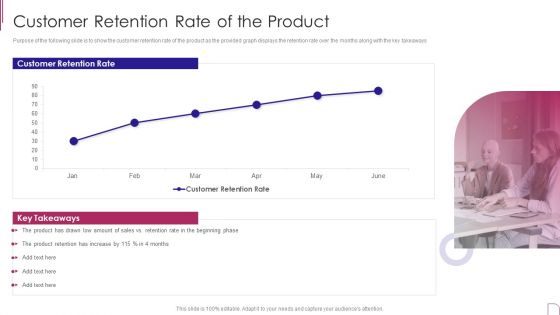
Yearly Product Performance Assessment Repor Customer Retention Rate Of The Product Infographics PDF
Purpose of the following slide is to show the customer retention rate of the product as the provided graph displays the retention rate over the months along with the key takeaways.Deliver an awe inspiring pitch with this creative Yearly Product Performance Assessment Repor Customer Retention Rate Of The Product Infographics PDF bundle. Topics like Customer Retention, Retention Increase, Retention Beginning can be discussed with this completely editable template. It is available for immediate download depending on the needs and requirements of the user.
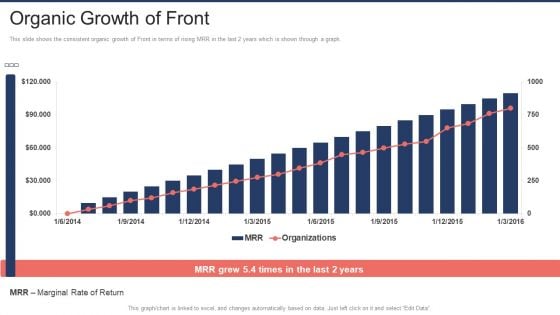
Front Capital Funding Organic Growth Of Front Ppt Inspiration Infographics PDF
This slide shows the consistent organic growth of Front in terms of rising MRR in the last 2 years which is shown through a graph. Deliver an awe inspiring pitch with this creative Front Capital Funding Organic Growth Of Front Ppt Inspiration Infographics PDF bundle. Topics like Marginal Rate Return, Organizations can be discussed with this completely editable template. It is available for immediate download depending on the needs and requirements of the user.
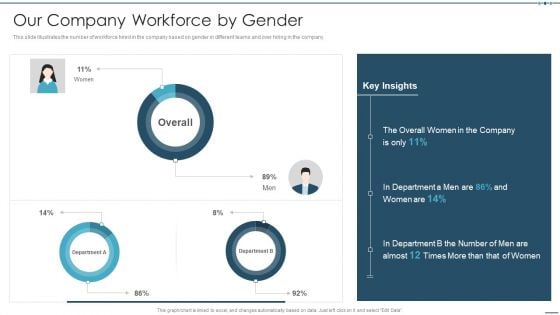
Setting Workplace Diversity And Inclusivity Objectives Our Company Workforce By Gender Infographics PDF
This slide illustrates the number of workforce hired in the company based on gender in different teams and over hiring in the company.Deliver an awe inspiring pitch with this creative Setting Workplace Diversity And Inclusivity Objectives Our Company Workforce By Gender Infographics PDF bundle. Topics like Overall Women, Department A Men, Overall can be discussed with this completely editable template. It is available for immediate download depending on the needs and requirements of the user.
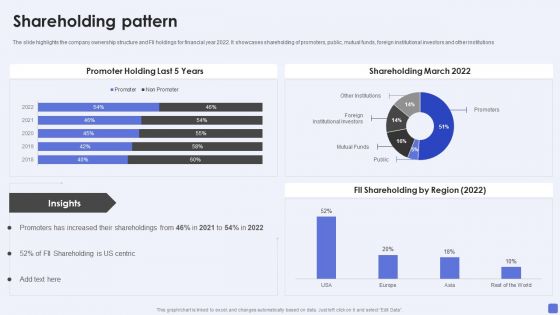
Software Services Business Profile Shareholding Pattern Ppt PowerPoint Presentation File Infographics PDF
The slide highlights the company ownership structure and FII holdings for financial year 2022. It showcases shareholding of promoters, public, mutual funds, foreign institutional investors and other institutions. Deliver an awe inspiring pitch with this creative Software Services Business Profile Shareholding Pattern Ppt PowerPoint Presentation File Infographics PDF bundle. Topics like Promoter Holding, Shareholding March 2022, Foreign Institutional Investors can be discussed with this completely editable template. It is available for immediate download depending on the needs and requirements of the user.
Remarketing Techniques Dashboard For Tracking Twitter Retargeting Campaign Tracking Infographics PDF
This slide covers metrics for analysing the results of Twitter retargeting campaigns. It includes KPIs such as click-through rate, impressions, conversion rate, cost, cost per click, etc. Deliver an awe inspiring pitch with this creative Remarketing Techniques Dashboard For Tracking Twitter Retargeting Campaign Tracking Infographics PDF bundle. Topics like Conversion Rate Cost, Cost Per Click, Platform Breakdown, Top Campaign can be discussed with this completely editable template. It is available for immediate download depending on the needs and requirements of the user.
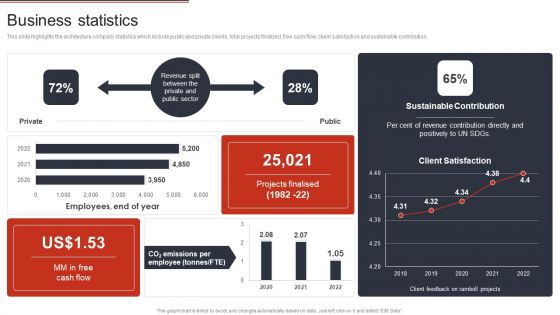
Building Design Firm Details Business Statistics Ppt Infographics Design Templates PDF
This slide highlights the architecture company statistics which include public and private clients, total projects finalized, free cash flow, client satisfaction and sustainable contribution. Deliver an awe inspiring pitch with this creative Building Design Firm Details Business Statistics Ppt Infographics Design Templates PDF bundle. Topics like Private, Sustainable Contribution, Employees can be discussed with this completely editable template. It is available for immediate download depending on the needs and requirements of the user.
VID Dashboard For Tracking Downloads In End User Computing Environment Infographics PDF
This slide represents the dashboard for tracking downloads of apps in end user computing environment by covering details of average patch time, quality updates and so on.Deliver an awe inspiring pitch with this creative VID Dashboard For Tracking Downloads In End User Computing Environment Infographics PDF bundle. Topics like Distribution Pilot, Average, Windows Devices can be discussed with this completely editable template. It is available for immediate download depending on the needs and requirements of the user.
KPI Dashboard For Tracking Hospitality And Tourism Management Plan Performance Infographics PDF
This slide shows the KPI dashboard for monitoring the performance of strategy implemented. It covers KPIs such as bookings, location, housekeeping, etc. Pitch your topic with ease and precision using this KPI Dashboard For Tracking Hospitality And Tourism Management Plan Performance Infographics PDF. This layout presents information on Booking Type, Housekeeping, Check In Guest. It is also available for immediate download and adjustment. So, changes can be made in the color, design, graphics or any other component to create a unique layout.
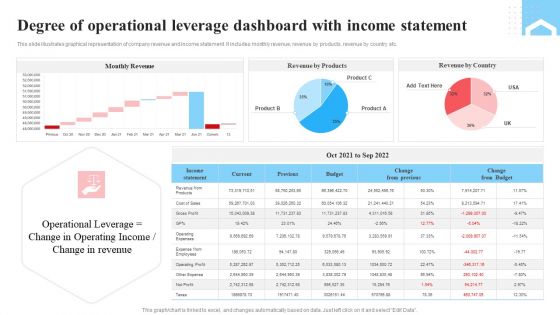
Degree Of Operational Leverage Dashboard With Income Statement Ppt Infographics Layout PDF
This slide illustrates graphical representation of company revenue and income statement. It includes monthly revenue, revenue by products, revenue by country etc. Pitch your topic with ease and precision using this Degree Of Operational Leverage Dashboard With Income Statement Ppt Infographics Layout PDF. This layout presents information on Monthly Revenue, Income Statement, Product. It is also available for immediate download and adjustment. So, changes can be made in the color, design, graphics or any other component to create a unique layout.
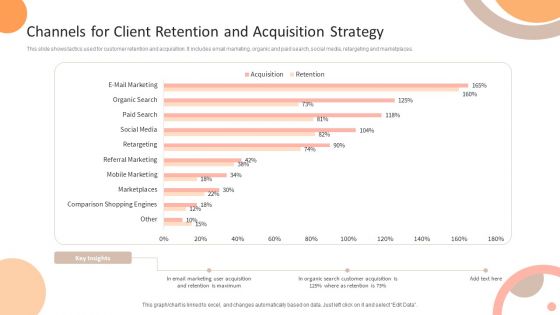
Channels For Client Retention And Acquisition Strategy Ppt Infographics Gridlines PDF
This slide shows tactics used for customer retention and acquisition. It includes email marketing, organic and paid search, social media, retargeting and marketplaces. Showcasing this set of slides titled Channels For Client Retention And Acquisition Strategy Ppt Infographics Gridlines PDF. The topics addressed in these templates are Marketplaces, Mobile Marketing, E Mail Marketing. All the content presented in this PPT design is completely editable. Download it and make adjustments in color, background, font etc. as per your unique business setting.
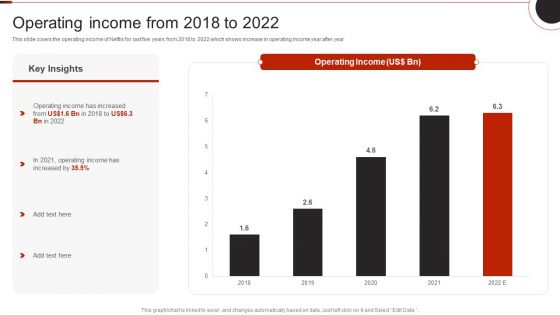
Netflix Company Outline Operating Income From 2018 To 2022 Infographics PDF
This slide covers the operating income of Netflix for last five years from 2018 to 2022 which shows increase in operating income year after year.Deliver an awe inspiring pitch with this creative Netflix Company Outline Operating Income From 2018 To 2022 Infographics PDF bundle. Topics like Operating Income, Key Insights, Operating Increased can be discussed with this completely editable template. It is available for immediate download depending on the needs and requirements of the user.
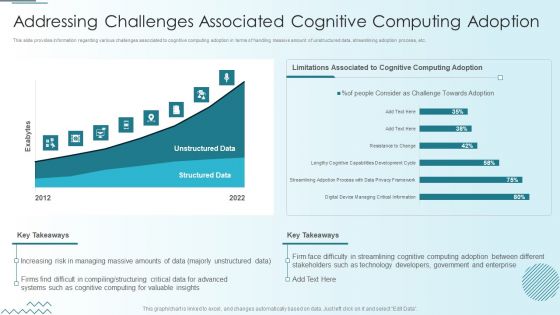
Computer Simulation Human Thinking Addressing Challenges Associated Cognitive Computing Infographics PDF
This slide provides information regarding various challenges associated to cognitive computing adoption in terms of handling massive amount of unstructured data, streamlining adoption process, etc. Deliver and pitch your topic in the best possible manner with this Computer Simulation Human Thinking Addressing Challenges Associated Cognitive Computing Infographics PDF. Use them to share invaluable insights on Limitations Associated, Cognitive Computing Adoption, Unstructured Data and impress your audience. This template can be altered and modified as per your expectations. So, grab it now.

How AI And Machine Learning Can Revolutionize Sales And Marketing Infographics PDF
This template covers the benefits of AI for the Sales and Marketing team. AI and Machine Learning benefits in the area of lead quality, engagement, and better understanding of buyer intent.Deliver an awe inspiring pitch with this creative How AI And Machine Learning Can Revolutionize Sales And Marketing Infographics PDF bundle. Topics like Anticipated Emotions, Strategies To Enhance, Index Recommend can be discussed with this completely editable template. It is available for immediate download depending on the needs and requirements of the user.
Online Customer Interaction Dashboard For Tracking Social Media Platforms Infographics PDF
This slide covers the KPI dashboard for analyzing social media channels. It includes metrics such as social media followers, Facebook daily reach, Facebook engaged users and page impressions, etc. Deliver and pitch your topic in the best possible manner with this Online Customer Interaction Dashboard For Tracking Social Media Platforms Infographics PDF. Use them to share invaluable insights on Awareness, Daily Reach, Impression Final and impress your audience. This template can be altered and modified as per your expectations. So, grab it now.
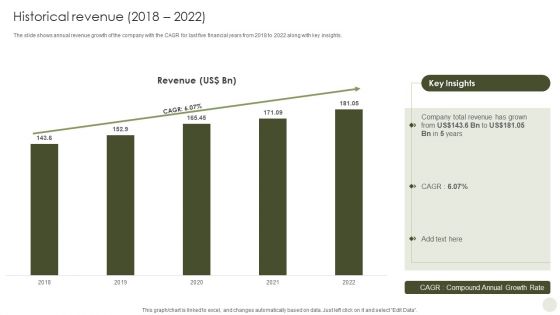
Commercial Bank Financial Services Company Profile Historical Revenue 2018 To 2022 Infographics PDF
The slide shows annual revenue growth of the company with the CAGR for last five financial years from 2018 to 2022 along with key insights. Deliver and pitch your topic in the best possible manner with this Commercial Bank Financial Services Company Profile Historical Revenue 2018 To 2022 Infographics PDF. Use them to share invaluable insights on Historical Revenue and impress your audience. This template can be altered and modified as per your expectations. So, grab it now.
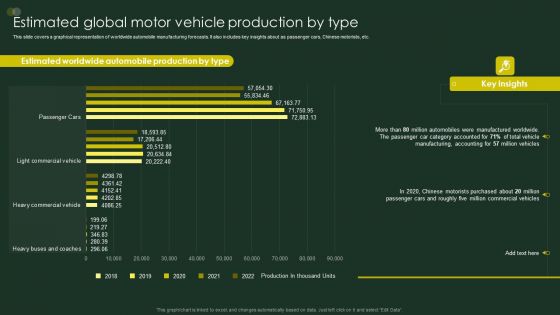
Global Automobile Sector Overview Estimated Global Motor Vehicle Production By Type Infographics PDF
This slide covers a graphical representation of worldwide automobile manufacturing forecasts. It also includes key insights about as passenger cars, Chinese motorists, etc. Deliver an awe inspiring pitch with this creative Global Automobile Sector Overview Estimated Global Motor Vehicle Production By Type Infographics PDF bundle. Topics like Estimated Worldwide, Automobile Production, Manufacturing Accounting can be discussed with this completely editable template. It is available for immediate download depending on the needs and requirements of the user.
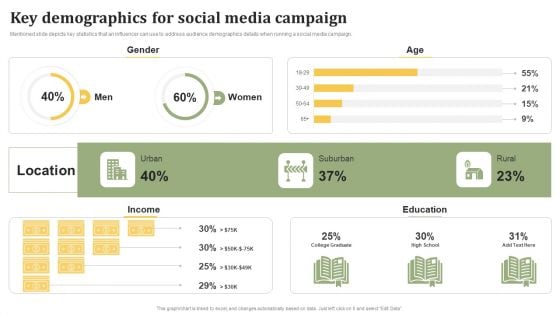
Influencer Advertising Toolkit Key Demographics For Social Media Campaign Infographics PDF
Mentioned slide depicts key statistics that an influencer can use to address audience demographics details when running a social media campaign. Deliver and pitch your topic in the best possible manner with this Influencer Advertising Toolkit Key Demographics For Social Media Campaign Infographics PDF. Use them to share invaluable insights on Key Demographics, Social Media, Campaign and impress your audience. This template can be altered and modified as per your expectations. So, grab it now.
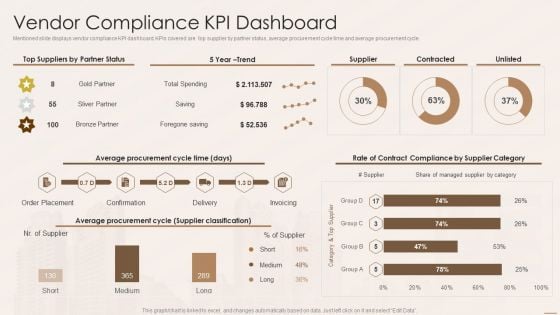
Real Estate Developers Funding Alternatives Vendor Compliance Kpi Dashboard Infographics PDF
Mentioned slide displays vendor compliance KPI dashboard. KPIs covered are top supplier by partner status, average procurement cycle time and average procurement cycle. Deliver and pitch your topic in the best possible manner with this Real Estate Developers Funding Alternatives Vendor Compliance Kpi Dashboard Infographics PDF. Use them to share invaluable insights on Average Procurement Cycle, Supplier Classification and impress your audience. This template can be altered and modified as per your expectations. So, grab it now.
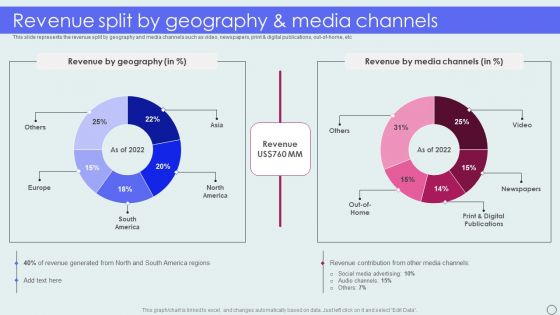
Advertising Solutions Company Details Revenue Split By Geography And Media Channels Infographics PDF
This slide represents the revenue split by geography and media channels such as video, newspapers, printand digital publications, out-of-home, etc. Deliver an awe inspiring pitch with this creative Advertising Solutions Company Details Revenue Split By Geography And Media Channels Infographics PDF bundle. Topics like Revenue Geography, Revenue Media Channels can be discussed with this completely editable template. It is available for immediate download depending on the needs and requirements of the user.
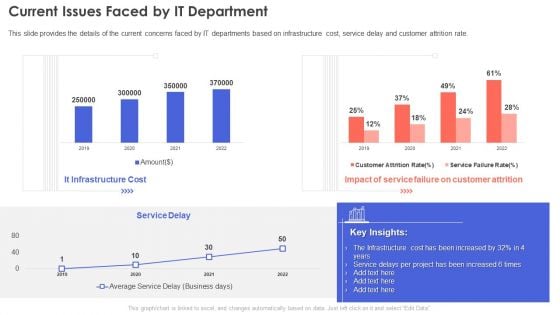
IT Infrastructure Management Current Issues Faced By IT Department Infographics PDF
This slide provides the details of the current concerns faced by IT departments based on infrastructure cost, service delay and customer attrition rate.Deliver and pitch your topic in the best possible manner with this IT Infrastructure Management Current Issues Faced By IT Department Infographics PDF. Use them to share invaluable insights on Infrastructure Cost, Service Failure, Customer Attrition and impress your audience. This template can be altered and modified as per your expectations. So, grab it now.
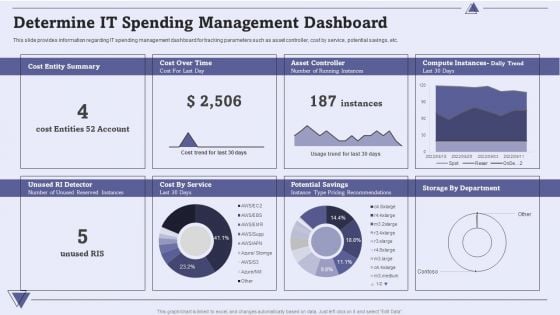
CIO For IT Cost Optimization Techniques Determine IT Spending Management Dashboard Infographics PDF
This slide provides information regarding IT spending management dashboard for tracking parameters such as asset controller, cost by service, potential savings, etc. Deliver and pitch your topic in the best possible manner with this CIO For IT Cost Optimization Techniques Determine IT Spending Management Dashboard Infographics PDF. Use them to share invaluable insights on Cost Entity Summary, Potential Savings, Cost By Service and impress your audience. This template can be altered and modified as per your expectations. So, grab it now.
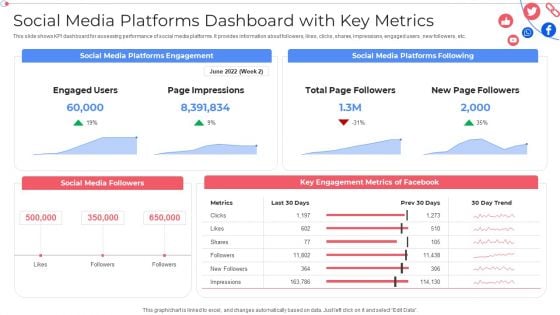
Social Media Platforms Dashboard With Key Metrics Customer Group Engagement Through Social Media Channels Infographics PDF
This slide shows KPI dashboard for assessing performance of social media platforms. It provides information about followers, likes, clicks, shares, impressions, engaged users , new followers, etc. Deliver an awe inspiring pitch with this creative Social Media Platforms Dashboard With Key Metrics Customer Group Engagement Through Social Media Channels Infographics PDF bundle. Topics like Social Media Followers, Key Engagement Metrics can be discussed with this completely editable template. It is available for immediate download depending on the needs and requirements of the user.
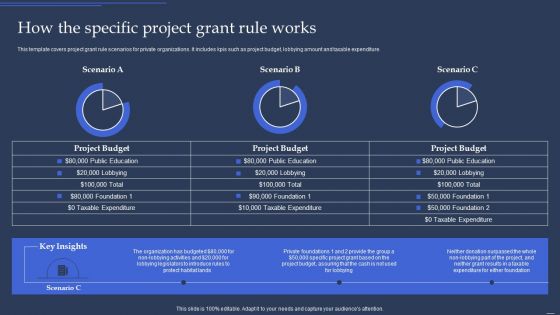
Community Policy Resources How The Specific Project Grant Rule Works Infographics PDF
This template covers project grant rule scenarios for private organizations. It includes kpis such as project budget, lobbying amount and taxable expenditure.Deliver and pitch your topic in the best possible manner with this Community Policy Resources How The Specific Project Grant Rule Works Infographics PDF. Use them to share invaluable insights on Lobbying Legislators, Organization Budgeted, Budget Assuring and impress your audience. This template can be altered and modified as per your expectations. So, grab it now.
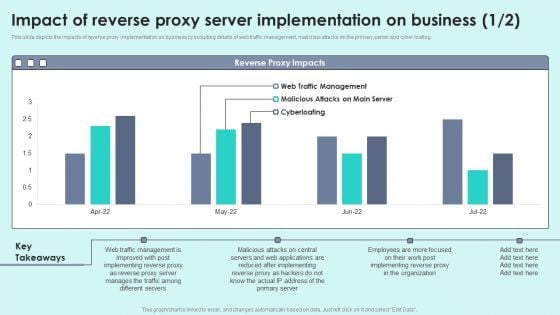
Impact Of Reverse Proxy Server Implementation On Business Reverse Proxy For Load Balancing Infographics PDF
This slide depicts the impacts of reverse proxy implementation on business by including details of web traffic management, malicious attacks on the primary server and cyber loafing.Deliver an awe inspiring pitch with this creative Impact Of Reverse Proxy Server Implementation On Business Reverse Proxy For Load Balancing Infographics PDF bundle. Topics like After Implementing, Manages Traffic, Different Servers can be discussed with this completely editable template. It is available for immediate download depending on the needs and requirements of the user.
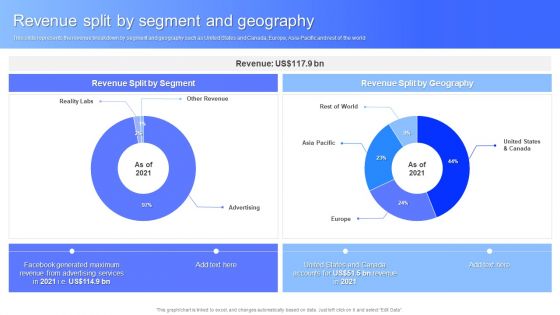
Revenue Split By Segment And Geography Facebook Business Outline Infographics PDF
This slide represents the revenue breakdown by segment and geography such as United States and Canada, Europe, Asia-Pacific and rest of the world. Deliver an awe inspiring pitch with this creative Revenue Split By Segment And Geography Facebook Business Outline Infographics PDF bundle. Topics like Advertising Services, Revenue, Geography can be discussed with this completely editable template. It is available for immediate download depending on the needs and requirements of the user.
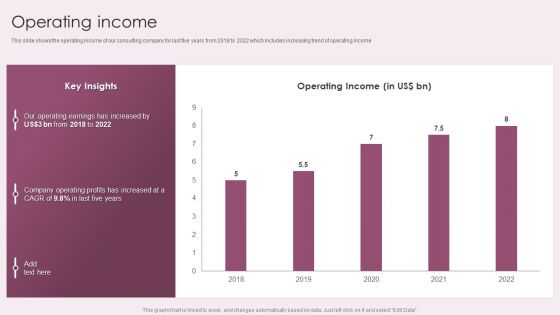
Business Advisory Solutions Company Profile Operating Income Ppt Infographics Slideshow PDF
This slide shows the operating income of our consulting company for last five years from 2018 to 2022 which includes increasing trend of operating income. Deliver an awe inspiring pitch with this creative Business Advisory Solutions Company Profile Operating Income Ppt Infographics Slideshow PDF bundle. Topics like Operating Income, Key Insights, Our Operating Earnings can be discussed with this completely editable template. It is available for immediate download depending on the needs and requirements of the user.
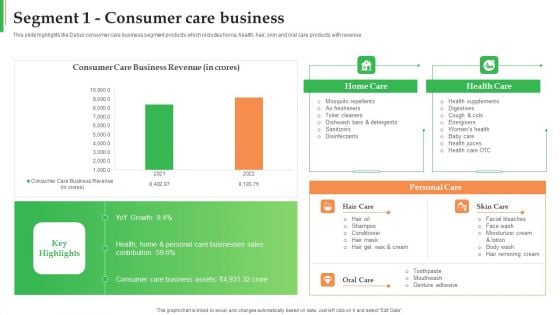
Dabur Business Profile Segment 1 Consumer Care Business Ppt Infographics Portfolio PDF
This slide highlights the Dabur consumer care business segment products which includes home, health, hair, skin and oral care products with revenue. Deliver an awe inspiring pitch with this creative Dabur Business Profile Segment 1 Consumer Care Business Ppt Infographics Portfolio PDF bundle. Topics like Consumer Care, Business Revenue, Home Care, Health Care can be discussed with this completely editable template. It is available for immediate download depending on the needs and requirements of the user.
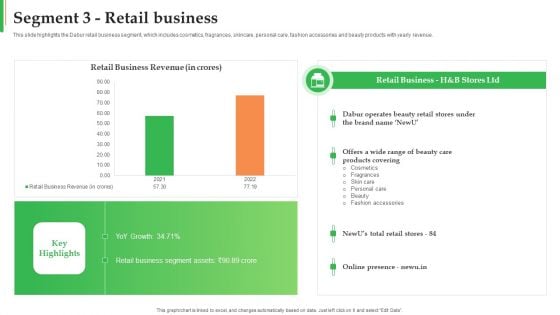
Dabur Business Profile Segment 3 Retail Business Ppt Infographics Summary PDF
This slide highlights the Dabur retail business segment, which includes cosmetics, fragrances, skincare, personal care, fashion accessories and beauty products with yearly revenue. Deliver an awe inspiring pitch with this creative Dabur Business Profile Segment 3 Retail Business Ppt Infographics Summary PDF bundle. Topics like Retail Business, Products Covering, Brand can be discussed with this completely editable template. It is available for immediate download depending on the needs and requirements of the user.
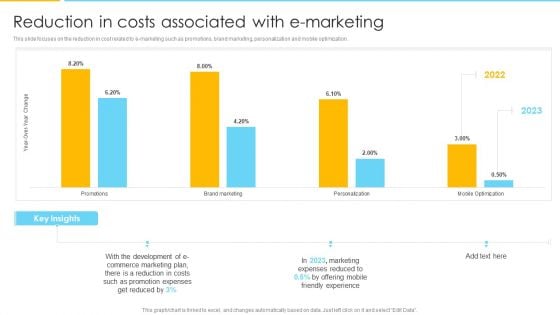
Optimizing Ecommerce Marketing Plan To Improve Sales Reduction In Costs Associated With E Marketing Infographics PDF
This slide focuses on the reduction in cost related to e marketing such as promotions, brand marketing, personalization and mobile optimization. Deliver an awe inspiring pitch with this creative Optimizing Ecommerce Marketing Plan To Improve Sales Reduction In Costs Associated With E Marketing Infographics PDF bundle. Topics like Development, E Commerce Marketing Plan, Expenses can be discussed with this completely editable template. It is available for immediate download depending on the needs and requirements of the user.
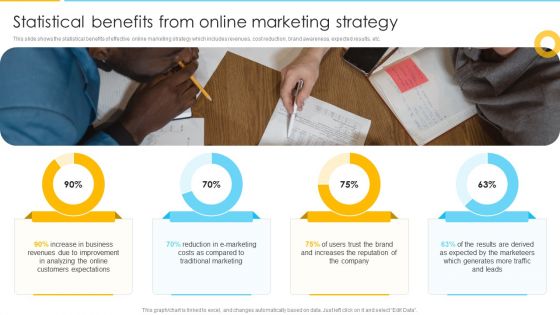
Optimizing Ecommerce Marketing Plan To Improve Sales Statistical Benefits From Online Marketing Strategy Infographics PDF
This slide shows the statistical benefits of effective online marketing strategy which includes revenues, cost reduction, brand awareness, expected results, etc. Deliver and pitch your topic in the best possible manner with this Optimizing Ecommerce Marketing Plan To Improve Sales Statistical Benefits From Online Marketing Strategy Infographics PDF. Use them to share invaluable insights on Traditional Marketing, Analyzing, Customers Expectations and impress your audience. This template can be altered and modified as per your expectations. So, grab it now.
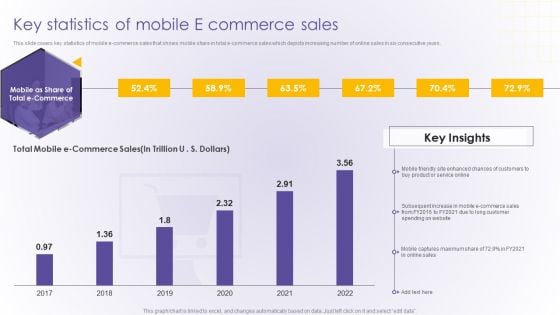
Key Statistics Of Mobile E Commerce Sales Developing Online Consumer Engagement Program Infographics PDF
This slide covers key statistics of mobile e commerce sales that shows mobile share in total e commerce sales which depicts increasing number of online sales in six consecutive years.Deliver an awe inspiring pitch with this creative Key Statistics Of Mobile E Commerce Sales Developing Online Consumer Engagement Program Infographics PDF bundle. Topics like Subsequent Increase, Ecommerce Sales, Captures Maximum can be discussed with this completely editable template. It is available for immediate download depending on the needs and requirements of the user.
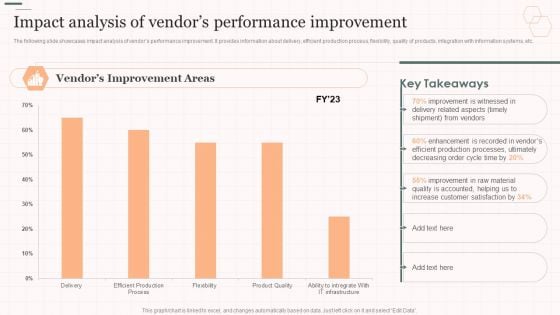
Impact Analysis Of Vendors Performance Improvement Vendor Management Strategies Infographics PDF
The following slide showcases impact analysis of vendors performance improvement. It provides information about delivery, efficient production process, flexibility, quality of products, integration with information systems, etc. Deliver an awe inspiring pitch with this creative Impact Analysis Of Vendors Performance Improvement Vendor Management Strategies Infographics PDF bundle. Topics like Improvement Witnessed, Related Aspects, Enhancement Recorded can be discussed with this completely editable template. It is available for immediate download depending on the needs and requirements of the user.
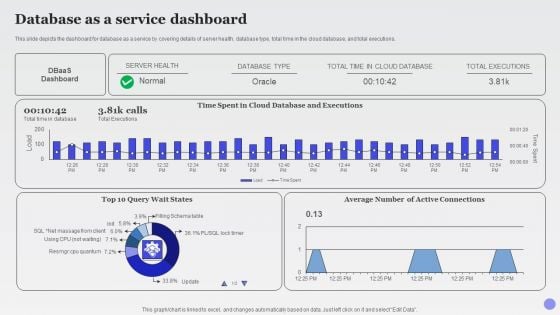
Database As A Service Dashboard Xaas Cloud Computing Models Ppt PowerPoint Presentation Infographics Graphics Design PDF
This slide depicts the dashboard for database as a service by covering details of server health, database type, total time in the cloud database, and total executions.Deliver an awe inspiring pitch with this creative Database As A Service Dashboard Xaas Cloud Computing Models Ppt PowerPoint Presentation Infographics Graphics Design PDF bundle. Topics like Database Executions, Active Connections, Total Executions can be discussed with this completely editable template. It is available for immediate download depending on the needs and requirements of the user.
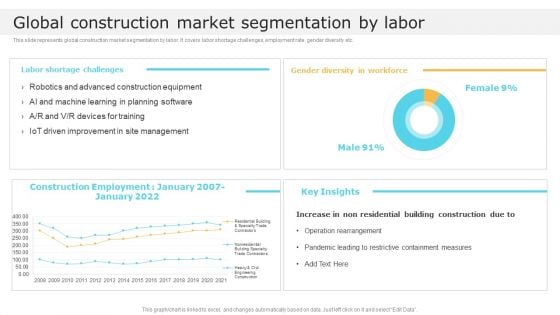
Global Construction Market Segmentation By Labor Global Construction Market Overview Infographics PDF
This slide represents global construction market segmentation by labor. It covers labor shortage challenges, employment rate, gender diversity etc. Deliver and pitch your topic in the best possible manner with this Global Construction Market Segmentation By Labor Global Construction Market Overview Infographics PDF. Use them to share invaluable insights on Management, Construction Equipment, Containment Measures and impress your audience. This template can be altered and modified as per your expectations. So, grab it now.
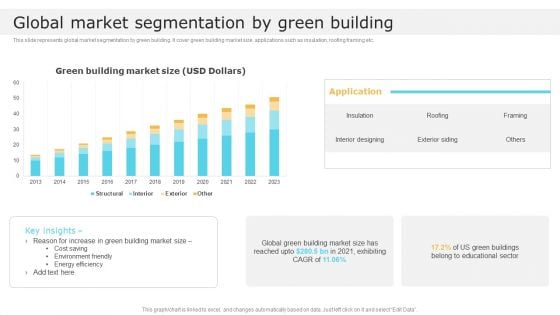
Global Market Segmentation By Green Building Global Construction Market Overview Infographics PDF
This slide represents global market segmentation by green building. It cover green building market size, applications such as insulation, roofing framing etc. Deliver an awe inspiring pitch with this creative Global Market Segmentation By Green Building Global Construction Market Overview Infographics PDF bundle. Topics like Environment Friendly, Cost Saving, Global can be discussed with this completely editable template. It is available for immediate download depending on the needs and requirements of the user.
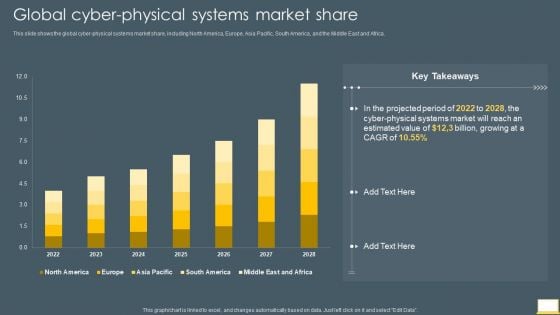
Cyber Intelligent Computing System Global Cyber Physical Systems Market Share Infographics PDF
This slide shows the global cyber physical systems market share, including North America, Europe, Asia Pacific, South America, and the Middle East and Africa. Deliver and pitch your topic in the best possible manner with this Cyber Intelligent Computing System Global Cyber Physical Systems Market Share Infographics PDF. Use them to share invaluable insights on Estimated Value, Cyber Physical Systems Market and impress your audience. This template can be altered and modified as per your expectations. So, grab it now.

 Home
Home