Infographic Icons
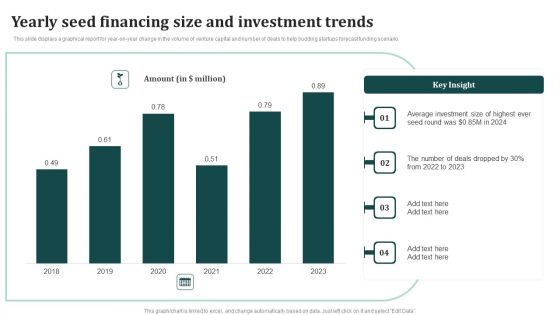
Yearly Seed Financing Size And Investment Trends Ppt Infographics Influencers PDF
This slide displays a graphical report for year-on-year change in the volume of venture capital and number of deals to help budding startups forecast funding scenario. Showcasing this set of slides titled Yearly Seed Financing Size And Investment Trends Ppt Infographics Influencers PDF. The topics addressed in these templates areAverage Investment, Highest Seed, 2022 To 2023. All the content presented in this PPT design is completely editable. Download it and make adjustments in color, background, font etc. as per your unique business setting.
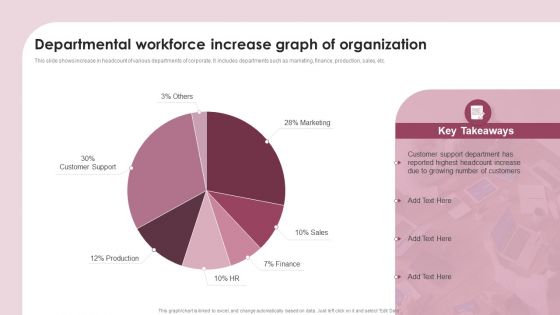
Departmental Workforce Increase Graph Of Organization Ppt Infographics Graphics Pictures PDF
This slide shows increase in headcount of various departments of corporate. It includes departments such as marketing, finance, production, sales, etc. Showcasing this set of slides titled Departmental Workforce Increase Graph Of Organization Ppt Infographics Graphics Pictures PDF. The topics addressed in these templates are Customer Support Department, Number Customers, Highest Headcount. All the content presented in this PPT design is completely editable. Download it and make adjustments in color, background, font etc. as per your unique business setting.
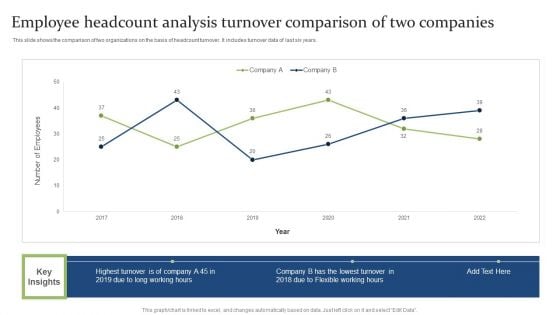
Employee Headcount Analysis Turnover Comparison Of Two Companies Ppt PowerPoint Presentation Infographics Smartart PDF
This slide shows the comparison of two organizations on the basis of headcount turnover. It includes turnover data of last six years. Showcasing this set of slides titled Employee Headcount Analysis Turnover Comparison Of Two Companies Ppt PowerPoint Presentation Infographics Smartart PDF. The topics addressed in these templates are Highest Turnover, Flexible Working, Lowest. All the content presented in this PPT design is completely editable. Download it and make adjustments in color, background, font etc. as per your unique business setting.
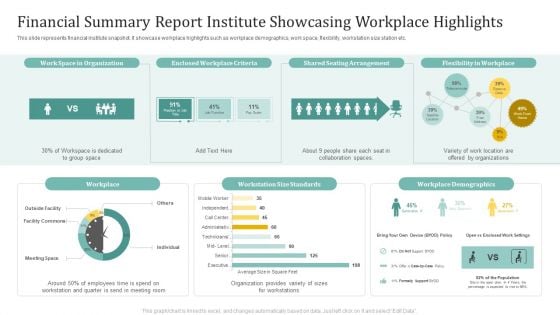
Financial Summary Report Institute Showcasing Workplace Highlights Ppt Infographics Inspiration PDF
This slide represents financial institute snapshot. It showcase workplace highlights such as workplace demographics, work space, flexibility, workstation size station etc. Pitch your topic with ease and precision using this Financial Summary Report Institute Showcasing Workplace Highlights Ppt Infographics Inspiration PDF. This layout presents information on Shared Seating Arrangement, Flexibility Workplace, Workplace. It is also available for immediate download and adjustment. So, changes can be made in the color, design, graphics or any other component to create a unique layout.
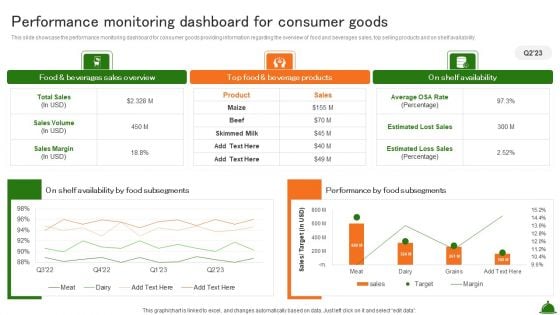
Performance Monitoring Dashboard For Consumer Goods Industry Analysis Of Food Infographics PDF
This slide showcase the performance monitoring dashboard for consumer goods providing information regarding the overview of food and beverages sales, top selling products and on shelf availability.There are so many reasons you need a Performance Monitoring Dashboard For Consumer Goods Industry Analysis Of Food Infographics PDF. The first reason is you can not spend time making everything from scratch, Thus, Slidegeeks has made presentation templates for you too. You can easily download these templates from our website easily.
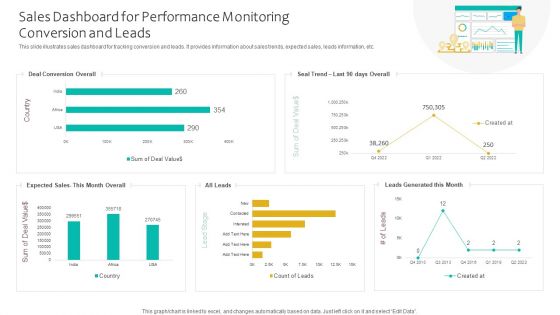
Sales Dashboard For Performance Monitoring Conversion And Leads Ppt Infographics Smartart PDF
This slide illustrates sales dashboard for tracking conversion and leads. It provides information about sales trends, expected sales, leads information, etc. Showcasing this set of slides titled Sales Dashboard For Performance Monitoring Conversion And Leads Ppt Infographics Smartart PDF. The topics addressed in these templates are Deal Conversion Overall, Expected Sales, Leads Generated. All the content presented in this PPT design is completely editable. Download it and make adjustments in color, background, font etc. as per your unique business setting.

Emotional Marketing Strategy To Nurture Clustered Column Ppt Infographics Slide PDF
Present like a pro with Emotional Marketing Strategy To Nurture Clustered Column Ppt Infographics Slide PDF Create beautiful presentations together with your team, using our easy-to-use presentation slides. Share your ideas in real-time and make changes on the fly by downloading our templates. So whether youre in the office, on the go, or in a remote location, you can stay in sync with your team and present your ideas with confidence. With Slidegeeks presentation got a whole lot easier. Grab these presentations today.
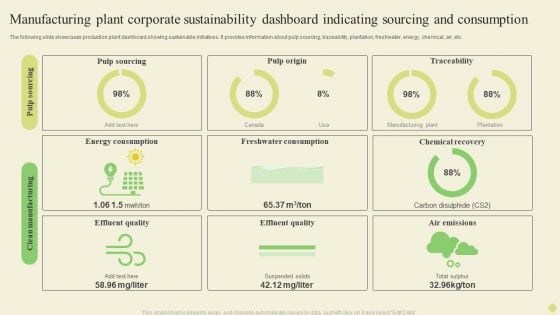
Manufacturing Plant Corporate Sustainability Dashboard Indicating Sourcing And Consumption Infographics PDF
The following slide showcases business sustainability dashboard highlighting multiple sources of technology. It provides information about renewable energy, plant age, solar, wind, biomass, regionality, etc.Pitch your topic with ease and precision using this Manufacturing Plant Corporate Sustainability Dashboard Indicating Sourcing And Consumption Infographics PDF. This layout presents information on Energy Consumption, Freshwater Consumption, Chemical Recovery. It is also available for immediate download and adjustment. So, changes can be made in the color, design, graphics or any other component to create a unique layout.

Quarterly Comparison Of Security For Cloud Based Systems Threats Infographics PDF
This slide shows the various types of cloud security threats occurred during four quarters. It includes phishing, malware, IoT and password attacks. Pitch your topic with ease and precision using this Quarterly Comparison Of Security For Cloud Based Systems Threats Infographics PDF. This layout presents information on Quarterly Comparison Of Security, Cloud Based Systems Threats. It is also available for immediate download and adjustment. So, changes can be made in the color, design, graphics or any other component to create a unique layout.
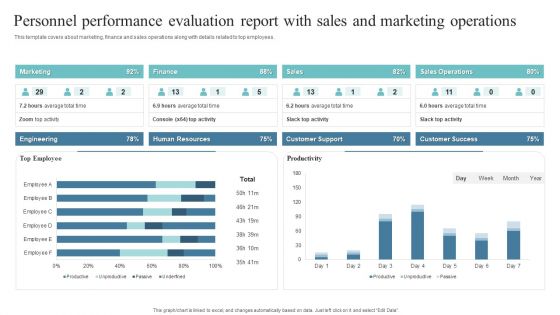
Personnel Performance Evaluation Report With Sales And Marketing Operations Infographics PDF
This template covers about marketing, finance and sales operations along with details related to top employees.Showcasing this set of slides titled Personnel Performance Evaluation Report With Sales And Marketing Operations Infographics PDF. The topics addressed in these templates are Human Resources, Customer Support, Sales Operations. All the content presented in this PPT design is completely editable. Download it and make adjustments in color, background, font etc. as per your unique business setting.
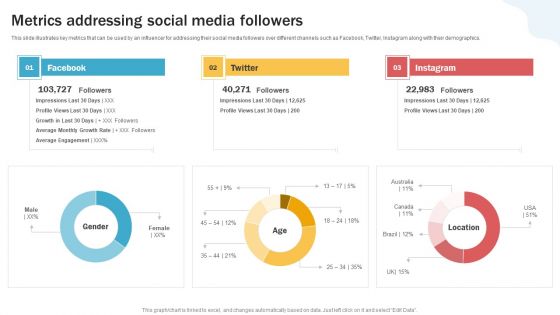
Developing Personal Brand On Social Media Channels Metrics Addressing Social Media Followers Infographics PDF
This slide illustrates key metrics that can be used by an influencer for addressing their social media followers over different channels such as Facebook, Twitter, Instagram along with their demographics.There are so many reasons you need a Developing Personal Brand On Social Media Channels Metrics Addressing Social Media Followers Infographics PDF. The first reason is you can not spend time making everything from scratch, Thus, Slidegeeks has made presentation templates for you too. You can easily download these templates from our website easily.
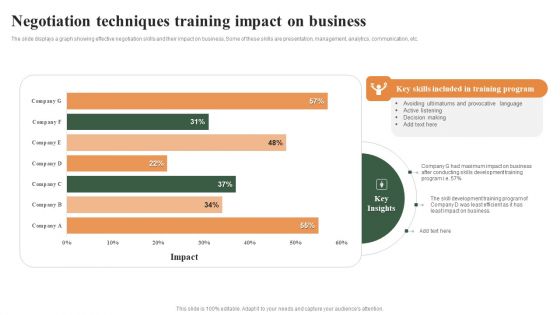
Negotiation Techniques Training Impact On Business Ppt Infographics Visual Aids PDF
The slide displays a graph showing effective negotiation skills and their impact on business, Some of these skills are presentation, management, analytics, communication, etc. Showcasing this set of slides titled Negotiation Techniques Training Impact On Business Ppt Infographics Visual Aids PDF. The topics addressed in these templates are Avoiding Ultimatums, Provocative Language, Active Listening, Decision Making. All the content presented in this PPT design is completely editable. Download it and make adjustments in color, background, font etc. as per your unique business setting.
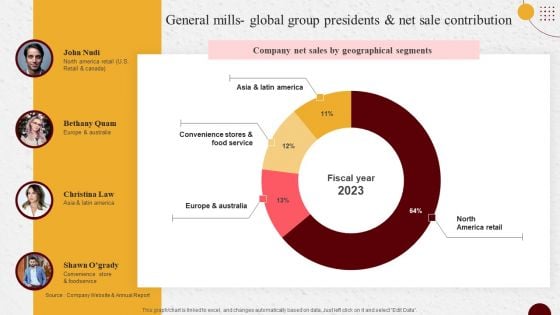
Industry Report Of Packaged Food Products Part 2 General Mills Global Group Infographics PDF
From laying roadmaps to briefing everything in detail, our templates are perfect for you. You can set the stage with your presentation slides. All you have to do is download these easy to edit and customizable templates. Industry Report Of Packaged Food Products Part 2 General Mills Global Group Infographics PDF will help you deliver an outstanding performance that everyone would remember and praise you for. Do download this presentation today.
Product Branding To Enhance Product Sales Performance Tracking Dashboard Infographics PDF
This slide provides information regarding product branding performance tracking dashboard in terms of revenues, new customers, customer satisfaction rate. Make sure to capture your audiences attention in your business displays with our gratis customizable Product Branding To Enhance Product Sales Performance Tracking Dashboard Infographics PDF. These are great for business strategies, office conferences, capital raising or task suggestions. If you desire to acquire more customers for your tech business and ensure they stay satisfied, create your own sales presentation with these plain slides.
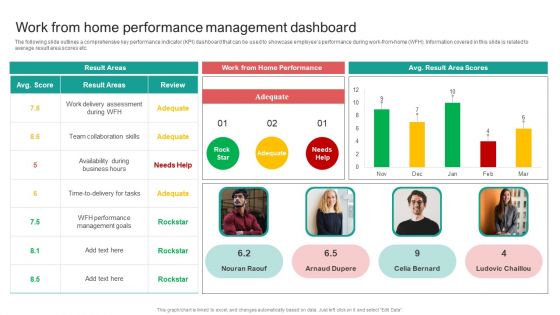
Organising Staff Flexible Job Arrangements Work From Home Performance Management Dashboard Infographics PDF
Take your projects to the next level with our ultimate collection of Organising Staff Flexible Job Arrangements Work From Home Performance Management Dashboard Infographics PDF. Slidegeeks has designed a range of layouts that are perfect for representing task or activity duration, keeping track of all your deadlines at a glance. Tailor these designs to your exact needs and give them a truly corporate look with your own brand colors they will make your projects stand out from the rest.

Consumer Demand Planning Process With Modeling And Forecasting Ppt PowerPoint Presentation Infographics Ideas PDF
Presenting consumer demand planning process with modeling and forecasting ppt powerpoint presentation infographics ideas pdf to dispense important information. This template comprises four stages. It also presents valuable insights into the topics including modeling, forecasting, demand planning, supply planning, create detailed demand plans. This is a completely customizable PowerPoint theme that can be put to use immediately. So, download it and address the topic impactfully.
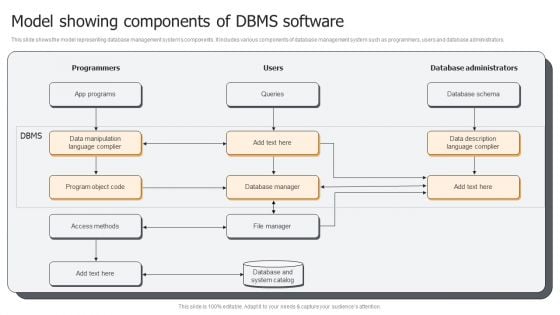
Model Showing Components Of DBMS Software Ppt PowerPoint Presentation Gallery Infographics PDF
This slide shows the model representing database management systems components. It includes various components of database management system such as programmers, users and database administrators. Presenting Model Showing Components Of DBMS Software Ppt PowerPoint Presentation Gallery Infographics PDF to dispense important information. This template comprises one stages. It also presents valuable insights into the topics including Programmers, Database Administrators, Database Schema. This is a completely customizable PowerPoint theme that can be put to use immediately. So, download it and address the topic impactfully.
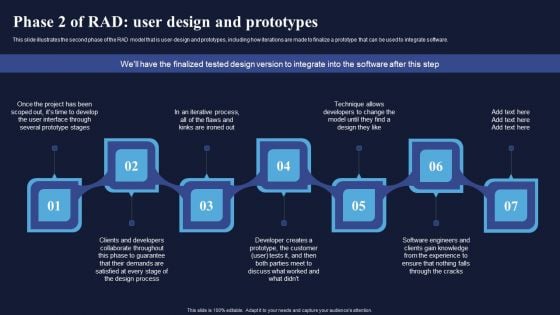
Phase 2 Of RAD User Design And Prototypes Integrating RAD Model To Simplify Infographics PDF
This slide illustrates the second phase of the RAD model that is user-design and prototypes, including how iterations are made to finalize a prototype that can be used to integrate software. Welcome to our selection of the Phase 2 Of RAD User Design And Prototypes Integrating RAD Model To Simplify Infographics PDF. These are designed to help you showcase your creativity and bring your sphere to life. Planning and Innovation are essential for any business that is just starting out. This collection contains the designs that you need for your everyday presentations. All of our PowerPoints are 100 percent editable, so you can customize them to suit your needs. This multi-purpose template can be used in various situations. Grab these presentation templates today.
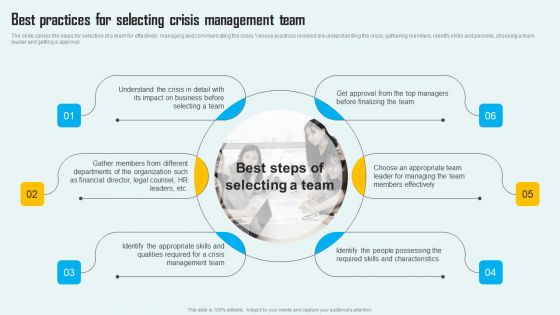
Key Phase Of Crisis Communication Management Plan Best Practices For Selecting Crisis Management Team Infographics PDF
The slide carries the steps for selection of a team for effectively managing and communicating the crisis. Various practices involved are understanding the crisis, gathering members, identify skills and persons, choosing a team leader and getting a approval Want to ace your presentation in front of a live audience Our Key Phase Of Crisis Communication Management Plan Best Practices For Selecting Crisis Management Team Infographics PDF can help you do that by engaging all the users towards you. Slidegeeks experts have put their efforts and expertise into creating these impeccable powerpoint presentations so that you can communicate your ideas clearly. Moreover, all the templates are customizable, and easy to edit and downloadable. Use these for both personal and commercial use.
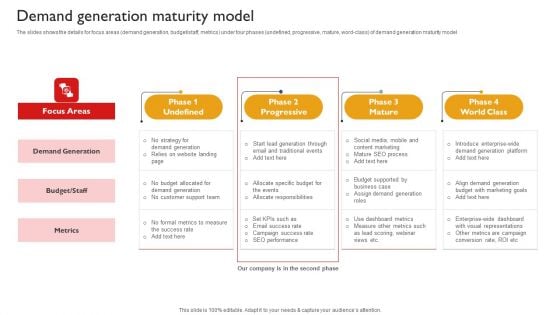
Techniques To Enhance Brand Awareness Demand Generation Maturity Model Infographics PDF
The slides shows the details for focus areas demand generation, budget staff, metrics under four phases undefined, progressive, mature, word-class of demand generation maturity model The slides shows the details for focus areas demand generation, budget staff, metrics under four phases undefined, progressive, mature, word-class of demand generation maturity model Formulating a presentation can take up a lot of effort and time, so the content and message should always be the primary focus. The visuals of the PowerPoint can enhance the presenters message, so our Techniques To Enhance Brand Awareness Demand Generation Maturity Model Infographics PDF was created to help save time. Instead of worrying about the design, the presenter can concentrate on the message while our designers work on creating the ideal templates for whatever situation is needed. Slidegeeks has experts for everything from amazing designs to valuable content, we have put everything into Techniques To Enhance Brand Awareness Demand Generation Maturity Model Infographics PDF
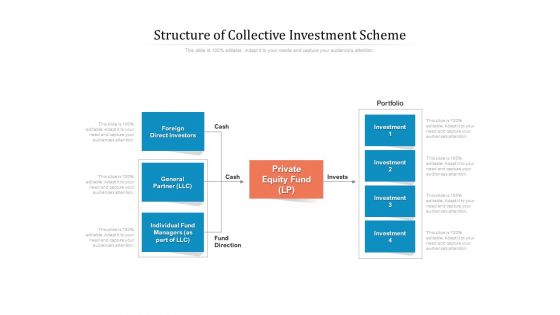
Structure Of Collective Investment Scheme Ppt PowerPoint Presentation Infographics Template PDF
Presenting this set of slides with name structure of collective investment scheme ppt powerpoint presentation infographics template pdf. This is a four stage process. The stages in this process are foreign, direct investors, general partner llc, individual fund managers as part of llc, investment, portfolio, private equity fund lp. This is a completely editable PowerPoint presentation and is available for immediate download. Download now and impress your audience.
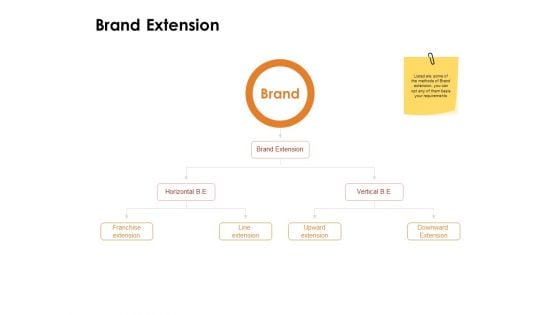
Label Identity Design Brand Extension Ppt PowerPoint Presentation Infographics Aids PDF
Presenting label identity design brand extension ppt powerpoint presentation infographics aids pdf to provide visual cues and insights. Share and navigate important information on four stages that need your due attention. This template can be used to pitch topics like brand extension, horizontal b e, vertical b e, franchise extension, line extension, upward extension, downward, extension. In addition, this PPT design contains high-resolution images, graphics, etc, that are easily editable and available for immediate download.
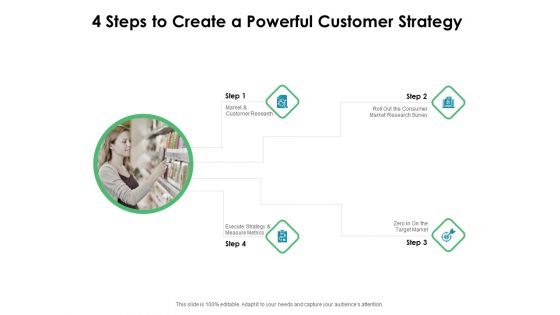
Value Creation Initiatives 4 Steps To Create A Powerful Customer Strategy Infographics PDF
This is a value creation initiatives 4 steps to create a powerful customer strategy infographics pdf template with various stages. Focus and dispense information on three stages using this creative set, that comes with editable features. It contains large content boxes to add your information on topics like market and customer research, execute strategy and measure metrics, roll out the consumer market research survey. You can also showcase facts, figures, and other relevant content using this PPT layout. Grab it now.
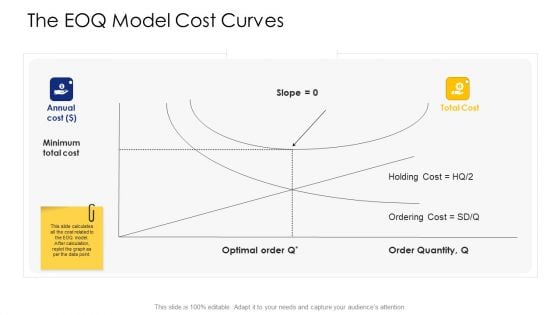
Logistic Network Administration Solutions The EOQ Model Cost Curves Ppt Infographics Show PDF
This is a logistic network administration solutions the eoq model cost curves ppt infographics show pdf template with various stages. Focus and dispense information on one stages using this creative set, that comes with editable features. It contains large content boxes to add your information on topics like the eoq model cost curves. You can also showcase facts, figures, and other relevant content using this PPT layout. Grab it now.
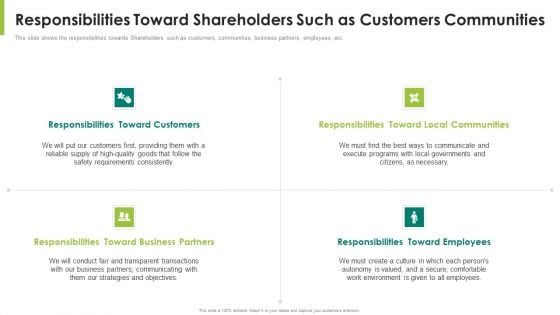
Responsibilities Toward Shareholders Such As Customers Communities Ppt Infographics Design Inspiration PDF
This slide shows the responsibilities towards Shareholders such as customers, communities, business partners, employees, etc. Presenting responsibilities toward shareholders such as customers communities ppt infographics design inspiration pdf to provide visual cues and insights. Share and navigate important information on four stages that need your due attention. This template can be used to pitch topics like local communities, employees, business partners, customers. In addtion, this PPT design contains high resolution images, graphics, etc, that are easily editable and available for immediate download.
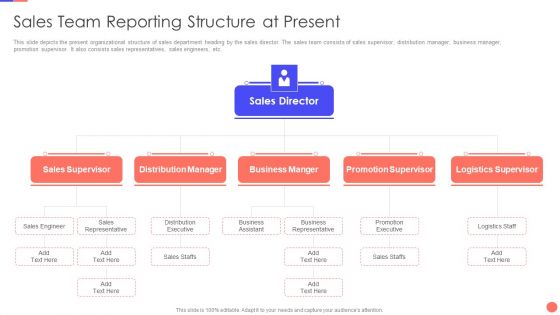
Sales Techniques Playbook Sales Team Reporting Structure At Present Infographics PDF
This is a sales techniques playbook sales team reporting structure at present infographics pdf template with various stages. Focus and dispense information on four stages using this creative set, that comes with editable features. It contains large content boxes to add your information on topics like distribution executive, business assistant, promotion executive, sales staffs. You can also showcase facts, figures, and other relevant content using this PPT layout. Grab it now.
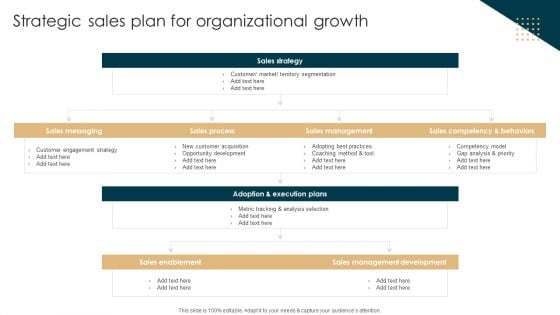
Tactical Planning Guide For Supervisors Strategic Sales Plan For Organizational Growth Infographics PDF
If your project calls for a presentation, then Slidegeeks is your go to partner because we have professionally designed, easy to edit templates that are perfect for any presentation. After downloading, you can easily edit Tactical Planning Guide For Supervisors Strategic Sales Plan For Organizational Growth Infographics PDF and make the changes accordingly. You can rearrange slides or fill them with different images. Check out all the handy templates.
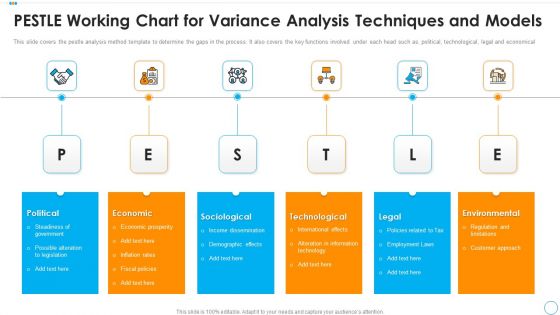
Pestle Working Chart For Variance Analysis Techniques And Models Infographics PDF
This slide covers the pestle analysis method template to determine the gaps in the process. It also covers the key functions involved under each head such as, political, technological, legal and economical. Presenting pestle working chart for variance analysis techniques and models infographics pdf to dispense important information. This template comprises five stages. It also presents valuable insights into the topics including sociological, technological, environmental. This is a completely customizable PowerPoint theme that can be put to use immediately. So, download it and address the topic impactfully.
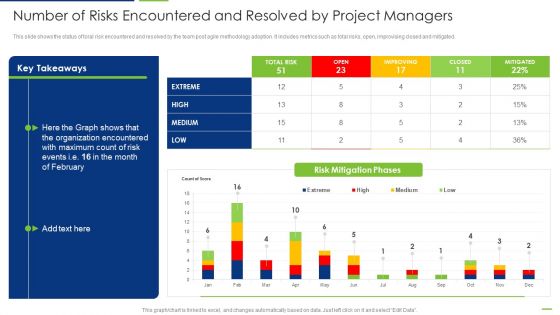
Professional Scrum Master Number Of Risks Encountered And Resolved By Project Managers Infographics PDF
This slide shows the status of toral risk encountered and resolved by the team post agile methodology adoption. It includes metrics such as total risks, open, improvising closed and mitigated. Deliver an awe inspiring pitch with this creative Professional Scrum Master Number Of Risks Encountered And Resolved By Project Managers Infographics PDF bundle. Topics like Risk Mitigation Phases, Organization Encountered, High, Low, Medium can be discussed with this completely editable template. It is available for immediate download depending on the needs and requirements of the user.
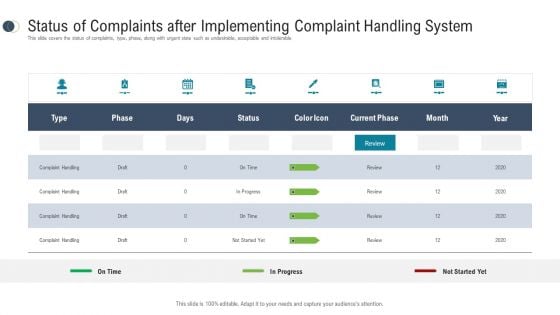
Consumer Complaint Procedure Status Of Complaints After Implementing Complaint Handling System Infographics PDF
This slide covers the status of complaints, type, phase, along with urgent state such as undesirable, acceptable and intolerable. Deliver an awe-inspiring pitch with this creative consumer complaint procedure status of complaints after implementing complaint handling system infographics pdf bundle. Topics like status of complaints after implementing complaint handling system can be discussed with this completely editable template. It is available for immediate download depending on the needs and requirements of the user.
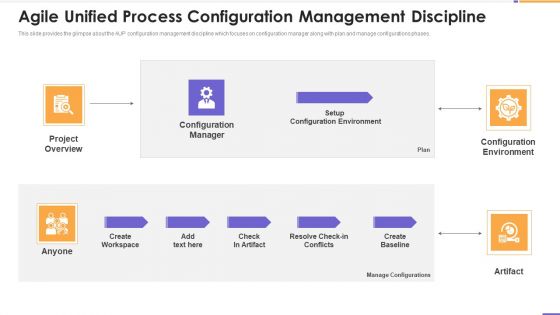
Agile Unified Process Software Programming Agile Unified Process Configuration Management Discipline Infographics PDF
This slide provides the glimpse about the AUP configuration management discipline which focuses on configuration manager along with plan and manage configurations phases. Deliver an awe inspiring pitch with this creative agile unified process software programming agile unified process configuration management discipline infographics pdf bundle. Topics like agile unified process configuration management discipline can be discussed with this completely editable template. It is available for immediate download depending on the needs and requirements of the user.
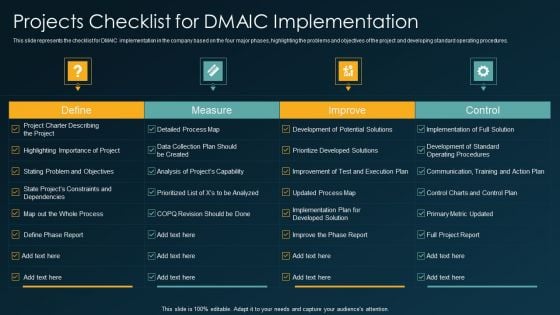
Six Sigma Methodology IT Projects Checklist For DMAIC Implementation Ppt Infographics Brochure PDF
This slide represents the checklist for DMAIC implementation in the company based on the four major phases, highlighting the problems and objectives of the project and developing standard operating procedures. Deliver an awe inspiring pitch with this creative six sigma methodology it projects checklist for dmaic implementation ppt infographics brochure pdf bundle. Topics like improve, measure, control can be discussed with this completely editable template. It is available for immediate download depending on the needs and requirements of the user.
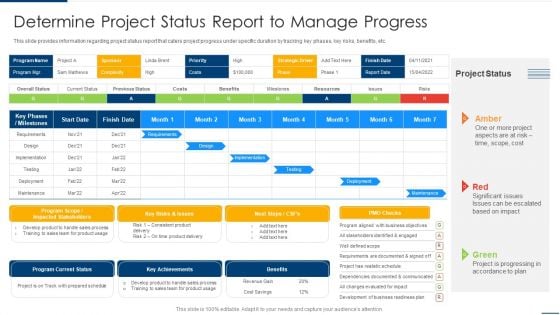
Project Organizing Playbook Determine Project Status Report To Manage Progress Infographics PDF
This slide provides information regarding project status report that caters project progress under specific duration by tracking key phases, key risks, benefits, etc. Deliver and pitch your topic in the best possible manner with this project organizing playbook determine project status report to manage progress infographics pdf. Use them to share invaluable insights on program scope, key achievements, program current status and impress your audience. This template can be altered and modified as per your expectations. So, grab it now.
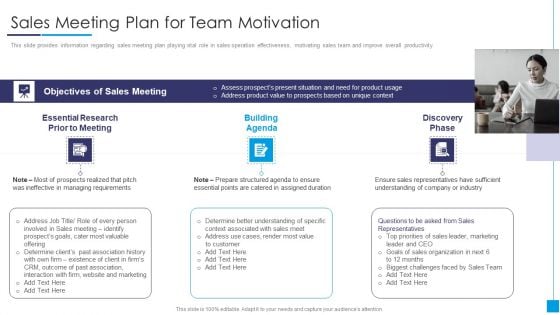
B2B Marketing Content Administration Playbook Sales Meeting Plan For Team Motivation Infographics PDF
This slide provides information regarding several steps involved in B2B sales process from lead identification to renewal. It also covers details about roles involved, tasks catered, etc.Deliver an awe inspiring pitch with this creative b2b marketing content administration playbook sales meeting plan for team motivation infographics pdf bundle. Topics like essential research, building agenda, discovery phase can be discussed with this completely editable template. It is available for immediate download depending on the needs and requirements of the user.
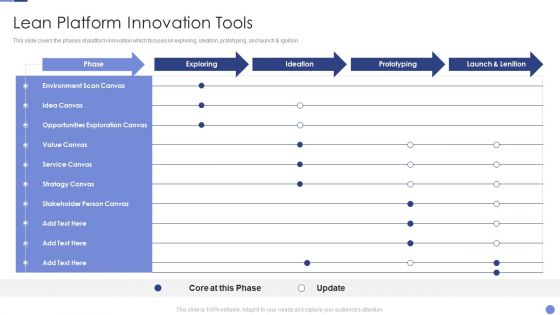
Lean Platform Innovation Tools Resolving Chicken And Egg Problem In Organization Infographics PDF
This slide covers the phases of platform innovation which focuses on exploring, ideation, prototyping, and launch ignition.Deliver an awe inspiring pitch with this creative Lean Platform Innovation Tools Resolving Chicken And Egg Problem In Organization Infographics PDF bundle. Topics like Environment Scan, Opportunities Exploration, Stakeholder Person can be discussed with this completely editable template. It is available for immediate download depending on the needs and requirements of the user.

Various Strategies To Prevent Business Vulnerabilities Table Of Contents Infographics PDF
This is a Various Strategies To Prevent Business Vulnerabilities Table Of Contents Infographics PDF template with various stages. Focus and dispense information on one stages using this creative set, that comes with editable features. It contains large content boxes to add your information on topics like Anti Fraud Program, Phased Approach, Organization, Our Team Structure. You can also showcase facts, figures, and other relevant content using this PPT layout. Grab it now.
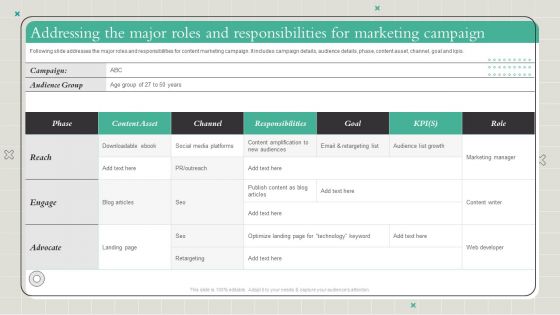
Playbook To Formulate Efficient Addressing The Major Roles And Responsibilities For Marketing Infographics PDF
Following slide addresses the major roles and responsibilities for content marketing campaign. It includes campaign details, audience details, phase, content asset, channel, goal and kpis. There are so many reasons you need a Playbook To Formulate Efficient Addressing The Major Roles And Responsibilities For Marketing Infographics PDF. The first reason is you cant spend time making everything from scratch, Thus, Slidegeeks has made presentation templates for you too. You can easily download these templates from our website easily.
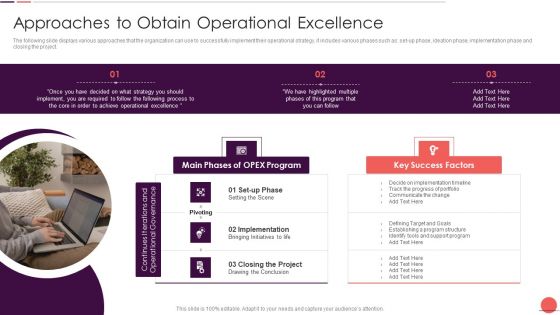
Playbook For Improving Production Process Approaches To Obtain Operational Infographics PDF
The following slide displays various approaches that the organization can use to successfully implement their operational strategy, it includes various phases such as set-up phase, ideation phase, implementation phase and closing the project. This is a Playbook For Improving Production Process Approaches To Obtain Operational Infographics PDF template with various stages. Focus and dispense information on three stages using this creative set, that comes with editable features. It contains large content boxes to add your information on topics like Main Phases, OPEX Program, Key Success Factors, Implementation. You can also showcase facts, figures, and other relevant content using this PPT layout. Grab it now.
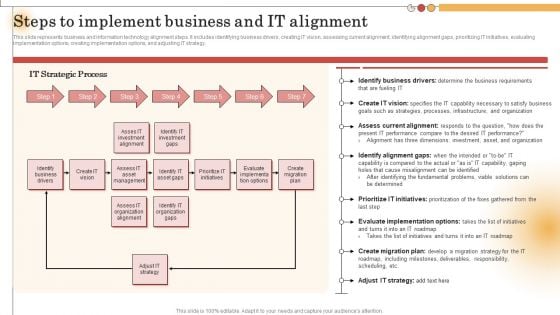
IT Alignment For Strategic Steps To Implement Business And IT Alignment Infographics PDF
This slide represents business and information technology alignment steps. It includes identifying business drivers, creating IT vision, assessing current alignment, identifying alignment gaps, prioritizing IT initiatives, evaluating implementation options, creating implementation options, and adjusting IT strategy. Do you have an important presentation coming up Are you looking for something that will make your presentation stand out from the rest Look no further than IT Alignment For Strategic Steps To Implement Business And IT Alignment Infographics PDF. With our professional designs, you can trust that your presentation will pop and make delivering it a smooth process. And with Slidegeeks, you can trust that your presentation will be unique and memorable. So why wait Grab IT Alignment For Strategic Steps To Implement Business And IT Alignment Infographics PDF today and make your presentation stand out from the rest.
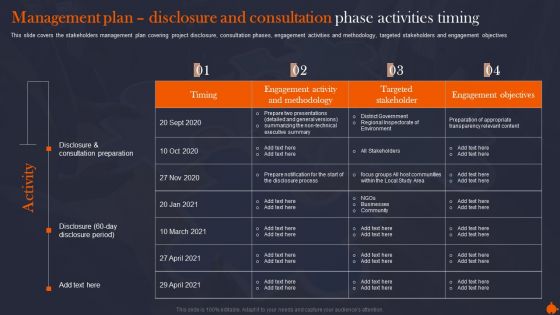
Management Plan Disclosure Organize Supervise And Enhance Relationships With Shareholders Infographics PDF
This slide covers the stakeholders management plan covering project disclosure, consultation phases, engagement activities and methodology, targeted stakeholders and engagement objectives. Do you have an important presentation coming up Are you looking for something that will make your presentation stand out from the rest Look no further than Management Plan Disclosure Organize Supervise And Enhance Relationships With Shareholders Infographics PDF. With our professional designs, you can trust that your presentation will pop and make delivering it a smooth process. And with Slidegeeks, you can trust that your presentation will be unique and memorable. So why wait Grab Management Plan Disclosure Organize Supervise And Enhance Relationships With Shareholders Infographics PDF today and make your presentation stand out from the rest.
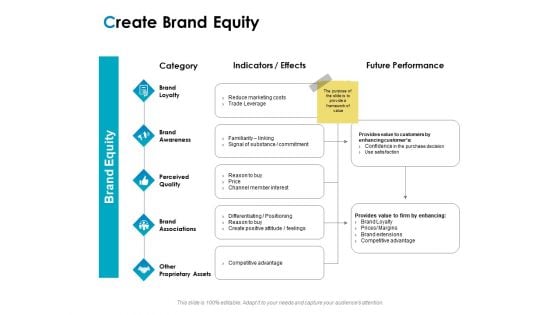
Strategic Marketing Plan Create Brand Equity Ppt PowerPoint Presentation Infographics Visual Aids PDF
Presenting strategic marketing plan create brand equity ppt powerpoint presentation infographics visual aids pdf to provide visual cues and insights. Share and navigate important information on five stages that need your due attention. This template can be used to pitch topics like brand loyalty, brand awareness, perceived quality, brand associations, other proprietary assets, indicators. In addition, this PPT design contains high-resolution images, graphics, etc, that are easily editable and available for immediate download.
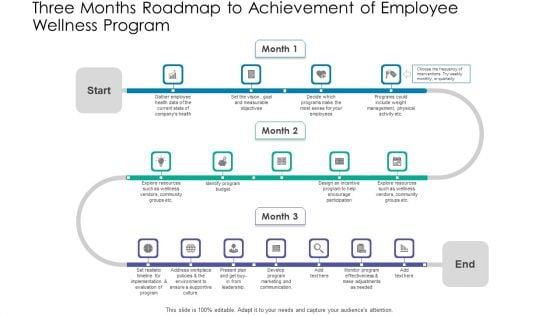
Three Months Roadmap To Achievement Of Employee Wellness Program Infographics PDF
Presenting our jaw-dropping three months roadmap to achievement of employee wellness program infographics pdf. You can alternate the color, font size, font type, and shapes of this PPT layout according to your strategic process. This PPT presentation is compatible with Google Slides and is available in both standard screen and widescreen aspect ratios. You can also download this well-researched PowerPoint template design in different formats like PDF, JPG, and PNG. So utilize this visually-appealing design by clicking the download button given below.

Five Yearly Planning And Development For The To Be Roadmap Infographics
Presenting our innovatively structured five yearly planning and development for the to be roadmap infographics Template. Showcase your roadmap process in different formats like PDF, PNG, and JPG by clicking the download button below. This PPT design is available in both Standard Screen and Widescreen aspect ratios. It can also be easily personalized and presented with modified font size, font type, color, and shapes to measure your progress in a clear way.
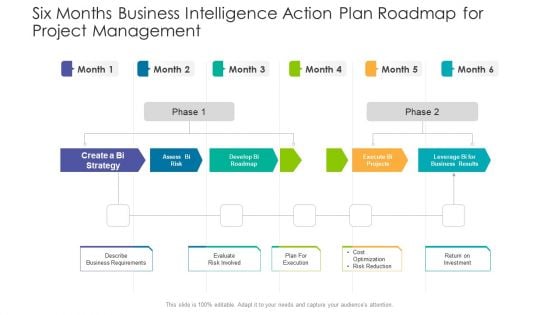
Six Months Business Intelligence Action Plan Roadmap For Project Management Infographics
Presenting our innovatively structured six months business intelligence action plan roadmap for project management infographics Template. Showcase your roadmap process in different formats like PDF, PNG, and JPG by clicking the download button below. This PPT design is available in both Standard Screen and Widescreen aspect ratios. It can also be easily personalized and presented with modified font size, font type, color, and shapes to measure your progress in a clear way.
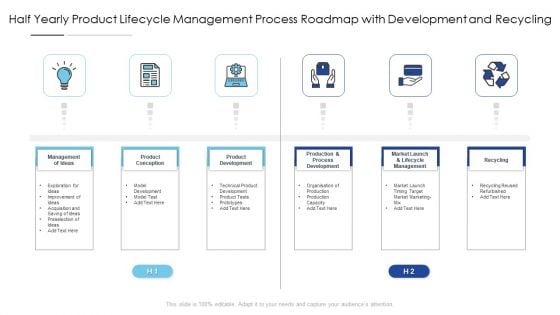
Half Yearly Product Lifecycle Management Process Roadmap With Development And Recycling Infographics
Presenting our innovatively structured half yearly product lifecycle management process roadmap with development and recycling infographics Template. Showcase your roadmap process in different formats like PDF, PNG, and JPG by clicking the download button below. This PPT design is available in both Standard Screen and Widescreen aspect ratios. It can also be easily personalized and presented with modified font size, font type, color, and shapes to measure your progress in a clear way.
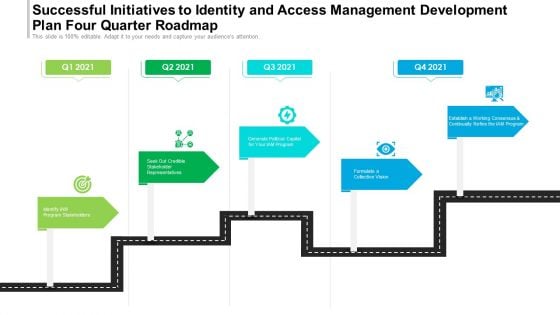
Successful Initiatives To Identity And Access Management Development Plan Four Quarter Roadmap Infographics
Presenting our innovatively-structured successful initiatives to identity and access management development plan four quarter roadmap infographics Template. Showcase your roadmap process in different formats like PDF, PNG, and JPG by clicking the download button below. This PPT design is available in both Standard Screen and Widescreen aspect ratios. It can also be easily personalized and presented with modified font size, font type, color, and shapes to measure your progress in a clear way.
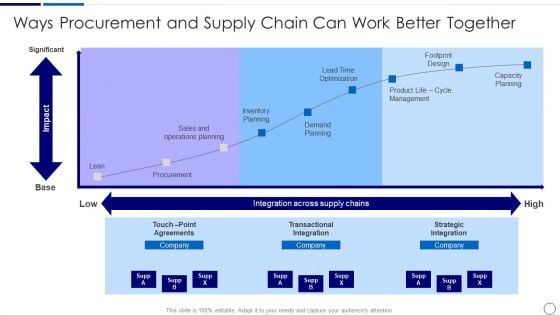
Procurement And SCM Ways Procurement And Supply Chain Can Work Better Together Ppt Show Infographics PDF
Presenting procurement and scm ways procurement and supply chain can work better together ppt show infographics pdf to provide visual cues and insights. Share and navigate important information on one stages that need your due attention. This template can be used to pitch topics like integration across supply chains, procurement, demand planning, inventory planning, capacity planning. In addtion, this PPT design contains high resolution images, graphics, etc, that are easily editable and available for immediate download.
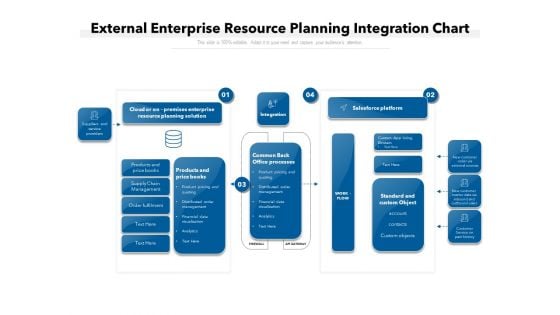
External Enterprise Resource Planning Integration Chart Ppt PowerPoint Presentation Infographics Layouts PDF
Persuade your audience using this external enterprise resource planning integration chart ppt powerpoint presentation infographics layouts pdf. This PPT design covers four stages, thus making it a great tool to use. It also caters to a variety of topics including cloud or on premises enterprise resource planning solution, salesforce platform, integration, common back office processes, products and price books, standard and custom object. Download this PPT design now to present a convincing pitch that not only emphasizes the topic but also showcases your presentation skills.
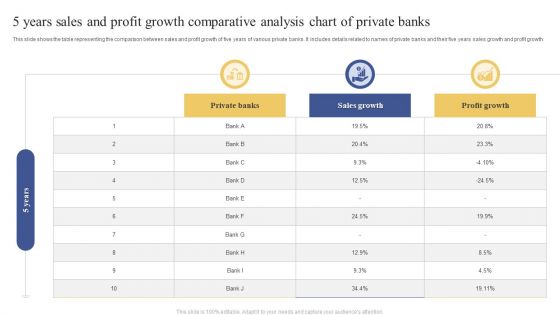
5 Years Sales And Profit Growth Comparative Analysis Chart Of Private Banks Infographics PDF
This slide shows the table representing the comparison between sales and profit growth of five years of various private banks. It includes details related to names of private banks and their five years sales growth and profit growth. Pitch your topic with ease and precision using this 5 Years Sales And Profit Growth Comparative Analysis Chart Of Private Banks Infographics PDF. This layout presents information on Private Banks, Sales Growth, Profit Growth. It is also available for immediate download and adjustment. So, changes can be made in the color, design, graphics or any other component to create a unique layout.
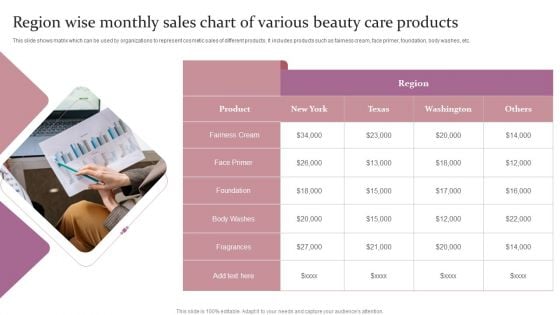
Region Wise Monthly Sales Chart Of Various Beauty Care Products Ppt Infographics Slide Portrait PDF
This slide shows matrix which can be used by organizations to represent cosmetic sales of different products. It includes products such as fairness cream, face primer, foundation, body washes, etc. Persuade your audience using this Region Wise Monthly Sales Chart Of Various Beauty Care Products Ppt Infographics Slide Portrait PDF. This PPT design covers one stages, thus making it a great tool to use. It also caters to a variety of topics including Product, Fairness Cream, Face Primer. Download this PPT design now to present a convincing pitch that not only emphasizes the topic but also showcases your presentation skills.
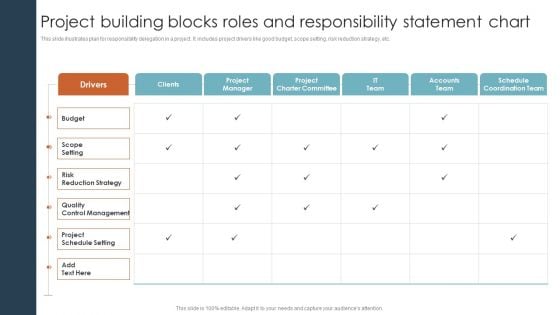
Project Building Blocks Roles And Responsibility Statement Chart Ppt Infographics Ideas PDF
This slide illustrates plan for responsibility delegation in a project. It includes project drivers like good budget, scope setting, risk reduction strategy, etc. Pitch your topic with ease and precision using this Project Building Blocks Roles And Responsibility Statement Chart Ppt Infographics Ideas PDF. This layout presents information on Scope Setting, Risk Reduction Strategy, Quality Control Management. It is also available for immediate download and adjustment. So, changes can be made in the color, design, graphics or any other component to create a unique layout.
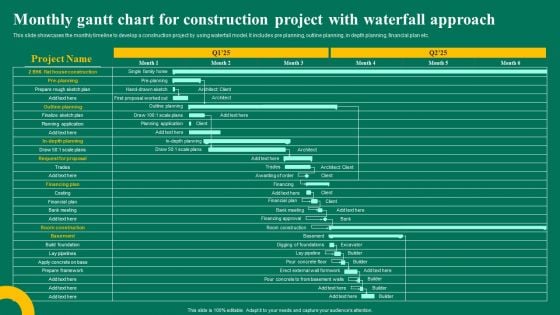
Monthly Gantt Chart For Construction Project With Waterfall Approach Ppt Infographics Clipart Images PDF
This slide showcases the monthly timeline to develop a construction project by using waterfall model. It includes pre planning, outline planning, in depth planning, financial plan etc. From laying roadmaps to briefing everything in detail, our templates are perfect for you. You can set the stage with your presentation slides. All you have to do is download these easy to edit and customizable templates. Monthly Gantt Chart For Construction Project With Waterfall Approach Ppt Infographics Clipart Images PDF will help you deliver an outstanding performance that everyone would remember and praise you for. Do download this presentation today.
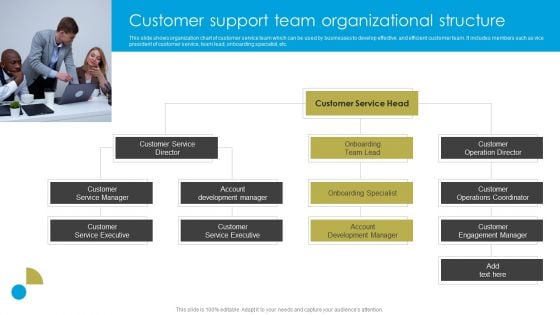
Service Strategy Guide To Maximize Customer Experience Customer Support Team Organizational Structure Infographics PDF
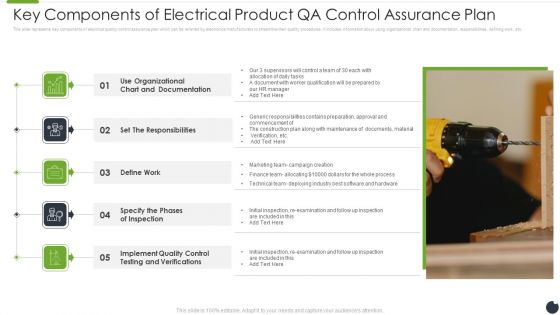
Key Components Of Electrical Product QA Control Assurance Plan Infographics PDF
This slide represents key components of electrical quality control assurance plan which can be referred by electronics manufacturers to streamline their quality procedures. It includes information about using organizational chart and documentation, responsibilities, defining work, etc. Presenting key components of electrical product qa control assurance plan infographics pdf to dispense important information. This template comprises five stages. It also presents valuable insights into the topics including set the responsibilities, define work, specify the phases of inspection. This is a completely customizable PowerPoint theme that can be put to use immediately. So, download it and address the topic impactfully.
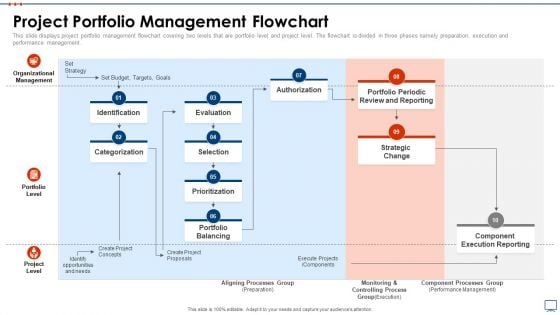
Strategic Business Plan Effective Tools Project Portfolio Management Flowchart Infographics PDF
This slide displays project portfolio management flowchart covering two levels that are portfolio level and project level. The flowchart is divided in three phases namely preparation, execution and performance management. This is a strategic business plan effective tools project portfolio management flowchart infographics pdf template with various stages. Focus and dispense information on ten stages using this creative set, that comes with editable features. It contains large content boxes to add your information on topics like organizational management, portfolio level, project level, strategic change, portfolio periodic review and reporting, evaluation. You can also showcase facts, figures, and other relevant content using this PPT layout. Grab it now.
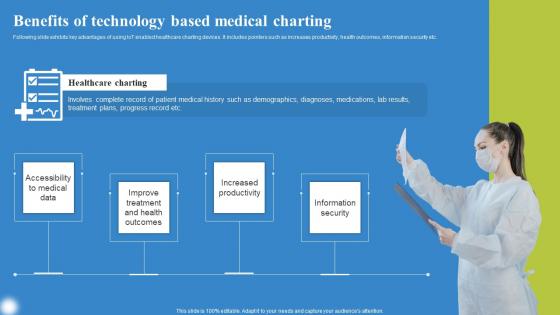
Benefits Of Technology Based Deploying IoT Solutions For Enhanced Healthcare Infographics Pdf
Following slide exhibits key advantages of using IoT enabled healthcare charting devices. It includes pointers such as increases productivity, health outcomes, information security etc. Formulating a presentation can take up a lot of effort and time, so the content and message should always be the primary focus. The visuals of the PowerPoint can enhance the presenters message, so our Benefits Of Technology Based Deploying IoT Solutions For Enhanced Healthcare Infographics Pdf was created to help save time. Instead of worrying about the design, the presenter can concentrate on the message while our designers work on creating the ideal templates for whatever situation is needed. Slidegeeks has experts for everything from amazing designs to valuable content, we have put everything into Benefits Of Technology Based Deploying IoT Solutions For Enhanced Healthcare Infographics Pdf Following slide exhibits key advantages of using IoT enabled healthcare charting devices. It includes pointers such as increases productivity, health outcomes, information security etc.
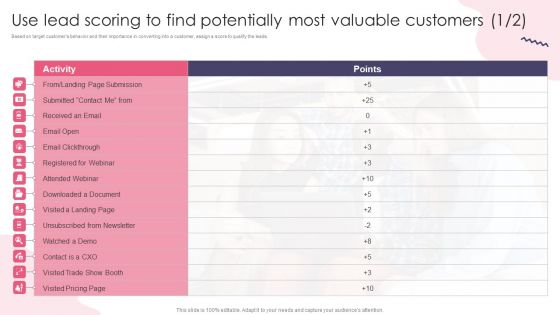
Use Lead Scoring To Find Potentially Most Valuable Customers Infographics PDF
Based on target customers behavior and their importance in converting into a customer, assign a score to qualify the leads. Retrieve professionally designed Use Lead Scoring To Find Potentially Most Valuable Customers Infographics PDF to effectively convey your message and captivate your listeners. Save time by selecting pre-made slideshows that are appropriate for various topics, from business to educational purposes. These themes come in many different styles, from creative to corporate, and all of them are easily adjustable and can be edited quickly. Access them as PowerPoint templates or as Google Slides themes. You do not have to go on a hunt for the perfect presentation because Slidegeeks got you covered from everywhere.
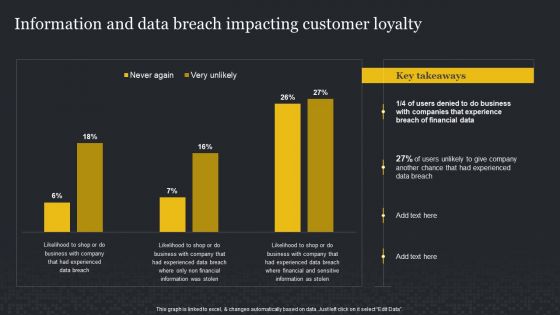
Information And Data Breach Impacting Customer Loyalty Cybersecurity Risk Assessment Infographics PDF
Retrieve professionally designed Information And Data Breach Impacting Customer Loyalty Cybersecurity Risk Assessment Infographics PDF to effectively convey your message and captivate your listeners. Save time by selecting pre-made slideshows that are appropriate for various topics, from business to educational purposes. These themes come in many different styles, from creative to corporate, and all of them are easily adjustable and can be edited quickly. Access them as PowerPoint templates or as Google Slides themes. You do not have to go on a hunt for the perfect presentation because Slidegeeks got you covered from everywhere.
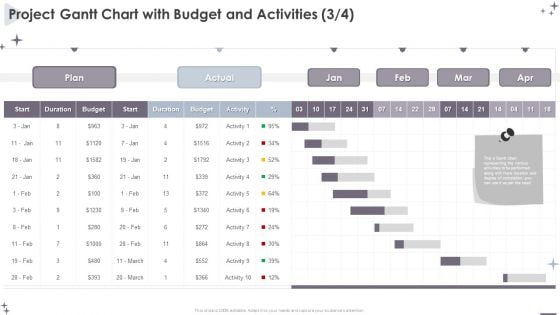
Project Administration Bundle Project Gantt Chart With Budget And Activities Infographics PDF
Your complex projects can be managed and organized simultaneously using this detailed Project Administration Bundle Project Gantt Chart With Budget And Activities Infographics PDF template. Track the milestones, tasks, phases, activities, and subtasks to get an updated visual of your project. Share your planning horizon and release plan with this well crafted presentation template. This exemplary template can be used to plot various dependencies to distinguish the tasks in the pipeline and their impact on the schedules and deadlines of the project. Apart from this, you can also share this visual presentation with your team members and stakeholders. It a resourceful tool that can be incorporated into your business structure. Therefore, download and edit it conveniently to add the data and statistics as per your requirement.
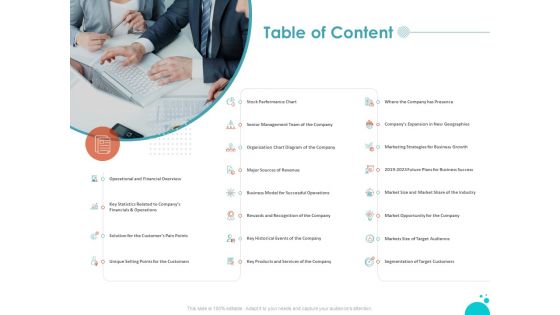
Investment Pitch For Aftermarket Table Of Content Ppt PowerPoint Presentation Infographics Graphic Tips PDF
Presenting this set of slides with name investment pitch for aftermarket table of content ppt powerpoint presentation infographics graphic tips pdf. This is a one stage process. The stages in this process are operational and financial overview, statistics related to companys financials and operations, solution customers pain points, key historical events company, stock performance chart, major sources revenue. This is a completely editable PowerPoint presentation and is available for immediate download. Download now and impress your audience.


 Continue with Email

 Home
Home


