Information Analysis
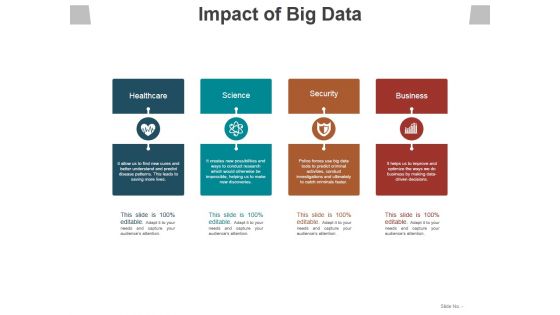
Impact Of Big Data Template 1 Ppt PowerPoint Presentation File Example File
This is a impact of big data template 1 ppt powerpoint presentation file example file. This is a four stage process. The stages in this process are healthcare, science, security, business.
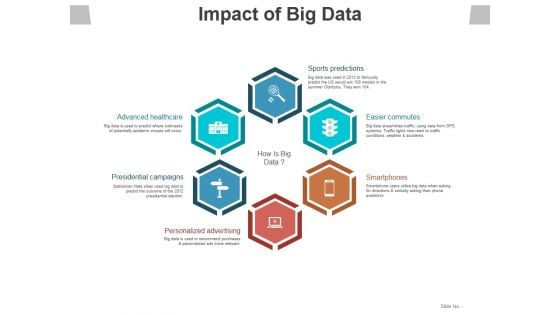
Impact Of Big Data Template 2 Ppt PowerPoint Presentation Styles Topics
This is a impact of big data template 2 ppt powerpoint presentation styles topics. This is a six stage process. The stages in this process are advanced healthcare, presidential campaigns, personalized advertising, smartphones, easier commutes.
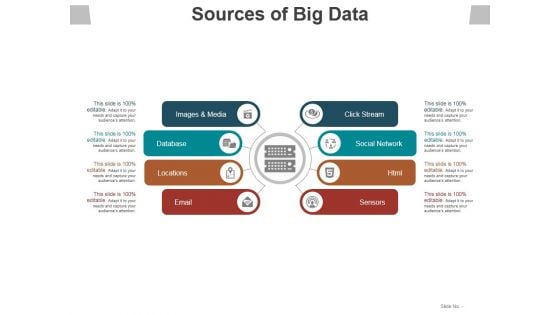
Sources Of Big Data Template 2 Ppt PowerPoint Presentation Layouts Picture
This is a sources of big data template 2 ppt powerpoint presentation layouts picture. This is a eight stage process. The stages in this process are images and media, database, locations, email, sensors.
View Data As A Shared Asset Ppt PowerPoint Presentation Icon Example Introduction
This is a view data as a shared asset ppt powerpoint presentation icon example introduction. This is a two stage process. The stages in this process are icons, strategy, business, management, marketing.
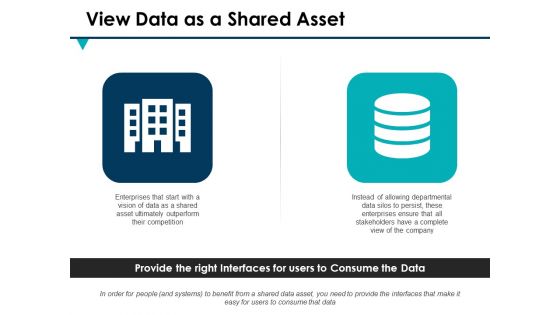
View Data As A Shared Asset Ppt PowerPoint Presentation Outline Design Ideas
This is a view data as a shared asset ppt powerpoint presentation outline design ideas. This is a two stage process. The stages in this process are marketing, business, management, planning, strategy.
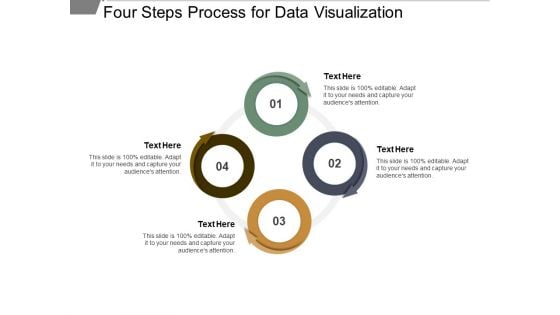
Four Steps Process For Data Visualization Ppt PowerPoint Presentation Infographic Template Inspiration
This is a four steps process for data visualization ppt powerpoint presentation infographic template inspiration. This is a four stage process. The stages in this process are circle process 4 arrows, circle cycle 4 arrows, circular process 4 arrows.
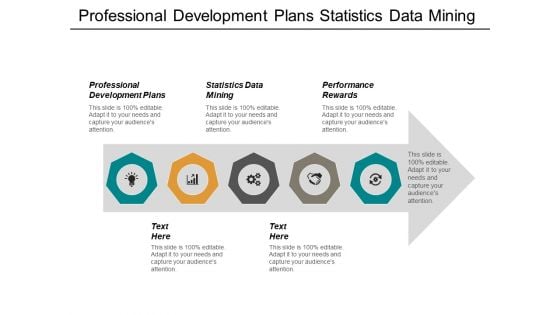
Professional Development Plans Statistics Data Mining Performance Rewards Ppt PowerPoint Presentation Styles Backgrounds
This is a professional development plans statistics data mining performance rewards ppt powerpoint presentation styles backgrounds. This is a five stage process. The stages in this process are professional development, debt management, online marketing, employee assessment.
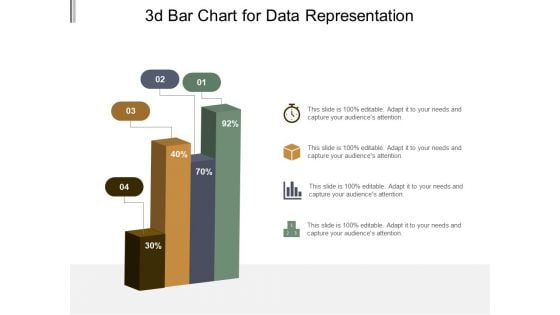
3D Bar Chart For Data Representation Ppt PowerPoint Presentation Model Graphic Tips
This is a 3d bar chart for data representation ppt powerpoint presentation model graphic tips. This is a four stage process. The stages in this process are art, colouring, paint brush.
3D Bar Chart To Display Data Ppt PowerPoint Presentation Icon Design Inspiration
This is a 3d bar chart to display data ppt powerpoint presentation icon design inspiration. This is a four stage process. The stages in this process are art, colouring, paint brush.
3D Chart For Graphical Display Of Data Ppt PowerPoint Presentation Styles Icon
This is a 3d chart for graphical display of data ppt powerpoint presentation styles icon. This is a four stage process. The stages in this process are art, colouring, paint brush.
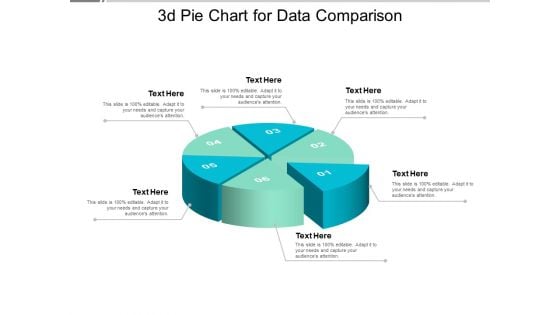
3D Pie Chart For Data Comparison Ppt PowerPoint Presentation Model Design Ideas
This is a 3d pie chart for data comparison ppt powerpoint presentation model design ideas. This is a six stage process. The stages in this process are art, colouring, paint brush.
6 Piece Pie Chart For Data Representation Ppt PowerPoint Presentation Professional Brochure
This is a 6 piece pie chart for data representation ppt powerpoint presentation professional brochure. This is a six stage process. The stages in this process are 6 piece pie chart, 6 segment pie chart, 6 parts pie chart.
6 Segments Pie Chart For Data Representation Ppt PowerPoint Presentation Icon Graphics
This is a 6 segments pie chart for data representation ppt powerpoint presentation icon graphics. This is a six stage process. The stages in this process are 6 piece pie chart, 6 segment pie chart, 6 parts pie chart.
7 Piece Pie Chart For Data Representation Ppt PowerPoint Presentation Portfolio Graphics
This is a 7 piece pie chart for data representation ppt powerpoint presentation portfolio graphics. This is a seven stage process. The stages in this process are 6 piece pie chart, 6 segment pie chart, 6 parts pie chart.
7 Segments Pie Chart For Data Representation Ppt PowerPoint Presentation Styles Summary
This is a 7 segments pie chart for data representation ppt powerpoint presentation styles summary. This is a seven stage process. The stages in this process are 6 piece pie chart, 6 segment pie chart, 6 parts pie chart.
8 Piece Pie Chart For Data Representation Ppt PowerPoint Presentation Ideas
This is a 8 piece pie chart for data representation ppt powerpoint presentation ideas. This is a eight stage process. The stages in this process are 6 piece pie chart, 6 segment pie chart, 6 parts pie chart.
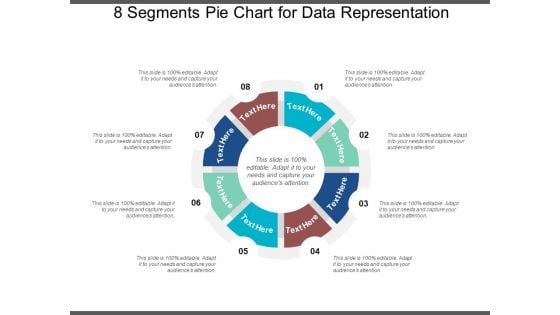
8 Segments Pie Chart For Data Representation Ppt PowerPoint Presentation Infographics Design Templates
This is a 8 segments pie chart for data representation ppt powerpoint presentation infographics design templates. This is a eight stage process. The stages in this process are 6 piece pie chart, 6 segment pie chart, 6 parts pie chart.
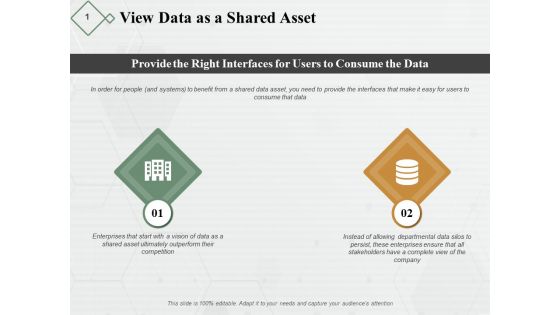
View Data As A Shared Asset Ppt PowerPoint Presentation Model Portfolio
This is a view data as a shared asset ppt powerpoint presentation model portfolio. This is a two stage process. The stages in this process are business, planning, strategy, marketing, management.

Data Governance Manage Configure Measure Ppt PowerPoint Presentation File Slide Portrait
This is a data governance manage configure measure ppt powerpoint presentation file slide portrait. This is a four stage process. The stages in this process are system integration, application integration, program integration.
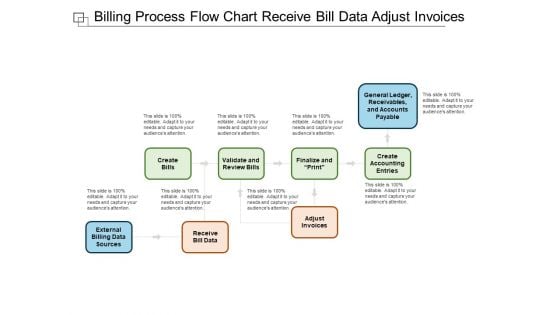
Billing Process Flow Chart Receive Bill Data Adjust Invoices Ppt Powerpoint Presentation Pictures Introduction
This is a billing process flow chart receive bill data adjust invoices ppt powerpoint presentation pictures introduction. This is a eight stage process. The stages in this process are billing process, billing procedure, billing cycle.
Six Steps Of System Development Service Delivery And Data Security Ppt PowerPoint Presentation Icon Slide Download
This is a six steps of system development service delivery and data security ppt powerpoint presentation icon slide download. This is a six stage process. The stages in this process are risk management, risk factors, risk variable.
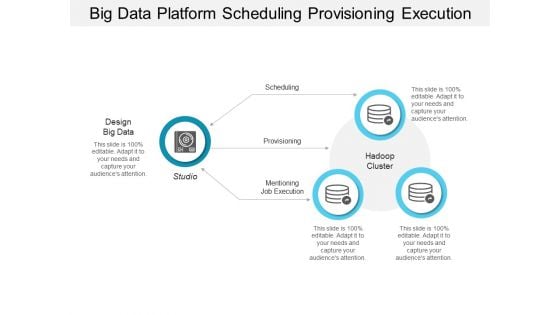
Big Data Platform Scheduling Provisioning Execution Ppt Powerpoint Presentation Professional File Formats
This is a big data platform scheduling provisioning execution ppt powerpoint presentation professional file formats. This is a four stage process. The stages in this process are functional architecture, functional planning, functional designing.
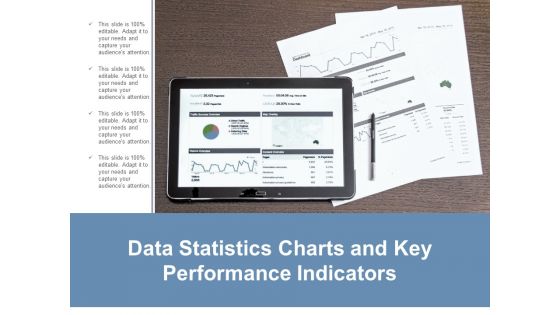
Data Statistics Charts And Key Performance Indicators Ppt Powerpoint Presentation Layouts Guide
This is a data statistics charts and key performance indicators ppt powerpoint presentation layouts guide. This is a four stage process. The stages in this process are business metrics, business kpi, business dashboard.
Man Looking At Data Charts For Operation Kpi Evaluation Ppt Powerpoint Presentation Ideas Demonstration
This is a man looking at data charts for operation kpi evaluation ppt powerpoint presentation ideas demonstration. This is a four stage process. The stages in this process are business metrics, business kpi, business dashboard.
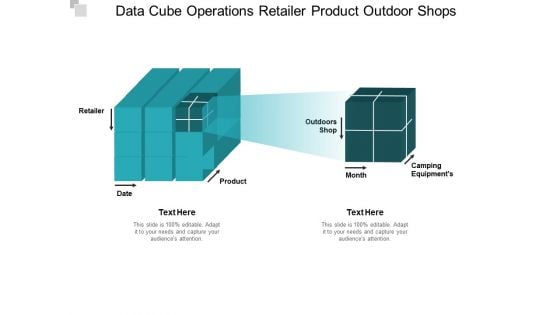
Data Cube Operations Retailer Product Outdoor Shops Ppt PowerPoint Presentation Ideas Skills
This is a data cube operations retailer product outdoor shops ppt powerpoint presentation ideas skills. This is a two stage process. The stages in this process are hierarchy, drill down, top downwards.
Data Migration On Cloud Serase Device Ppt PowerPoint Presentation Icon Ideas
This is a data migration on cloud serase device ppt powerpoint presentation icon ideas. This is a six stage process. The stages in this process are business, management, marketing, process.
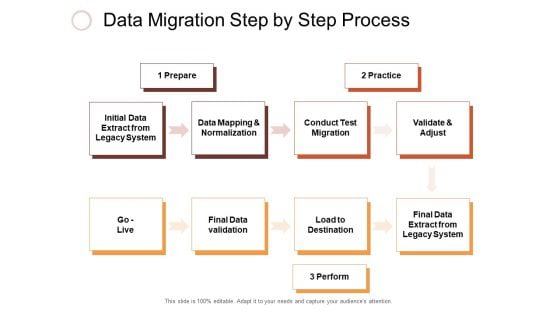
Data Migration Step By Step Process Ppt PowerPoint Presentation Show Styles
This is a data migration step by step process ppt powerpoint presentation show styles. This is a three stage process. The stages in this process are business, management, marketing.

Simplified Illustration Of Data Migration Steps Ppt PowerPoint Presentation Inspiration Professional
This is a simplified illustration of data migration steps ppt powerpoint presentation inspiration professional. This is a three stage process. The stages in this process are business, management, marketing.
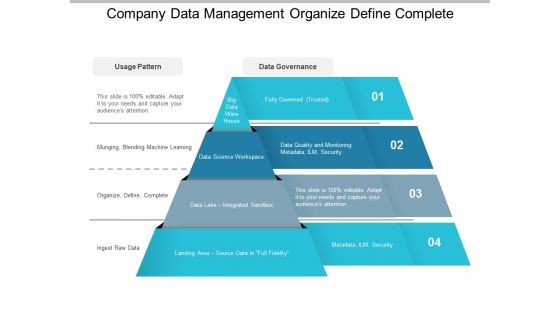
Company Data Management Organize Define Complete Ppt PowerPoint Presentation Summary Samples
This is a company data management organize define complete ppt powerpoint presentation summary samples. This is a four stage process. The stages in this process are governance pyramid, risk management pyramid, business.
Five Steps Data Governance Pyramid Quality Management Ppt PowerPoint Presentation Icon Clipart
This is a five steps data governance pyramid quality management ppt powerpoint presentation icon clipart. This is a five stage process. The stages in this process are governance pyramid, risk management pyramid, business.

Four Levels Enterprise Data Management Pyramid Ppt PowerPoint Presentation Gallery Summary
This is a four levels enterprise data management pyramid ppt powerpoint presentation gallery summary. This is a four stage process. The stages in this process are governance pyramid, risk management pyramid, business.
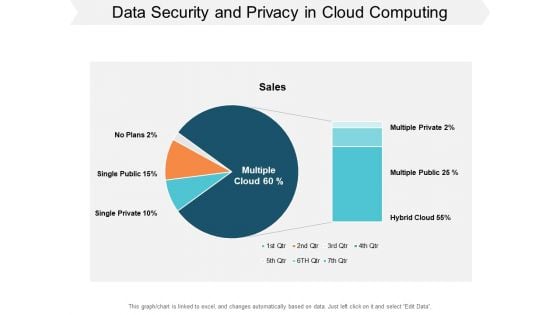
Data Security And Privacy In Cloud Computing Ppt PowerPoint Presentation Slides Graphic Tips
This is a data security and privacy in cloud computing ppt powerpoint presentation slides graphic tips. This is a two stage process. The stages in this process are cloud strategy, cloud planning, cloud management.
Web Analytics Icons Computer Screen With Data Charts Ppt PowerPoint Presentation Ideas Outline
This is a web analytics icons computer screen with data charts ppt powerpoint presentation ideas outline. This is a four stage process. The stages in this process are digital analytics, digital dashboard, marketing.
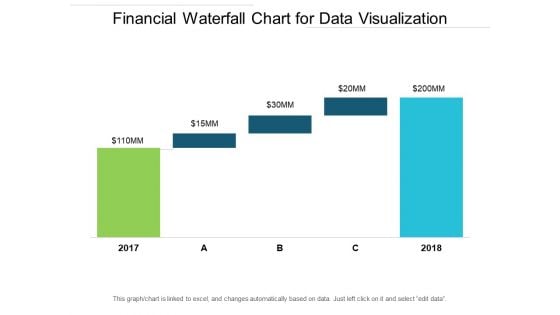
Financial Waterfall Chart For Data Visualization Ppt PowerPoint Presentation Ideas Elements
This is a financial waterfall chart for data visualization ppt powerpoint presentation ideas elements. This is a five stage process. The stages in this process are sales waterfall, waterfall chart, business.
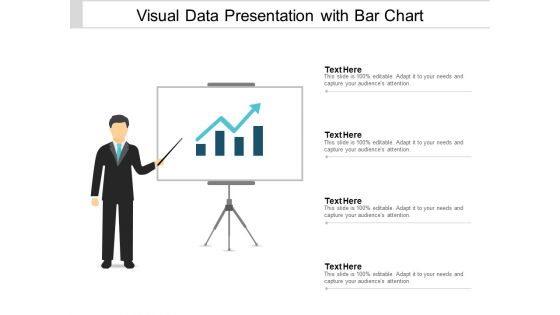
Visual Data Presentation With Bar Chart Ppt PowerPoint Presentation Portfolio Brochure
This is a visual data presentation with bar chart ppt powerpoint presentation portfolio brochure. This is a four stage process. The stages in this process are visual aids, communication, business.

Test Data Management Challenges Solution And Benefits Ppt PowerPoint Presentation Pictures Show
This is a test data management challenges solution and benefits ppt powerpoint presentation pictures show. This is a three stage process. The stages in this process are challenge, solution, benefit.
Cloud Storage Data Sync Vector Icon Ppt PowerPoint Presentation Pictures Good
This is a cloud storage data sync vector icon ppt powerpoint presentation pictures good. This is a three stage process. The stages in this process are continuous icon, repeating icon, unbroken icon.
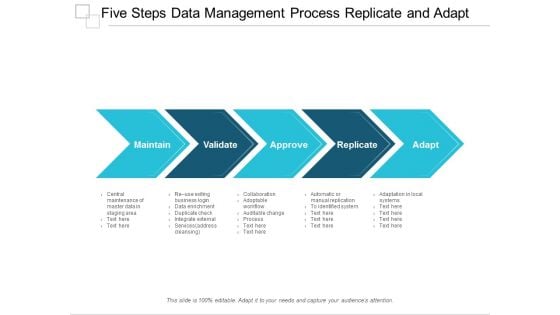
Five Steps Data Management Process Replicate And Adapt Ppt Powerpoint Presentation Inspiration Example Topics
This is a five steps data management process replicate and adapt ppt powerpoint presentation inspiration example topics. This is a five stage process. The stages in this process are governance model, governance flow, governance structures.
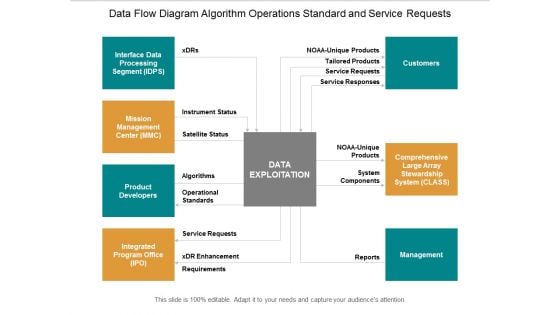
Data Flow Diagram Algorithm Operations Standard And Service Requests Ppt Powerpoint Presentation Inspiration Ideas
This is a data flow diagram algorithm operations standard and service requests ppt powerpoint presentation inspiration ideas. This is a six stage process. The stages in this process are context diagram, context shapes, context visuals.
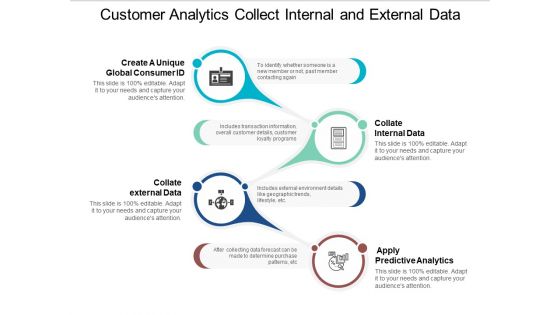
Customer Analytics Collect Internal And External Data Ppt PowerPoint Presentation Portfolio Skills
This is a customer analytics collect internal and external data ppt powerpoint presentation portfolio skills. This is a four stage process. The stages in this process are employee performance review, job evaluation, customer 360.
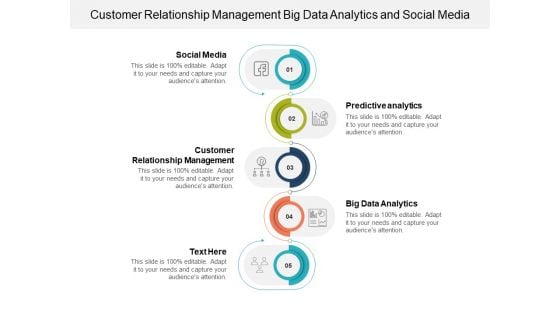
Customer Relationship Management Big Data Analytics And Social Media Ppt PowerPoint Presentation Show Ideas
This is a customer relationship management big data analytics and social media ppt powerpoint presentation show ideas. This is a five stage process. The stages in this process are employee performance review, job evaluation, customer 360.
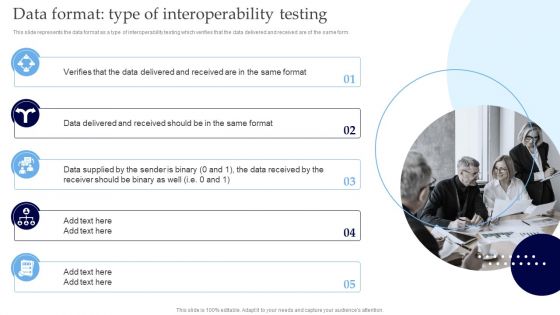
Interoperability Software Testing Data Format Type Of Interoperability Testing Slides PDF
This slide represents the data format as a type of interoperability testing which verifies that the data delivered and received are of the same form. Whether you have daily or monthly meetings, a brilliant presentation is necessary. Interoperability Software Testing Data Format Type Of Interoperability Testing Slides PDF can be your best option for delivering a presentation. Represent everything in detail using Interoperability Software Testing Data Format Type Of Interoperability Testing Slides PDF and make yourself stand out in meetings. The template is versatile and follows a structure that will cater to your requirements. All the templates prepared by Slidegeeks are easy to download and edit. Our research experts have taken care of the corporate themes as well. So, give it a try and see the results.
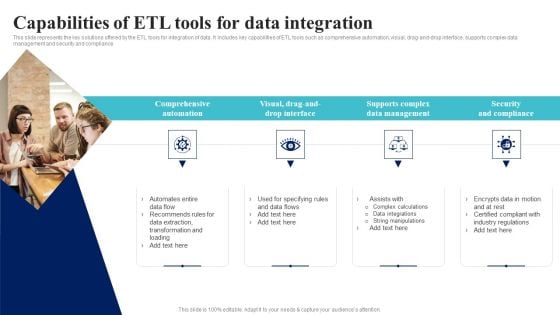
BI Implementation To Enhance Hiring Process Capabi Lities Of Etl Tools For Data Integration Ideas PDF
This slide represents the key solutions offered by the ETL tools for integration of data. It includes key capabilities of ETL tools such as comprehensive automation, visual, drag-and-drop interface, supports complex data management and security and compliance.Do you have an important presentation coming up Are you looking for something that will make your presentation stand out from the rest Look no further than BI Implementation To Enhance Hiring Process Capabi Lities Of Etl Tools For Data Integration Ideas PDF. With our professional designs, you can trust that your presentation will pop and make delivering it a smooth process. And with Slidegeeks, you can trust that your presentation will be unique and memorable. So why wait Grab BI Implementation To Enhance Hiring Process Capabi Lities Of Etl Tools For Data Integration Ideas PDF today and make your presentation stand out from the rest.
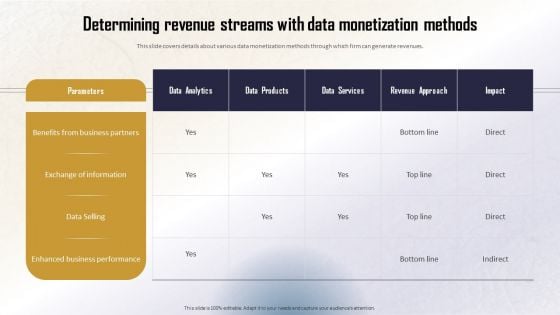
Identifying Direct And Indirect Determining Revenue Streams With Data Monetization Clipart PDF
This slide covers details about various data monetization methods through which firm can generate revenues. Presenting this PowerPoint presentation, titled Identifying Direct And Indirect Determining Revenue Streams With Data Monetization Clipart PDF, with topics curated by our researchers after extensive research. This editable presentation is available for immediate download and provides attractive features when used. Download now and captivate your audience. Presenting this Identifying Direct And Indirect Determining Revenue Streams With Data Monetization Clipart PDF. Our researchers have carefully researched and created these slides with all aspects taken into consideration. This is a completely customizable Identifying Direct And Indirect Determining Revenue Streams With Data Monetization Clipart PDF that is available for immediate downloading. Download now and make an impact on your audience. Highlight the attractive features available with our PPTs.
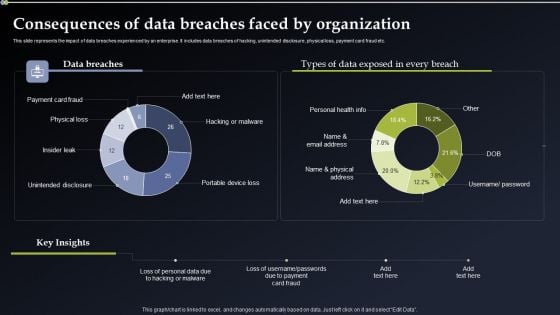
Deploying Cyber Security Incident Response Administration Consequences Of Data Breaches Portrait PDF
This slide represents the impact of data breaches experienced by an enterprise. It includes data breaches of hacking, unintended disclosure, physical loss, payment card fraud etc. Do you have to make sure that everyone on your team knows about any specific topic I yes, then you should give Deploying Cyber Security Incident Response Administration Consequences Of Data Breaches Portrait PDF a try. Our experts have put a lot of knowledge and effort into creating this impeccable Deploying Cyber Security Incident Response Administration Consequences Of Data Breaches Portrait PDF. You can use this template for your upcoming presentations, as the slides are perfect to represent even the tiniest detail. You can download these templates from the Slidegeeks website and these are easy to edit. So grab these today.
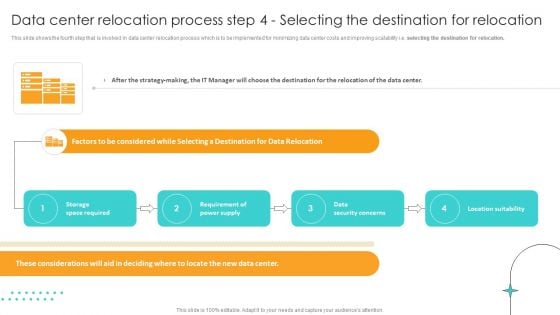
Data Center Relocation Process Step 4 Selecting The Destination For Relocation Topics PDF
This slide shows the fourth step that is involved in data center relocation process which is to be implemented for minimizing data center costs and improving scalability i.e. selecting the destination for relocation. Whether you have daily or monthly meetings, a brilliant presentation is necessary. Data Center Relocation Process Step 4 Selecting The Destination For Relocation Topics PDF can be your best option for delivering a presentation. Represent everything in detail using Data Center Relocation Process Step 4 Selecting The Destination For Relocation Topics PDF and make yourself stand out in meetings. The template is versatile and follows a structure that will cater to your requirements. All the templates prepared by Slidegeeks are easy to download and edit. Our research experts have taken care of the corporate themes as well. So, give it a try and see the results.

30 60 90 Days Plan For Data Migration Ppt PowerPoint Presentation File Gallery PDF
This slide represents the 30 60 90 days plan for data migration to cloud storage and the tasks to be performed at each interval of 30 days. Presenting this PowerPoint presentation, titled 30 60 90 Days Plan For Data Migration Ppt PowerPoint Presentation File Gallery PDF, with topics curated by our researchers after extensive research. This editable presentation is available for immediate download and provides attractive features when used. Download now and captivate your audience. Presenting this 30 60 90 Days Plan For Data Migration Ppt PowerPoint Presentation File Gallery PDF. Our researchers have carefully researched and created these slides with all aspects taken into consideration. This is a completely customizable 30 60 90 Days Plan For Data Migration Ppt PowerPoint Presentation File Gallery PDF that is available for immediate downloading. Download now and make an impact on your audience. Highlight the attractive features available with our PPTs.
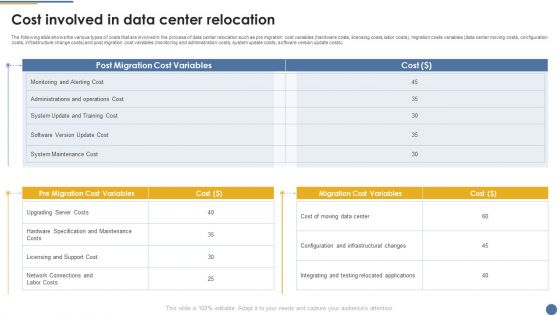
Assessment And Workflow Cost Involved In Data Center Relocation Inspiration PDF
The following slide shows the various types of costs that are involved in the process of data center relocation such as pre migration cost variables hardware costs, licensing costs, labor costs, migration costs variables data center moving costs, configuration costs, infrastructure change costs and post migration cost variables monitoring and administration costs, system update costs, software version update costs. Create an editable Assessment And Workflow Cost Involved In Data Center Relocation Inspiration PDF that communicates your idea and engages your audience. Whether youre presenting a business or an educational presentation, pre-designed presentation templates help save time. Assessment And Workflow Cost Involved In Data Center Relocation Inspiration PDF is highly customizable and very easy to edit, covering many different styles from creative to business presentations. Slidegeeks has creative team members who have crafted amazing templates. So, go and get them without any delay.
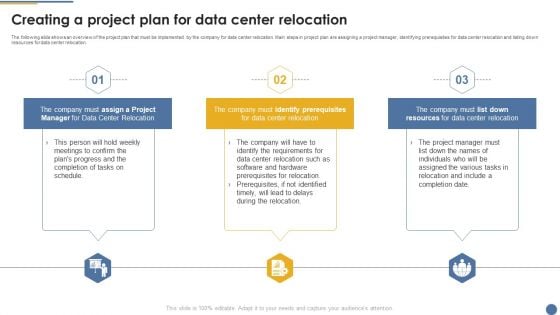
Assessment And Workflow Creating A Project Plan For Data Center Relocation Formats PDF
The following slide shows an overview of the project plan that must be implemented by the company for data center relocation. Main steps in project plan are assigning a project manager, identifying prerequisites for data center relocation and listing down resources for data center relocation. Slidegeeks is one of the best resources for PowerPoint templates. You can download easily and regulate Assessment And Workflow Creating A Project Plan For Data Center Relocation Formats PDF for your personal presentations from our wonderful collection. A few clicks is all it takes to discover and get the most relevant and appropriate templates. Use our Templates to add a unique zing and appeal to your presentation and meetings. All the slides are easy to edit and you can use them even for advertisement purposes.
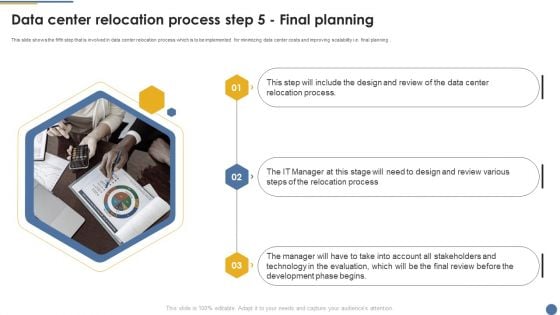
Assessment And Workflow Data Center Relocation Process Step 5 Final Planning Diagrams PDF
This slide shows the fifth step that is involved in data center relocation process which is to be implemented for minimizing data center costs and improving scalability i.e. final planning. Do you have an important presentation coming up Are you looking for something that will make your presentation stand out from the rest Look no further than Assessment And Workflow Data Center Relocation Process Step 5 Final Planning Diagrams PDF. With our professional designs, you can trust that your presentation will pop and make delivering it a smooth process. And with Slidegeeks, you can trust that your presentation will be unique and memorable. So why wait Grab Assessment And Workflow Data Center Relocation Process Step 5 Final Planning Diagrams PDF today and make your presentation stand out from the rest.
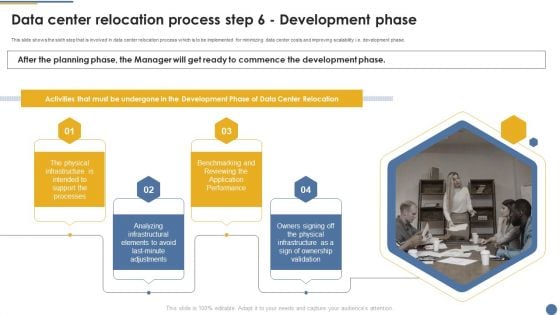
Assessment And Workflow Data Center Relocation Process Step 6 Development Phase Structure PDF
This slide shows the sixth step that is involved in data center relocation process which is to be implemented for minimizing data center costs and improving scalability i.e. development phase. Whether you have daily or monthly meetings, a brilliant presentation is necessary. Assessment And Workflow Data Center Relocation Process Step 6 Development Phase Structure PDF can be your best option for delivering a presentation. Represent everything in detail using Assessment And Workflow Data Center Relocation Process Step 6 Development Phase Structure PDF and make yourself stand out in meetings. The template is versatile and follows a structure that will cater to your requirements. All the templates prepared by Slidegeeks are easy to download and edit. Our research experts have taken care of the corporate themes as well. So, give it a try and see the results.
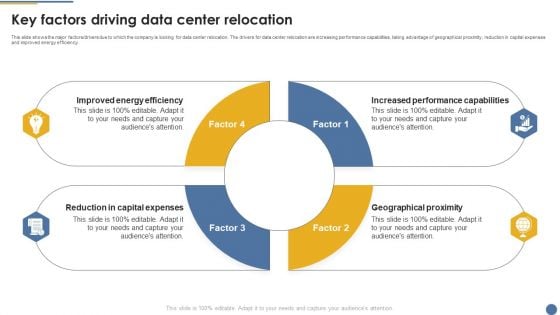
Assessment And Workflow Key Factors Driving Data Center Relocation Themes PDF
This slide shows the major factors or drivers due to which the company is looking for data center relocation. The drivers for data center relocation are increasing performance capabilities, taking advantage of geographical proximity, reduction in capital expenses and improved energy efficiency. Crafting an eye-catching presentation has never been more straightforward. Let your presentation shine with this tasteful yet straightforward Assessment And Workflow Key Factors Driving Data Center Relocation Themes PDF template. It offers a minimalistic and classy look that is great for making a statement. The colors have been employed intelligently to add a bit of playfulness while still remaining professional. Construct the ideal Assessment And Workflow Key Factors Driving Data Center Relocation Themes PDF that effortlessly grabs the attention of your audience Begin now and be certain to wow your customers.
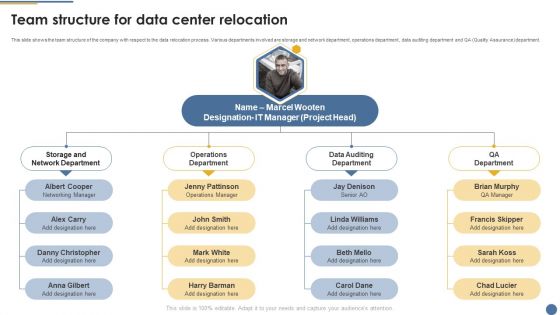
Assessment And Workflow Team Structure For Data Center Relocation Themes PDF
This slide shows the team structure of the company with respect to the data relocation process. Various departments involved are storage and network department, operations department, data auditing department and QA Quality Assuranc department. This Assessment And Workflow Team Structure For Data Center Relocation Themes PDF is perfect for any presentation, be it in front of clients or colleagues. It is a versatile and stylish solution for organizing your meetings. The Assessment And Workflow Team Structure For Data Center Relocation Themes PDF features a modern design for your presentation meetings. The adjustable and customizable slides provide unlimited possibilities for acing up your presentation. Slidegeeks has done all the homework before launching the product for you. So, dont wait, grab the presentation templates today.
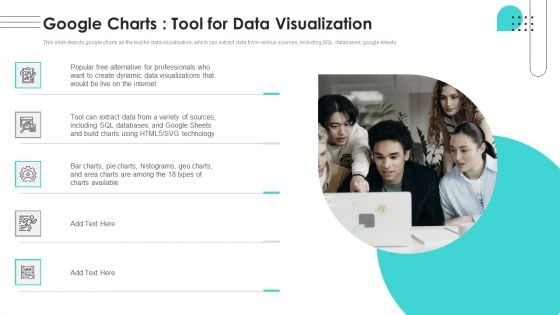
Branches For Visualization Research And Development Google Charts Tool For Data Elements PDF
This slide depicts google charts as the tool for data visualization, which can extract data from various sources, including SQL, databases, google sheets. Do you have an important presentation coming up Are you looking for something that will make your presentation stand out from the rest Look no further than Branches For Visualization Research And Development Google Charts Tool For Data Elements PDF. With our professional designs, you can trust that your presentation will pop and make delivering it a smooth process. And with Slidegeeks, you can trust that your presentation will be unique and memorable. So why wait Grab Branches For Visualization Research And Development Google Charts Tool For Data Elements PDF today and make your presentation stand out from the rest.
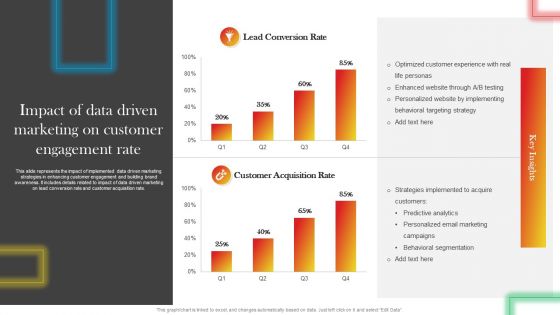
Impact Of Data Driven Marketing On Customer Engagement Rate Brochure PDF
This slide represents the impact of implemented data driven marketing strategies in enhancing customer engagement and building brand awareness. It includes details related to impact of data driven marketing on lead conversion rate and customer acquisition rate. Do you have an important presentation coming up Are you looking for something that will make your presentation stand out from the rest Look no further than Impact Of Data Driven Marketing On Customer Engagement Rate Brochure PDF. With our professional designs, you can trust that your presentation will pop and make delivering it a smooth process. And with Slidegeeks, you can trust that your presentation will be unique and memorable. So why wait Grab Impact Of Data Driven Marketing On Customer Engagement Rate Brochure PDF today and make your presentation stand out from the rest
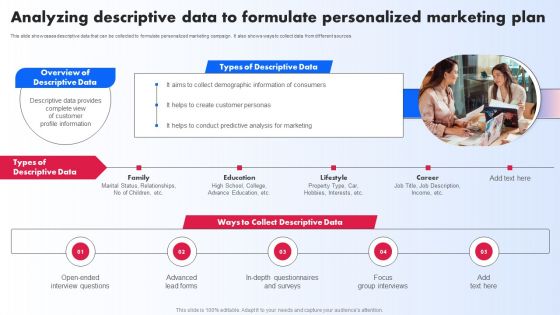
Analyzing Descriptive Data To Formulate Personalized Marketing Plan Ppt PowerPoint Presentation File Show PDF
This slide showcases descriptive data that can be collected to formulate personalized marketing campaign. It also shows ways to collect data from different sources. Create an editable Analyzing Descriptive Data To Formulate Personalized Marketing Plan Ppt PowerPoint Presentation File Show PDF that communicates your idea and engages your audience. Whether youre presenting a business or an educational presentation, pre designed presentation templates help save time. Analyzing Descriptive Data To Formulate Personalized Marketing Plan Ppt PowerPoint Presentation File Show PDF is highly customizable and very easy to edit, covering many different styles from creative to business presentations. Slidegeeks has creative team members who have crafted amazing templates. So, go and get them without any delay.
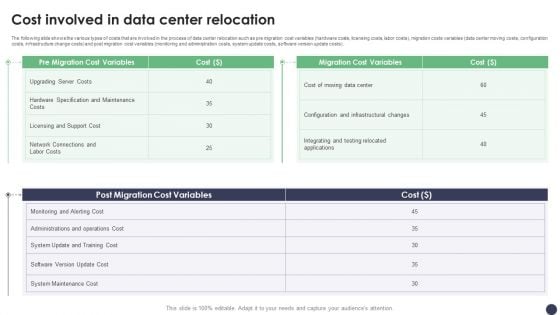
Cost Involved In Data Center Relocation Ppt PowerPoint Presentation File Example PDF
The following slide shows the various types of costs that are involved in the process of data center relocation such as pre migration cost variables hardware costs, licensing costs, labor costs, migration costs variables data center moving costs, configuration costs, infrastructure change costs and post migration cost variables monitoring and administration costs, system update costs, software version update costs. Do you have to make sure that everyone on your team knows about any specific topic I yes, then you should give Cost Involved In Data Center Relocation Ppt PowerPoint Presentation File Example PDF a try. Our experts have put a lot of knowledge and effort into creating this impeccable Cost Involved In Data Center Relocation Ppt PowerPoint Presentation File Example PDF. You can use this template for your upcoming presentations, as the slides are perfect to represent even the tiniest detail. You can download these templates from the Slidegeeks website and these are easy to edit. So grab these today.
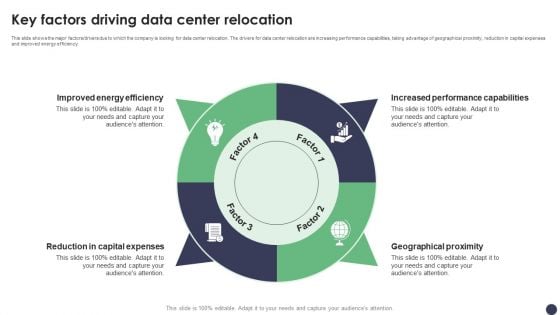
Key Factors Driving Data Center Relocation Ppt PowerPoint Presentation File Ideas PDF
This slide shows the major factorsdrivers due to which the company is looking for data center relocation. The drivers for data center relocation are increasing performance capabilities, taking advantage of geographical proximity, reduction in capital expenses and improved energy efficiency. Whether you have daily or monthly meetings, a brilliant presentation is necessary. Key Factors Driving Data Center Relocation Ppt PowerPoint Presentation File Ideas PDF can be your best option for delivering a presentation. Represent everything in detail using Key Factors Driving Data Center Relocation Ppt PowerPoint Presentation File Ideas PDF and make yourself stand out in meetings. The template is versatile and follows a structure that will cater to your requirements. All the templates prepared by Slidegeeks are easy to download and edit. Our research experts have taken care of the corporate themes as well. So, give it a try and see the results.
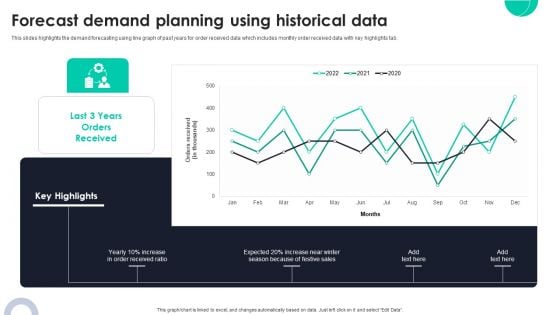
Forecast Demand Planning Using Historical Data Ppt PowerPoint Presentation Diagram Graph Charts PDF
This slides highlights the demand forecasting using line graph of past years for order received data which includes monthly order received data with key highlights tab. Crafting an eye catching presentation has never been more straightforward. Let your presentation shine with this tasteful yet straightforward Forecast Demand Planning Using Historical Data Ppt PowerPoint Presentation Diagram Graph Charts PDF template. It offers a minimalistic and classy look that is great for making a statement. The colors have been employed intelligently to add a bit of playfulness while still remaining professional. Construct the ideal Forecast Demand Planning Using Historical Data Ppt PowerPoint Presentation Diagram Graph Charts PDF that effortlessly grabs the attention of your audience. Begin now and be certain to wow your customers.

Building Clean Data With Profit Margins And Sales Prices Ppt Outline Ideas PDF
The following slide illustrates the steps to organize and maintain clean data for improved customer relationship management. It also includes activities such as determining, cleaning and restricting duplicate data etc. Crafting an eye catching presentation has never been more straightforward. Let your presentation shine with this tasteful yet straightforward Building Clean Data With Profit Margins And Sales Prices Ppt Outline Ideas PDF template. It offers a minimalistic and classy look that is great for making a statement. The colors have been employed intelligently to add a bit of playfulness while still remaining professional. Construct the ideal Building Clean Data With Profit Margins And Sales Prices Ppt Outline Ideas PDF that effortlessly grabs the attention of your audience Begin now and be certain to wow your customers.


 Continue with Email

 Home
Home


