Information Technology Icons
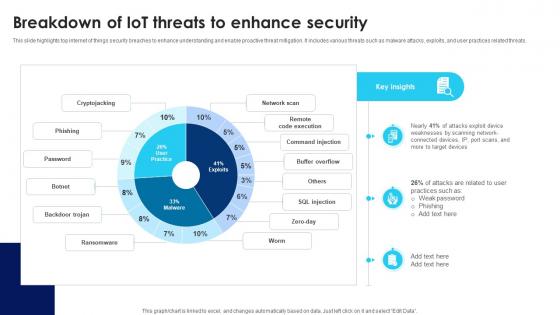
Building Trust With IoT Security Breakdown Of IoT Threats To Enhance Security IoT SS V
This slide highlights top internet of things security breaches to enhance understanding and enable proactive threat mitigation. It includes various threats such as malware attacks, exploits, and user practices related threats. Present like a pro with Building Trust With IoT Security Breakdown Of IoT Threats To Enhance Security IoT SS V. Create beautiful presentations together with your team, using our easy-to-use presentation slides. Share your ideas in real-time and make changes on the fly by downloading our templates. So whether you are in the office, on the go, or in a remote location, you can stay in sync with your team and present your ideas with confidence. With Slidegeeks presentation got a whole lot easier. Grab these presentations today. This slide highlights top internet of things security breaches to enhance understanding and enable proactive threat mitigation. It includes various threats such as malware attacks, exploits, and user practices related threats.
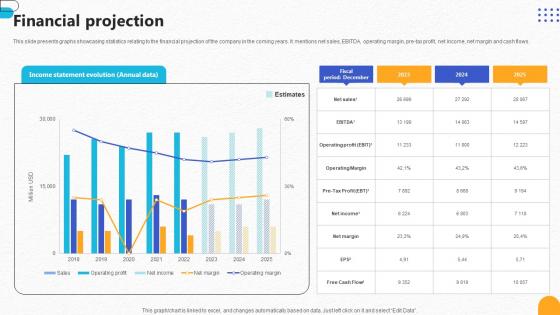
Financial Projection Pharmaceutical R And D Company Pitch Deck
This slide presents graphs showcasing statistics relating to the financial projection of the company in the coming years. It mentions net sales, EBITDA, operating margin, pre-tax profit, net income, net margin and cash flows. Slidegeeks is here to make your presentations a breeze with Financial Projection Pharmaceutical R And D Company Pitch Deck With our easy-to-use and customizable templates, you can focus on delivering your ideas rather than worrying about formatting. With a variety of designs to choose from, you are sure to find one that suits your needs. And with animations and unique photos, illustrations, and fonts, you can make your presentation pop. So whether you are giving a sales pitch or presenting to the board, make sure to check out Slidegeeks first This slide presents graphs showcasing statistics relating to the financial projection of the company in the coming years. It mentions net sales, EBITDA, operating margin, pre-tax profit, net income, net margin and cash flows.
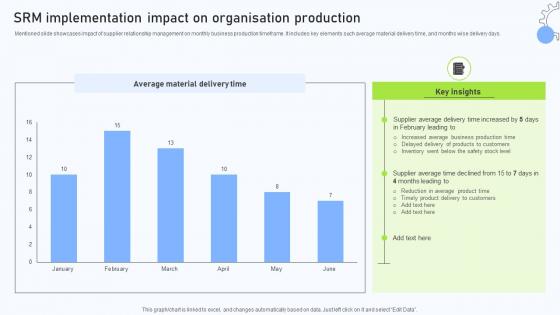
Relationship Management Automation SRM Implementation Impact On Organisation Production
Mentioned slide showcases impact of supplier relationship management on monthly business production timeframe. It includes key elements such average material delivery time, and months wise delivery days. From laying roadmaps to briefing everything in detail, our templates are perfect for you. You can set the stage with your presentation slides. All you have to do is download these easy-to-edit and customizable templates. Relationship Management Automation SRM Implementation Impact On Organisation Production will help you deliver an outstanding performance that everyone would remember and praise you for. Do download this presentation today. Mentioned slide showcases impact of supplier relationship management on monthly business production timeframe. It includes key elements such average material delivery time, and months wise delivery days.
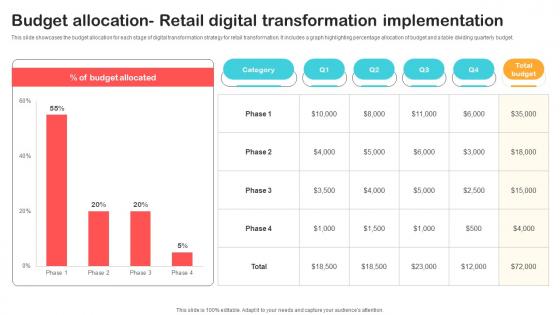
Budget Allocation Retail Digital Transformation Optimizing Retail Operations With Digital DT SS V
This slide showcases the budget allocation for each stage of digital transformation strategy for retail transformation. It includes a graph highlighting percentage allocation of budget and a table dividing quarterly budget.From laying roadmaps to briefing everything in detail, our templates are perfect for you. You can set the stage with your presentation slides. All you have to do is download these easy-to-edit and customizable templates. Budget Allocation Retail Digital Transformation Optimizing Retail Operations With Digital DT SS V will help you deliver an outstanding performance that everyone would remember and praise you for. Do download this presentation today. This slide showcases the budget allocation for each stage of digital transformation strategy for retail transformation. It includes a graph highlighting percentage allocation of budget and a table dividing quarterly budget.
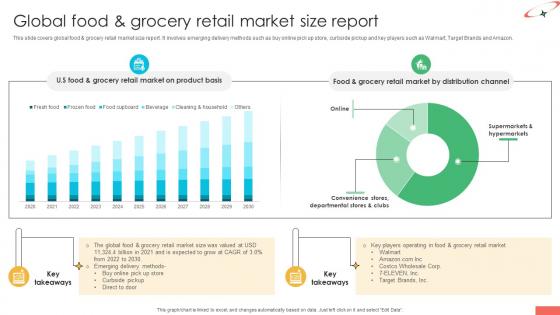
Marketing Strategies For Effective Global Food And Grocery Retail Market Size Report
This slide covers global food and grocery retail market size report. It involves emerging delivery methods such as buy online pick up store, curbside pickup and key players such as Walmart, Target Brands and Amazon. If your project calls for a presentation, then Slidegeeks is your go-to partner because we have professionally designed, easy-to-edit templates that are perfect for any presentation. After downloading, you can easily edit Marketing Strategies For Effective Global Food And Grocery Retail Market Size Report and make the changes accordingly. You can rearrange slides or fill them with different images. Check out all the handy templates This slide covers global food and grocery retail market size report. It involves emerging delivery methods such as buy online pick up store, curbside pickup and key players such as Walmart, Target Brands and Amazon.
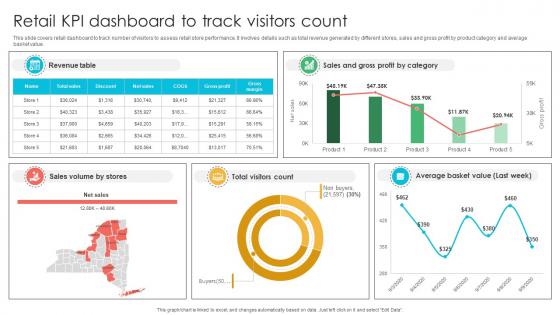
Marketing Strategies For Effective Retail KPI Dashboard To Track Visitors Count
This slide covers retail dashboard to track number of visitors to assess retail store performance. It involves details such as total revenue generated by different stores, sales and gross profit by product category and average basket value. Want to ace your presentation in front of a live audience Our Marketing Strategies For Effective Retail KPI Dashboard To Track Visitors Count can help you do that by engaging all the users towards you. Slidegeeks experts have put their efforts and expertise into creating these impeccable powerpoint presentations so that you can communicate your ideas clearly. Moreover, all the templates are customizable, and easy-to-edit and downloadable. Use these for both personal and commercial use. This slide covers retail dashboard to track number of visitors to assess retail store performance. It involves details such as total revenue generated by different stores, sales and gross profit by product category and average basket value.
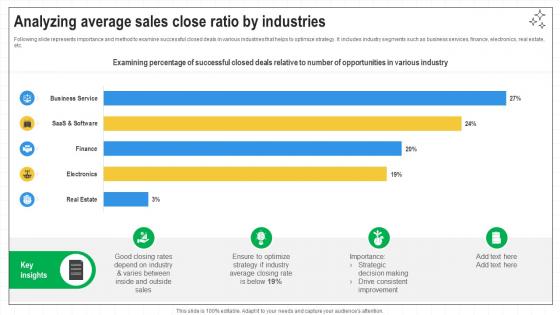
Closing Techniques To Seal Analyzing Average Sales Close Ratio By Industries SA SS V
Following slide represents importance and method to examine successful closed deals in various industries that helps to optimize strategy. It includes industry segments such as business services, finance, electronics, real estate, etc. Create an editable Closing Techniques To Seal Analyzing Average Sales Close Ratio By Industries SA SS V that communicates your idea and engages your audience. Whether you are presenting a business or an educational presentation, pre-designed presentation templates help save time. Closing Techniques To Seal Analyzing Average Sales Close Ratio By Industries SA SS V is highly customizable and very easy to edit, covering many different styles from creative to business presentations. Slidegeeks has creative team members who have crafted amazing templates. So, go and get them without any delay. Following slide represents importance and method to examine successful closed deals in various industries that helps to optimize strategy. It includes industry segments such as business services, finance, electronics, real estate, etc.
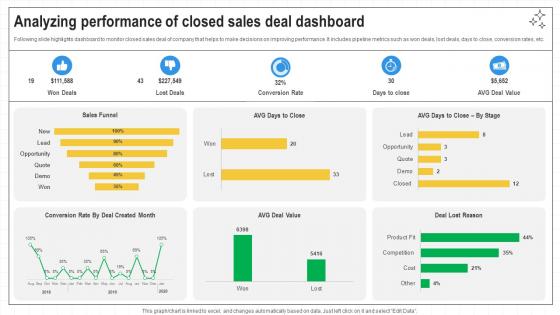
Closing Techniques To Seal Analyzing Performance Of Closed Sales Deal Dashboard SA SS V
Following slide highlights dashboard to monitor closed sales deal of company that helps to make decisions on improving performance. It includes pipeline metrics such as won deals, lost deals, days to close, conversion rates, etc. Want to ace your presentation in front of a live audience Our Closing Techniques To Seal Analyzing Performance Of Closed Sales Deal Dashboard SA SS V can help you do that by engaging all the users towards you. Slidegeeks experts have put their efforts and expertise into creating these impeccable powerpoint presentations so that you can communicate your ideas clearly. Moreover, all the templates are customizable, and easy-to-edit and downloadable. Use these for both personal and commercial use. Following slide highlights dashboard to monitor closed sales deal of company that helps to make decisions on improving performance. It includes pipeline metrics such as won deals, lost deals, days to close, conversion rates, etc.

Global Market Size Of E Waste Management System Implementation Of E Waste Guidelines
This slide exhibits a graphical representation of the global market size of smart waste management systems. It includes key growth drivers such as rapid urbanisation and industrialization, increased smart city initiatives, etc. If your project calls for a presentation, then Slidegeeks is your go-to partner because we have professionally designed, easy-to-edit templates that are perfect for any presentation. After downloading, you can easily edit Global Market Size Of E Waste Management System Implementation Of E Waste Guidelines and make the changes accordingly. You can rearrange slides or fill them with different images. Check out all the handy templates This slide exhibits a graphical representation of the global market size of smart waste management systems. It includes key growth drivers such as rapid urbanisation and industrialization, increased smart city initiatives, etc.
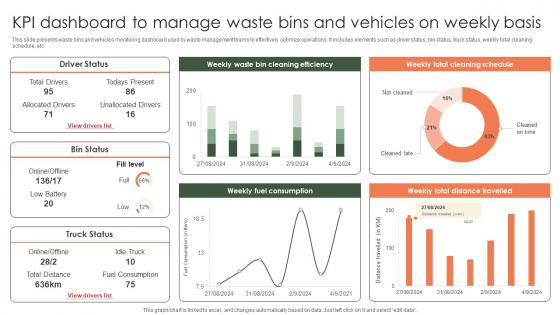
Kpi Dashboard To Manage Waste Bins And Vehicles On Weekly Implementation Of E Waste Guidelines
This slide presents waste bins and vehicles monitoring dashboard used by waste management teams to effectively optimize operations. It includes elements such as driver status, bin status, truck status, weekly total cleaning schedule, etc. Welcome to our selection of the Kpi Dashboard To Manage Waste Bins And Vehicles On Weekly Implementation Of E Waste Guidelines. These are designed to help you showcase your creativity and bring your sphere to life. Planning and Innovation are essential for any business that is just starting out. This collection contains the designs that you need for your everyday presentations. All of our PowerPoints are 100 percent editable, so you can customize them to suit your needs. This multi-purpose template can be used in various situations. Grab these presentation templates today. This slide presents waste bins and vehicles monitoring dashboard used by waste management teams to effectively optimize operations. It includes elements such as driver status, bin status, truck status, weekly total cleaning schedule, etc.
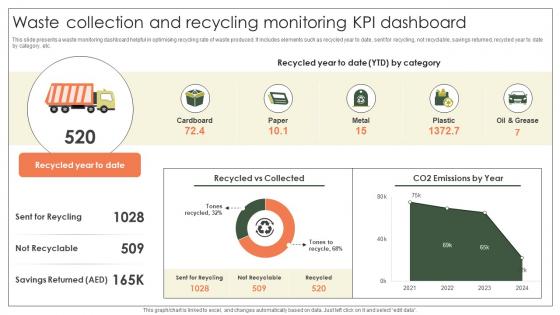
Waste Collection And Recycling Monitoring Kpi Dashboard Implementation Of E Waste Guidelines
This slide presents a waste monitoring dashboard helpful in optimising recycling rate of waste produced. It includes elements such as recycled year to date, sent for recycling, not recyclable, savings returned, recycled year to date by category, etc. From laying roadmaps to briefing everything in detail, our templates are perfect for you. You can set the stage with your presentation slides. All you have to do is download these easy-to-edit and customizable templates. Waste Collection And Recycling Monitoring Kpi Dashboard Implementation Of E Waste Guidelines will help you deliver an outstanding performance that everyone would remember and praise you for. Do download this presentation today. This slide presents a waste monitoring dashboard helpful in optimising recycling rate of waste produced. It includes elements such as recycled year to date, sent for recycling, not recyclable, savings returned, recycled year to date by category, etc.
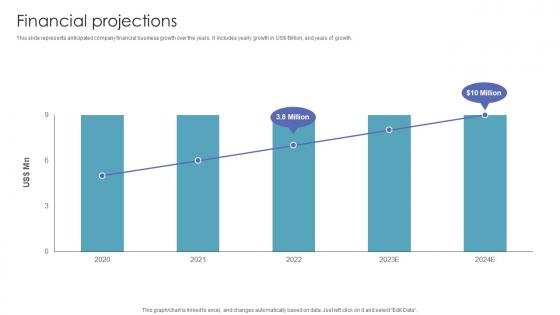
Financial Projections Investor Funding Pitch Deck For Automated Ar Platform
This slide represents anticipated company financial business growth over the years. It includes yearly growth in US dollar Billion, and years of growth.Slidegeeks is here to make your presentations a breeze with Financial Projections Investor Funding Pitch Deck For Automated Ar Platform With our easy-to-use and customizable templates, you can focus on delivering your ideas rather than worrying about formatting. With a variety of designs to choose from, you are sure to find one that suits your needs. And with animations and unique photos, illustrations, and fonts, you can make your presentation pop. So whether you are giving a sales pitch or presenting to the board, make sure to check out Slidegeeks first This slide represents anticipated company financial business growth over the years. It includes yearly growth in US dollar Billion, and years of growth.
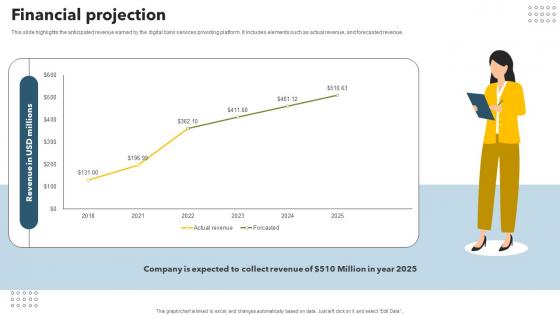
Financial Projection Mobile Banking App Investor Funding Elevator Pitch Deck
This slide highlights the anticipated revenue earned by the digital bank services providing platform. It includes elements such as actual revenue, and forecasted revenue. Slidegeeks is here to make your presentations a breeze with Financial Projection Mobile Banking App Investor Funding Elevator Pitch Deck With our easy to use and customizable templates, you can focus on delivering your ideas rather than worrying about formatting. With a variety of designs to choose from, you are sure to find one that suits your needs. And with animations and unique photos, illustrations, and fonts, you can make your presentation pop. So whether you are giving a sales pitch or presenting to the board, make sure to check out Slidegeeks first This slide highlights the anticipated revenue earned by the digital bank services providing platform. It includes elements such as actual revenue, and forecasted revenue.

Company Profit And Loss Dashboard With Income Statement Strategic Approaches To Corporate Financial
This slide provides a KPI dashboard that enables an organization to track revenue, expenses, and profit incurred in a specific period. It includes gross profit margin, OPEX ratio, operating profit margin, and net profit margin. Want to ace your presentation in front of a live audience Our Company Profit And Loss Dashboard With Income Statement Strategic Approaches To Corporate Financial can help you do that by engaging all the users towards you. Slidegeeks experts have put their efforts and expertise into creating these impeccable powerpoint presentations so that you can communicate your ideas clearly. Moreover, all the templates are customizable, and easy-to-edit and downloadable. Use these for both personal and commercial use. This slide provides a KPI dashboard that enables an organization to track revenue, expenses, and profit incurred in a specific period. It includes gross profit margin, OPEX ratio, operating profit margin, and net profit margin.
Cost Associated With Company Financial Distress Management Strategic Approaches To Corporate Financial
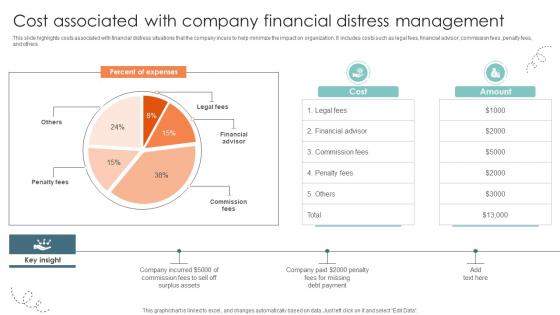
This slide highlights costs associated with financial distress situations that the company incurs to help minimize the impact on organization. It includes costs such as legal fees, financial advisor, commission fees, penalty fees,and others. There are so many reasons you need a Cost Associated With Company Financial Distress Management Strategic Approaches To Corporate Financial. The first reason is you can not spend time making everything from scratch, Thus, Slidegeeks has made presentation templates for you too. You can easily download these templates from our website easily. This slide highlights costs associated with financial distress situations that the company incurs to help minimize the impact on organization. It includes costs such as legal fees, financial advisor, commission fees, penalty fees,and others.
Unlocking Potential IoTs Application Annual Growth Of Smart Home Devices Usage In Us IoT SS V
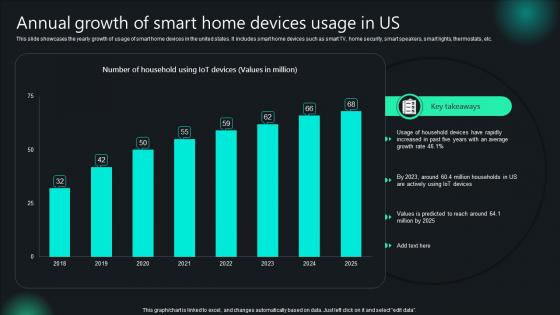
This slide showcases the yearly growth of usage of smart home devices in the united states. It includes smart home devices such as smart TV, home security, smart speakers, smart lights, thermostats, etc. Slidegeeks is here to make your presentations a breeze with Unlocking Potential IoTs Application Annual Growth Of Smart Home Devices Usage In Us IoT SS V With our easy-to-use and customizable templates, you can focus on delivering your ideas rather than worrying about formatting. With a variety of designs to choose from, you are sure to find one that suits your needs. And with animations and unique photos, illustrations, and fonts, you can make your presentation pop. So whether you are giving a sales pitch or presenting to the board, make sure to check out Slidegeeks first This slide showcases the yearly growth of usage of smart home devices in the united states. It includes smart home devices such as smart TV, home security, smart speakers, smart lights, thermostats, etc.
Unlocking Potential IoTs Application Dashboard For Tracking IoT Devices Performance IoT SS V
This slide provides a dashboard for monitoring IoT devices that enhance agricultural practices. It incorporates IoT sensors to measure water tank capacity, Live crop monitoring, temperature and humidity measurements, control sprinklers, etc. Make sure to capture your audiences attention in your business displays with our gratis customizable Unlocking Potential IoTs Application Dashboard For Tracking IoT Devices Performance IoT SS V. These are great for business strategies, office conferences, capital raising or task suggestions. If you desire to acquire more customers for your tech business and ensure they stay satisfied, create your own sales presentation with these plain slides. This slide provides a dashboard for monitoring IoT devices that enhance agricultural practices. It incorporates IoT sensors to measure water tank capacity, Live crop monitoring, temperature and humidity measurements, control sprinklers, etc.
Unlocking Potential IoTs Application Global Annual Spending On IoT Devices IoT SS V
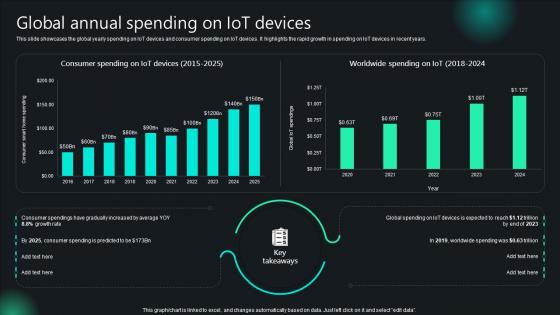
This slide showcases the global yearly spending on IoT devices and consumer spending on IoT devices. It highlights the rapid growth in spending on IoT devices in recent years. Welcome to our selection of the Unlocking Potential IoTs Application Global Annual Spending On IoT Devices IoT SS V. These are designed to help you showcase your creativity and bring your sphere to life. Planning and Innovation are essential for any business that is just starting out. This collection contains the designs that you need for your everyday presentations. All of our PowerPoints are 100Percent editable, so you can customize them to suit your needs. This multi-purpose template can be used in various situations. Grab these presentation templates today. This slide showcases the global yearly spending on IoT devices and consumer spending on IoT devices. It highlights the rapid growth in spending on IoT devices in recent years.
Unlocking Potential IoTs Application Global Market Potential Of Industrial IoT SS V
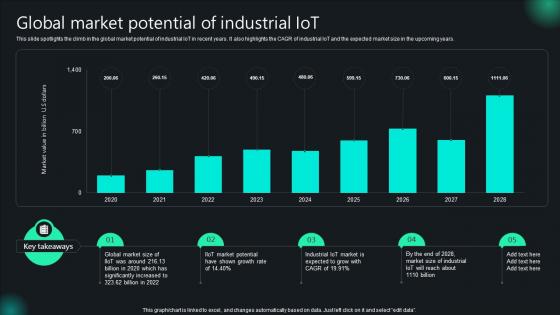
This slide spotlights the climb in the global market potential of industrial IoT in recent years. It also highlights the CAGR of industrial IoT and the expected market size in the upcoming years. The best PPT templates are a great way to save time, energy, and resources. Slidegeeks have 100 percent editable powerpoint slides making them incredibly versatile. With these quality presentation templates, you can create a captivating and memorable presentation by combining visually appealing slides and effectively communicating your message. Download Unlocking Potential IoTs Application Global Market Potential Of Industrial IoT SS V from Slidegeeks and deliver a wonderful presentation. This slide spotlights the climb in the global market potential of industrial IoT in recent years. It also highlights the CAGR of industrial IoT and the expected market size in the upcoming years.
Unlocking Potential IoTs Application Overview Of Internet Of Things In Smart Homes IoT SS V
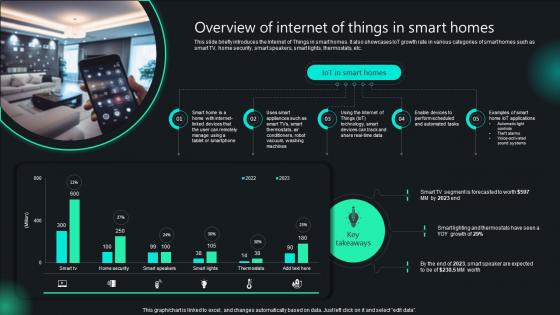
This slide briefly introduces the Internet of Things in smart homes. It also showcases IoT growth rate in various categories of smart homes such as smart TV, home security, smart speakers, smart lights, thermostats, etc. Present like a pro with Unlocking Potential IoTs Application Overview Of Internet Of Things In Smart Homes IoT SS V. Create beautiful presentations together with your team, using our easy-to-use presentation slides. Share your ideas in real-time and make changes on the fly by downloading our templates. So whether you are in the office, on the go, or in a remote location, you can stay in sync with your team and present your ideas with confidence. With Slidegeeks presentation got a whole lot easier. Grab these presentations today. This slide briefly introduces the Internet of Things in smart homes. It also showcases IoT growth rate in various categories of smart homes such as smart TV, home security, smart speakers, smart lights, thermostats, etc.

IoT Solutions For Oil Oil And Gas Production Monitoring KPI Dashboard IoT SS V
This slide exhibits monthly performance of oil and gas production to track wellhead uptime and overall efficiency. It includes various elements such as production efficiency, well uptime, gas production rate, oil production rate, top performing gas producing wells, etc. Take your projects to the next level with our ultimate collection of IoT Solutions For Oil Oil And Gas Production Monitoring KPI Dashboard IoT SS V. Slidegeeks has designed a range of layouts that are perfect for representing task or activity duration, keeping track of all your deadlines at a glance. Tailor these designs to your exact needs and give them a truly corporate look with your own brand colors they will make your projects stand out from the rest This slide exhibits monthly performance of oil and gas production to track wellhead uptime and overall efficiency. It includes various elements such as production efficiency, well uptime, gas production rate, oil production rate, top performing gas producing wells, etc.
IoT Solutions For Oil Statistical Graph Showcasing Reasons For Pipeline IoT SS V
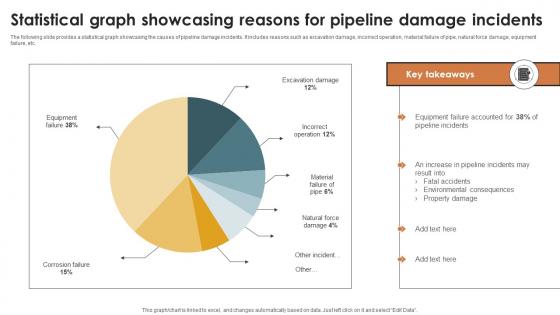
The following slide provides a statistical graph showcasing the causes of pipeline damage incidents. It includes reasons such as excavation damage, incorrect operation, material failure of pipe, natural force damage, equipment failure, etc. Want to ace your presentation in front of a live audience Our IoT Solutions For Oil Statistical Graph Showcasing Reasons For Pipeline IoT SS V can help you do that by engaging all the users towards you. Slidegeeks experts have put their efforts and expertise into creating these impeccable powerpoint presentations so that you can communicate your ideas clearly. Moreover, all the templates are customizable, and easy-to-edit and downloadable. Use these for both personal and commercial use. The following slide provides a statistical graph showcasing the causes of pipeline damage incidents. It includes reasons such as excavation damage, incorrect operation, material failure of pipe, natural force damage, equipment failure, etc.
IoT Solutions For Oil Understanding Current State Of Oil And Gas Industry IoT SS V
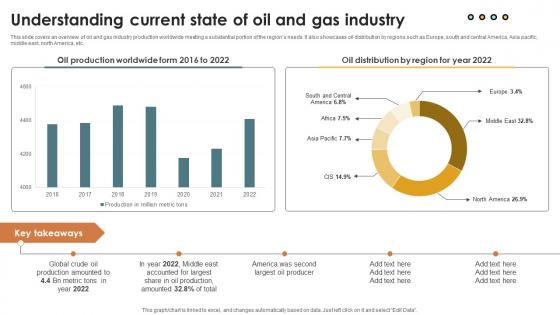
This slide covers an overview of oil and gas industry production worldwide meeting a substantial portion of the regions needs. It also showcases oil distribution by regions such as Europe, south and central America, Asia pacific, middle east, north America, etc. There are so many reasons you need a IoT Solutions For Oil Understanding Current State Of Oil And Gas Industry IoT SS V. The first reason is you can not spend time making everything from scratch, Thus, Slidegeeks has made presentation templates for you too. You can easily download these templates from our website easily. This slide covers an overview of oil and gas industry production worldwide meeting a substantial portion of the regions needs. It also showcases oil distribution by regions such as Europe, south and central America, Asia pacific, middle east, north America, etc.
Financial Performance Medicare Platform Investor Funding Elevator Pitch Deck
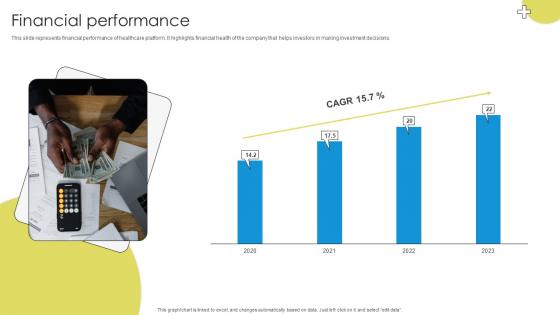
This slide represents financial performance of healthcare platform. It highlights financial health of the company that helps investors in making investment decisions. Present like a pro with Financial Performance Medicare Platform Investor Funding Elevator Pitch Deck. Create beautiful presentations together with your team, using our easy-to-use presentation slides. Share your ideas in real-time and make changes on the fly by downloading our templates. So whether you are in the office, on the go, or in a remote location, you can stay in sync with your team and present your ideas with confidence. With Slidegeeks presentation got a whole lot easier. Grab these presentations today. This slide represents financial performance of healthcare platform. It highlights financial health of the company that helps investors in making investment decisions.
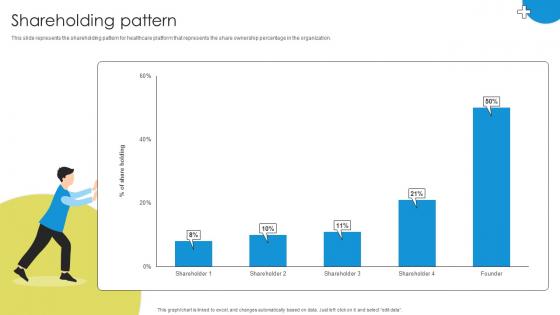
Shareholding Pattern Medicare Platform Investor Funding Elevator Pitch Deck
This slide represents the shareholding pattern for healthcare platform that represents the share ownership percentage in the organization. This Shareholding Pattern Medicare Platform Investor Funding Elevator Pitch Deck is perfect for any presentation, be it in front of clients or colleagues. It is a versatile and stylish solution for organizing your meetings. The Shareholding Pattern Medicare Platform Investor Funding Elevator Pitch Deck features a modern design for your presentation meetings. The adjustable and customizable slides provide unlimited possibilities for acing up your presentation. Slidegeeks has done all the homework before launching the product for you. So, do not wait, grab the presentation templates today This slide represents the shareholding pattern for healthcare platform that represents the share ownership percentage in the organization.
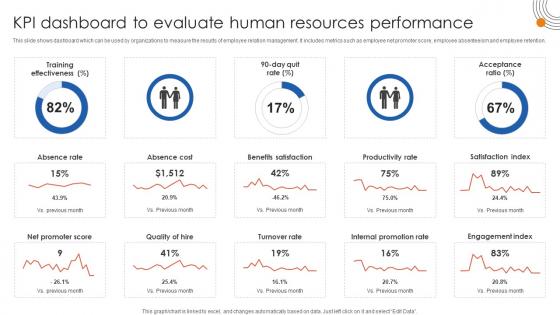
Human Resource Industrial Relationship Kpi Dashboard To Evaluate Human Resources Performance
This slide shows dashboard which can be used by organizations to measure the results of employee relation management. It includes metrics such as employee net promoter score, employee absenteeism and employee retention. Welcome to our selection of the Human Resource Industrial Relationship Kpi Dashboard To Evaluate Human Resources Performance. These are designed to help you showcase your creativity and bring your sphere to life. Planning and Innovation are essential for any business that is just starting out. This collection contains the designs that you need for your everyday presentations. All of our PowerPoints are 100Percent editable, so you can customize them to suit your needs. This multi-purpose template can be used in various situations. Grab these presentation templates today. This slide shows dashboard which can be used by organizations to measure the results of employee relation management. It includes metrics such as employee net promoter score, employee absenteeism and employee retention.
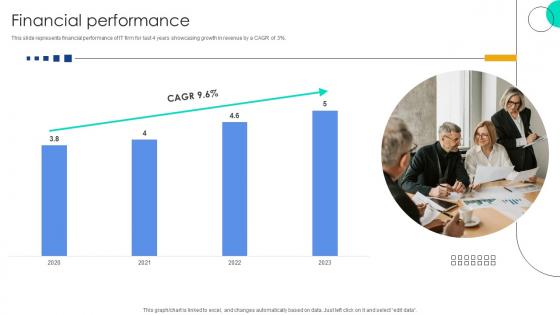
Financial Performance Function User Interface Service Investor Funding Elevator Pitch Deck
This slide represents financial performance of IT firm for last 4 years showcasing growth in revenue by a CAGR of 3 percent. Present like a pro with Financial Performance Function User Interface Service Investor Funding Elevator Pitch Deck. Create beautiful presentations together with your team, using our easy-to-use presentation slides. Share your ideas in real-time and make changes on the fly by downloading our templates. So whether you are in the office, on the go, or in a remote location, you can stay in sync with your team and present your ideas with confidence. With Slidegeeks presentation got a whole lot easier. Grab these presentations today. This slide represents financial performance of IT firm for last 4 years showcasing growth in revenue by a CAGR of 3 percent.
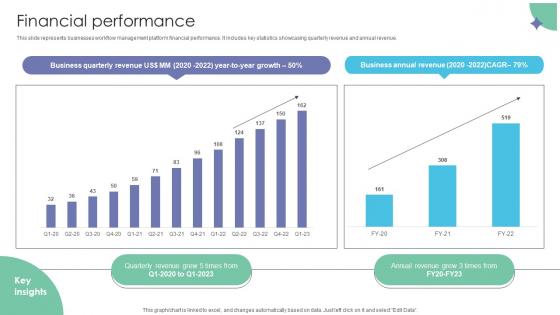
Financial Performance Workflow Management Investor Funding Elevator Pitch Deck
This slide represents businesses workflow management platform financial performance. It includes key statistics showcasing quarterly revenue and annual revenue. Present like a pro with Financial Performance Workflow Management Investor Funding Elevator Pitch Deck. Create beautiful presentations together with your team, using our easy-to-use presentation slides. Share your ideas in real-time and make changes on the fly by downloading our templates. So whether you are in the office, on the go, or in a remote location, you can stay in sync with your team and present your ideas with confidence. With Slidegeeks presentation got a whole lot easier. Grab these presentations today. This slide represents businesses workflow management platform financial performance. It includes key statistics showcasing quarterly revenue and annual revenue.
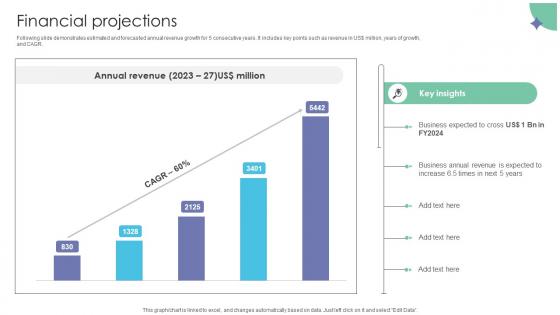
Financial Projections Workflow Management Investor Funding Elevator Pitch Deck
Following slide demonstrates estimated and forecasted annual revenue growth for 5 consecutive years. It includes key points such as revenue in US dollar million, years of growth, and CAGR. Slidegeeks is here to make your presentations a breeze with Financial Projections Workflow Management Investor Funding Elevator Pitch Deck With our easy-to-use and customizable templates, you can focus on delivering your ideas rather than worrying about formatting. With a variety of designs to choose from, you are sure to find one that suits your needs. And with animations and unique photos, illustrations, and fonts, you can make your presentation pop. So whether you are giving a sales pitch or presenting to the board, make sure to check out Slidegeeks first Following slide demonstrates estimated and forecasted annual revenue growth for 5 consecutive years. It includes key points such as revenue in US dollar million, years of growth, and CAGR.

Budget Allocation Retail Digital Transformation Implementation DT SS V
This slide showcases the budget allocation for each stage of digital transformation strategy for retail transformation. It includes a graph highlighting percentage allocation of budget and a table dividing quarterly budget.From laying roadmaps to briefing everything in detail, our templates are perfect for you. You can set the stage with your presentation slides. All you have to do is download these easy-to-edit and customizable templates. Budget Allocation Retail Digital Transformation Implementation DT SS V will help you deliver an outstanding performance that everyone would remember and praise you for. Do download this presentation today. This slide showcases the budget allocation for each stage of digital transformation strategy for retail transformation. It includes a graph highlighting percentage allocation of budget and a table dividing quarterly budget.
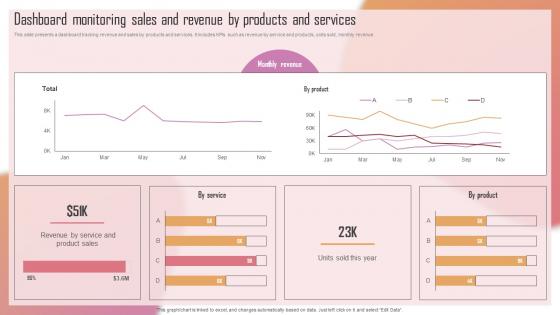
Customizing The Salon Experience Dashboard Monitoring Sales And Revenue By Products Strategy SS V
This slide presents a dashboard tracking revenue and sales by products and services. It includes KPIs such as revenue by service and products, units sold, monthly revenue. If your project calls for a presentation, then Slidegeeks is your go-to partner because we have professionally designed, easy-to-edit templates that are perfect for any presentation. After downloading, you can easily edit Customizing The Salon Experience Dashboard Monitoring Sales And Revenue By Products Strategy SS V and make the changes accordingly. You can rearrange slides or fill them with different images. Check out all the handy templates This slide presents a dashboard tracking revenue and sales by products and services. It includes KPIs such as revenue by service and products, units sold, monthly revenue.
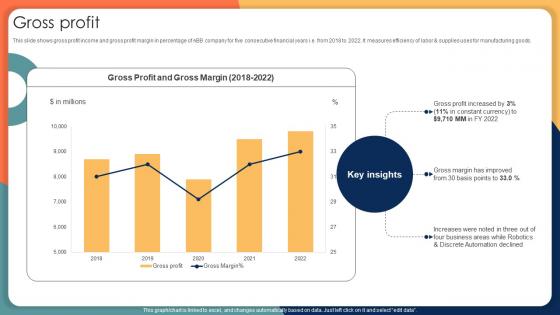
Gross Profit Engineering Solution Provider Company Profile CP SS V
This slide shows gross profit income and gross profit margin in percentage of ABB company for five consecutive financial years i.e. from 2018 to 2022. It measures efficiency of labor and supplies uses for manufacturing goods. Make sure to capture your audiences attention in your business displays with our gratis customizable Gross Profit Engineering Solution Provider Company Profile CP SS V. These are great for business strategies, office conferences, capital raising or task suggestions. If you desire to acquire more customers for your tech business and ensure they stay satisfied, create your own sales presentation with these plain slides. This slide shows gross profit income and gross profit margin in percentage of ABB company for five consecutive financial years i.e. from 2018 to 2022. It measures efficiency of labor and supplies uses for manufacturing goods.
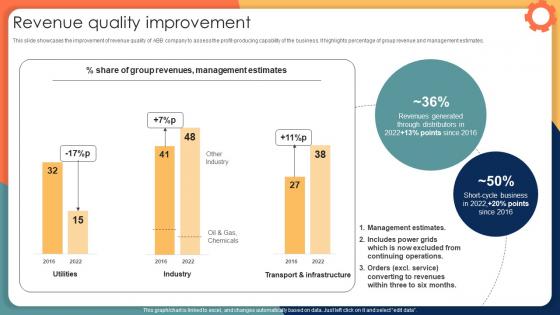
Revenue Quality Improvement Engineering Solution Provider Company Profile CP SS V
This slide showcases the improvement of revenue quality of ABB company to assess the profit-producing capability of the business. It highlights percentage of group revenue and management estimates. Take your projects to the next level with our ultimate collection of Revenue Quality Improvement Engineering Solution Provider Company Profile CP SS V. Slidegeeks has designed a range of layouts that are perfect for representing task or activity duration, keeping track of all your deadlines at a glance. Tailor these designs to your exact needs and give them a truly corporate look with your own brand colors they will make your projects stand out from the rest This slide showcases the improvement of revenue quality of ABB company to assess the profit-producing capability of the business. It highlights percentage of group revenue and management estimates.
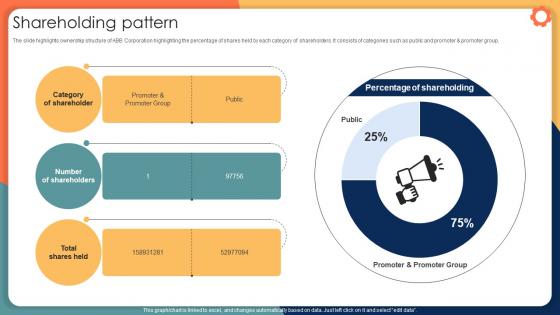
Shareholding Pattern Engineering Solution Provider Company Profile CP SS V
The slide highlights ownership structure of ABB Corporation highlighting the percentage of shares held by each category of shareholders. It consists of categories such as public and promoter and promoter group. Find a pre-designed and impeccable Shareholding Pattern Engineering Solution Provider Company Profile CP SS V. The templates can ace your presentation without additional effort. You can download these easy-to-edit presentation templates to make your presentation stand out from others. So, what are you waiting for Download the template from Slidegeeks today and give a unique touch to your presentation. The slide highlights ownership structure of ABB Corporation highlighting the percentage of shares held by each category of shareholders. It consists of categories such as public and promoter and promoter group.
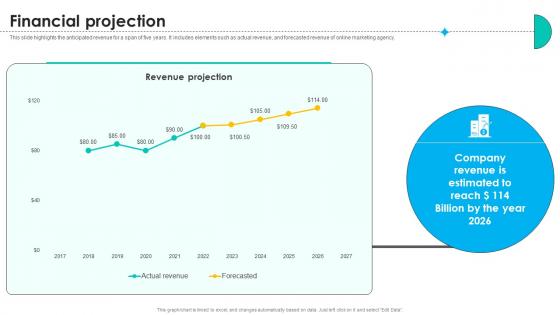
Financial Projection Online Marketing Solutions Pitch Deck
This slide highlights the anticipated revenue for a span of five years. It includes elements such as actual revenue, and forecasted revenue of online marketing agency. Slidegeeks is here to make your presentations a breeze with Financial Projection Online Marketing Solutions Pitch Deck With our easy-to-use and customizable templates, you can focus on delivering your ideas rather than worrying about formatting. With a variety of designs to choose from, you are sure to find one that suits your needs. And with animations and unique photos, illustrations, and fonts, you can make your presentation pop. So whether you are giving a sales pitch or presenting to the board, make sure to check out Slidegeeks first This slide highlights the anticipated revenue for a span of five years. It includes elements such as actual revenue, and forecasted revenue of online marketing agency.
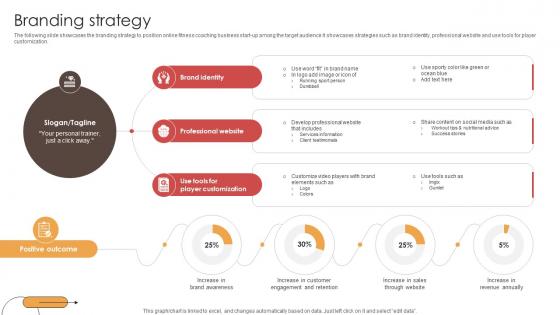
Branding Strategy Digital Physical Training Business Market Entry Plan GTM SS V
The following slide showcases the branding strategy to position online fitness coaching business start-up among the target audience It showcases strategies such as brand identity, professional website and use tools for player customization.Want to ace your presentation in front of a live audience Our Branding Strategy Digital Physical Training Business Market Entry Plan GTM SS V can help you do that by engaging all the users towards you. Slidegeeks experts have put their efforts and expertise into creating these impeccable powerpoint presentations so that you can communicate your ideas clearly. Moreover, all the templates are customizable, and easy-to-edit and downloadable. Use these for both personal and commercial use. The following slide showcases the branding strategy to position online fitness coaching business start-up among the target audience It showcases strategies such as brand identity, professional website and use tools for player customization.
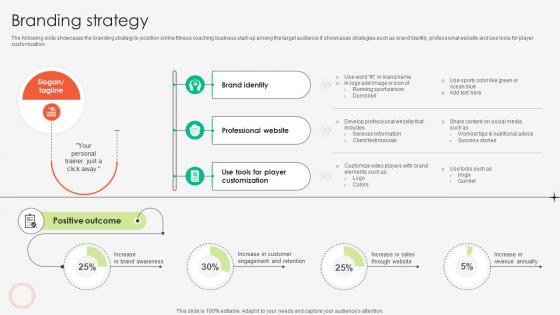
Branding Strategy Online Fitness Tutoring Business Market Entry Plan GTM SS V
The following slide showcases the branding strategy to position online fitness coaching business start-up among the target audience It showcases strategies such as brand identity, professional website and use tools for player customization.There are so many reasons you need a Branding Strategy Online Fitness Tutoring Business Market Entry Plan GTM SS V. The first reason is you can not spend time making everything from scratch, Thus, Slidegeeks has made presentation templates for you too. You can easily download these templates from our website easily. The following slide showcases the branding strategy to position online fitness coaching business start-up among the target audience It showcases strategies such as brand identity, professional website and use tools for player customization.
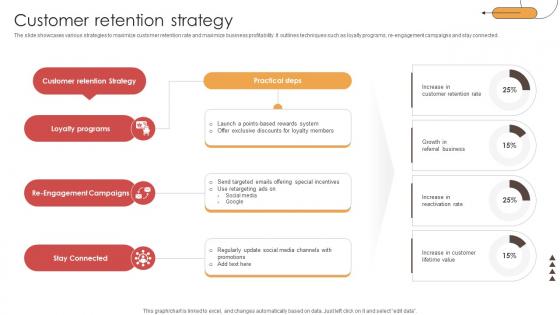
Customer Retention Strategy Digital Physical Training Business Market Entry Plan GTM SS V
This Customer Retention Strategy Digital Physical Training Business Market Entry Plan GTM SS V is perfect for any presentation, be it in front of clients or colleagues. It is a versatile and stylish solution for organizing your meetings. The Customer Retention Strategy Digital Physical Training Business Market Entry Plan GTM SS V features a modern design for your presentation meetings. The adjustable and customizable slides provide unlimited possibilities for acing up your presentation. Slidegeeks has done all the homework before launching the product for you. So, do not wait, grab the presentation templates today Our Customer Retention Strategy Digital Physical Training Business Market Entry Plan GTM SS V are topically designed to provide an attractive backdrop to any subject. Use them to look like a presentation pro.
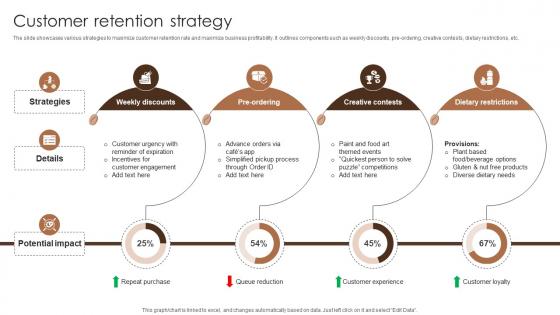
Customer Retention Strategy Coffee Bar Go To Market Strategy GTM SS V
The slide showcases various strategies to maximize customer retention rate and maximize business profitability. It outlines components such as weekly discounts, pre-ordering, creative contests, dietary restrictions, etc.From laying roadmaps to briefing everything in detail, our templates are perfect for you. You can set the stage with your presentation slides. All you have to do is download these easy-to-edit and customizable templates. Customer Retention Strategy Coffee Bar Go To Market Strategy GTM SS V will help you deliver an outstanding performance that everyone would remember and praise you for. Do download this presentation today. The slide showcases various strategies to maximize customer retention rate and maximize business profitability. It outlines components such as weekly discounts, pre-ordering, creative contests, dietary restrictions, etc.
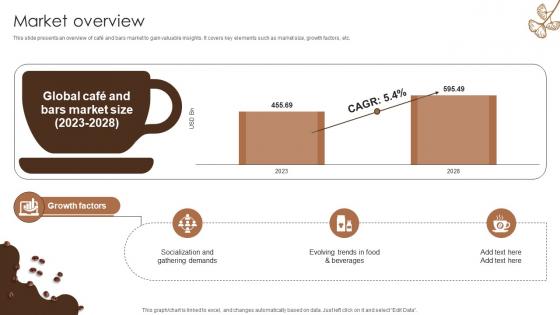
Market Overview Coffee Bar Go To Market Strategy GTM SS V
This slide presents an overview of cafe and bars market to gain valuable insights. It covers key elements such as market size, growth factors, etc.From laying roadmaps to briefing everything in detail, our templates are perfect for you. You can set the stage with your presentation slides. All you have to do is download these easy-to-edit and customizable templates. Market Overview Coffee Bar Go To Market Strategy GTM SS V will help you deliver an outstanding performance that everyone would remember and praise you for. Do download this presentation today. This slide presents an overview of cafe and bars market to gain valuable insights. It covers key elements such as market size, growth factors, etc.
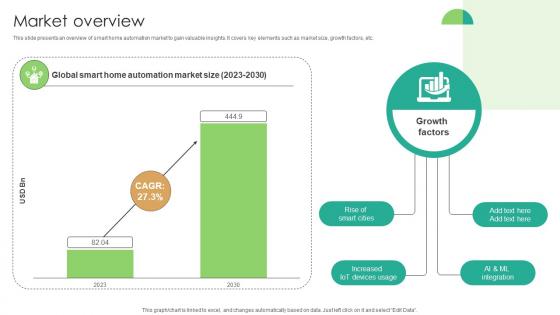
Market Overview Domotics Go To Market Strategy GTM SS V
This slide presents an overview of smart home automation market to gain valuable insights. It covers key elements such as market size, growth factors, etc.Present like a pro with Market Overview Domotics Go To Market Strategy GTM SS V. Create beautiful presentations together with your team, using our easy-to-use presentation slides. Share your ideas in real-time and make changes on the fly by downloading our templates. So whether you are in the office, on the go, or in a remote location, you can stay in sync with your team and present your ideas with confidence. With Slidegeeks presentation got a whole lot easier. Grab these presentations today. This slide presents an overview of smart home automation market to gain valuable insights. It covers key elements such as market size, growth factors, etc.
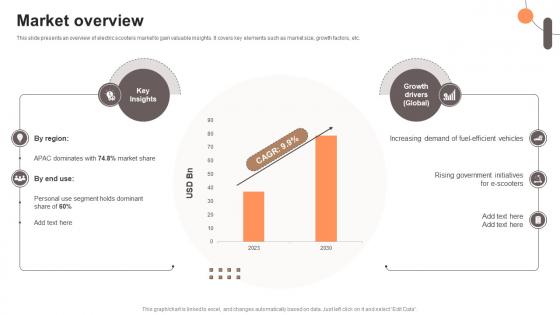
Market Overview Electric Scooter Rental Go To Market Strategy GTM SS V
This slide presents an overview of electric scooters market to gain valuable insights. It covers key elements such as market size, growth factors, etc.Slidegeeks is here to make your presentations a breeze with Market Overview Electric Scooter Rental Go To Market Strategy GTM SS V With our easy-to-use and customizable templates, you can focus on delivering your ideas rather than worrying about formatting. With a variety of designs to choose from, you are sure to find one that suits your needs. And with animations and unique photos, illustrations, and fonts, you can make your presentation pop. So whether you are giving a sales pitch or presenting to the board, make sure to check out Slidegeeks first This slide presents an overview of electric scooters market to gain valuable insights. It covers key elements such as market size, growth factors, etc.
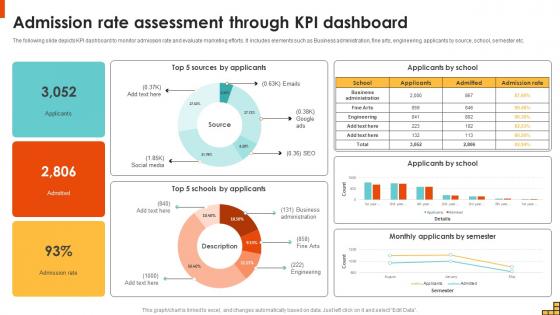
Admission Rate Assessment Through KPI Dashboard Running Marketing Campaigns Strategy SS V
The following slide depicts KPI dashboard to monitor admission rate and evaluate marketing efforts. It includes elements such as Business administration, fine arts, engineering, applicants by source, school, semester etc. Find a pre-designed and impeccable Admission Rate Assessment Through KPI Dashboard Running Marketing Campaigns Strategy SS V. The templates can ace your presentation without additional effort. You can download these easy-to-edit presentation templates to make your presentation stand out from others. So, what are you waiting for Download the template from Slidegeeks today and give a unique touch to your presentation. The following slide depicts KPI dashboard to monitor admission rate and evaluate marketing efforts. It includes elements such as Business administration, fine arts, engineering, applicants by source, school, semester etc.

KPI Dashboard To Analyze Email Campaign Performance Running Marketing Campaigns Strategy SS V
The following slide depicts KPI dashboard to review email campaign performance conducted by university. It includes elements such as open rate, click rate, emails sent, revenue by campaign, clicks, unique unsubscribes, etc. The best PPT templates are a great way to save time, energy, and resources. Slidegeeks have 100 percent editable powerpoint slides making them incredibly versatile. With these quality presentation templates, you can create a captivating and memorable presentation by combining visually appealing slides and effectively communicating your message. Download KPI Dashboard To Analyze Email Campaign Performance Running Marketing Campaigns Strategy SS V from Slidegeeks and deliver a wonderful presentation. The following slide depicts KPI dashboard to review email campaign performance conducted by university. It includes elements such as open rate, click rate, emails sent, revenue by campaign, clicks, unique unsubscribes, etc.

Remote Sales Plan For Comparing Social Media Platforms For Generating Leads Strategy SS V
This slide showcases comparative assessment of various social media platforms that can help organization to generate leads, Various platforms are LinkedIn, Twitter, Facebook, YouTube, Instagram, Pinterest, Snapchat etc. Get a simple yet stunning designed Remote Sales Plan For Comparing Social Media Platforms For Generating Leads Strategy SS V. It is the best one to establish the tone in your meetings. It is an excellent way to make your presentations highly effective. So, download this PPT today from Slidegeeks and see the positive impacts. Our easy-to-edit Remote Sales Plan For Comparing Social Media Platforms For Generating Leads Strategy SS V can be your go-to option for all upcoming conferences and meetings. So, what are you waiting for Grab this template today. This slide showcases comparative assessment of various social media platforms that can help organization to generate leads, Various platforms are LinkedIn, Twitter, Facebook, YouTube, Instagram, Pinterest, Snapchat etc.
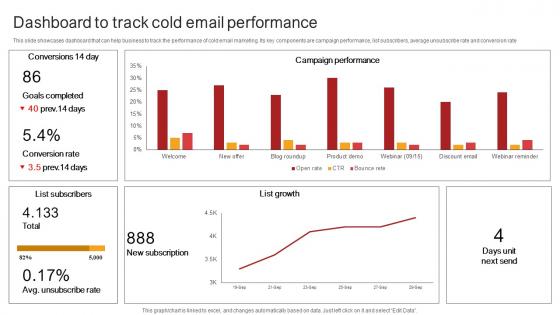
Remote Sales Plan For Dashboard To Track Cold Email Performance Strategy SS V
This slide showcases dashboard that can help business to track the performance of cold email marketing. Its key components are campaign performance, list subscribers, average unsubscribe rate and conversion rate. Slidegeeks is here to make your presentations a breeze with Remote Sales Plan For Dashboard To Track Cold Email Performance Strategy SS V With our easy-to-use and customizable templates, you can focus on delivering your ideas rather than worrying about formatting. With a variety of designs to choose from, you are sure to find one that suits your needs. And with animations and unique photos, illustrations, and fonts, you can make your presentation pop. So whether you are giving a sales pitch or presenting to the board, make sure to check out Slidegeeks first This slide showcases dashboard that can help business to track the performance of cold email marketing. Its key components are campaign performance, list subscribers, average unsubscribe rate and conversion rate.
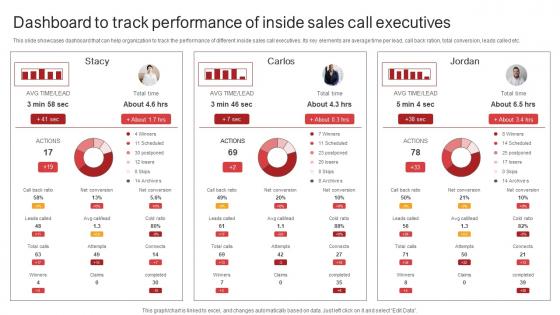
Remote Sales Plan For Lead Dashboard To Track Performance Of Inside Sales Strategy SS V
This slide showcases dashboard that can help organization to track the performance of different inside sales call executives. Its key elements are average time per lead, call back ration, total conversion, leads called etc. The best PPT templates are a great way to save time, energy, and resources. Slidegeeks have 100 percent editable powerpoint slides making them incredibly versatile. With these quality presentation templates, you can create a captivating and memorable presentation by combining visually appealing slides and effectively communicating your message. Download Remote Sales Plan For Lead Dashboard To Track Performance Of Inside Sales Strategy SS V from Slidegeeks and deliver a wonderful presentation. This slide showcases dashboard that can help organization to track the performance of different inside sales call executives. Its key elements are average time per lead, call back ration, total conversion, leads called etc.

Marketing Growth Strategy KPI Dashboard To Evaluate Sales Performance Strategy SS V
The following slide outlines key performance indicator KPI dashboard to monitor sales performance of company. The key metrics covered in slide are total sales by location, monthly sales trend, average revenue AR by clients, etc. This Marketing Growth Strategy KPI Dashboard To Evaluate Sales Performance Strategy SS V is perfect for any presentation, be it in front of clients or colleagues. It is a versatile and stylish solution for organizing your meetings. The Marketing Growth Strategy KPI Dashboard To Evaluate Sales Performance Strategy SS V features a modern design for your presentation meetings. The adjustable and customizable slides provide unlimited possibilities for acing up your presentation. Slidegeeks has done all the homework before launching the product for you. So, do not wait, grab the presentation templates today The following slide outlines key performance indicator KPI dashboard to monitor sales performance of company. The key metrics covered in slide are total sales by location, monthly sales trend, average revenue AR by clients, etc.
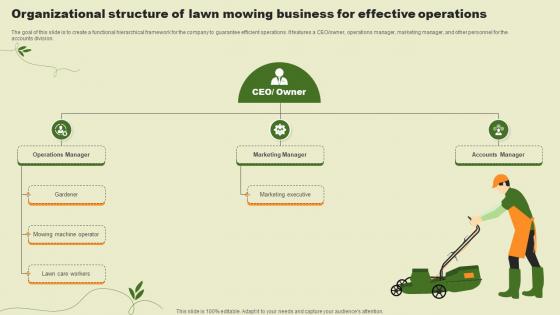
Lawn Care Services Business Plan Organizational Structure Of Lawn Mowing Business BP SS V
The goal of this slide is to create a functional hierarchical framework for the company to guarantee efficient operations. It features a CEO or owner, operations manager, marketing manager, and other personnel for the accounts division. The best PPT templates are a great way to save time, energy, and resources. Slidegeeks have 100 percent editable powerpoint slides making them incredibly versatile. With these quality presentation templates, you can create a captivating and memorable presentation by combining visually appealing slides and effectively communicating your message. Download Lawn Care Services Business Plan Organizational Structure Of Lawn Mowing Business BP SS V from Slidegeeks and deliver a wonderful presentation. The goal of this slide is to create a functional hierarchical framework for the company to guarantee efficient operations. It features a CEO or owner, operations manager, marketing manager, and other personnel for the accounts division.
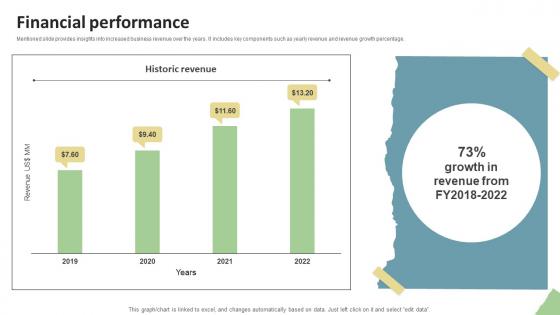
Financial Performance Education Platform Investor Funding Elevator Pitch Deck
Mentioned slide provides insights into increased business revenue over the years. It includes key components such as yearly revenue and revenue growth percentage. Present like a pro with Financial Performance Education Platform Investor Funding Elevator Pitch Deck. Create beautiful presentations together with your team, using our easy-to-use presentation slides. Share your ideas in real-time and make changes on the fly by downloading our templates. So whether you are in the office, on the go, or in a remote location, you can stay in sync with your team and present your ideas with confidence. With Slidegeeks presentation got a whole lot easier. Grab these presentations today. Mentioned slide provides insights into increased business revenue over the years. It includes key components such as yearly revenue and revenue growth percentage.
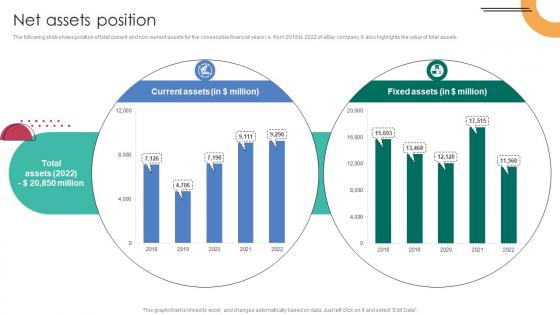
Net Assets Position C2C Ecommerce Platform Company Profile CP SS V
The following slide shows position of total current and non-current assets for five consecutive financial years i.e. from 2018 to 2022 of eBay company. It also highlights the value of total assets. Welcome to our selection of the Net Assets Position C2C Ecommerce Platform Company Profile CP SS V. These are designed to help you showcase your creativity and bring your sphere to life. Planning and Innovation are essential for any business that is just starting out. This collection contains the designs that you need for your everyday presentations. All of our PowerPoints are 100 percent editable, so you can customize them to suit your needs. This multi-purpose template can be used in various situations. Grab these presentation templates today. The following slide shows position of total current and non-current assets for five consecutive financial years i.e. from 2018 to 2022 of eBay company. It also highlights the value of total assets.
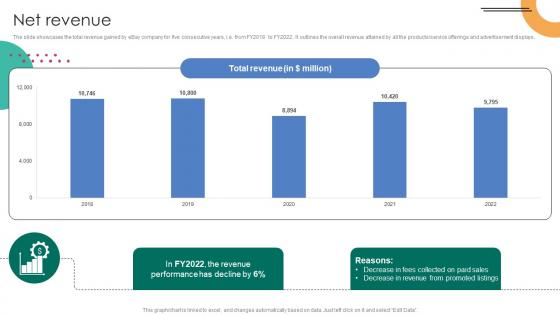
Net Revenue C2C Ecommerce Platform Company Profile CP SS V
The slide showcases the total revenue gained by eBay company for five consecutive years, i.e. from FY2018 to FY2022. It outlines the overall revenue attained by all the products or service offerings and advertisement displays.The best PPT templates are a great way to save time, energy, and resources. Slidegeeks have 100 percent editable powerpoint slides making them incredibly versatile. With these quality presentation templates, you can create a captivating and memorable presentation by combining visually appealing slides and effectively communicating your message. Download Net Revenue C2C Ecommerce Platform Company Profile CP SS V from Slidegeeks and deliver a wonderful presentation. The slide showcases the total revenue gained by eBay company for five consecutive years, i.e. from FY2018 to FY2022. It outlines the overall revenue attained by all the products or service offerings and advertisement displays.
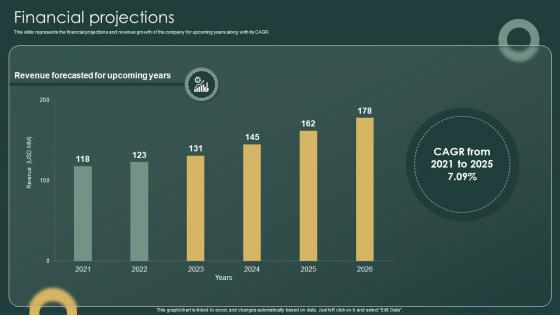
Financial Projections Investor Funding Elevator Pitch Deck For Ticketing Management Firm
This slide represents the financial projections and revenue growth of the company for upcoming years along with its CAGR. Slidegeeks is here to make your presentations a breeze with Financial Projections Investor Funding Elevator Pitch Deck For Ticketing Management Firm With our easy-to-use and customizable templates, you can focus on delivering your ideas rather than worrying about formatting. With a variety of designs to choose from, you are sure to find one that suits your needs. And with animations and unique photos, illustrations, and fonts, you can make your presentation pop. So whether you are giving a sales pitch or presenting to the board, make sure to check out Slidegeeks first This slide represents the financial projections and revenue growth of the company for upcoming years along with its CAGR.
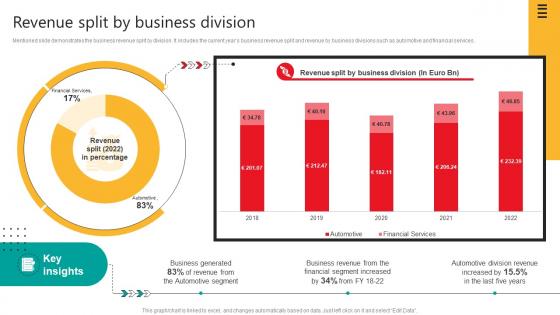
Revenue Split By Business Division Automobile Development Company Profile CP SS V
Mentioned slide demonstrates the business revenue split by division. It includes the current years business revenue split and revenue by business divisions such as automotive and financial services.Take your projects to the next level with our ultimate collection of Revenue Split By Business Division Automobile Development Company Profile CP SS V. Slidegeeks has designed a range of layouts that are perfect for representing task or activity duration, keeping track of all your deadlines at a glance. Tailor these designs to your exact needs and give them a truly corporate look with your own brand colors they will make your projects stand out from the rest Mentioned slide demonstrates the business revenue split by division. It includes the current years business revenue split and revenue by business divisions such as automotive and financial services.
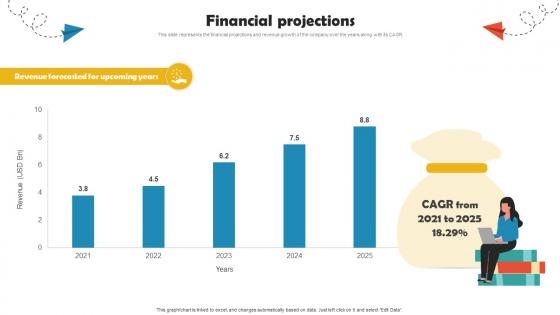
Financial Projections Online Travel Agency Investor Funding Elevator Pitch Deck
This slide represents the financial projections and revenue growth of the company over the years along with its CAGR. Slidegeeks is here to make your presentations a breeze with Financial Projections Online Travel Agency Investor Funding Elevator Pitch Deck With our easy-to-use and customizable templates, you can focus on delivering your ideas rather than worrying about formatting. With a variety of designs to choose from, you are sure to find one that suits your needs. And with animations and unique photos, illustrations, and fonts, you can make your presentation pop. So whether you are giving a sales pitch or presenting to the board, make sure to check out Slidegeeks first This slide represents the financial projections and revenue growth of the company over the years along with its CAGR.
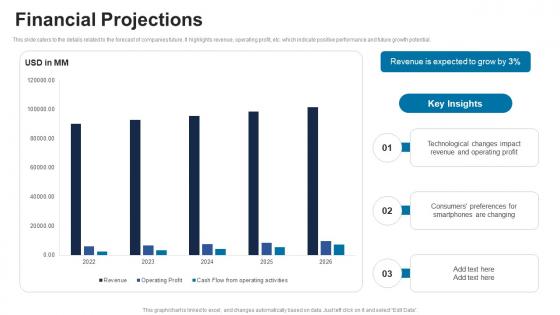
Financial Projections ICT Solutions Provider Investor Funding Elevator Pitch Deck
This slide caters to the details related to the forecast of companies future. It highlights revenue, operating profit, etc. which indicate positive performance and future growth potential. Slidegeeks is here to make your presentations a breeze with Financial Projections ICT Solutions Provider Investor Funding Elevator Pitch Deck With our easy-to-use and customizable templates, you can focus on delivering your ideas rather than worrying about formatting. With a variety of designs to choose from, you are sure to find one that suits your needs. And with animations and unique photos, illustrations, and fonts, you can make your presentation pop. So whether you are giving a sales pitch or presenting to the board, make sure to check out Slidegeeks first This slide caters to the details related to the forecast of companies future. It highlights revenue, operating profit, etc. which indicate positive performance and future growth potential.
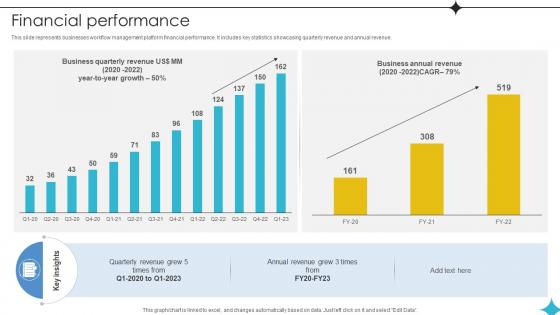
Financial Performance Investor Funding Elevator Pitch Deck For Business Operations Management Platform
This slide represents businesses workflow management platform financial performance. It includes key statistics showcasing quarterly revenue and annual revenue. Present like a pro with Financial Performance Investor Funding Elevator Pitch Deck For Business Operations Management Platform. Create beautiful presentations together with your team, using our easy-to-use presentation slides. Share your ideas in real-time and make changes on the fly by downloading our templates. So whether you are in the office, on the go, or in a remote location, you can stay in sync with your team and present your ideas with confidence. With Slidegeeks presentation got a whole lot easier. Grab these presentations today. This slide represents businesses workflow management platform financial performance. It includes key statistics showcasing quarterly revenue and annual revenue.
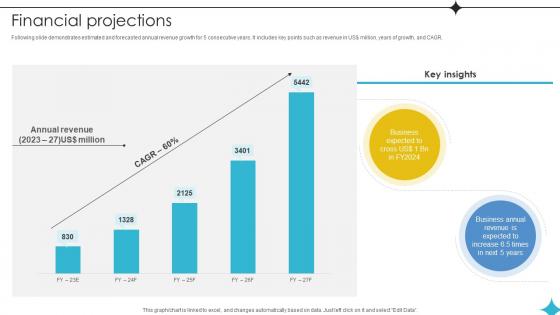
Financial Projections Investor Funding Elevator Pitch Deck For Business Operations Management Platform
Following slide demonstrates estimated and forecasted annual revenue growth for 5 consecutive years. It includes key points such as revenue in US dollor million, years of growth, and CAGR. Slidegeeks is here to make your presentations a breeze with Financial Projections Investor Funding Elevator Pitch Deck For Business Operations Management Platform With our easy-to-use and customizable templates, you can focus on delivering your ideas rather than worrying about formatting. With a variety of designs to choose from, you are sure to find one that suits your needs. And with animations and unique photos, illustrations, and fonts, you can make your presentation pop. So whether you are giving a sales pitch or presenting to the board, make sure to check out Slidegeeks first Following slide demonstrates estimated and forecasted annual revenue growth for 5 consecutive years. It includes key points such as revenue in US dollor million, years of growth, and CAGR.
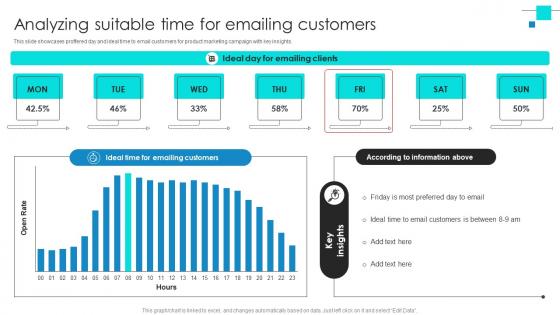
Project Benchmarking Process Analyzing Suitable Time For Emailing Customers CRP DK SS V
This slide showcases proffered day and ideal time to email customers for product marketing campaign with key insights. Get a simple yet stunning designed Project Benchmarking Process Analyzing Suitable Time For Emailing Customers CRP DK SS V. It is the best one to establish the tone in your meetings. It is an excellent way to make your presentations highly effective. So, download this PPT today from Slidegeeks and see the positive impacts. Our easy-to-edit Project Benchmarking Process Analyzing Suitable Time For Emailing Customers CRP DK SS V can be your go-to option for all upcoming conferences and meetings. So, what are you waiting for Grab this template today. This slide showcases proffered day and ideal time to email customers for product marketing campaign with key insights.
Project Management Dashboard For Tracking Performance Closing A Project By Fulfilling PM SS V
This slide showcases dashboard for tracing project performance. This template focuses on changing the status of each task and graphs automatically tracking overall status. It covers aspects related to task priority, budget, etc. Find a pre-designed and impeccable Project Management Dashboard For Tracking Performance Closing A Project By Fulfilling PM SS V. The templates can ace your presentation without additional effort. You can download these easy-to-edit presentation templates to make your presentation stand out from others. So, what are you waiting for Download the template from Slidegeeks today and give a unique touch to your presentation. This slide showcases dashboard for tracing project performance. This template focuses on changing the status of each task and graphs automatically tracking overall status. It covers aspects related to task priority, budget, etc.

 Home
Home