Information Technology Icons
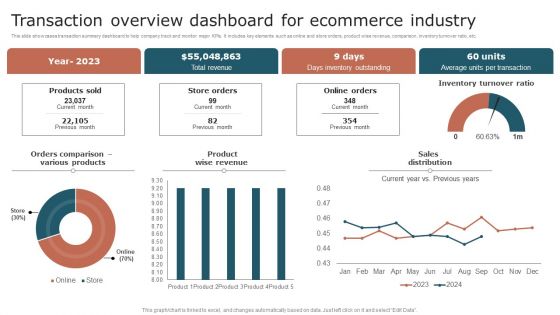
Transaction Overview Dashboard For Ecommerce Industry Summary PDF
This slide showcases transaction summary dashboard to help company track and monitor major KPIs. It includes key elements such as online and store orders, product wise revenue, comparison, inventory turnover ratio, etc. Pitch your topic with ease and precision using this Transaction Overview Dashboard For Ecommerce Industry Summary PDF. This layout presents information on Revenue, Inventory Outstanding, Transaction. It is also available for immediate download and adjustment. So, changes can be made in the color, design, graphics or any other component to create a unique layout.
Tracking School Communication Strategy Performance Rules PDF
The following slide highlights tracking performance of school communication plan. It includes parameters such as parents satisfaction with guidance and resources provided by schools, parents want teachers to reduce frequency of contacting them, parents want teachers to communicate more often etc. Pitch your topic with ease and precision using this Tracking School Communication Strategy Performance Rules PDF. This layout presents information on Strongly Agree, Agree, Improved Methods. It is also available for immediate download and adjustment. So, changes can be made in the color, design, graphics or any other component to create a unique layout.
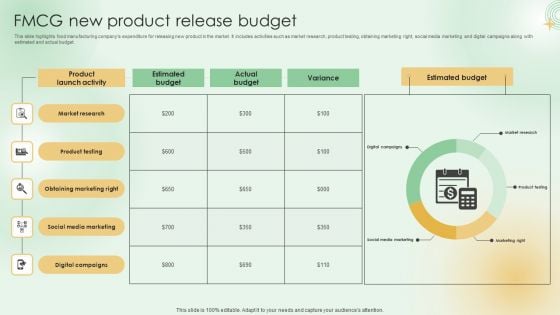
FMCG New Product Release Budget Formats PDF
This slide highlights food manufacturing companys expenditure for releasing new product in the market. It includes activities such as market research, product testing, obtaining marketing right, social media marketing and digital campaigns along with estimated and actual budget. Pitch your topic with ease and precision using this FMCG New Product Release Budget Formats PDF. This layout presents information on Market Research, Product Testing, Obtaining Marketing Right. It is also available for immediate download and adjustment. So, changes can be made in the color, design, graphics or any other component to create a unique layout.
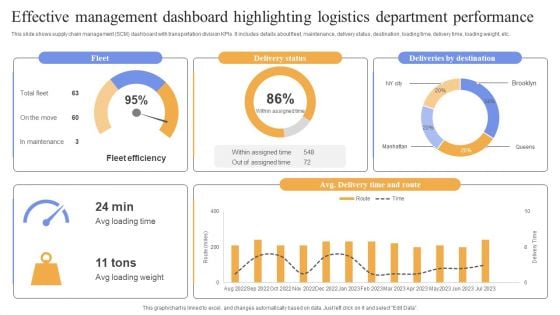
Effective Management Dashboard Highlighting Logistics Department Performance Topics PDF
This slide shows supply chain management SCM dashboard with transportation division KPIs. It includes details about fleet, maintenance, delivery status, destination, loading time, delivery time, loading weight, etc. Pitch your topic with ease and precision using this Effective Management Dashboard Highlighting Logistics Department Performance Topics PDF. This layout presents information on Fleet, Delivery Status, Deliveries Destination. It is also available for immediate download and adjustment. So, changes can be made in the color, design, graphics or any other component to create a unique layout.
Production Department Open And Closed Error Tracking Report Sample PDF
This slide showcases the tracking report for opened and closed issues concerning the manufacturing department. It also includes the priority level, open date, close date, current status, closed by, etc. Pitch your topic with ease and precision using this Production Department Open And Closed Error Tracking Report Sample PDF. This layout presents information on Open Issue Tracker, Issues Closed, Error Tracking Report. It is also available for immediate download and adjustment. So, changes can be made in the color, design, graphics or any other component to create a unique layout.
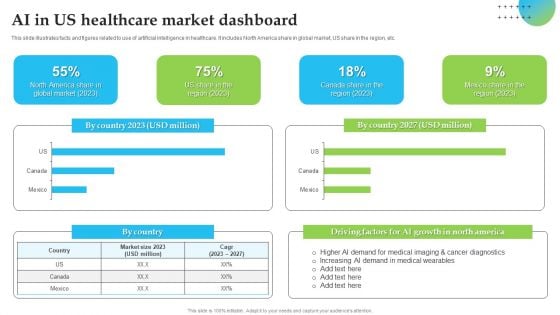
AI In US Healthcare Market Dashboard Brochure PDF
This slide illustrates facts and figures related to use of artificial intelligence in healthcare. It includes North America share in global market, US share in the region, etc. Pitch your topic with ease and precision using this AI In US Healthcare Market Dashboard Brochure PDF. This layout presents information on Driving Factors, AI Growth, Market Dashboard. It is also available for immediate download and adjustment. So, changes can be made in the color, design, graphics or any other component to create a unique layout.
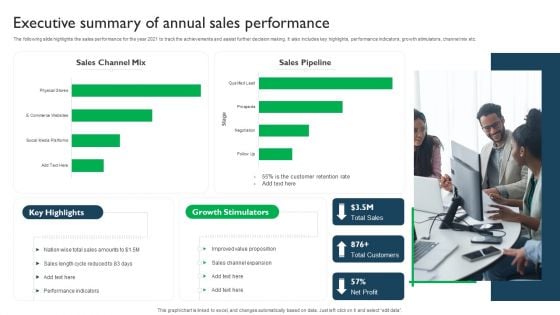
Executive Summary Of Annual Sales Performance Topics PDF
The following slide highlights the sales performance for the year 2021 to track the achievements and assist further decision making. It also includes key highlights, performance indicators, growth stimulators, channel mix etc. Pitch your topic with ease and precision using this Executive Summary Of Annual Sales Performance Topics PDF. This layout presents information on Growth Stimulators, Sales, Value Proposition. It is also available for immediate download and adjustment. So, changes can be made in the color, design, graphics or any other component to create a unique layout.
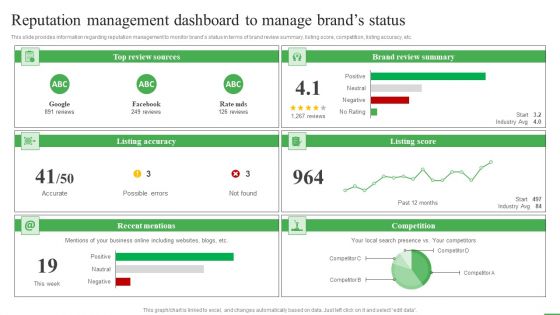
How To Boost Brand Recognition Reputation Management Dashboard To Manage Brands Rules PDF
This slide provides information regarding reputation management to monitor brands status in terms of brand review summary, listing score, competition, listing accuracy, etc. Get a simple yet stunning designed How To Boost Brand Recognition Reputation Management Dashboard To Manage Brands Rules PDF. It is the best one to establish the tone in your meetings. It is an excellent way to make your presentations highly effective. So, download this PPT today from Slidegeeks and see the positive impacts. Our easy-to-edit How To Boost Brand Recognition Reputation Management Dashboard To Manage Brands Rules PDF can be your go-to option for all upcoming conferences and meetings. So, what are you waiting for Grab this template today.
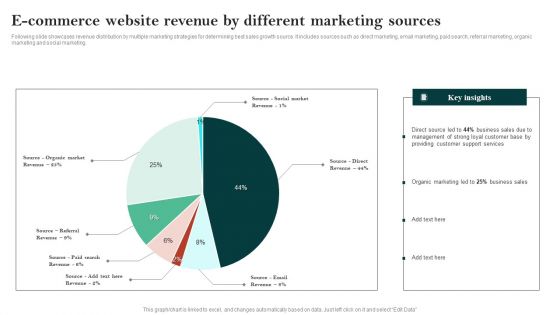
E Commerce Website Revenue By Different Marketing Sources Ppt Ideas PDF
Following slide showcases revenue distribution by multiple marketing strategies for determining best sales growth source. It includes sources such as direct marketing, email marketing, paid search, referral marketing, organic marketing and social marketing. Pitch your topic with ease and precision using this E Commerce Website Pre Launch Checklist Ppt Summary Backgrounds PDF. This layout presents information on Direct Source Led, Business Sales, Customer Base. It is also available for immediate download and adjustment. So, changes can be made in the color, design, graphics or any other component to create a unique layout.
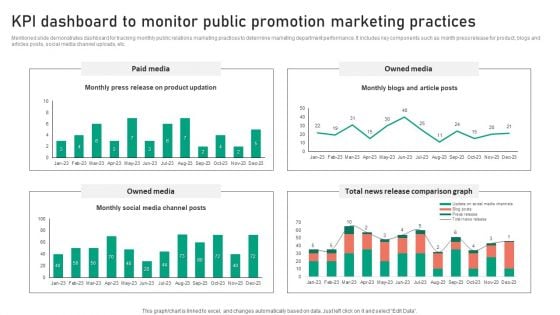
KPI Dashboard To Monitor Public Promotion Marketing Practices Template PDF
Mentioned slide demonstrates dashboard for tracking monthly public relations marketing practices to determine marketing department performance. It includes key components such as month press release for product, blogs and articles posts, social media channel uploads, etc. Pitch your topic with ease and precision using this KPI Dashboard To Monitor Public Promotion Marketing Practices Template PDF. This layout presents information on Paid Media, Owned Media, Total News Release, Comparison Graph. It is also available for immediate download and adjustment. So, changes can be made in the color, design, graphics or any other component to create a unique layout.

KPI Dashboard Of Managing Innovative Business Project Ppt Pictures Show PDF
This slide shows the KPI dashboard of innovation project management. It covers the following KPIs such as innovation success rate, value in project, total revenue, active projects, etc. Pitch your topic with ease and precision using this KPI Dashboard Of Managing Innovative Business Project Ppt Pictures Show PDF. This layout presents information on Innovation Success Rate, Total Active Projects, Amount Mission. It is also available for immediate download and adjustment. So, changes can be made in the color, design, graphics or any other component to create a unique layout.
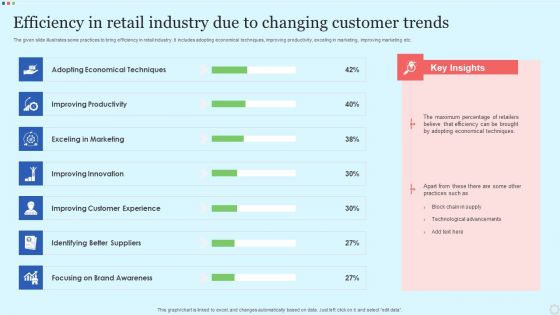
Efficiency In Retail Industry Due To Changing Customer Trends Microsoft PDF
The given slide illustrates some practices to bring efficiency in retail industry. It includes adopting economical techniques, improving productivity, exceling in marketing, improving marketing etc. Pitch your topic with ease and precision using this Efficiency In Retail Industry Due To Changing Customer Trends Microsoft PDF. This layout presents information on Adopting Techniques, Improving Productivity, Exceling Marketing. It is also available for immediate download and adjustment. So, changes can be made in the color, design, graphics or any other component to create a unique layout.
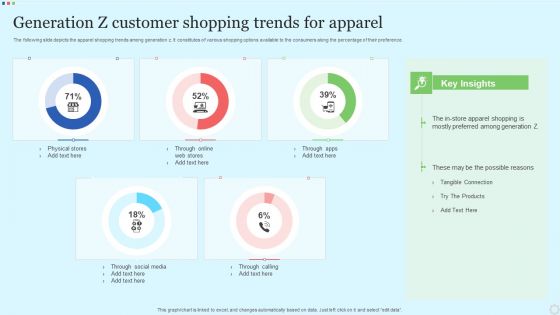
Generation Z Customer Shopping Trends For Apparel Designs PDF
The following slide depicts the apparel shopping trends among generation z. It constitutes of various shopping options available to the consumers along the percentage of their preference. Pitch your topic with ease and precision using this Generation Z Customer Shopping Trends For Apparel Designs PDF. This layout presents information on Physical Stores, Through Social Media, Through Calling. It is also available for immediate download and adjustment. So, changes can be made in the color, design, graphics or any other component to create a unique layout.
Lead Tracking Dashboard With Metric Comparison Brochure PDF
This slide showcases dashboard of lead pipeline that can help to identify total number of leads generated and expenses incurred to acquire the audience. It also showcases other key performance metrics like lead breakdown by status and number of leads per month. Pitch your topic with ease and precision using this Lead Tracking Dashboard With Metric Comparison Brochure PDF. This layout presents information on Metric Comparison, Lead Pipeline, Lead Breakdown Status. It is also available for immediate download and adjustment. So, changes can be made in the color, design, graphics or any other component to create a unique layout.
Leads Tracking Dashboard With Conversion Funnel Ideas PDF
This slide showcases dashboard that can help organization to identify the total number of customers acquired from the sales and marketing qualified lead. It also showcases financial KPIs that are cost per lead, cost per customer, customer lifetine value and return on marketing investment. Pitch your topic with ease and precision using this Leads Tracking Dashboard With Conversion Funnel Ideas PDF. This layout presents information on Audience, Prospects, Conversion Funnel. It is also available for immediate download and adjustment. So, changes can be made in the color, design, graphics or any other component to create a unique layout.
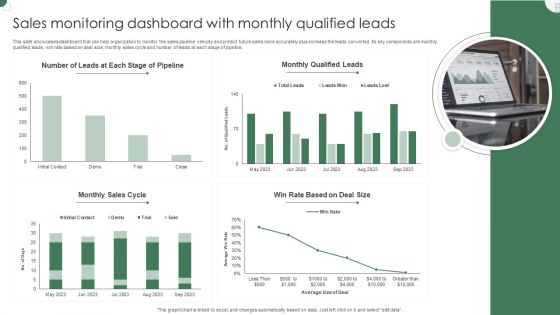
Sales Monitoring Dashboard With Monthly Qualified Leads Guidelines PDF
This slide showcases dashboard that can help organization to monitor the sales pipeline velocity and predict future sales more accurately plus increase the leads converted. Its key components are monthly qualified leads, win rate based on deal size, monthly sales cycle and number of leads at each stage of pipeline. Pitch your topic with ease and precision using this Sales Monitoring Dashboard With Monthly Qualified Leads Guidelines PDF. This layout presents information on Monthly Qualified, Monthly Sales Cycle, Deal Size. It is also available for immediate download and adjustment. So, changes can be made in the color, design, graphics or any other component to create a unique layout.
Website Leads Tracking Dashboard With Traffic Sources Infographics PDF
This slide showcases dashboard for lead generation that can help organziation to identify the traffic sources plus visitors and make changes in SEO of website. It also showcases key metrics that are bounce rate by week, visitors by user type, top channels by conversion, top campaign by conversion and top pages by conversion. Pitch your topic with ease and precision using this Website Leads Tracking Dashboard With Traffic Sources Infographics PDF. This layout presents information on Visitors User Type, Traffic Sources, Bounce Rate Week. It is also available for immediate download and adjustment. So, changes can be made in the color, design, graphics or any other component to create a unique layout.
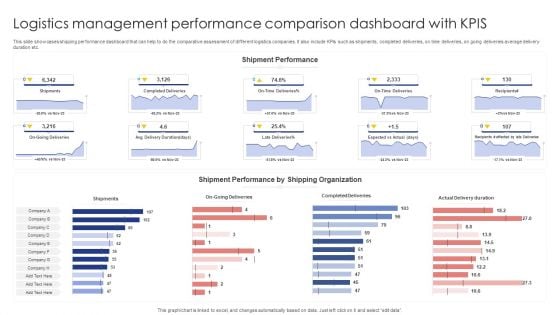
Logistics Management Performance Comparison Dashboard With Kpis Sample PDF
This slide showcases shipping performance dashboard that can help to do the comparative assessment of different logistics companies. It also include KPIs such as shipments, completed deliveries, on time deliveries, on going deliveries average delivery duration etc. Pitch your topic with ease and precision using this Logistics Management Performance Comparison Dashboard With Kpis Sample PDF. This layout presents information on Shipments, Completed Deliveries, Actual Delivery Duration. It is also available for immediate download and adjustment. So, changes can be made in the color, design, graphics or any other component to create a unique layout.
Logistics Management Time Tracking Dashboard With Warehousing Costs Template PDF
This slide showcases shipping dashboard that can help company to deliver the products in stipulated time and keep warehousing operating expenses within pre decided budget. Its also displays perfect order rate and total shipments by country. Pitch your topic with ease and precision using this Logistics Management Time Tracking Dashboard With Warehousing Costs Template PDF. This layout presents information on Warehouse Operating Costs, Perfect Order Rate, On Time Shipments. It is also available for immediate download and adjustment. So, changes can be made in the color, design, graphics or any other component to create a unique layout.
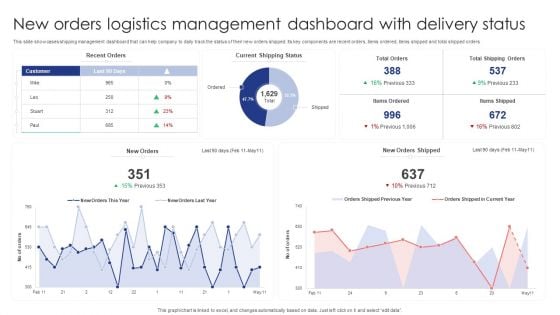
New Orders Logistics Management Dashboard With Delivery Status Designs PDF
This slide showcases shipping management dashboard that can help company to daily track the status of their new orders shipped. Its key components are recent orders, items ordered, items shipped and total shipped orders. Pitch your topic with ease and precision using this New Orders Logistics Management Dashboard With Delivery Status Designs PDF. This layout presents information on Recent Orders, Current Shipping Status, New Orders. It is also available for immediate download and adjustment. So, changes can be made in the color, design, graphics or any other component to create a unique layout.
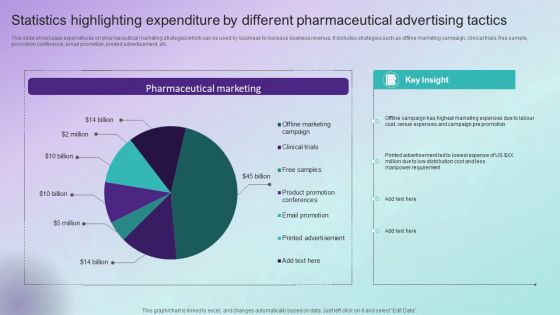
Statistics Highlighting Expenditure By Different Pharmaceutical Advertising Tactics Mockup PDF
This slide showcases expenditures on pharmaceutical marketing strategies which can be used by business to increase business revenue. It includes strategies such as offline marketing campaign, clinical trials, free sample, promotion conference, email promotion, printed advertisement, etc. Pitch your topic with ease and precision using this Statistics Highlighting Expenditure By Different Pharmaceutical Advertising Tactics Mockup PDF. This layout presents information on Offline Marketing Campaign, Clinical Trials, Free Sample, Promotion Conference, Email Promotion, Printed Advertisement. It is also available for immediate download and adjustment. So, changes can be made in the color, design, graphics or any other component to create a unique layout.
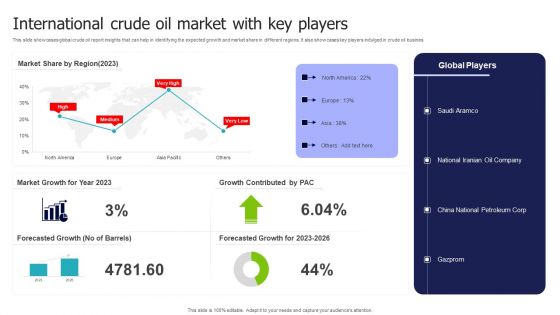
International Crude Oil Market With Key Players Demonstration PDF
This slide showcases global crude oil report insights that can help in identifying the expected growth and market share in different regions. It also showcases key players indulged in crude oil busines. Pitch your topic with ease and precision using this International Crude Oil Market With Key Players Demonstration PDF. This layout presents information on Market Share, Market Growth, Growth Contributed . It is also available for immediate download and adjustment. So, changes can be made in the color, design, graphics or any other component to create a unique layout.
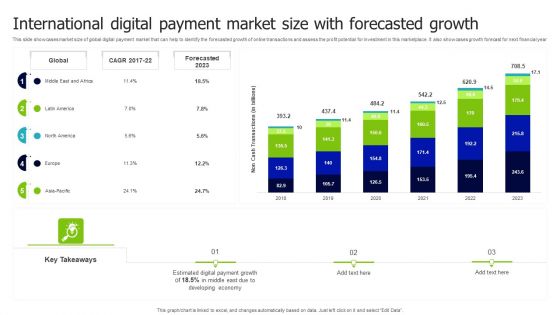
International Digital Payment Market Size With Forecasted Growth Inspiration PDF
This slide showcases market size of global digital payment market that can help to identify the forecasted growth of online transactions and assess the profit potential for investment in this marketplace. It also showcases growth forecast for next financial year. Pitch your topic with ease and precision using this International Digital Payment Market Size With Forecasted Growth Inspiration PDF. This layout presents information on Global, Forecasted, Growth. It is also available for immediate download and adjustment. So, changes can be made in the color, design, graphics or any other component to create a unique layout.

International Housing Market Trends With Key Drivers Inspiration PDF
This slide showcases global statistics that can help organizations to estimate the forecasted growth of housing market and identify stock by region. It also showcases key drivers contributing in new housing developments. Pitch your topic with ease and precision using this International Housing Market Trends With Key Drivers Inspiration PDF. This layout presents information on Key Drivers, Housing Market, Forecasted. It is also available for immediate download and adjustment. So, changes can be made in the color, design, graphics or any other component to create a unique layout.
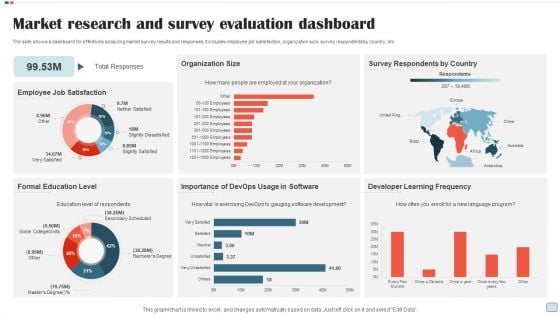
Market Research And Survey Evaluation Dashboard Rules PDF
The slide shows a dashboard for effectively analyzing market survey results and responses. It includes employee job satisfaction, organization size, survey respondents by country, etc. Pitch your topic with ease and precision using this Market Research And Survey Evaluation Dashboard Rules PDF. This layout presents information on Employee Job Satisfaction, Organization Size, Survey Respondents By Country. It is also available for immediate download and adjustment. So, changes can be made in the color, design, graphics or any other component to create a unique layout.
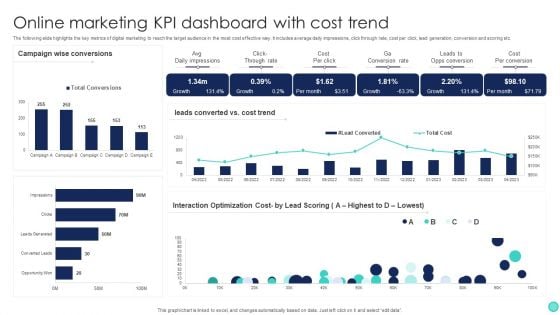
Online Marketing KPI Dashboard With Cost Trend Slides PDF
The following slide highlights the key metrics of digital marketing to reach the target audience in the most cost effective way. It includes average daily impressions, click through rate, cost per click, lead generation, conversion and scoring etc. Pitch your topic with ease and precision using this Online Marketing KPI Dashboard With Cost Trend Slides PDF. This layout presents information on Average Daily Impressions, Click Through Rate, Cost Per Click, Lead Generation, Conversion And Scoring. It is also available for immediate download and adjustment. So, changes can be made in the color, design, graphics or any other component to create a unique layout.
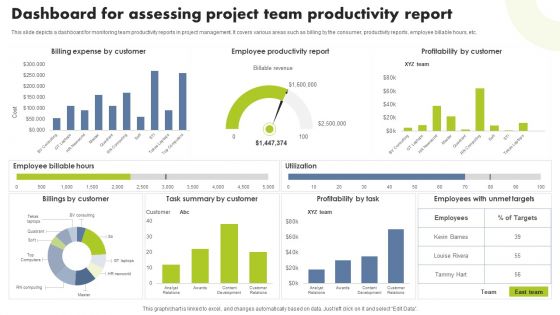
Dashboard For Assessing Project Team Productivity Report Mockup PDF
This slide depicts a dashboard for monitoring team productivity reports in project management. It covers various areas such as billing by the consumer, productivity reports, employee billable hours, etc. Pitch your topic with ease and precision using this Dashboard For Assessing Project Team Productivity Report Mockup PDF. This layout presents information on Billing Expense Customer, Employee Productivity Report, Profitability Customer. It is also available for immediate download and adjustment. So, changes can be made in the color, design, graphics or any other component to create a unique layout.
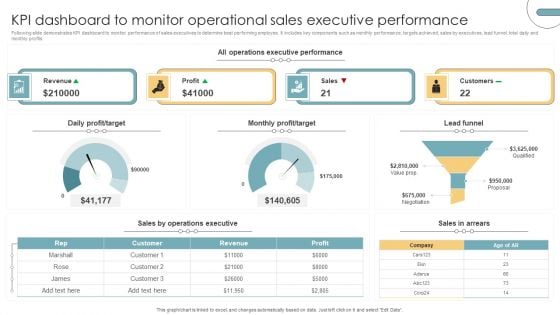
KPI Dashboard To Monitor Operational Sales Executive Performance Portrait PDF
Following slide demonstrates KPI dashboard to monitor performance of sales executives to determine best performing employee. It includes key components such as monthly performance, targets achieved, sales by executives, lead funnel, total daily and monthly profits. Pitch your topic with ease and precision using this KPI Dashboard To Monitor Operational Sales Executive Performance Portrait PDF. This layout presents information on Revenue, Profit, Sales, Customers. It is also available for immediate download and adjustment. So, changes can be made in the color, design, graphics or any other component to create a unique layout.
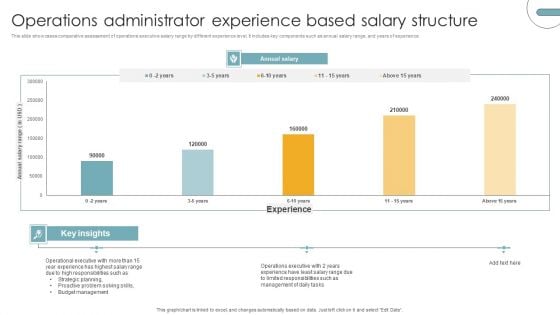
Operations Administrator Experience Based Salary Structure Structure PDF
This slide showcases comparative assessment of operations executive salary range by different experience level. It includes key components such as annual salary range, and years of experience. Pitch your topic with ease and precision using this Operations Administrator Experience Based Salary Structure Structure PDF. This layout presents information on Budget Management, Strategic Planning, Management, Operations Executive, Responsibilities. It is also available for immediate download and adjustment. So, changes can be made in the color, design, graphics or any other component to create a unique layout.

Factors Influencing Consumer Decision Making And Affecting Shopping Behavior Clipart PDF
This slide represents survey to find key drivers and barriers that influence shoppers buying decisions. It highlights drivers and barriers such as hassle free return, product information etc. Slidegeeks is one of the best resources for PowerPoint templates. You can download easily and regulate Factors Influencing Consumer Decision Making And Affecting Shopping Behavior Clipart PDF for your personal presentations from our wonderful collection. A few clicks is all it takes to discover and get the most relevant and appropriate templates. Use our Templates to add a unique zing and appeal to your presentation and meetings. All the slides are easy to edit and you can use them even for advertisement purposes.
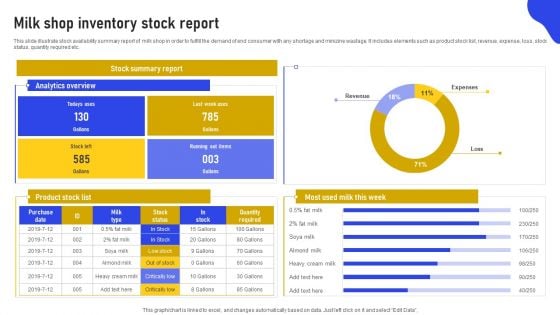
Milk Shop Inventory Stock Report Structure PDF
This slide illustrate stock availability summary report of milk shop in order to fulfill the demand of end consumer with any shortage and minizine wastage. It includes elements such as product stock list, revenue, expense, loss, stock status, quantity required etc. Pitch your topic with ease and precision using this Milk Shop Inventory Stock Report Structure PDF. This layout presents information on Stock Summary Report, Analytics Overview, Product Stock List. It is also available for immediate download and adjustment. So, changes can be made in the color, design, graphics or any other component to create a unique layout.

Supply Chain Management Inventory Stock Report Brochure PDF
This slide illustrate inventory stock summary of supply chain management to deliver products to end consumer on time. It includes elements such as inventory to sales ratio, last 5 year inventory turnover, inventory carrying cost, inventory accuracy, out of stock items. Pitch your topic with ease and precision using this Supply Chain Management Inventory Stock Report Brochure PDF. This layout presents information on Inventory Carrying Cost, Inventory Accuracy, Out Of Stock Item. It is also available for immediate download and adjustment. So, changes can be made in the color, design, graphics or any other component to create a unique layout.
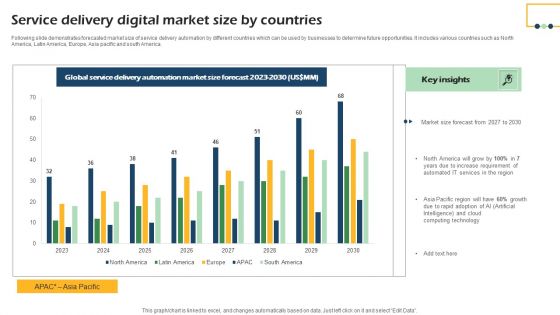
Service Delivery Digital Market Size By Countries Demonstration PDF
Following slide demonstrates forecasted market size of service delivery automation by different countries which can be used by businesses to determine future opportunities. It includes various countries such as North America, Latin America, Europe, Asia pacific and south America. Pitch your topic with ease and precision using this Service Delivery Digital Market Size By Countries Demonstration PDF. This layout presents information on Global Service, Delivery Automation, Market Size Forecast. It is also available for immediate download and adjustment. So, changes can be made in the color, design, graphics or any other component to create a unique layout.
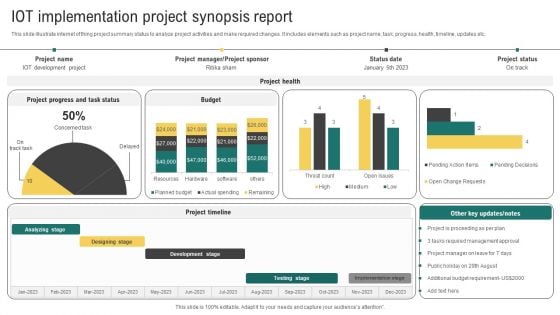
IOT Implementation Project Synopsis Report Summary PDF
This slide illustrate internet of thing project summary status to analyze project activities and make required changes. It includes elements such as project name, task, progress, health, timeline, updates etc. Pitch your topic with ease and precision using this IOT Implementation Project Synopsis Report Summary PDF. This layout presents information on Development Stage, Testing Stage, Implementation Stage. It is also available for immediate download and adjustment. So, changes can be made in the color, design, graphics or any other component to create a unique layout.
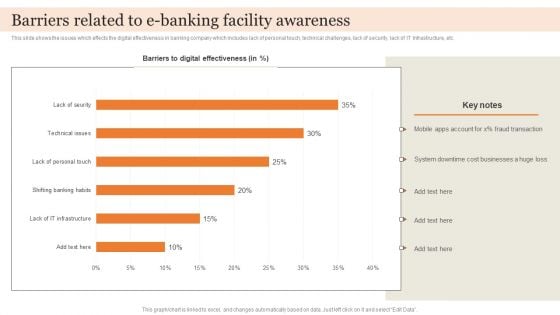
Barriers Related To E Banking Facility Awareness Guidelines PDF
This slide shows the issues which effects the digital effectiveness in banking company which includes lack of personal touch, technical challenges, lack of security, lack of IT Infrastructure, etc. Pitch your topic with ease and precision using this Barriers Related To E Banking Facility Awareness Guidelines PDF. This layout presents information on Cost Businesses, Fraud Transaction, Digital Effectiveness. It is also available for immediate download and adjustment. So, changes can be made in the color, design, graphics or any other component to create a unique layout.

Automated Supplier Relationship Management Risk Assessment Dashboard Showing Template PDF
This slide delineates risk assessment dashboard which can help vendor managers in assessing procurement contract status. It includes information about suppliers, renewals, actions, assessment status, concentration, etc. Slidegeeks is one of the best resources for PowerPoint templates. You can download easily and regulate Automated Supplier Relationship Management Risk Assessment Dashboard Showing Template PDF for your personal presentations from our wonderful collection. A few clicks is all it takes to discover and get the most relevant and appropriate templates. Use our Templates to add a unique zing and appeal to your presentation and meetings. All the slides are easy to edit and you can use them even for advertisement purposes.
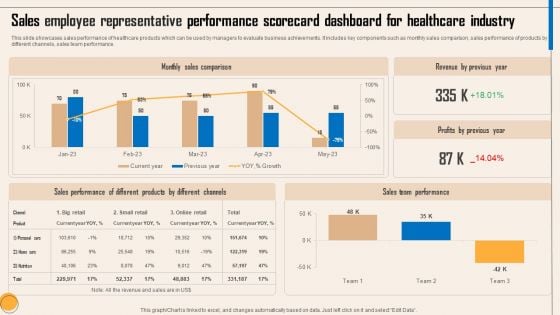
Sales Employee Representative Performance Scorecard Dashboard For Healthcare Industry Clipart PDF
This slide showcases sales performance of healthcare products which can be used by managers to evaluate business achievements. It includes key components such as monthly sales comparison, sales performance of products by different channels, sales team performance. Pitch your topic with ease and precision using this Sales Employee Representative Performance Scorecard Dashboard For Healthcare Industry Clipart PDF. This layout presents information on Monthly Sales Comparison, Revenue By Previous Year, Sales Performance, Different Products, Different Channels, Sales Team Performance . It is also available for immediate download and adjustment. So, changes can be made in the color, design, graphics or any other component to create a unique layout.
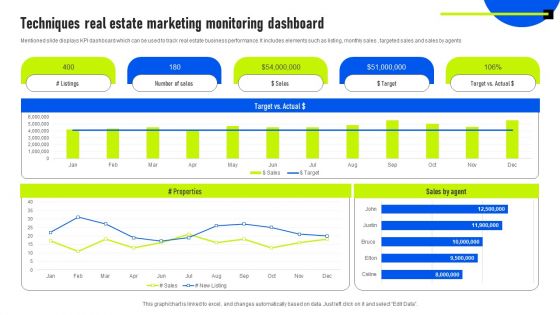
Techniques Real Estate Marketing Monitoring Dashboard Guidelines PDF
Mentioned slide displays KPI dashboard which can be used to track real estate business performance. It includes elements such as listing, monthly sales , targeted sales and sales by agents. Pitch your topic with ease and precision using this Techniques Real Estate Marketing Monitoring Dashboard Guidelines PDF. This layout presents information on Sales By Agent, Target, Marketing Monitoring Dashboard. It is also available for immediate download and adjustment. So, changes can be made in the color, design, graphics or any other component to create a unique layout.
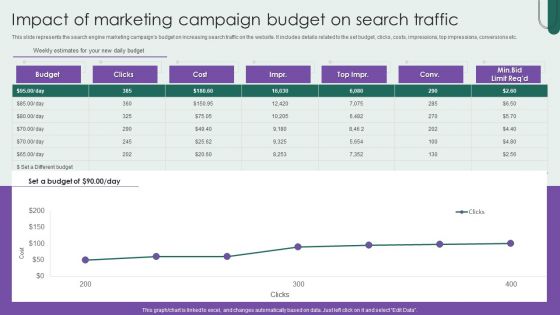
Impact Of Marketing Campaign Budget On Search Traffic Brochure PDF
This slide represents the search engine marketing campaigns budget on increasing search traffic on the website. It includes details related to the set budget, clicks, costs, impressions, top impressions, conversions etc. Pitch your topic with ease and precision using this Impact Of Marketing Campaign Budget On Search Traffic Brochure PDF. This layout presents information on Cost, Budget, Impact Of Marketing Campaign. It is also available for immediate download and adjustment. So, changes can be made in the color, design, graphics or any other component to create a unique layout.
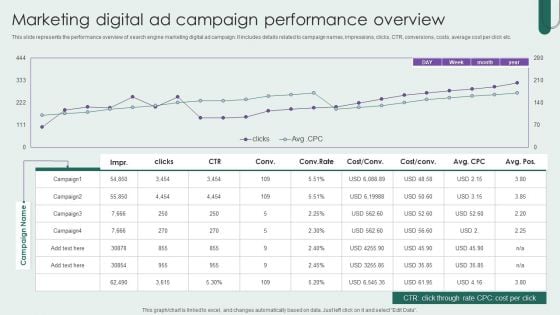
Marketing Digital Ad Campaign Performance Overview Designs PDF
This slide represents the performance overview of search engine marketing digital ad campaign. It includes details related to campaign names, impressions, clicks, CTR, conversions, costs, average cost per click etc. Pitch your topic with ease and precision using this Marketing Digital Ad Campaign Performance Overview Designs PDF. This layout presents information on Marketing Digital Ad Campaign, Performance Overview. It is also available for immediate download and adjustment. So, changes can be made in the color, design, graphics or any other component to create a unique layout.
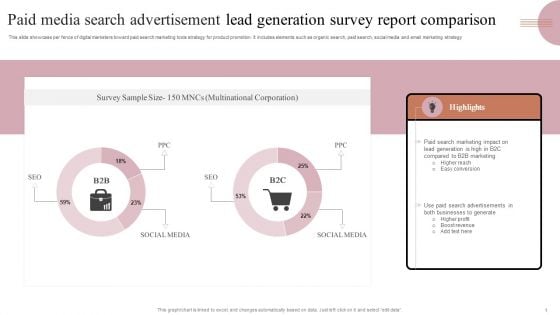
Paid Media Search Advertisement Lead Generation Survey Report Comparison Clipart PDF
This slide showcase per fence of digital marketers toward paid search marketing tools strategy for product promotion. It includes elements such as organic search, paid search, social media and email marketing strategy. Pitch your topic with ease and precision using this Paid Media Search Advertisement Lead Generation Survey Report Comparison Clipart PDF. This layout presents information on Search Marketing, B2B Marketing, Higher Profit. It is also available for immediate download and adjustment. So, changes can be made in the color, design, graphics or any other component to create a unique layout.
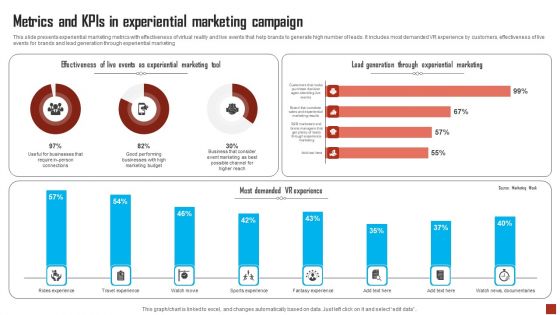
Metrics And Kpis In Experiential Marketing Campaign Structure PDF
This slide presents experiential marketing metrics with effectiveness of virtual reality and live events that help brands to generate high number of leads. It includes most demanded VR experience by customers, effectiveness of live events for brands and lead generation through experiential marketing. Pitch your topic with ease and precision using this Metrics And Kpis In Experiential Marketing Campaign Structure PDF. This layout presents information on Experiential Marketing, Business, Metrics. It is also available for immediate download and adjustment. So, changes can be made in the color, design, graphics or any other component to create a unique layout.
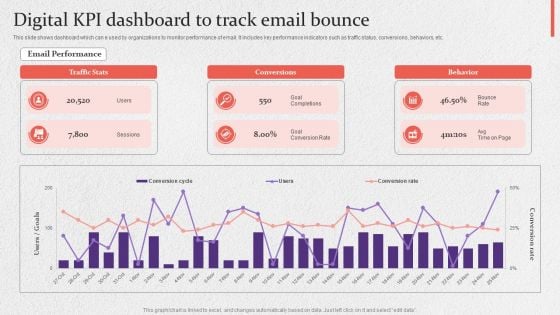
Digital KPI Dashboard To Track Email Bounce Slides PDF
This slide shows dashboard which can e used by organizations to monitor performance of email. It includes key performance indicators such as traffic status, conversions, behaviors, etc. Pitch your topic with ease and precision using this Digital KPI Dashboard To Track Email Bounce Slides PDF. This layout presents information on Digital Kpi Dashboard, Track Email Bounce. It is also available for immediate download and adjustment. So, changes can be made in the color, design, graphics or any other component to create a unique layout.
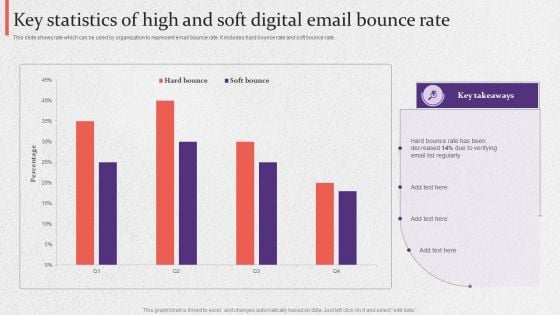
Key Statistics Of High And Soft Digital Email Bounce Rate Summary PDF
This slide shows rate which can be used by organization to represent email bounce rate. It includes hard bounce rate and soft bounce rate. Pitch your topic with ease and precision using this Key Statistics Of High And Soft Digital Email Bounce Rate Summary PDF. This layout presents information on Key Statistics, Soft Digital, Email Bounce Rate. It is also available for immediate download and adjustment. So, changes can be made in the color, design, graphics or any other component to create a unique layout.
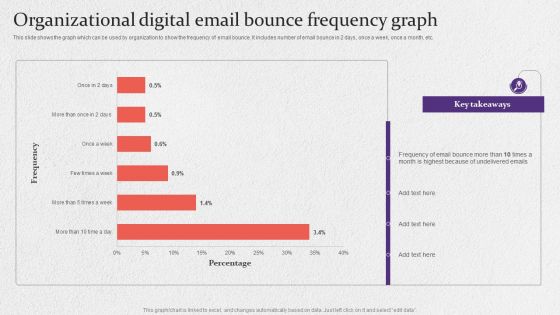
Organizational Digital Email Bounce Frequency Graph Formats PDF
This slide shows the graph which can be used by organization to show the frequency of email bounce. It includes number of email bounce in 2 days, once a week, once a month, etc. Pitch your topic with ease and precision using this Organizational Digital Email Bounce Frequency Graph Formats PDF. This layout presents information on Organizational Digital, Email Bounce Frequency Graph. It is also available for immediate download and adjustment. So, changes can be made in the color, design, graphics or any other component to create a unique layout.
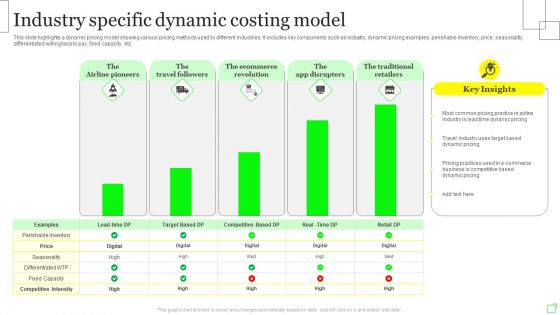
Industry Specific Dynamic Costing Model Demonstration PDF
This slide highlights a dynamic pricing model showing various pricing methods used by different industries. It includes key components such as industry, dynamic pricing examples, perishable inventory, price, seasonality, differentiated willingness to pay, fixed capacity, etc. Pitch your topic with ease and precision using this Industry Specific Dynamic Costing Model Demonstration PDF. This layout presents information on Dynamic Pricing, E Commerce, Target. It is also available for immediate download and adjustment. So, changes can be made in the color, design, graphics or any other component to create a unique layout.
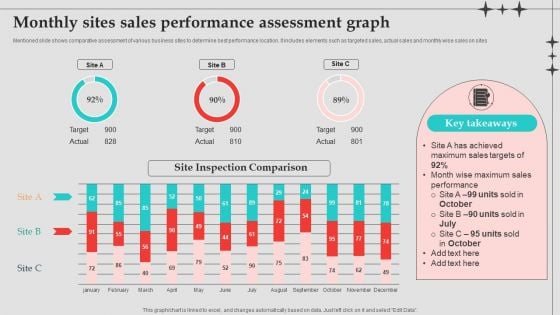
Monthly Sites Sales Performance Assessment Graph Designs PDF
Mentioned slide shows comparative assessment of various business sites to determine best performance location. It includes elements such as targeted sales, actual sales and monthly wise sales on sites. Pitch your topic with ease and precision using this Monthly Sites Sales Performance Assessment Graph Designs PDF. This layout presents information on Sales Performance, Sales Targets, Performance Assessment Graph . It is also available for immediate download and adjustment. So, changes can be made in the color, design, graphics or any other component to create a unique layout.
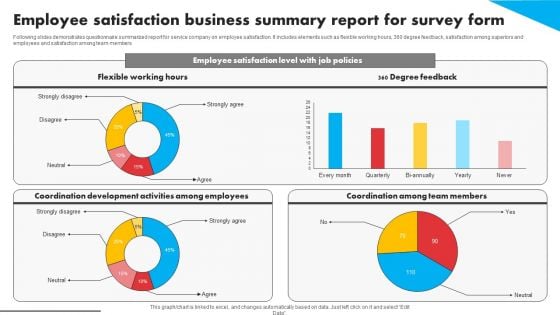
Employee Satisfaction Business Summary Report For Survey Form Survey SS
Following slides demonstrates questionnaire summarized report for service company on employee satisfaction. It includes elements such as flexible working hours, 360 degree feedback, satisfaction among superiors and employees and satisfaction among team members. Pitch your topic with ease and precision using this Employee Satisfaction Business Summary Report For Survey Form Survey SS. This layout presents information on Employee Satisfaction, Business Summary Report, Survey Form. It is also available for immediate download and adjustment. So, changes can be made in the color, design, graphics or any other component to create a unique layout.
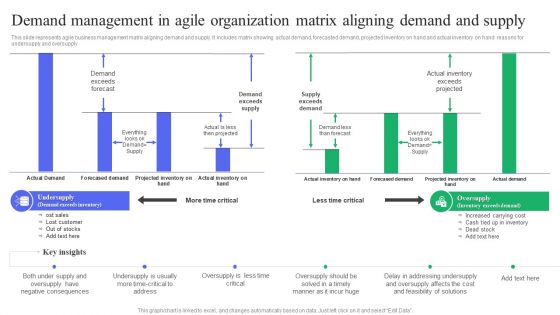
Demand Management In Agile Organization Matrix Aligning Demand And Supply Microsoft PDF
This slide represents agile business management matrix aligning demand and supply. It includes matrix showing actual demand, forecasted demand, projected inventory on hand and actual inventory on hand reasons for undersupply and oversupply Pitch your topic with ease and precision using this Demand Management In Agile Organization Matrix Aligning Demand And Supply Microsoft PDF. This layout presents information on Demand Exceeds Forecast, Demand Exceeds Supply, Supply Exceeds Demand. It is also available for immediate download and adjustment. So, changes can be made in the color, design, graphics or any other component to create a unique layout.
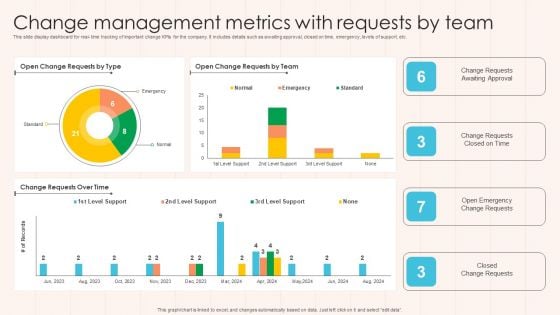
Change Management Metrics With Requests By Team Designs PDF
This slide display dashboard for real- time tracking of important change KPIs for the company. It includes details such as awaiting approval, closed on time, emergency, levels of support, etc. Pitch your topic with ease and precision using this Change Management Metrics With Requests By Team Designs PDF This layout presents information on Change Requests, Approval, Team. It is also available for immediate download and adjustment. So, changes can be made in the color, design, graphics or any other component to create a unique layout.
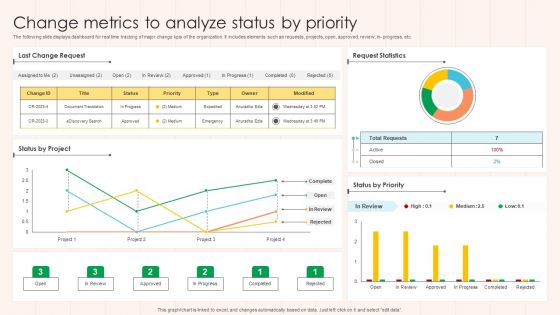
Change Metrics To Analyze Status By Priority Formats PDF
The following slide displays dashboard for real time tracking of major change kpis of the organization. It includes elements such as requests, projects, open, approved, review, in- progress, etc. Pitch your topic with ease and precision using this Change Metrics To Analyze Status By Priority Formats PDF This layout presents information on Project, Request Statistics, Priority. It is also available for immediate download and adjustment. So, changes can be made in the color, design, graphics or any other component to create a unique layout.
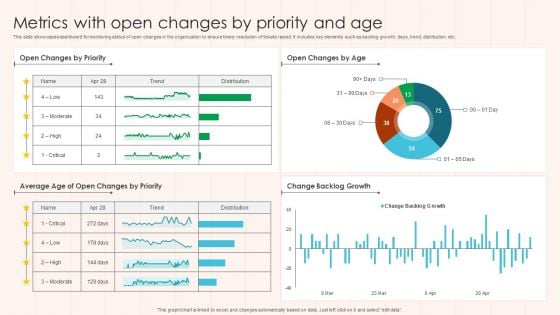
Metrics With Open Changes By Priority And Age Guidelines PDF
This slide showcases dashboard for monitoring status of open changes in the organization to ensure timely resolution of tickets raised. It includes key elements such as backlog growth, days, trend, distribution, etc. Pitch your topic with ease and precision using this Metrics With Open Changes By Priority And Age Guidelines PDF This layout presents information on Change Backlog Growth, Priority, Age. It is also available for immediate download and adjustment. So, changes can be made in the color, design, graphics or any other component to create a unique layout.
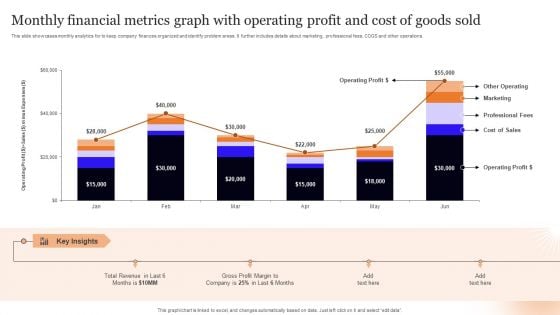
Monthly Financial Metrics Graph With Operating Profit And Cost Of Goods Sold Pictures PDF
This slide showcases monthly analytics for to keep company finances organized and identify problem areas. It further includes details about marketing, professional fees, COGS and other operations. Pitch your topic with ease and precision using this Monthly Financial Metrics Graph With Operating Profit And Cost Of Goods Sold Pictures PDF. This layout presents information on Key Insights, Operating Profit, Total Revenue. It is also available for immediate download and adjustment. So, changes can be made in the color, design, graphics or any other component to create a unique layout.
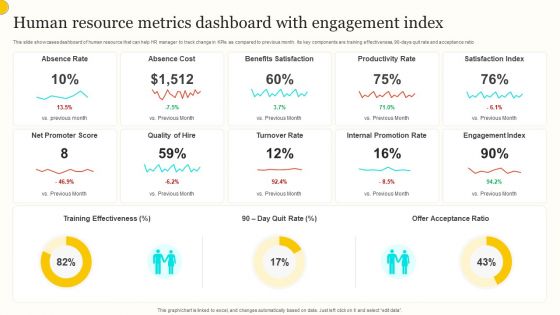
Human Resource Metrics Dashboard With Engagement Index Guidelines PDF
This slide showcases dashboard of human resource that can help HR manager to track change in KPIs as compared to previous month. Its key components are training effectiveness, 90 days quit rate and acceptance ratio. Pitch your topic with ease and precision using this Human Resource Metrics Dashboard With Engagement Index Guidelines PDF. This layout presents information on Absence Rate, Absence Cost, Benefits Satisfaction. It is also available for immediate download and adjustment. So, changes can be made in the color, design, graphics or any other component to create a unique layout.
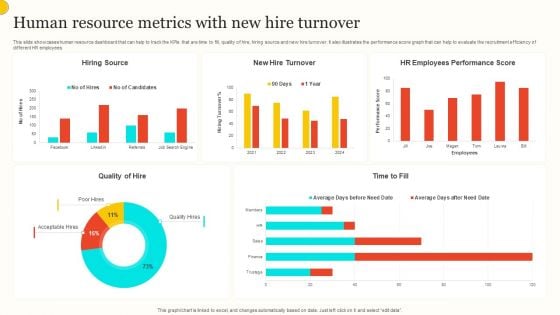
Human Resource Metrics With New Hire Turnover Professional PDF
This slide showcases human resource dashboard that can help to track the KPIs that are time to fill, quality of hire, hiring source and new hire turnover. It also illustrates the performance score graph that can help to evaluate the recruitment efficiency of different HR employees. Pitch your topic with ease and precision using this Human Resource Metrics With New Hire Turnover Professional PDF. This layout presents information on Hiring Source, New Hire Turnover, Hr Employees Performance Score. It is also available for immediate download and adjustment. So, changes can be made in the color, design, graphics or any other component to create a unique layout.
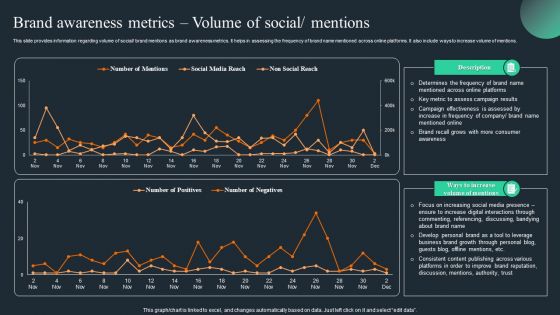
Brand Recognition Overview Brand Awareness Metrics Volume Of Social Mentions Demonstration PDF
This slide provides information regarding volume of social or brand mentions as brand awareness metrics. It helps in assessing the frequency of brand name mentioned across online platforms. It also include ways to increase volume of mentions. Want to ace your presentation in front of a live audience Our Brand Recognition Overview Brand Awareness Metrics Volume Of Social Mentions Demonstration PDF can help you do that by engaging all the users towards you.. Slidegeeks experts have put their efforts and expertise into creating these impeccable powerpoint presentations so that you can communicate your ideas clearly. Moreover, all the templates are customizable, and easy-to-edit and downloadable. Use these for both personal and commercial use.
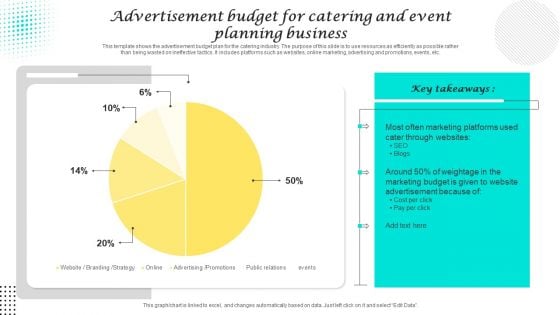
Advertisement Budget For Catering And Event Planning Business Introduction PDF
This template shows the advertisement budget plan for the catering industry. The purpose of this slide is to use resources as efficiently as possible rather than being wasted on ineffective tactics. It includes platforms such as websites, online marketing, advertising and promotions, events, etc. Pitch your topic with ease and precision using this Advertisement Budget For Catering And Event Planning Business Introduction PDF. This layout presents information on Key Takeaways, Planning Business, Websites. It is also available for immediate download and adjustment. So, changes can be made in the color, design, graphics or any other component to create a unique layout.

Summary Report For Post Hospital Visit Patient Experience Assessment Survey Survey SS
Following slides demonstrates summarized report for survey conducted by manager to improve hospital services. It includes key components such as appointment scheduling process, hospital visit frequency, wafting area experience, hospital cleanliness, staff behavior, etc. Pitch your topic with ease and precision using this Summary Report For Post Hospital Visit Patient Experience Assessment Survey Survey SS. This layout presents information on General Services, Appointment, Behavior. It is also available for immediate download and adjustment. So, changes can be made in the color, design, graphics or any other component to create a unique layout.
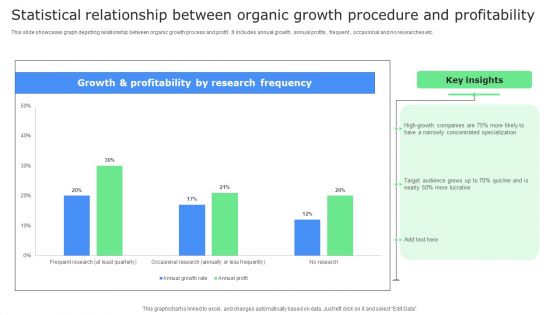
Statistical Relationship Between Organic Growth Procedure And Profitability Rules PDF
This slide showcases graph depicting relationship between organic growth process and profit . It includes annual growth , annual profits , frequent , occasional and no researches etc. Pitch your topic with ease and precision using this Statistical Relationship Between Organic Growth Procedure And Profitability Rules PDF. This layout presents information on Key Insights, Frequency, Profitability. It is also available for immediate download and adjustment. So, changes can be made in the color, design, graphics or any other component to create a unique layout.
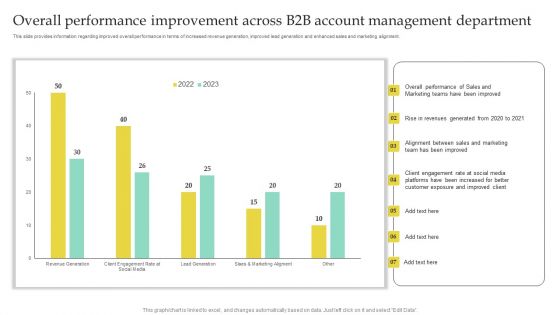
Overall Performance Improvement Across B2B Account Management Department Guidelines PDF
This slide provides information regarding improved overall performance in terms of increased revenue generation, improved lead generation and enhanced sales and marketing alignment. This Overall Performance Improvement Across B2B Account Management Department Guidelines PDF is perfect for any presentation, be it in front of clients or colleagues. It is a versatile and stylish solution for organizing your meetings. The product features a modern design for your presentation meetings. The adjustable and customizable slides provide unlimited possibilities for acing up your presentation. Slidegeeks has done all the homework before launching the product for you. So, do not wait, grab the presentation templates today


 Continue with Email

 Home
Home


