Information Technology Icons
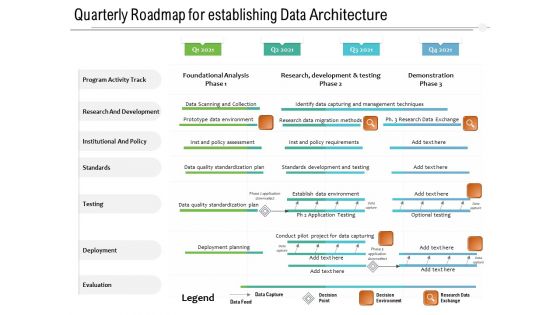
Quarterly Roadmap For Establishing Data Architecture Download
Presenting our jaw dropping quarterly roadmap for establishing data architecture download. You can alternate the color, font size, font type, and shapes of this PPT layout according to your strategic process. This PPT presentation is compatible with Google Slides and is available in both standard screen and widescreen aspect ratios. You can also download this well researched PowerPoint template design in different formats like PDF, JPG, and PNG. So utilize this visually appealing design by clicking the download button given below.
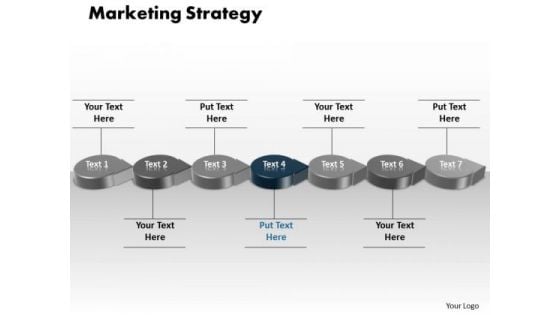
Ppt Red White And Blue PowerPoint Theme Circlular Arrow Marketing Strategy Templates
PPT red white and blue powerpoint theme circlular arrow marketing strategy Templates-Use this graphical approach to represent global business issues such as financial data, stock market Exchange, increase in sales, corporate presentations and more.-PPT red white and blue powerpoint theme circlular arrow marketing strategy Templates-3d, Advertisement, Advertising, Arrow, Border, Business, Circles, Collection, Customer, Design, Element, Icon, Idea, Illustration, Info, Information, Isolated, Label, Light, Location, Needle, New, Notification, Notify, Point, Pointer, Promotion, Role, Rounded Have a field day with our Ppt Red White And Blue PowerPoint Theme Circlular Arrow Marketing Strategy Templates. You will enjoy the outcome of your effort.
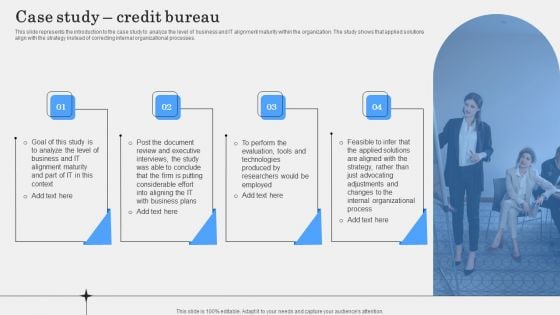
IT Alignment Phases In Business Case Study Credit Bureau Rules PDF
This slide represents the introduction to the case study to analyze the level of business and IT alignment maturity within the organization. The study shows that applied solutions align with the strategy instead of correcting internal organizational processes. Get a simple yet stunning designed IT Alignment Phases In Business Case Study Credit Bureau Rules PDF. It is the best one to establish the tone in your meetings. It is an excellent way to make your presentations highly effective. So, download this PPT today from Slidegeeks and see the positive impacts. Our easy to edit IT Alignment Phases In Business Case Study Credit Bureau Rules PDF can be your go to option for all upcoming conferences and meetings. So, what are you waiting for Grab this template today.
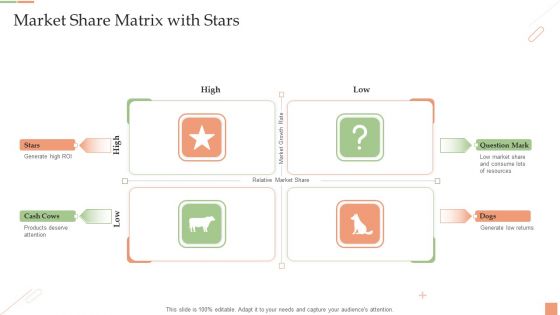
Market Share Matrix With Stars Ppt PowerPoint Presentation Slides Gridlines PDF
Presenting Market Share Matrix With Stars Ppt PowerPoint Presentation Slides Gridlines PDF to dispense important information. This template comprises four stages. It also presents valuable insights into the topics including products deserve, relative market, generate high roi. This is a completely customizable PowerPoint theme that can be put to use immediately. So, download it and address the topic impactfully.
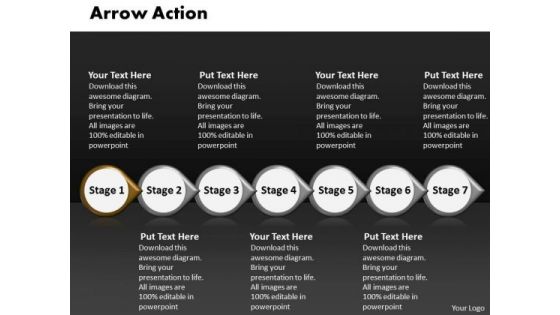
Ppt Arrow Illustration Of Action Using 7 Phase Diagram PowerPoint Templates
PPT arrow illustration of action using 7 phase diagram PowerPoint Templates-This PowerPoint Diagram represents controls and mechanisms. Use it to illustrate a stepwise process or a phase structure.-PPT arrow illustration of action using 7 phase diagram PowerPoint Templates-3d, Abstract, Advertisement, Aim, Arrow, Business, Circular, Cursor, Direction, Down, Environment, Form, Glossy, Graphic, Icon, Illustration, Information, Mark, Motion, Perspective, Point, Sale, Shadow, Shape, Shiny, Sign Your audience will feast upon our Ppt Arrow Illustration Of Action Using 7 Phase Diagram PowerPoint Templates. They provide ample eye candy.
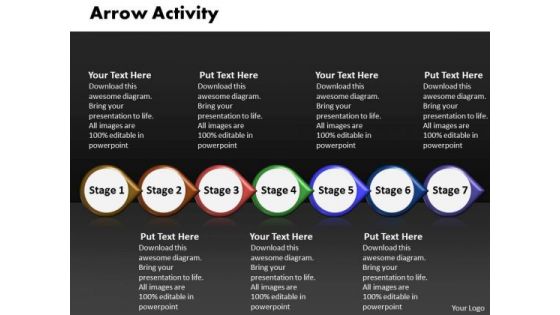
Ppt Arrow Illustration Of Activity Using 7 Phase Diagram PowerPoint Templates
PPT arrow illustration of activity using 7 phase diagram PowerPoint Templates-This PowerPoint Diagram represents controls and mechanisms. Use it to illustrate a stepwise process or a phase structure.-PPT arrow illustration of activity using 7 phase diagram PowerPoint Templates-3d, Abstract, Advertisement, Aim, Arrow, Business, Circular, Cursor, Direction, Down, Environment, Form, Glossy, Graphic, Icon, Illustration, Information, Mark, Motion, Perspective, Point, Sale, Shadow, Shape, Shiny, Sign Increase the output of your factory. Explore avenues available with our Ppt Arrow Illustration Of Activity Using 7 Phase Diagram PowerPoint Templates.
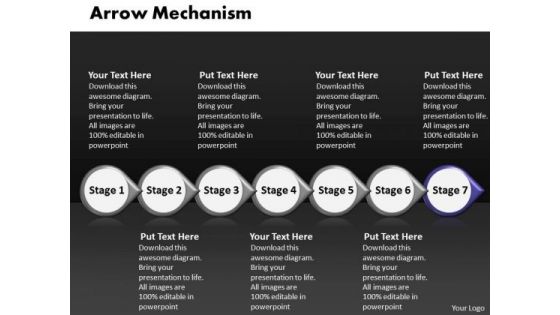
Ppt Arrow Illustration Of Mechanism Using 7 Phase Diagram PowerPoint Templates
PPT arrow illustration of mechanism using 7 phase diagram PowerPoint Templates-This PowerPoint Diagram represents controls and mechanisms. Use it to illustrate a stepwise process or a phase structure.-PPT arrow illustration of mechanism using 7 phase diagram PowerPoint Templates-3d, Abstract, Advertisement, Aim, Arrow, Business, Circular, Cursor, Direction, Down, Environment, Form, Glossy, Graphic, Icon, Illustration, Information, Mark, Motion, Perspective, Point, Sale, Shadow, Shape, Shiny, Sign Get up real close with our Ppt Arrow Illustration Of Mechanism Using 7 Phase Diagram PowerPoint Templates. Your goals will come within touching distance.
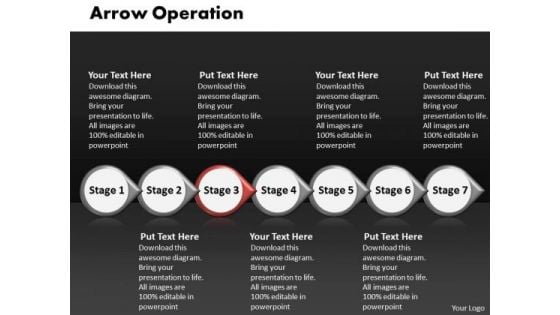
Ppt Arrow Illustration Of Operation Using 7 Phase Diagram PowerPoint Templates
PPT arrow illustration of operation using 7 phase diagram PowerPoint Templates-This PowerPoint Diagram represents controls and mechanisms. Use it to illustrate a stepwise process or a phase structure.-PPT arrow illustration of operation using 7 phase diagram PowerPoint Templates-3d, Abstract, Advertisement, Aim, Arrow, Business, Circular, Cursor, Direction, Down, Environment, Form, Glossy, Graphic, Icon, Illustration, Information, Mark, Motion, Perspective, Point, Sale, Shadow, Shape, Shiny, Sign Add to the fare you have to offer. Put our Ppt Arrow Illustration Of Operation Using 7 Phase Diagram PowerPoint Templates on the menu.
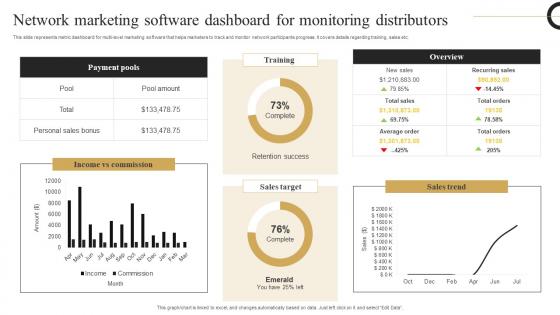
Network Marketing Software Strategic Plan Develop Multi Level Marketing Mockup Pdf
This slide represents metric dashboard for multi level marketing software that helps marketers to track and monitor network participants progress. It covers details regarding training, sales etc. Are you searching for a Network Marketing Software Strategic Plan Develop Multi Level Marketing Mockup Pdf that is uncluttered, straightforward, and original Its easy to edit, and you can change the colors to suit your personal or business branding. For a presentation that expresses how much effort you have put in, this template is ideal With all of its features, including tables, diagrams, statistics, and lists, its perfect for a business plan presentation. Make your ideas more appealing with these professional slides. Download Network Marketing Software Strategic Plan Develop Multi Level Marketing Mockup Pdf from Slidegeeks today. This slide represents metric dashboard for multi level marketing software that helps marketers to track and monitor network participants progress. It covers details regarding training, sales etc.
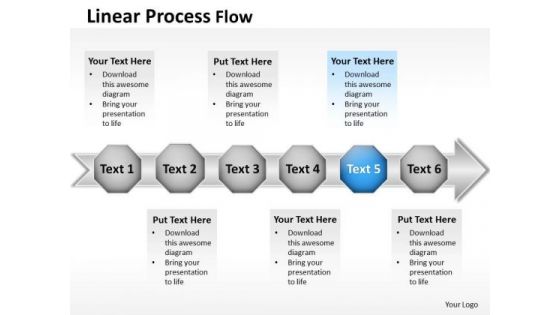
Ppt Continuous Flow PowerPoint Theme Actions Process Templates
PPT continuous flow powerpoint theme actions process Templates-Use this Astonishing PowerPoint Diagram on the black Background to abstract the different phases of a single procedure. It symbolizes forever and ever, interminable, looped, no end of, no end to, on a treadmill, perpetual, prolonged, regular etc.-PPT continuous flow powerpoint theme actions process Templates-3d, Advertisement, Advertising, Arrow, Border, Business, Circles, Collection, Customer, Design, Element, Icon, Idea, Illustration, Info, Information, Isolated, Label, Light, Location, Needle, New, Notification, Notify, Point, Pointer, Promotion, Role, Rounded You'll find your thoughts have an affinity for our Ppt Continuous Flow PowerPoint Theme Actions Process Templates. Almost like they are made for each other.
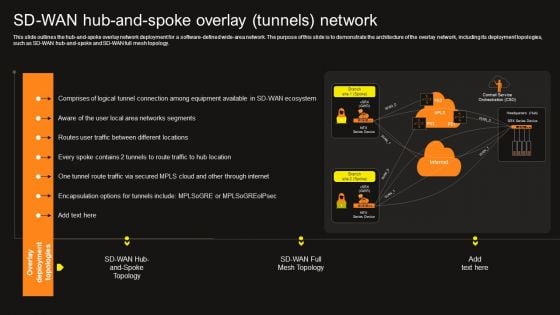
Virtual WAN Architecture SD WAN Hub And Spoke Overlay Tunnels Network Summary PDF
This slide outlines the hub-and-spoke overlay network deployment for a software-defined wide-area network. The purpose of this slide is to demonstrate the architecture of the overlay network, including its deployment topologies, such as SD-WAN hub-and-spoke and SD-WAN full mesh topology. If you are looking for a format to display your unique thoughts, then the professionally designed Virtual WAN Architecture SD WAN Hub And Spoke Overlay Tunnels Network Summary PDF is the one for you. You can use it as a Google Slides template or a PowerPoint template. Incorporate impressive visuals, symbols, images, and other charts. Modify or reorganize the text boxes as you desire. Experiment with shade schemes and font pairings. Alter, share or cooperate with other people on your work. Download Virtual WAN Architecture SD WAN Hub And Spoke Overlay Tunnels Network Summary PDF and find out how to give a successful presentation. Present a perfect display to your team and make your presentation unforgettable.

PowerPoint Graphics Business Colorful Slide Of Five Text Circles Slides
We present our powerpoint graphics business colorful slide of five text circles Slides.Use our Ring Charts PowerPoint Templates because Our PowerPoint Templates and Slides will let you meet your Deadlines. Use our Circle Charts PowerPoint Templates because Our PowerPoint Templates and Slides will let you Clearly mark the path for others to follow. Use our Process and Flows PowerPoint Templates because It can Conjure up grand ideas with our magical PowerPoint Templates and Slides. Leave everyone awestruck by the end of your presentation. Download our Shapes PowerPoint Templates because Our PowerPoint Templates and Slides will let you Hit the target. Go the full distance with ease and elan. Present our Business PowerPoint Templates because Our PowerPoint Templates and Slides will effectively help you save your valuable time. They are readymade to fit into any presentation structure. Use these PowerPoint slides for presentations relating to Boxes, brochure, business, button, catalog, chart, circle, company, cross, data, design, diagram, direction, document, financial, four, glossy, goals, graph, junction, management, market, marketing, model, multicolored, multiple, navigation, network, options, plan, presentation, process, purple, results, shiny, sphere, statistics. The prominent colors used in the PowerPoint template are Red, White, Black. Professionals tell us our powerpoint graphics business colorful slide of five text circles Slides look good visually. Presenters tell us our catalog PowerPoint templates and PPT Slides are topically designed to provide an attractive backdrop to any subject. The feedback we get is that our powerpoint graphics business colorful slide of five text circles Slides look good visually. Use our company PowerPoint templates and PPT Slides are readymade to fit into any presentation structure. You can be sure our powerpoint graphics business colorful slide of five text circles Slides are specially created by a professional team with vast experience. They diligently strive to come up with the right vehicle for your brilliant Ideas. Customers tell us our company PowerPoint templates and PPT Slides will generate and maintain the level of interest you desire. They will create the impression you want to imprint on your audience. Demonstrate ability with our PowerPoint Graphics Business Colorful Slide Of Five Text Circles Slides. Download without worries with our money back guaranteee.
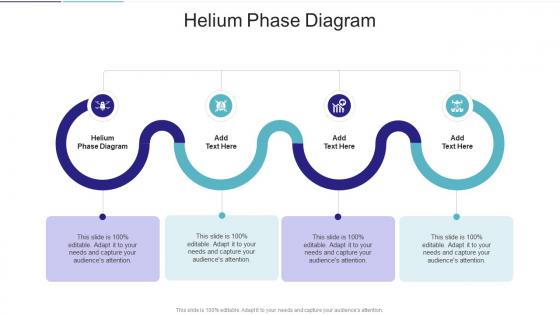
Helium Phase Diagram In Powerpoint And Google Slides Cpb
Presenting our innovatively designed set of slides titled Helium Phase Diagram In Powerpoint And Google Slides Cpb. This completely editable PowerPoint graphic exhibits Helium Phase Diagram that will help you convey the message impactfully. It can be accessed with Google Slides and is available in both standard screen and widescreen aspect ratios. Apart from this, you can download this well structured PowerPoint template design in different formats like PDF, JPG, and PNG. So, click the download button now to gain full access to this PPT design. Our Helium Phase Diagram In Powerpoint And Google Slides Cpb are topically designed to provide an attractive backdrop to any subject. Use them to look like a presentation pro.
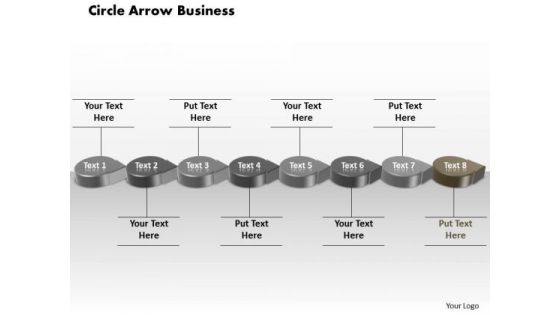
Ppt Grey Circular Arrow Business PowerPoint Theme Transactions Diagram Templates
PPT grey circular arrow business powerpoint theme transactions diagram Templates-This 3D PowerPoint Diagram shows the eight interconnected stages represented by Grey Circular Arrows. It signifies the concept of dart, fulmination, missile, shaft, thunderbolt, thunder stroke, pointer, and projectile.-PPT grey circular arrow business powerpoint theme transactions diagram Templates-3d, Advertisement, Advertising, Arrow, Border, Business, Circles, Collection, Customer, Design, Element, Icon, Idea, Illustration, Info, Information, Isolated, Label, Light, Location, Needle, New, Notification, Notify, Point, Pointer, Promotion, Role, Rounded Get the best backing available. It'll be difficult to beat your thoughts and our Ppt Grey Circular Arrow Business PowerPoint Theme Transactions Diagram Templates.
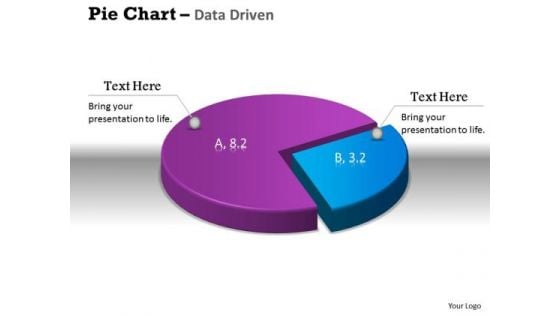
Data Analysis Excel 3d Pie Chart Shows Relative Size Of PowerPoint Templates
Get The Doers Into Action. Activate Them With Our data analysis excel 3d pie chart shows relative size of Powerpoint Templates.
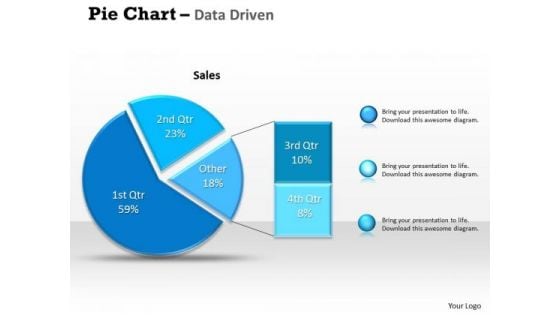
Data Analysis Excel Driven Percentage Breakdown Pie Chart PowerPoint Slides Templates
Be A Donor Of Great Ideas. Display Your Charity On Our data analysis excel driven percentage breakdown pie chart powerpoint slides Templates.
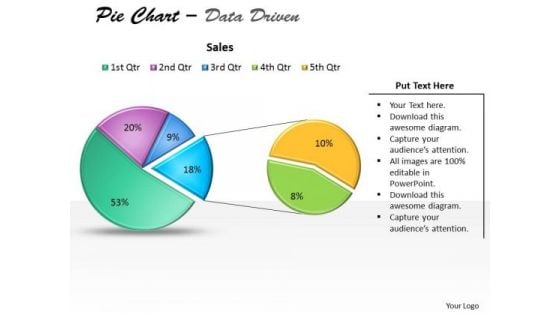
Data Analysis Excel Driven Pie Chart For Business Stratregy PowerPoint Slides Templates
Open Up Doors That Lead To Success. Our data analysis excel driven pie chart for business stratregy powerpoint slides Templates Provide The Handles.

Data Analysis Excel Driven Pie Chart For Easy Comparison PowerPoint Slides Templates
Our data analysis excel driven pie chart for easy comparison powerpoint slides Templates Abhor Doodling. They Never Let The Interest Flag.
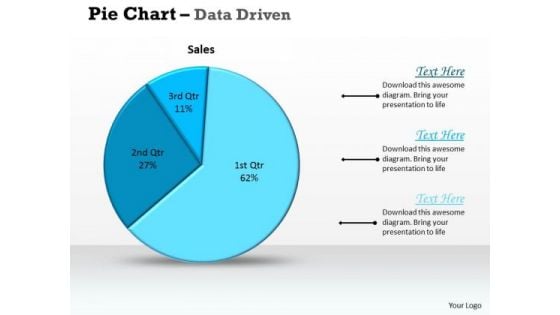
Data Analysis Excel Driven Pie Chart For Sales Process PowerPoint Slides Templates
Deliver The Right Dose With Our data analysis excel driven pie chart for sales process powerpoint slides Templates . Your Ideas Will Get The Correct Illumination.
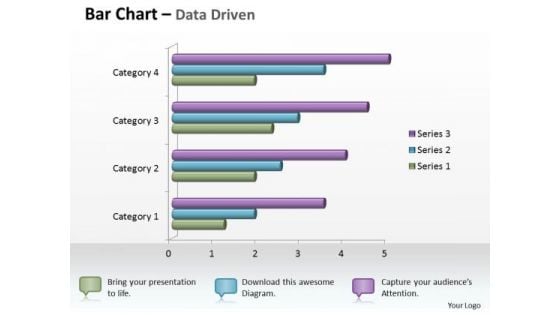
Data Analysis In Excel 3d Bar Chart For Business Statistics PowerPoint Templates
Knock On The Door To Success With Our data analysis in excel 3d bar chart for business statistics Powerpoint Templates . Be Assured Of Gaining Entry.
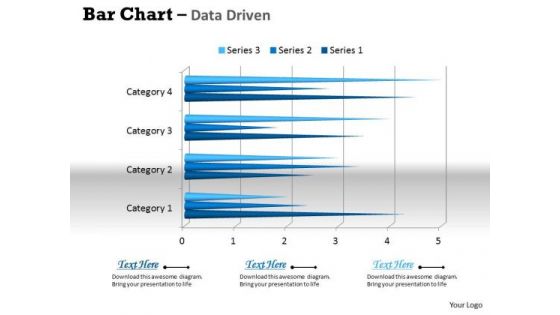
Data Analysis In Excel 3d Bar Chart For Business Trends PowerPoint Templates
Connect The Dots With Our data analysis in excel 3d bar chart for business trends Powerpoint Templates . Watch The Whole Picture Clearly Emerge.
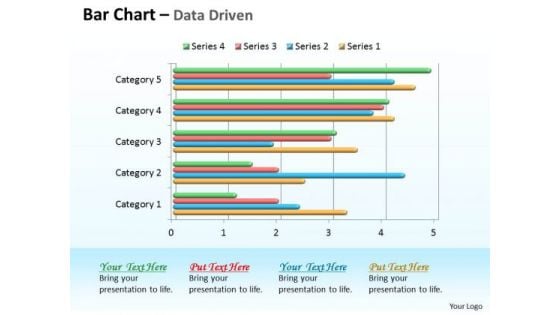
Data Analysis In Excel 3d Bar Chart For Comparison Of Time Series PowerPoint Templates
Double Your Chances With Our data analysis in excel 3d bar chart for comparison of time series Powerpoint Templates . The Value Of Your Thoughts Will Increase Two-Fold.
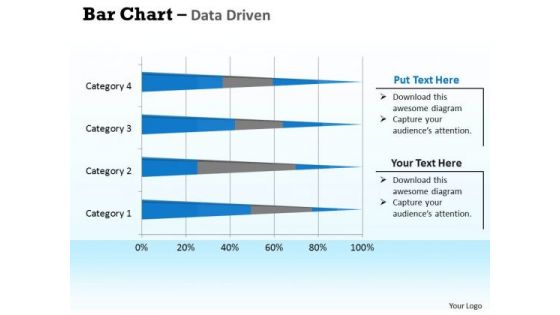
Data Analysis In Excel 3d Bar Chart For Interpretation PowerPoint Templates
Double Up Our data analysis in excel 3d bar chart for interpretation Powerpoint Templates With Your Thoughts. They Will Make An Awesome Pair.
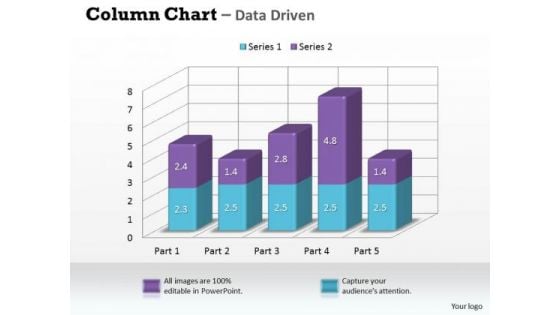
Data Analysis In Excel 3d Column Chart For Market Surveys PowerPoint Templates
Our data analysis in excel 3d column chart for market surveys Powerpoint Templates Leave No One In Doubt. Provide A Certainty To Your Views.
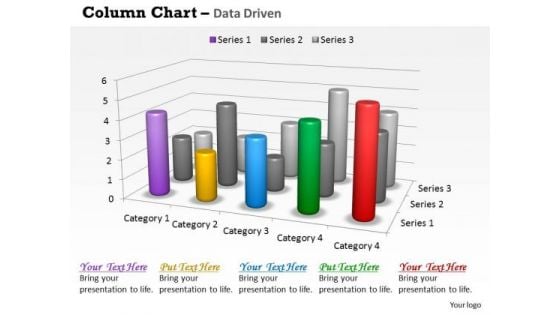
Data Analysis In Excel 3d Survey For Sales Chart PowerPoint Templates
Good Camaraderie Is A Key To Teamwork. Our data analysis in excel 3d survey for sales chart Powerpoint Templates Can Be A Cementing Force.
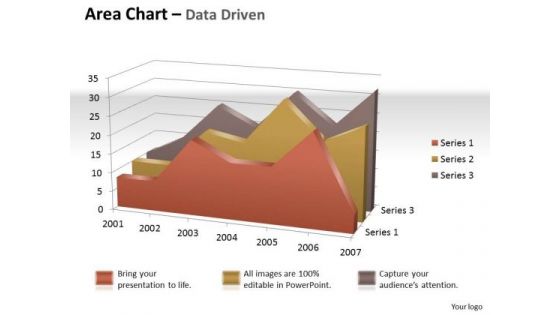
Data Analysis In Excel 3d Visual Display Of Area Chart PowerPoint Templates
Brace Yourself, Arm Your Thoughts. Prepare For The Hustle With Our data analysis in excel 3d visual display of area chart Powerpoint Templates .
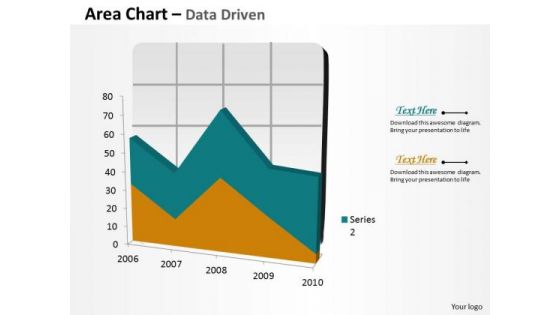
Data Analysis In Excel Area Chart For Business Process PowerPoint Templates
Your Grasp Of Economics Is Well Known. Help Your Audience Comprehend Issues With Our data analysis in excel area chart for business process Powerpoint Templates .
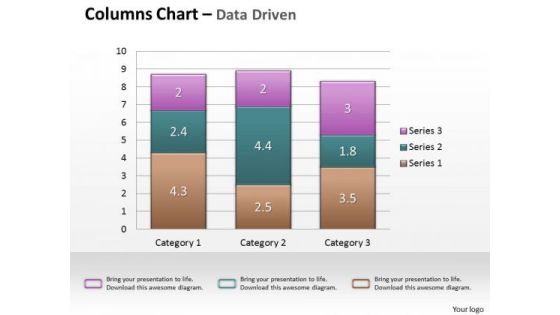
Data Analysis In Excel Column Chart For Business Analytics PowerPoint Templates
Our data analysis in excel column chart for business analytics Powerpoint Templates Heighten Concentration. Your Audience Will Be On The Edge.
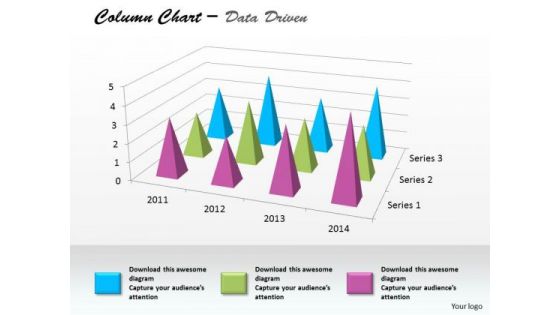
Data Analysis In Excel Column Chart For Business Project PowerPoint Templates
Edit Your Work With Our data analysis in excel column chart for business project Powerpoint Templates . They Will Help You Give The Final Form.
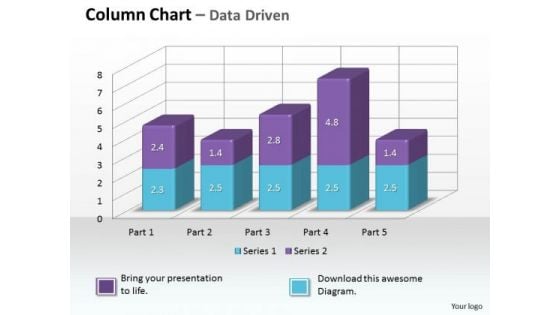
Data Analysis On Excel 3d Chart To Monitor Business Process PowerPoint Templates
Make Some Dough With Our data analysis on excel 3d chart to monitor business process Powerpoint Templates . Your Assets Will Rise Significantly.
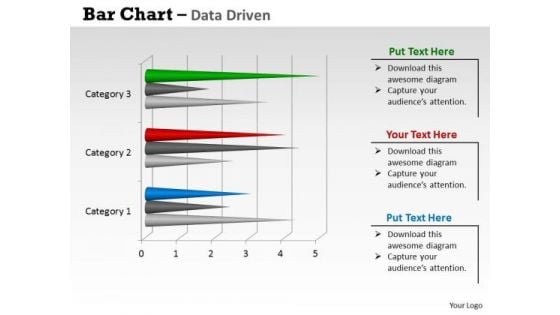
Data Analysis On Excel 3d Chart With Sets Of PowerPoint Templates
Reduce The Drag With Our data analysis on excel 3d chart with sets of Powerpoint Templates . Give More Lift To Your Thoughts.
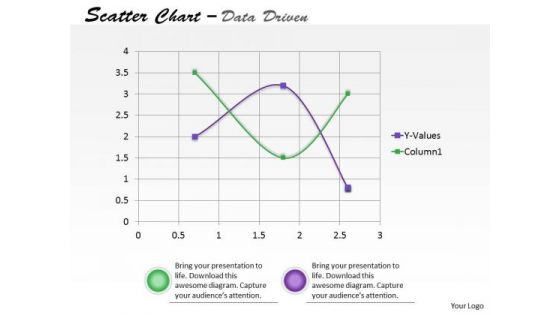
Data Analysis On Excel Driven Scatter Chart To Predict Future Movements PowerPoint Slides Templates
Our data analysis on excel driven scatter chart to predict future movements powerpoint slides Templates Enjoy Drama. They Provide Entertaining Backdrops.
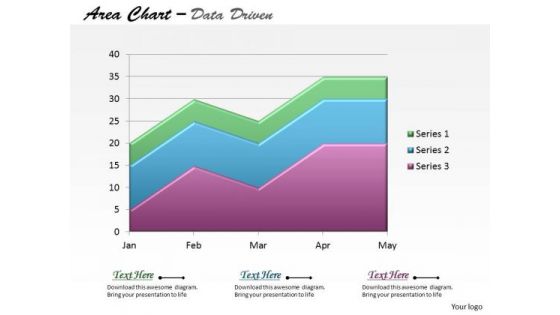
Data Analysis On Excel Driven Stacked Area Chart PowerPoint Slides Templates
Be The Dramatist With Our data analysis on excel driven stacked area chart powerpoint slides Templates . Script Out The Play Of Words.
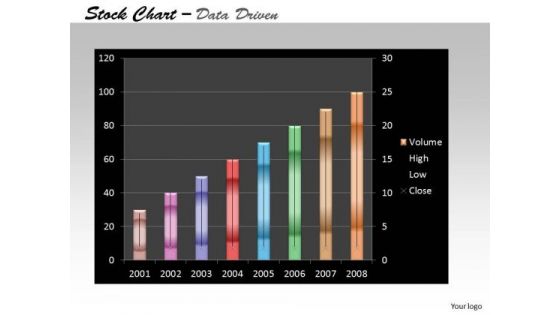
Data Analysis On Excel Driven Stock Chart For Business Growth PowerPoint Slides Templates
Add Some Dramatization To Your Thoughts. Our data analysis on excel driven stock chart for business growth powerpoint slides Templates Make Useful Props.
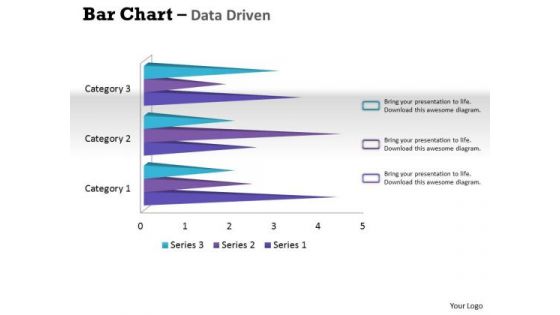
Data Analysis Techniques 3d Bar Chart For Financial Solutions PowerPoint Templates
Make Your Dreams A Reality With Our data analysis techniques 3d bar chart for financial solutions Powerpoint Templates . Your Ideas Will Begin To Take Shape.

Data Analysis Template Driven Express Business Facts Pie Chart PowerPoint Slides Templates
Display Your Drive On Our data analysis template driven express business facts pie chart powerpoint slides Templates . Invigorate The Audience With Your Fervor.
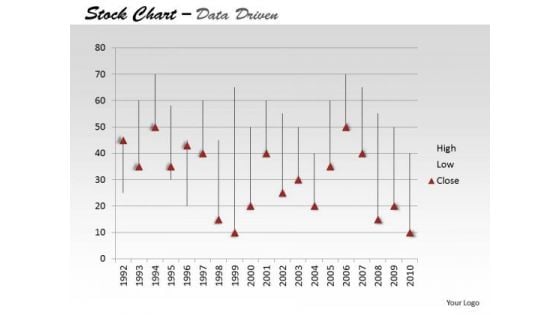
Data Analysis Template Driven Ineract With Stock Chart PowerPoint Slides Templates
Drive Your Passion With Our data analysis template driven ineract with stock chart powerpoint slides Templates . Steer Yourself To Achieve Your Aims.
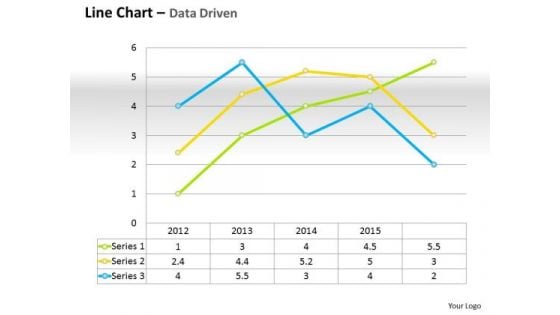
Data Analysis Template Driven Line Chart For Business Performance PowerPoint Slides Templates
Do Not Allow Things To Drift. Ring In Changes With Our data analysis template driven line chart for business performance powerpoint slides Templates .
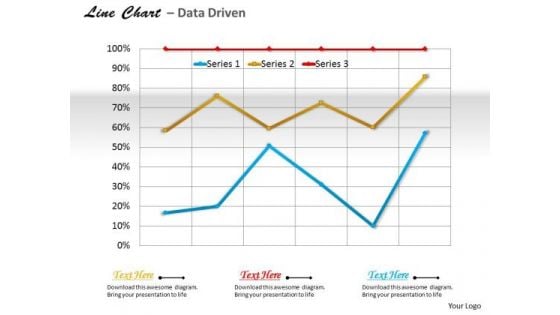
Data Analysis Template Driven Line Chart For Business Trends PowerPoint Slides Templates
Use Our data analysis template driven line chart for business trends powerpoint slides Templates As The Bit. Drill Your Thoughts Into Their Minds.
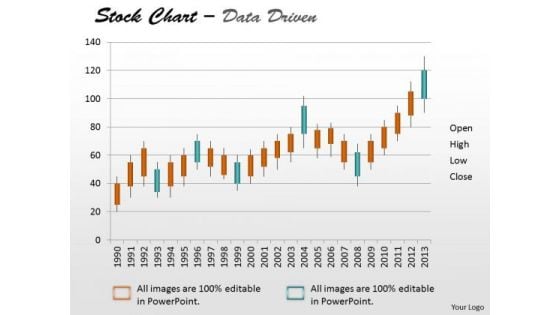
Data Analysis Template Driven Stock Chart For Market Trends PowerPoint Slides Templates
Drive Your Team Along The Road To Success. Take The Wheel With Our data analysis template driven stock chart for market trends powerpoint slides Templates .
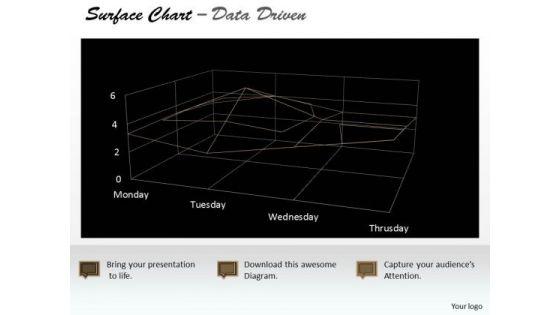
Data Analysis Template Driven Surface Chart Indicating Areas PowerPoint Slides Templates
Highlight Your Drive With Our data analysis template driven surface chart indicating areas powerpoint slides Templates . Prove The Fact That You Have Control.
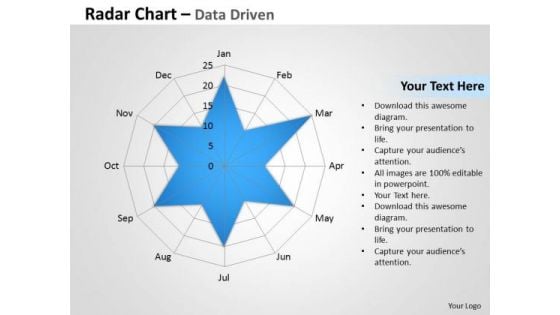
Examples Of Data Analysis Market Driven Radar Chart To Compare PowerPoint Slides Templates
Rely On Our examples of data analysis market driven radar chart to compare powerpoint slides Templates In Any Duel. They Will Drive Home Your Point.
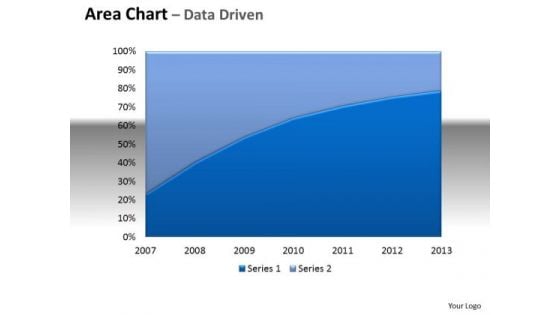
Financial Data Analysis Area Chart With Plotted Line Center PowerPoint Templates
Be The Doer With Our financial data analysis area chart with plotted line center Powerpoint Templates . Put Your Thoughts Into Practice.
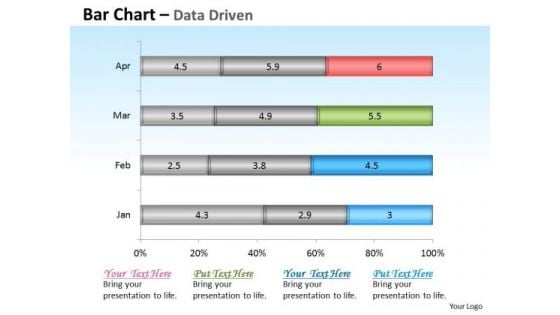
Financial Data Analysis Driven Base Bar Chart Design PowerPoint Slides Templates
Get The Domestics Right With Our financial data analysis driven base bar chart design powerpoint slides Templates . Create The Base For Thoughts To Grow.
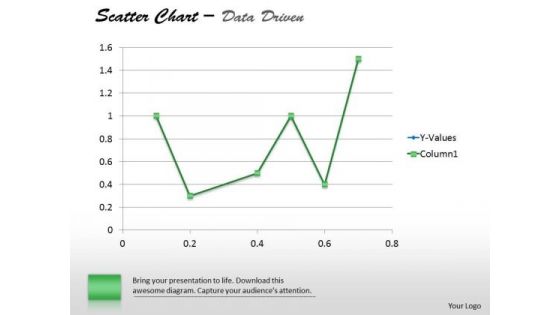
Financial Data Analysis Driven Demonstrate Statistics With Scatter Chart PowerPoint Slides Templates
Establish The Dominance Of Your Ideas. Our financial data analysis driven demonstrate statistics with scatter chart powerpoint slides Templates Will Put Them On Top.
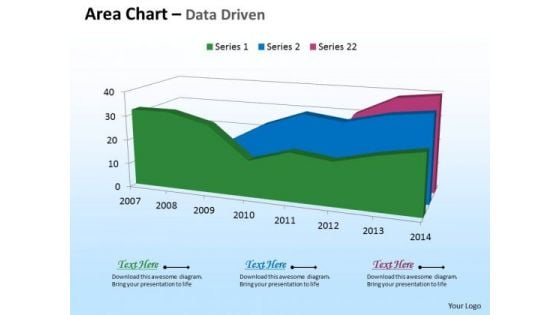
Microsoft Excel Data Analysis 3d Area Chart For Time Based PowerPoint Templates
Deliver The Right Dose With Our microsoft excel data analysis 3d area chart for time based Powerpoint Templates . Your Ideas Will Get The Correct Illumination.
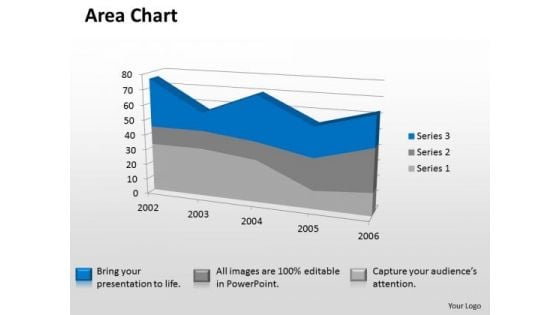
Microsoft Excel Data Analysis 3d Area Chart Showimg Change In Values PowerPoint Templates
Our microsoft excel data analysis 3d area chart showimg change in values Powerpoint Templates Deliver At Your Doorstep. Let Them In For A Wonderful Experience.
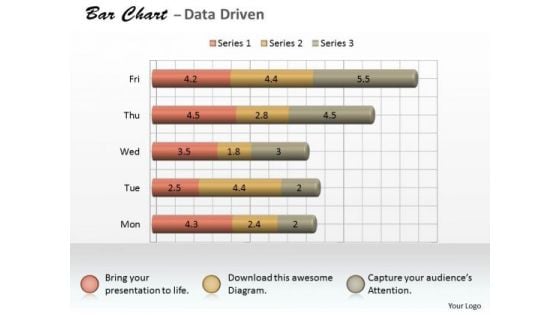
Microsoft Excel Data Analysis 3d Bar Chart As Research Tool PowerPoint Templates
Knock On The Door To Success With Our microsoft excel data analysis 3d bar chart as research tool Powerpoint Templates . Be Assured Of Gaining Entry.
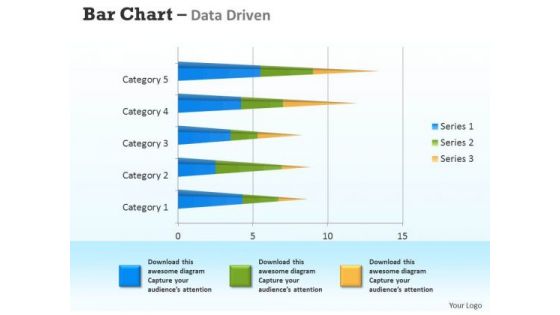
Microsoft Excel Data Analysis 3d Bar Chart For Analyzing Survey PowerPoint Templates
Connect The Dots With Our microsoft excel data analysis 3d bar chart for analyzing survey Powerpoint Templates . Watch The Whole Picture Clearly Emerge.
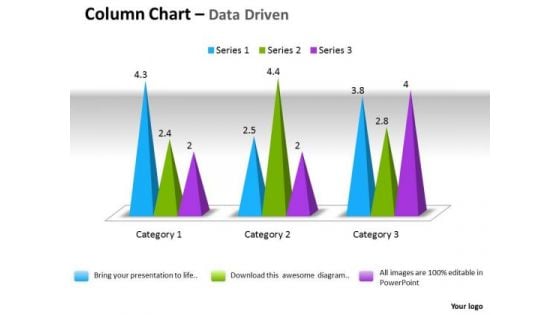
Microsoft Excel Data Analysis 3d Change In Business Process Chart PowerPoint Templates
Double Your Chances With Our microsoft excel data analysis 3d change in business process chart Powerpoint Templates . The Value Of Your Thoughts Will Increase Two-Fold.
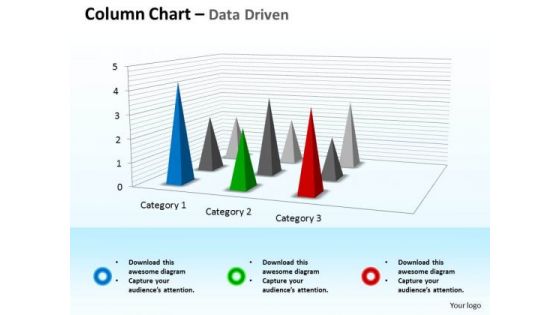
Microsoft Excel Data Analysis 3d Chart For Business Observation PowerPoint Templates
Double Up Our microsoft excel data analysis 3d chart for business observation Powerpoint Templates With Your Thoughts. They Will Make An Awesome Pair.
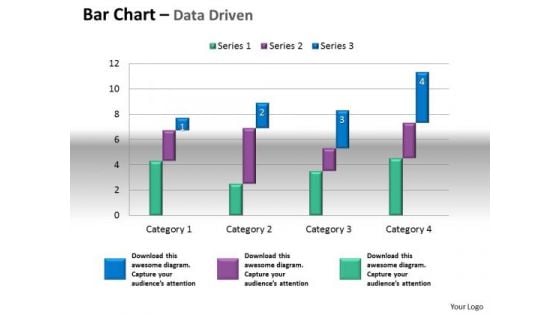
Microsoft Excel Data Analysis Bar Chart To Compare Quantities PowerPoint Templates
Our microsoft excel data analysis bar chart to compare quantities Powerpoint Templates Leave No One In Doubt. Provide A Certainty To Your Views.
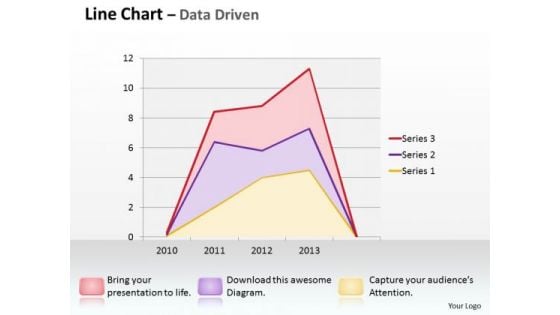
Multivariate Data Analysis Driven Line Chart Shows Revenue Trends PowerPoint Slides Templates
Good Camaraderie Is A Key To Teamwork. Our multivariate data analysis driven line chart shows revenue trends powerpoint slides Templates Can Be A Cementing Force.
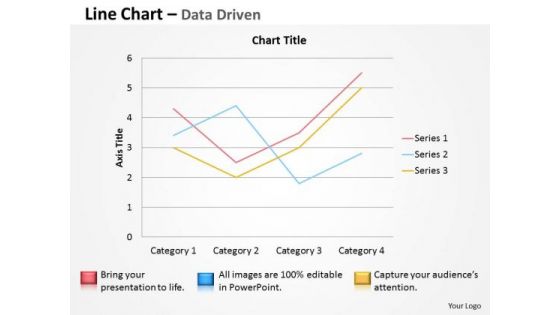
Multivariate Data Analysis Driven Line Chart To Demonstrate PowerPoint Slides Templates
Brace Yourself, Arm Your Thoughts. Prepare For The Hustle With Our multivariate data analysis driven line chart to demonstrate powerpoint slides Templates .
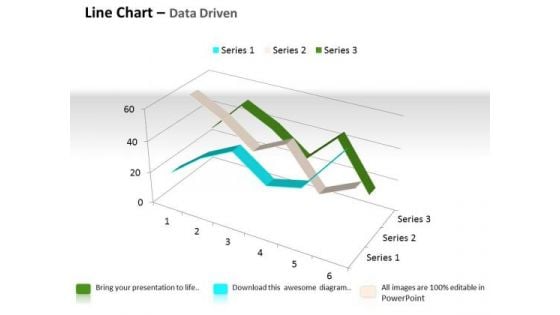
Quantitative Data Analysis 3d Line Chart For Comparison Of PowerPoint Templates
Touch Base With Our quantitative data analysis 3d line chart for comparison of Powerpoint Templates . Review Your Growth With Your Audience.

Quantitative Data Analysis 3d Pie Chart For Business Process PowerPoint Templates
Put Them On The Same Page With Our quantitative data analysis 3d pie chart for business process Powerpoint Templates . Your Team Will Sing From The Same Sheet.
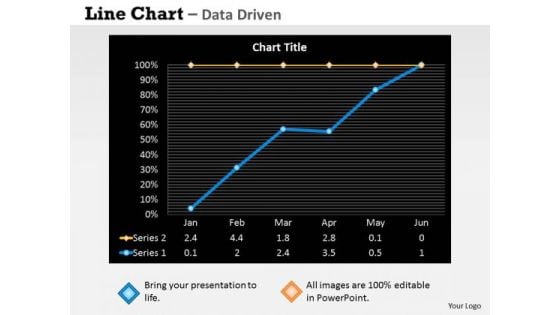
Quantitative Data Analysis Driven Economic Status Line Chart PowerPoint Slides Templates
Be The Dramatist With Our quantitative data analysis driven economic status line chart powerpoint slides Templates . Script Out The Play Of Words.
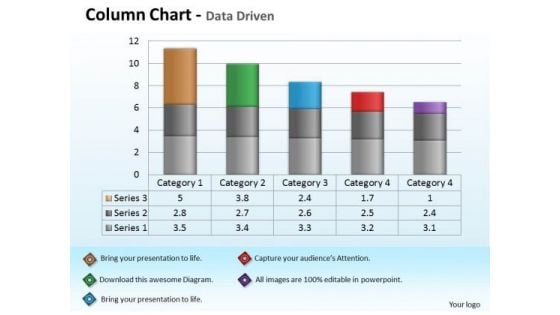
Quantitative Data Analysis Driven Economic With Column Chart PowerPoint Slides Templates
Add Some Dramatization To Your Thoughts. Our quantitative data analysis driven economic with column chart powerpoint slides Templates Make Useful Props.

Business Diagram Books Style Text Boxes Diagram PowerPoint Ppt Presentation
This slide displays books style text boxes. It contains graphics of books with words business, success, strategy and idea. Use this image to express views on business strategy and success. This image will enhance the quality of your presentations.
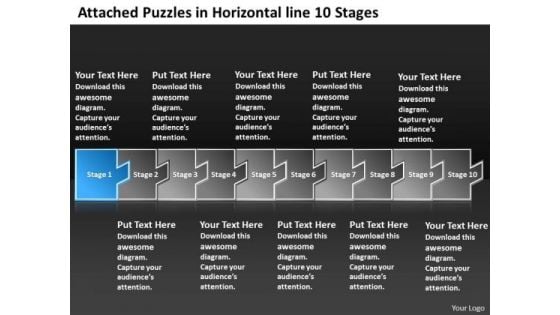
Puzzles In Horizontal Line 10 Stages Ppt Flowchart PowerPoint Freeware Templates
We present our puzzles in horizontal line 10 stages ppt flowchart PowerPoint freeware templates.Download and present our Success PowerPoint Templates because there is a crucial aspect that requires extra attention. Use our Business PowerPoint Templates because watch the excitement levels rise as they realise their worth. Use our Puzzles or Jigsaws PowerPoint Templates because you have had your share of being a goldfish in a small bowl.you are ready to launch out and spread your wings. Use our Shapes PowerPoint Templates because this shower your team with the wisdom of your words. Present our Boxes PowerPoint Templates because our presentation designs are for those on the go.Use these PowerPoint slides for presentations relating to Abstract, Arrow, Arrows, Business, Chart, Design, Development, Diagram, Direction, Element, Flow, Flowchart, Graph, Linear, Management, Model, Motion, Organization, Plan, Process, Program, Section, Segment, Set, Sign, Solution, Strategy, Symbol, Technology. The prominent colors used in the PowerPoint template are Blue, Gray, Black. People tell us our puzzles in horizontal line 10 stages ppt flowchart PowerPoint freeware templates will get their audience's attention. PowerPoint presentation experts tell us our Design PowerPoint templates and PPT Slides are Festive. Presenters tell us our puzzles in horizontal line 10 stages ppt flowchart PowerPoint freeware templates are Luxurious. The feedback we get is that our Development PowerPoint templates and PPT Slides are effectively colour coded to prioritise your plans They automatically highlight the sequence of events you desire. You can be sure our puzzles in horizontal line 10 stages ppt flowchart PowerPoint freeware templates are Wistful. Professionals tell us our Design PowerPoint templates and PPT Slides will make you look like a winner. Our Puzzles In Horizontal Line 10 Stages Ppt Flowchart PowerPoint Freeware Templates will keep the faith. They will show allegiance to your thoughts.


 Continue with Email

 Home
Home


